Article

Research on Grid-Connected Control Strategy of Photovoltaic (PV) Energy Storage Based on Constant Power Operation

Mechanical Engineering, College of Mechanical and Equipment Engineering, New Campus, Hebei University of Engineering, Handan 056038, China
*
Author to whom correspondence should be addressed.
Energies 2023, 16(24), 8056; https://doi.org/10.3390/en16248056
Submission received: 14 November 2023 / Revised: 9 December 2023 / Accepted: 11 December 2023 / Published: 14 December 2023
(This article belongs to the Section A2: Solar Energy and Photovoltaic Systems)

Abstract

:
In order to effectively mitigate the issue of frequent fluctuations in the output power of a PV system, this paper proposes a working mode for PV and energy storage battery integration. To address maximum power point tracking of PV cells, a fuzzy control-based tracking strategy is adopted. The principles and corresponding mathematical models are analyzed for the three-phase voltage PWM converter and bidirectional DC/DC converter, while feedforward decoupling double closed loop, constant power (PQ), and constant voltage charge/discharge control strategies are proposed. Space vector pulse width modulation (SVPWM) technology is utilized to generate power switching tube driver signals. Finally, a simulation model is developed in MATLAB/Simulink for system analysis. The results demonstrate that the proposed method enables constant grid-connected power generation and constant voltage charging of the energy storage battery when the PV cell’s power generation exceeds that of the grid. When insufficient solar power generation occurs, both the PV system and energy storage battery work together to achieve constant grid-connected power.

1. Introduction

In the current scenario of energy depletion and environmental contamination, renewable energy possesses the attributes of being inexhaustible and emission-free. Consequently, it has progressively emerged as the prospective trajectory for global development in all nations [1,2]. Among the various sources of renewable energy, solar energy has emerged as the primary focus of research. However, due to the influence of temperature and light, photovoltaic power generation is subject to randomness and intermittency, making it unable to achieve grid-connected conditions [3,4,5]. In order to ensure stable operation of the photovoltaic (PV) power generation system, the integration of energy storage batteries as auxiliary components in conjunction with PV has been implemented [6,7,8]. This collaborative effort facilitates the fine-tuning of both active and reactive powers in order to establish a connection with the grid [9,10,11,12].
The primary means of converting solar energy into electrical energy is through the use of photovoltaic cells. The efficiency of photovoltaic cells is significantly influenced by the implementation of maximum power point tracking (MPPT). At present, the primary techniques employed include perturbation and observation (P&O), incremental conductance (INC), and several enhanced algorithms [13,14,15,16,17]. Adopting a dependable maximum power point tracking (MPPT) control technique is of utmost importance in order to optimize the efficiency of photovoltaic (PV) systems [18]. In the literature [19], a novel maximum power point tracking (MPPT) algorithm is presented that utilizes sine and cosine optimization. This algorithm demonstrates insensitivity to partial shading, array faults, and distribution line interference. The text discusses the problem of multiple maximum power points that arise in partial shading conditions and emphasizes the importance of tracking the actual maximum power point to ensure various advantages. In the study conducted by the authors in reference [20], they propose an adaptive neural network (ANN) algorithm. A novel back propagation algorithm is employed to train two distinct neural networks. The neural controller is employed to generate the duty cycle signal for the DC chopper. The utilization of the neural identifier involves the dynamic modeling of the photovoltaic system and the adaptive adjustment of the parameters of the neural controller. Compared to the conventional approach, this method exhibits superior tracking speed, enhanced accuracy, and increased robustness.
To address the issue of integrating energy storage systems and photovoltaic systems in order to mitigate the output fluctuations of the latter, the crucial aspect is the design of a three-phase voltage pulse width modulation (PWM) converter, a bidirectional DC/DC converter, and an appropriate control strategy [21,22,23,24]. The T-type three-level converter, as proposed in the literature [25], employs a PID control strategy to maintain a constant shoot-through duty cycle. This approach aims to achieve the highest possible modulation index, thereby reducing the ripple in the inductor current and attaining the benefits of high energy conversion efficiency. However, the utilization of additional switching power tubes is necessary due to the control parameter being the duty cycle of the two extra switches, resulting in a more complex control system. In the study conducted by the authors in [26], they propose a three-port high-gain non-isolated DC/DC converter specifically designed for photovoltaic applications. This converter consists of two unidirectional ports and one bidirectional port. The battery is integrated into the bidirectional port, allowing for energy storage through the use of a bidirectional boost converter. A control algorithm with multiple objectives is developed to facilitate the selection of battery management, power flow direction, operation mode, and duty cycle. This method offers the benefits of high voltage gain and the ability to convert the control mode based on the direction of power flow. In the study by [27], the photovoltaic system is reported to employ PI control. In the scenario where an energy storage system is connected in a multi-level parallel configuration, the utilization of the virtual synchronous generator algorithm is employed. The droop control is implemented by adjusting the angular velocity and active power, enabling it to contribute to the initial frequency modulation of the power grid. Subsequently, it is further regulated through reactive power and voltage. The implementation of droop control is essential for contributing to the voltage regulation of the power grid, thereby achieving the benefits of increased power efficiency and reduced harmonic output. In the study conducted by the authors in [28], a novel hybrid energy storage scheme combining battery and capacitor technologies is proposed as an effective solution for energy storage systems. The utilization of a fuzzy logic controller facilitates the regulation of power compensation within the system. Consequently, the state of charge level of the energy storage system can be effectively maintained within a safe range. This approach enhances the system’s robustness and maximizes energy storage capabilities. Upon conducting a comprehensive analysis and synthesis of the aforementioned relevant research, it is evident that there is a dearth of studies pertaining to the control of the overall system of photovoltaic energy storage in the current stage of research. This paper focuses on the analysis of the entire system, enhancing the maximum power tracking control strategy for photovoltaic cells. Additionally, it involves the design and adjustment of control parameters for both the photovoltaic system and the energy storage system, with the aim of achieving the research objectives. However, this paper merely confirms the coordination of each control strategy for photovoltaic energy storage without delving into the issue of output waveform harmonic quantity. This topic warrants further investigation.
Aiming to investigate the control strategy for photovoltaic energy storage based on constant power grid connection, this research makes the following main contributions:
  • A method based on fuzzy control is presented for addressing the maximum power tracking problem in photovoltaic power generation;
  • A solution is presented to address the issue of significant fluctuations in photovoltaic power generation, involving the implementation of an energy storage system that utilizes a double closed-loop control strategy and PQ control;
  • A control strategy is proposed for the energy storage battery, aiming to maintain constant voltage control during charge and discharge processes;
  • Through the implementation of diverse control strategies, a comprehensive system is established to ensure consistent power operation across different conditions.
This comprehensive scheme is thoroughly elucidated in the subsequent chapters. Firstly, Section 2 introduces the MPPT control strategy based on fuzzy control. In Section 3, the mathematical modeling and analysis of a three-phase voltage source PWM converter and a bidirectional DC/DC converter are conducted. In Section 4, the formulation of the voltage and current feedforward decoupling double closed-loop control strategy and the PQ constant power control strategy is presented for the three-phase voltage-type PWM converter. By adjusting the PI parameters, the PV system and the energy storage battery can collaborate to achieve constant power grid connection through PQ control, even when the PV output power does not match the grid power. The control strategy of constant voltage charging and discharging can significantly enhance the charging efficiency of the energy storage battery in a bidirectional DC/DC converter. Finally, Section 5 of this study constructs a simulation model using MATLAB/Simulink 2018b) in order to validate the viability of the suggested control strategy. Section 6 of this article examines the limitations of the study and provides insights into future directions for further development. Subsequently, Section 7 provides a comprehensive summary of this entire article.

2. PV Maximum Power Point Tracking Principle and Control Strategies

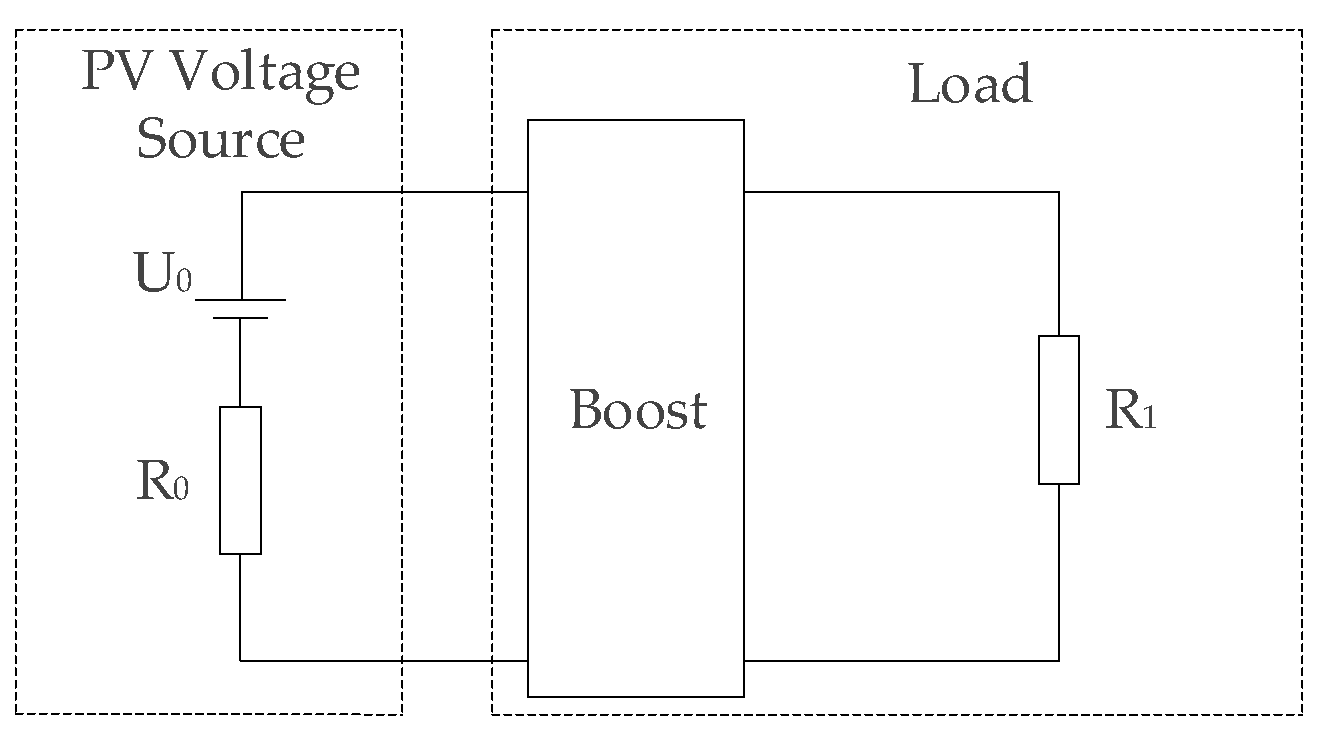
2.1. PV MPPT Principle

PV cells facilitate the generation of electron–hole pairs by utilizing the photoelectric effect at the P-N junctions of semiconductors. This process enables the conversion of solar energy into electrical energy. The output characteristic curve exhibits a unimodal function, with the extreme value representing the maximum power point. Therefore, it is crucial to dynamically regulate the operating point of the PV system in accordance with the control method in order to consistently maintain it at the maximum power point [29,30].
By utilizing the infinitesimal approach, the PV cell is considered as a linear system within a brief time interval. As illustrated in Figure 1, the circuit represents the impedance matching of the PV source load. U0 denotes the PV voltage source, while R0 represents the internal resistance of the PV cell. Additionally, R1 refers to the load impedance.
The power P of the load resistance is as follows:
P = U 0 R 0 + R 1 2 R 1
The derivation of R1 can then be obtained:
d P d R 1 = U 0 2 R 0 R 1 R 0 + R 1 3
When the values of R0 and R1 are equal, the derivative of power with respect to R1 (dP/dR1) equals zero. This signifies that the power output (P) reaches its maximum value (Pmax), indicating that the load resistance (R1) is optimized for achieving the highest power output. In essence, the maximum power point tracking (MPPT) process of a PV cell entails the alignment of the output impedance with the load impedance.

2.2. MPPT Control Strategy Based on Fuzzy Control

Fuzzy control, an innovative control methodology that combines fuzzy system theory with automatic control technology, is particularly suitable for addressing the challenges posed by nonlinear systems, including PV systems [31]. The primary procedure is depicted in Figure 2. The fundamental aspect of this process relies on fuzzy rules, which are primarily formulated based on the characteristics of the system model [32].
When designing the fuzzy controller, the output current and voltage of the PV cell are sampled in order to calculate the deviation, e, and the deviation change rate, Δe, using Equation (3). The resulting output variable is then obtained as the correction value, dU, for the operating point voltage. Here, P(k) and I(k) represent the kth sample of the PV cell’s output power and output current, respectively. When e(k) = 0, it signifies that the PV cell is operating at its maximum power point.
e k = P k P k 1 I k I k 1 Δ e k = e k e k 1
Combined with the analysis of Figure 3 and PV P-U characteristic curve, the MPPT logic adheres to the following rules:
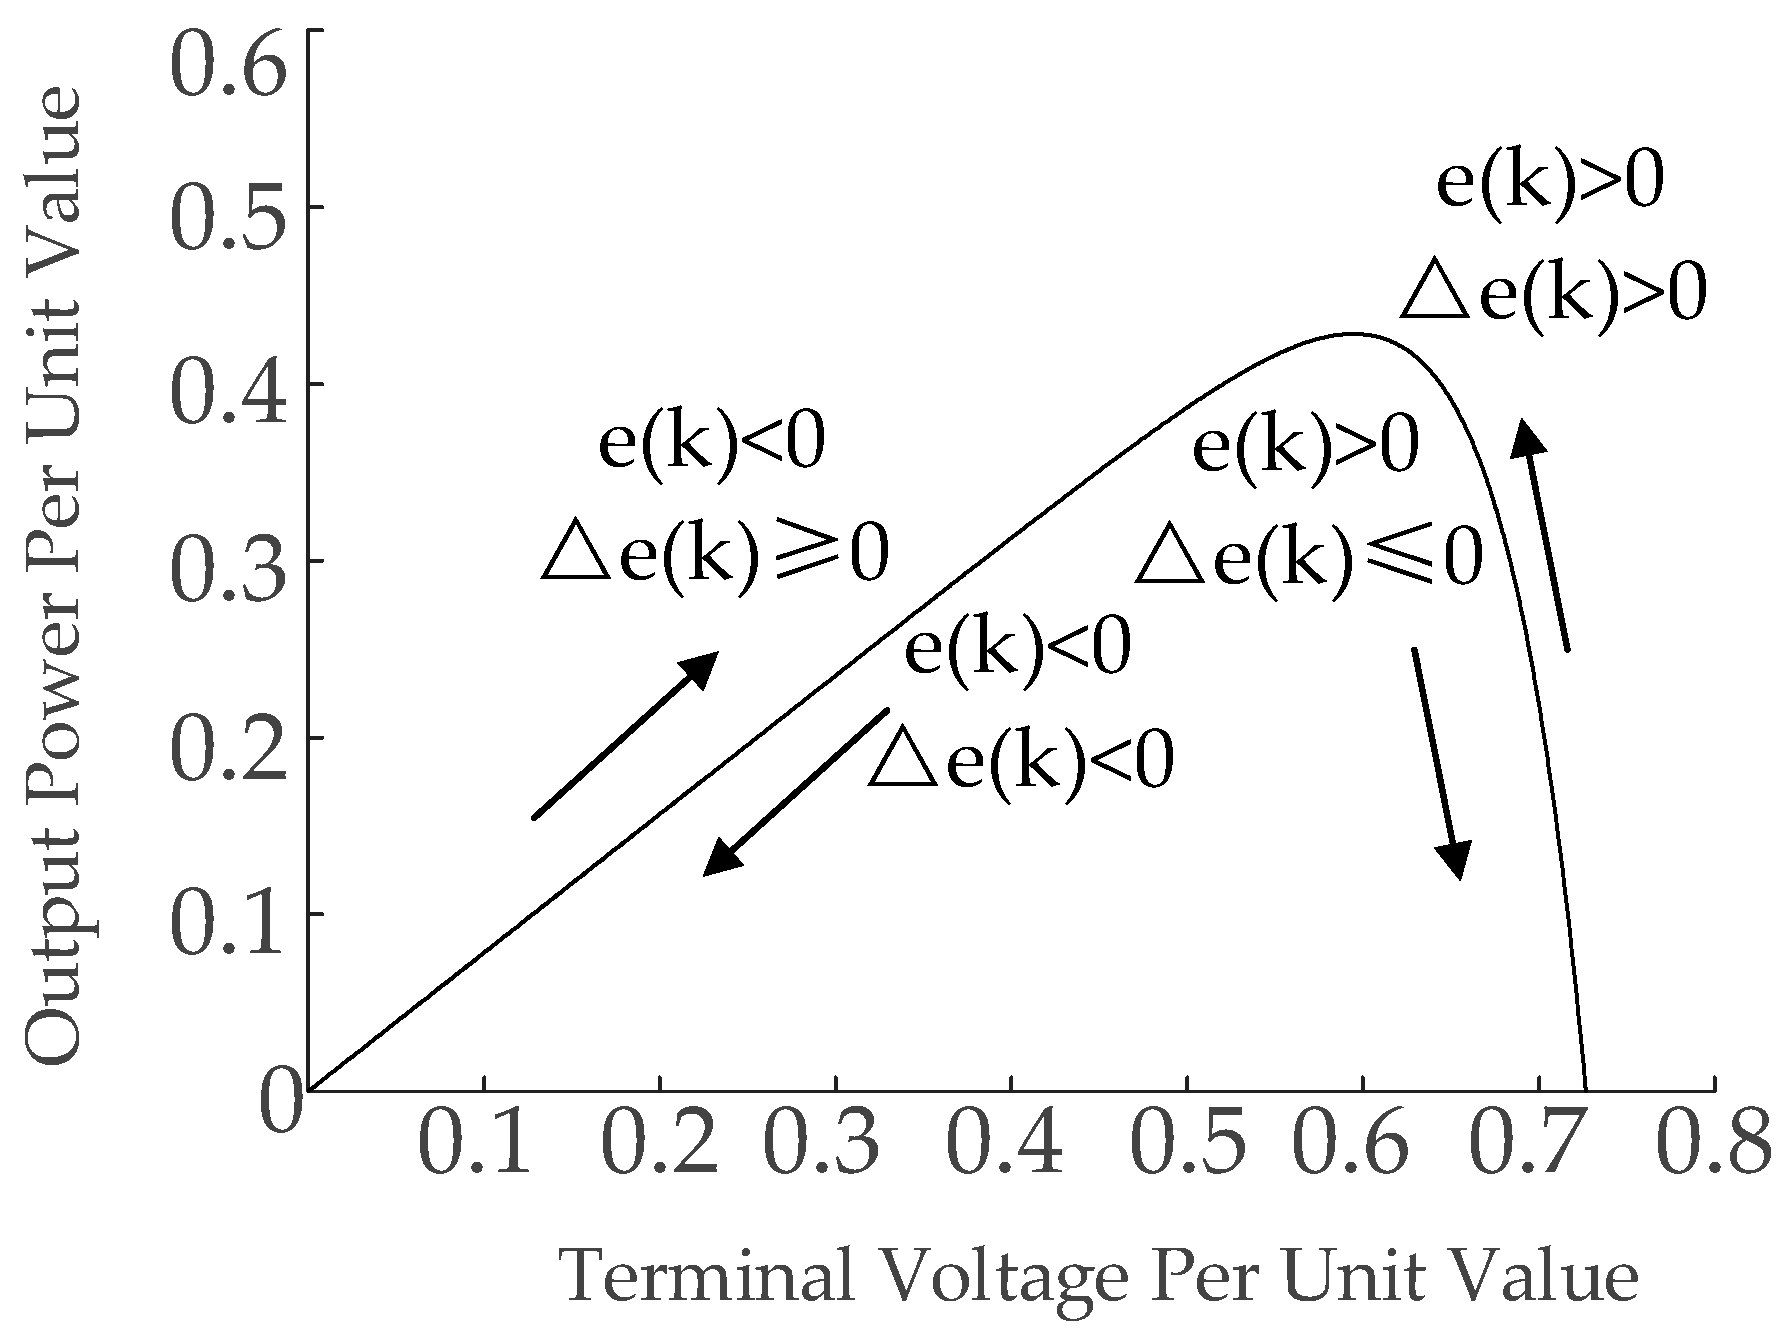
  • When e(k) < 0 and ∆e(k) ≥ 0, P approaches the maximum power point from the left side. dU should be positive to ensure proximity to the maximum power point;
  • When e(k) < 0 and ∆e(k) < 0, P deviates from the left side of the maximum power point. dU should be positive to maintain proximity to the maximum power point;
  • When e(k) > 0 and ∆e(k) ≤ 0, P moves towards the maximum power point from the right side. In this case, dU should be negative for closer alignment with the maximum power point;
  • When e(k) > 0 and ∆e(k) > 0, P deviates from the right side of the maximum work rate point. Then, dU should be negative for better approximation to the maximum power point.
The Mamdani fuzzy controller is implemented in MATLAB, and the linguistic fuzzy definition of e, ∆e, and output, dU, is performed. In order to minimize the frequency of the fuzzy control adjustments, the linguistic variables {NB, NS, Z, PS, PB} are chosen. The input error, e, the error change rate, ∆e, and the output universe are defined within the range of [–6, 6]; this range consists of 13 levels, specifically {−6, −5, −4, −3, −2, −2, −1, 0, 1, 2, 3, 4, 5, 6}. The selection of the membership function is guided by several principles. Firstly, the function should be positioned close to the origin, with a large slope value and higher resolution. Conversely, when the function is located further away from the origin, it should have a lower slope and lower resolution. The trapmf function represents a trapezoidal membership function, characterized by four parameters that define the shape of its curve. These parameters correspond to two inflection points at the lower part of the trapezoid and two inflection points at the upper part of the trapezoid. The trimf function represents a triangle membership function, where the shape of its curve is defined by three parameters that correspond to the three vertices of the triangle. Both of these functions satisfy the conditions where the slope near the origin is large, while the slope far from the origin is small.
Therefore, the trapmf function is chosen to represent the negative large (NB) and positive large (PB), and the trimf function is selected to represent the negative small (NS), zero (Z), and positive small (PS), as depicted in Figure 4.
When there is a change in the external environment, if both e and ∆e are NB, the slope of the connection line of the sampling point is negative. Moreover, if the absolute value is larger, it indicates that the working point is significantly distant from the left side of the maximum power point. At present, the output variable, dU, is PB, and thus a larger step size is implemented. If both e and ∆e are NS, it indicates that the working point is in close proximity to left side of the maximum power point. At present, the output variable, dU, is PS, and thus a reduced step length is employed to facilitate the adjustment of the step size. This enables the system to promptly track the maximum power point. By employing an analogy, the fuzzy rules are developed by incorporating the output characteristics of the PV cell in conjunction with the blurred input variables e and, as illustrated in Table 1.
Inputting rules into a Mamdani-type fuzzy controller enables the display of the observation chart depicting the fuzzy rule surface, as illustrated in Figure 5.
After undergoing processing through the fuzzy rules, the resulting data are in the form of fuzzy quantities, which necessitate further processing through anti-fuzzy clarity. In this study, the area center of gravity method is employed for data processing. The calculation Formula (4) is used to determine the central value, Ui, of the digital interval that corresponds to the linguistic variable in the membership function. The weight of Ui is denoted as μ(Ui).
d U = i = 1 n μ U i U i i = 1 n μ U i

3. Mathematical Model Establishment of A PV Energy Storage System

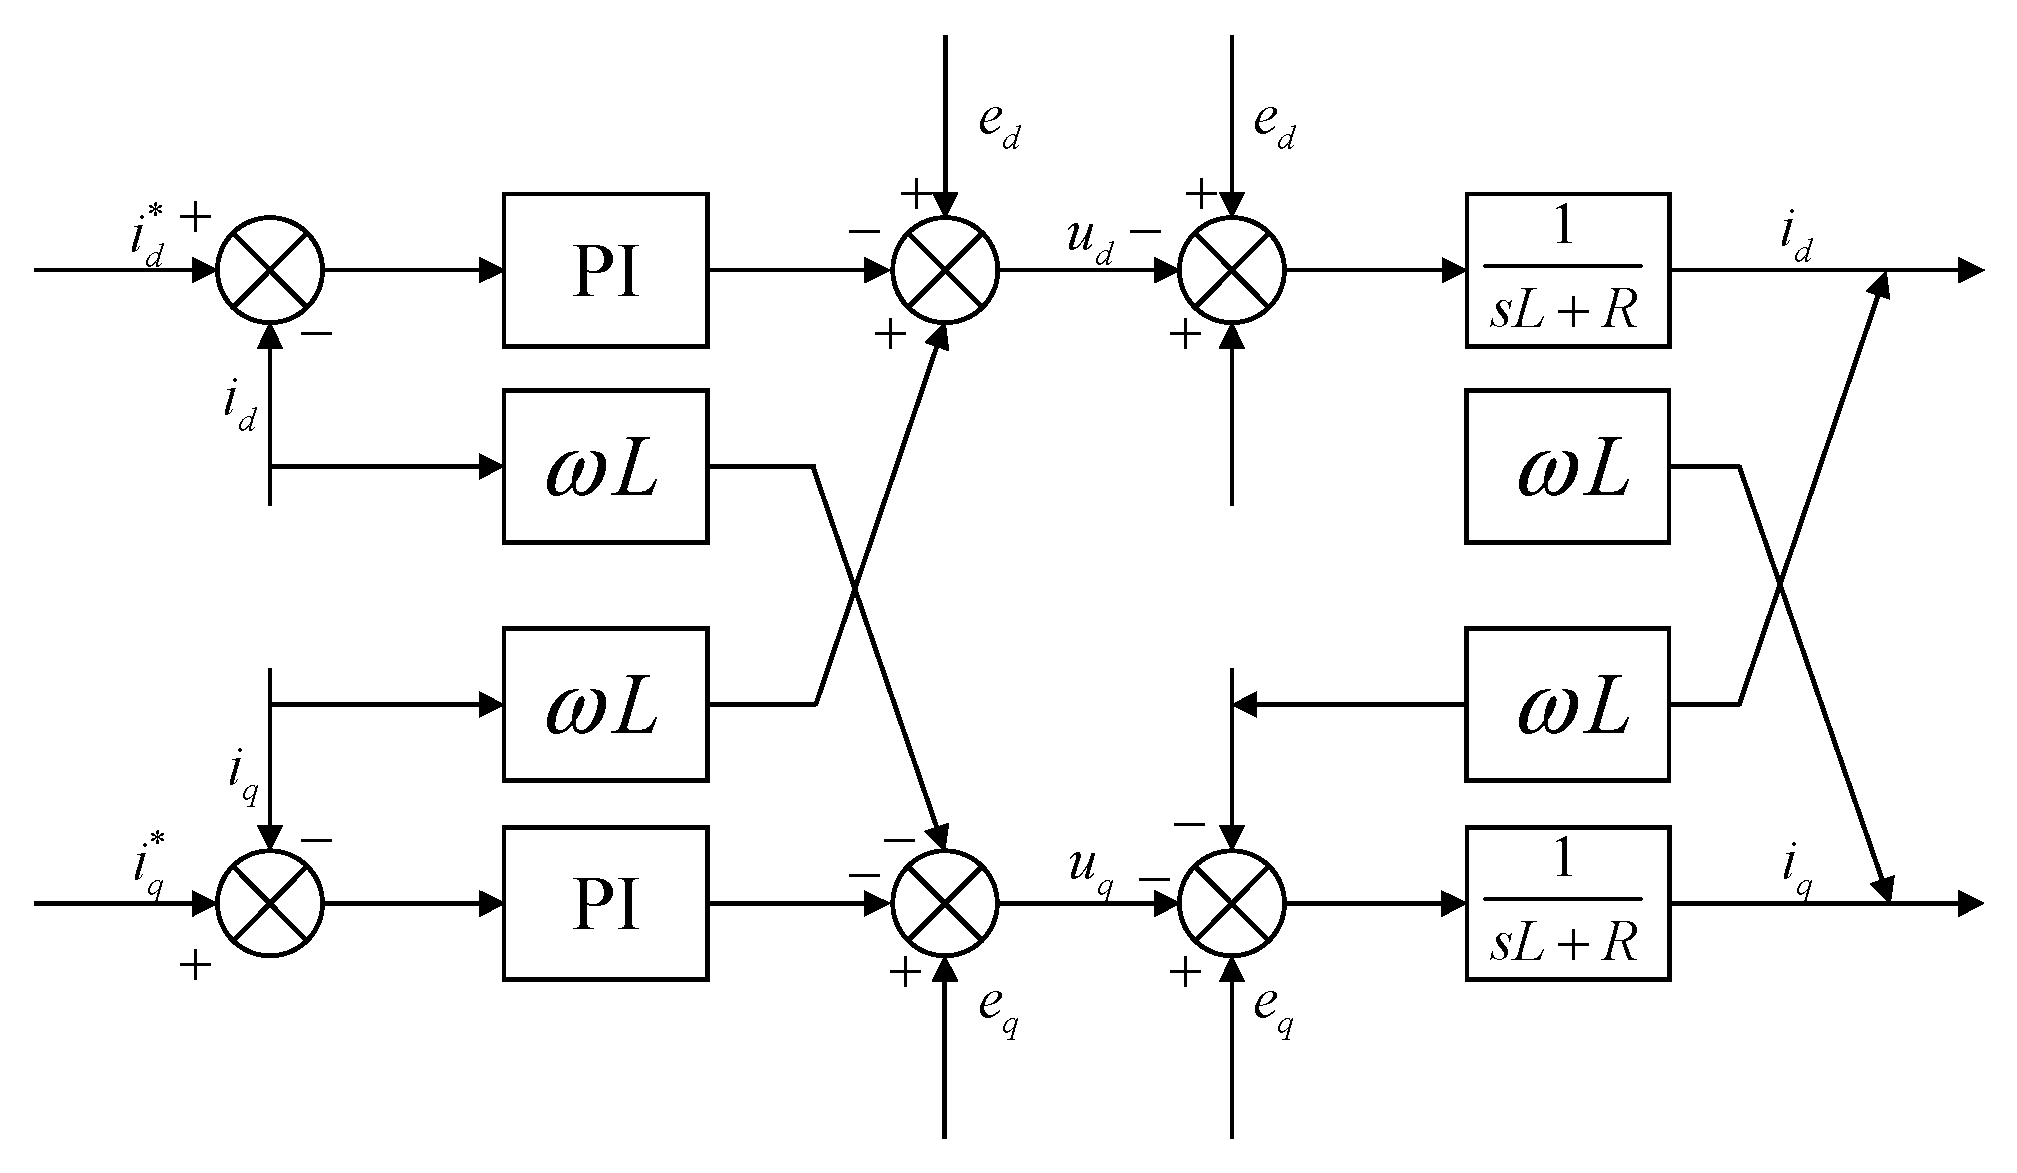
3.1. Mathematical Modeling of the Three-Phase Voltage-Type PWM Converter

The three-phase voltage source PWM converter consists of six power switches. The AC side utilizes a three-phase symmetrical connection configuration. The entire system exhibits a high degree of coupling and nonlinearity. The six power switches employ the upper and lower half-bridge complementary operating states [33]. The switching signals of the success rate switch V1~V6 is generated through the utilization of SVPWM technology.
The primary circuit configuration of the PV energy storage system Is depicted in Figure 6. In the diagram, V1~V6 are the power switch tubes of the PWM converter in the photovoltaic system; V15 is the power switch tube of Boost after photovoltaic cell power generation; Udc is the DC bus voltage in the photovoltaic system; V7~V12 are the PWM converter power switches used in the energy storage system; and V13 and V14 are the Buck–Boost power switches for the energy storage battery circuit. Furthermore, the DC bus voltage in the energy system is denoted as Udc*. L, R, L2 and R2 are the filter inductance and parasitic resistance within the circuit, respectively.
According to Figure 6, the mathematical model of the three-phase circuit in stationary coordinates is derived based on Kirchhoff’s law:
L d d t i a i b i c = e a e b e c R i a i b i c u a u b u c
In the given formula, the variables ia, ib, and ic represent the current in phases a, b, and c of the grid, respectively. Similarly, the variables ea, eb, and ec denote the voltage in phases a, b, and c, respectively. Furthermore, ua, ub, and uc represent the voltages between the input of the converter and the neutral point, N, in phases a, b, and c, respectively. L represents the inductance of the filter on the grid side, while R denotes the equivalent resistance.
Under the three-phase stationary coordinate system, the variables on the AC side undergo real-time changes, resulting in interdependence among the variables. This interdependence poses challenges for the design of the system controller. In order to address this issue, the transformation of three-phase stationary coordinates into two-phase stationary coordinates, α-β, is carried out using Clark transformation, and then the two-phase stationary coordinates are further transformed into two synchronous rotational coordinates, d-q, using Park transformation. This transformation enables the conversion of the fundamental wave components into DC components.
The relationship between the α-β two-phase stationary coordinates is derived through Clark transformation in the three-phase stationary coordinates:
x α x β = 2 3 1 1 2 1 2 0 3 2 3 2 x a x b x c
where xα and xβ denote the corresponding physical quantities under α-β; xa, xb, and xc are the physical quantities of abc in stationary coordinates. The mathematical model under α-β can be obtained by combining (6) and (7):
L d d t i α i β = e α e β R i α i β u α u β
where iα and iβ are the components of the grid-side current α-β axis; eα and eβ are the components of the grid-side voltage α-β axis; and uα and uβ are the components of the converter AC side voltage α-β axis. After Park transformation in the two stationary coordinates, α-β, a relational equation can be used to obtain two same-step rotational coordinates, d-q, which is a follows:
x d x q = c o s ω t s i n ω t s i n ω t c o s ω t x α x β
where xd and xq denote the corresponding physical quantities under d-q; ω is the angular velocity of rotation of the d-q axis; and t is time. The mathematical model under the d-q axis can be obtained by combining Equations (8) and (9):
L d d t i d i q = e d e q R i d i q u d u q + ω L i q i d
In the above formula, id and iq are the components of the d and q axes of the grid-side current, respectively; ed and eq are the components of the d and q axes of the grid-side voltage, respectively; and ud and uq are the variables, respectively.

3.2. Mathematical Modeling of Bidirectional DC/DC Converter

The bidirectional DC/DC converter adopts the Buck/Boost circuit. The sinusoidal pulse width modulation signal acts on the power switches V13 and V14, so that the two power transistors are complementary to each other, so as to achieve boost and buck and the purpose of charging and discharging the energy storage batteries. When the bidirectional Buck/Boost converter works in the battery discharge mode, when it is in the Boost mode, V13 is turned off and D14 is turned on. Based on the idea of time-division linear circuit, and according to Kirchhoff’s law,
L 1 d i 1 d t + r d i 1 + E b a t = 0
where i1 is the discharge current; Ebat is the electromotive force of the battery; rd is the equivalent resistance of the battery; and L1 is the DC side inductance.
According to Equation (10), it can be solved by the three-element method. When the V14 is cut off, i1 reaches the maximum current value I20.
i 1 = I 10 e t τ + E b a t r d 1 e t τ I 20 = I 10 e t o n τ + E b a t r d 1 e t o n τ
In the above formula, τ = L/R is the time constant; I10 is the initial value of the current when D14 is on; and turn-on time of the switch tube.
When V14 is off, D13 conducts freewheeling current. At this time, the initial value is the maximum current I20, and L1 stores energy. According to Kirchhoff’s law,
L 1 d i 1 d t + r d i 1 + E b a t = U d c
In the above formula, Udc* is the DC bus voltage in the energy storage system. According to Equation (12), i1 can be solved by the three-element method. When D13 is cut off, i1 is equal to the initial current value I10 when V14 is on.
i 1 = I 20 e t o f f τ + U d c E b a t r d 1 e t o f f τ I 10 = I 20 e t o f f τ + U d c E b a t r d 1 e t o f f τ
where toff is the cut-off time of the switching tube. Combining (11) and (13), the following formula can be obtained:
U d c = t o n + t o f f t o f f E b a t = T t o f f E b a t = 1 1 α E b a t
That is, T/toff ≥ 1; this is the time for the boost working state, and the battery is discharged.
Since the principle of battery-charging Buck circuit is the same as that of the discharging Boost circuit, the principle of the above steps is calculated.
U d c = t o n t o n + t o f f E b a t = t o n T E b a t = α E b a t
That is, T/t < 1; this is the step-down working state, and the battery is charged.

3.3. Control Strategy of the Three-Phase Voltage Source PWM Converter

During the normal operation of the system, a total of three power units are generated: the output power of the PV system, Ppv; the output power of the energy storage battery, Pbat; and the grid power, Pload. The relationship between the three is expressed as follows:
P p v + P b a t P l o a d = 0
Since the PV system is the original output, its power is in a positive state. For the energy storage battery, it is positive in the discharge state and negative in the charging state. According to the relationship between the three, the working state of the energy storage battery can be judged:
  • When Ppv > Pload, then Pbat < 0, Ppv = Pload + Pbat. The energy storage battery is in a state of charge, through rectification and depressurization, and SOC increases;
  • When Ppv < Pload, then Pbat > 0, Ppv + Pbat = Pload. The storage battery is in the discharge state, through inverter and boost, and SOC decreases;
  • When Ppv = Pload, then Pbat = 0. No energy flow occurs, and the battery SOC remains constant.

4. Research on Grid-Connected Control Strategy of PV Energy Storage

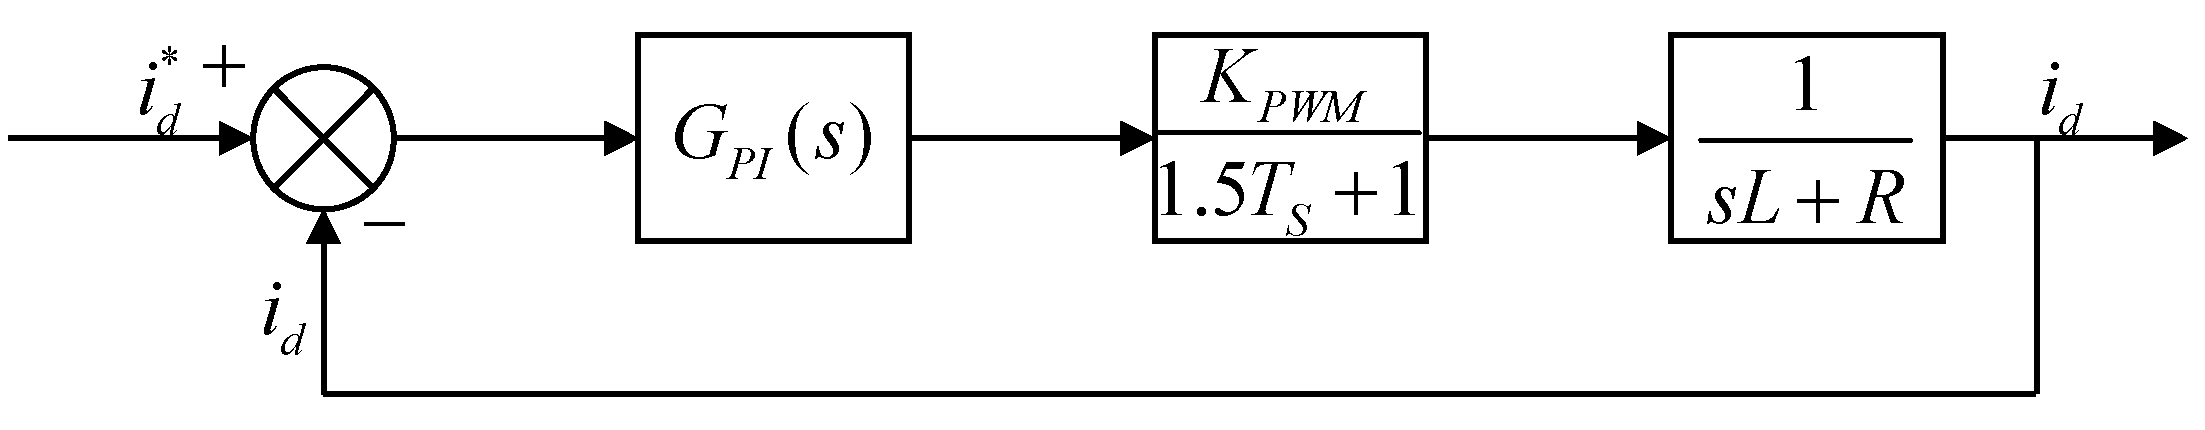
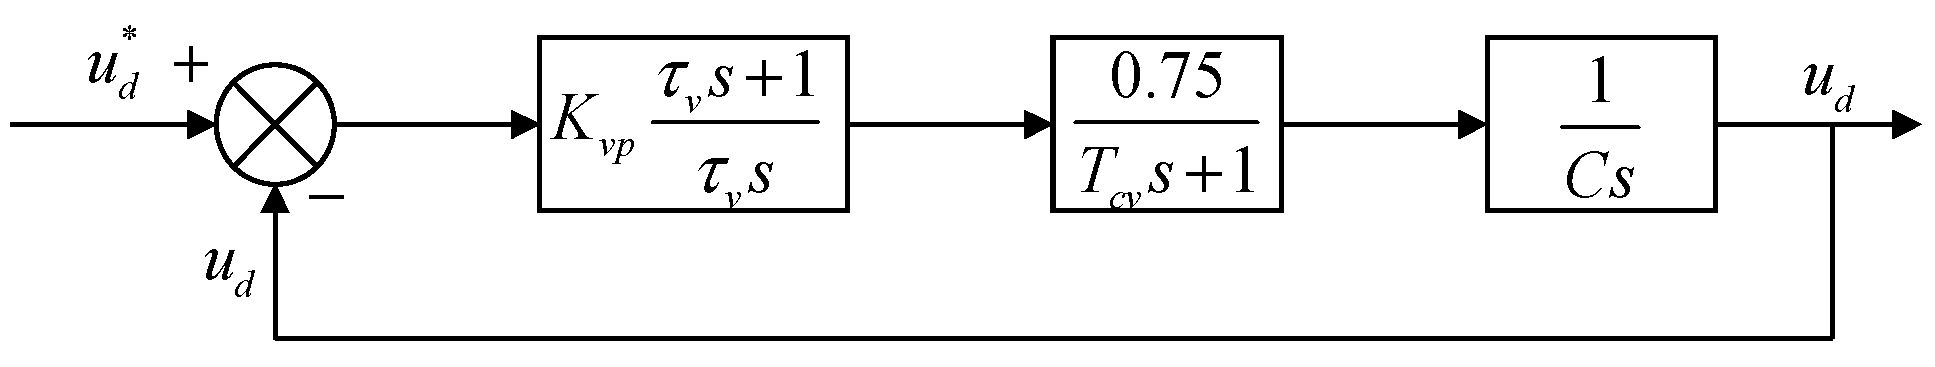
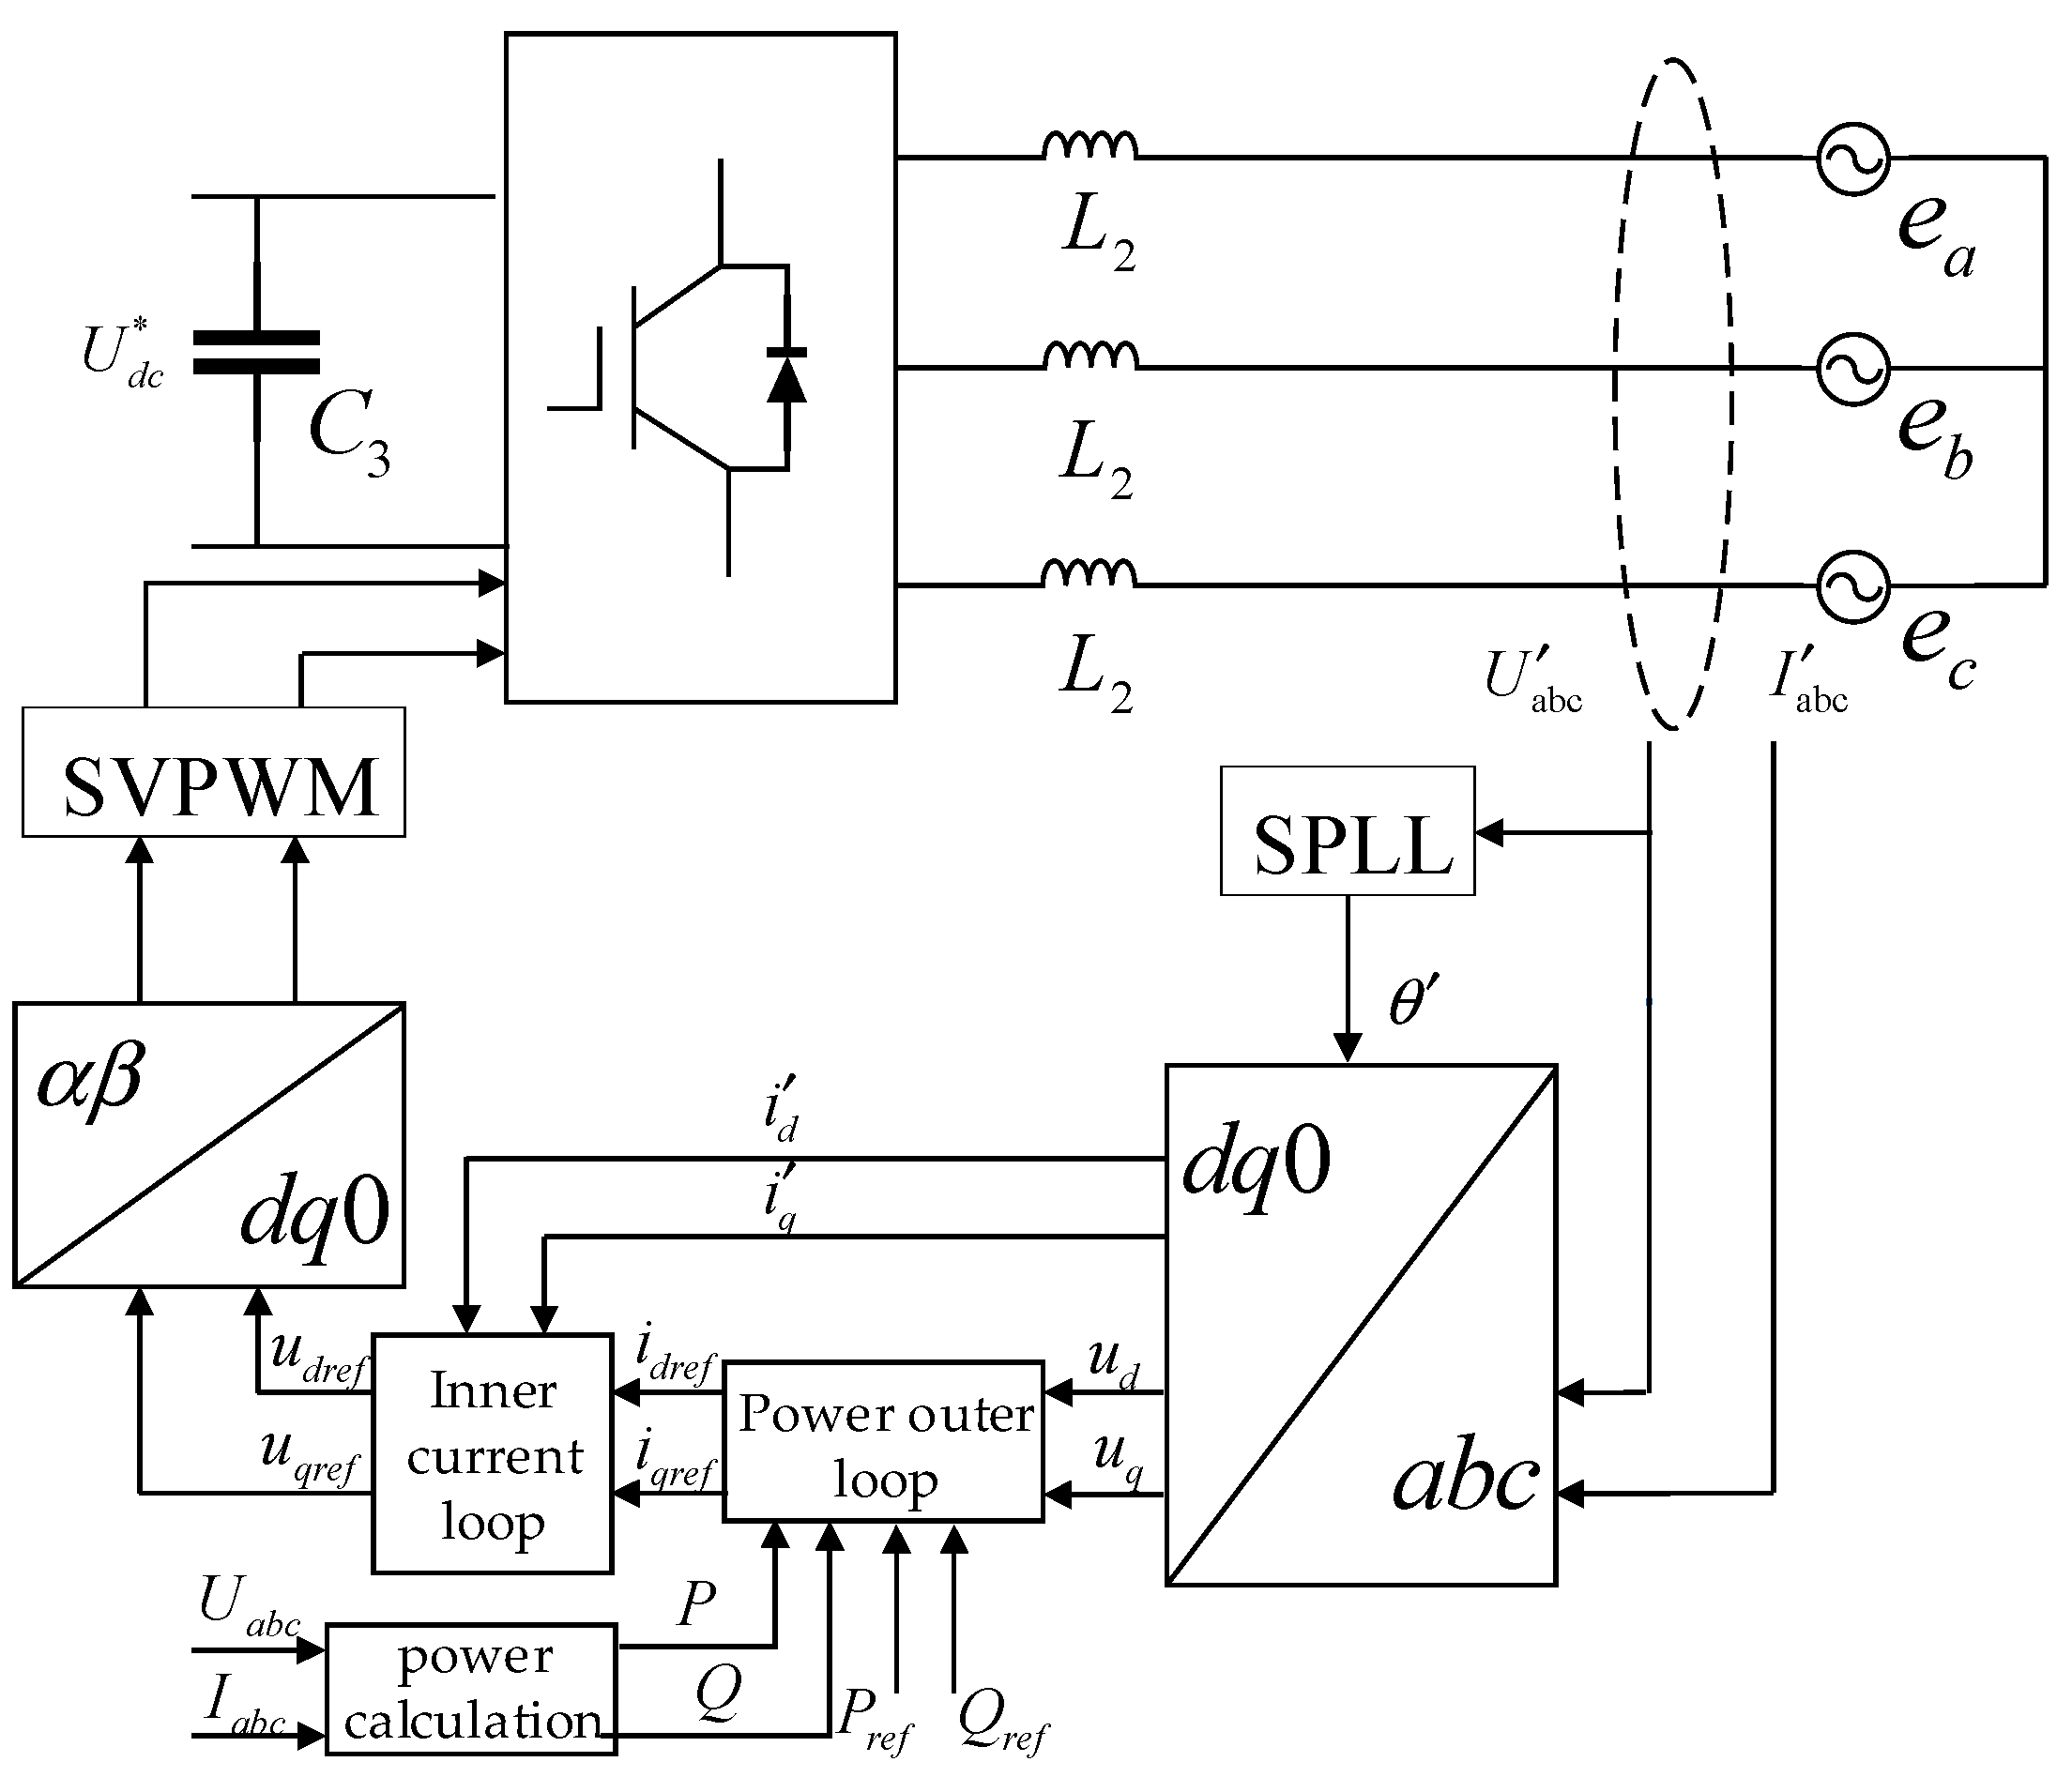
4.1. Control Strategy of the Three-Phase Voltage Source PWM Converter

In the PV system, the three-phase voltage source PWM converter utilizes a double closed-loop control method for both voltage and current. The input of the inner loop control is determined by the output of the voltage outer loop. The utilization of the single synchronous coordinate system software phase-locked loop (SPLL) technology ensures that the input remains in the same frequency and phase as the grid. Subsequently, the space vector pulse width modulation (SVPWM) technique is employed to transmit the pulse signal to the six power switches, as depicted in Figure 7.
According to the analysis of the d-q axis mathematical model (9) of the two-phase synchronous rotating coordinates, there is a coupling between the d and q axes. In order to achieve decoupling control, a current loop control strategy based on feedforward decoupling is usually adopted. The current controller is designed by PI regulator, and the current differential term in Equation (9) can be obtained by PI regulator operation:
u d = K i P + K i I s i d i d + ω L i q + e d u q = K i P + K i I s i q i q ω L i d + e q
In the above formula, KiP and KiI are the proportional regulation gain andint egral regulation gain of the current inner loop, and id* and iq* are the current reference values of the d and q axes, respectively; and s is the complex frequency. Substituting (17) into (9), we can obtain the following:
L d i d d t = K i P + K i I s i d i d L d i q d t = K i P + K i I s i q i q
It can be gathered from Equation (18) that the axial coupling amount of current control is eliminated. It can be seen that the feedforward compensation can realize the decoupling control of the current loop of the grid-connected inverter. The current loop control block diagram of the grid voltage feedforward decoupling is shown in Figure 8, where id* and iq* are control active power and reactive power, respectively; the system operates with a unit power factor, so that iq* = 0.
From the above analysis, it can be seen that the function of the current inner loop is to improve the dynamic response capability of the converter, thus suppressing voltage fluctuation after decoupling the d-axis. The block diagram of the d-axis current loop control after decoupling is shown in Figure 9.
In the above figure, KPWM is the equivalent gain of the inverter; Ts is the switching period of the converter; 1/1.5Ts + 1 is the sampling signal delay; GPI(s) is the transfer function of PI regulator; and τi = KiP/KiI = L/R is the time constant. Then, the transfer function of GPI(s) is obtained as follows:
G P I s = K i P τ i + 1 τ i + s
Then, the open-loop function of the system can be obtained as follows:
G s = K i P τ i + 1 τ i + s K P W M 1.5 T S + 1 1 s L + R
Since the current inner loop has a high requirement for current tracking, the current loop is designed according to the type I system. According to its criterion, the current closed-loop transfer function P(s) is as follows:
P s = G s G s + 1 = 1 1.5 L T s K i P K P W M s 2 + L K i P K P W M s + 1
According to the parameter setting relationship of type I system, when the damping ratio is ξ = 0.707, we can obtain the following:
1.5 T s K i P K P W M R τ i = 1 2
The PI regulator parameters of the current loop are solved as follows:
K i P = R τ i 3 T s K P W M K i I = K i P τ i = R 3 T s K P W M
After calculation and setting, KiP = 5 and KiI = 300.
The voltage feedback loop can ensure that the output voltage is a stable value, and the output is the input of the current loop. The voltage loop has strong anti-interference according to the type II system design, and its simplified control block diagram is shown in Figure 10.
In Figure 10, τv is the small inertia time constant of the voltage outer loop sampling; C is the DC side capacitor; KvP and KvI are proportional regulation gain and integral regulation gain of voltage inner loop; and P(s) = 1/(1 + 3Tss) is the equivalent transfer function of the current inner loop. There is a time-varying link in the voltage outer loop control, namely 0.75mcosα, which brings difficulties to the design of the voltage loop. In order to solve this problem, the method of maximum proportional gain value can be used. Since 0.75mcosα ≤ 0.75 (m ≤ 1), 0.75 is selected to replace this link. In order to simplify the control structure, the voltage outer loop time constant, tv, is combined with the current inner loop equivalent time constant, 3Ts, that is, Tcv = τv + 3Ts.
The open-loop transfer function of the voltage outer loop is as follows:
G V s = K v P τ v s + 1 τ v s 1 T c v s + 1 1 C s = 0.75 K v P τ v s + 1 C τ v s 2 T c v s + 1
The intermediate bandwidth of the voltage ring is thus obtained:
h v = τ v T c v
From the typical type II system controller parameter tuning relationship, the following can be obtained:
0.75 K v P C τ v = h v + 1 2 h v 2 T c v 2
In general, the middle frequency width, hv is taken as 5, and hv = 5 is substituted into τv = 5Tcv, and then the PI regulator parameters of the voltage loop are obtained as follows:
K v P = 4 C 5 τ v + 3 T S K v I = K v P τ v = 4 C 25 τ v + 3 T S 2
After calculation and setting, KvP = 5 and KvI = 300.

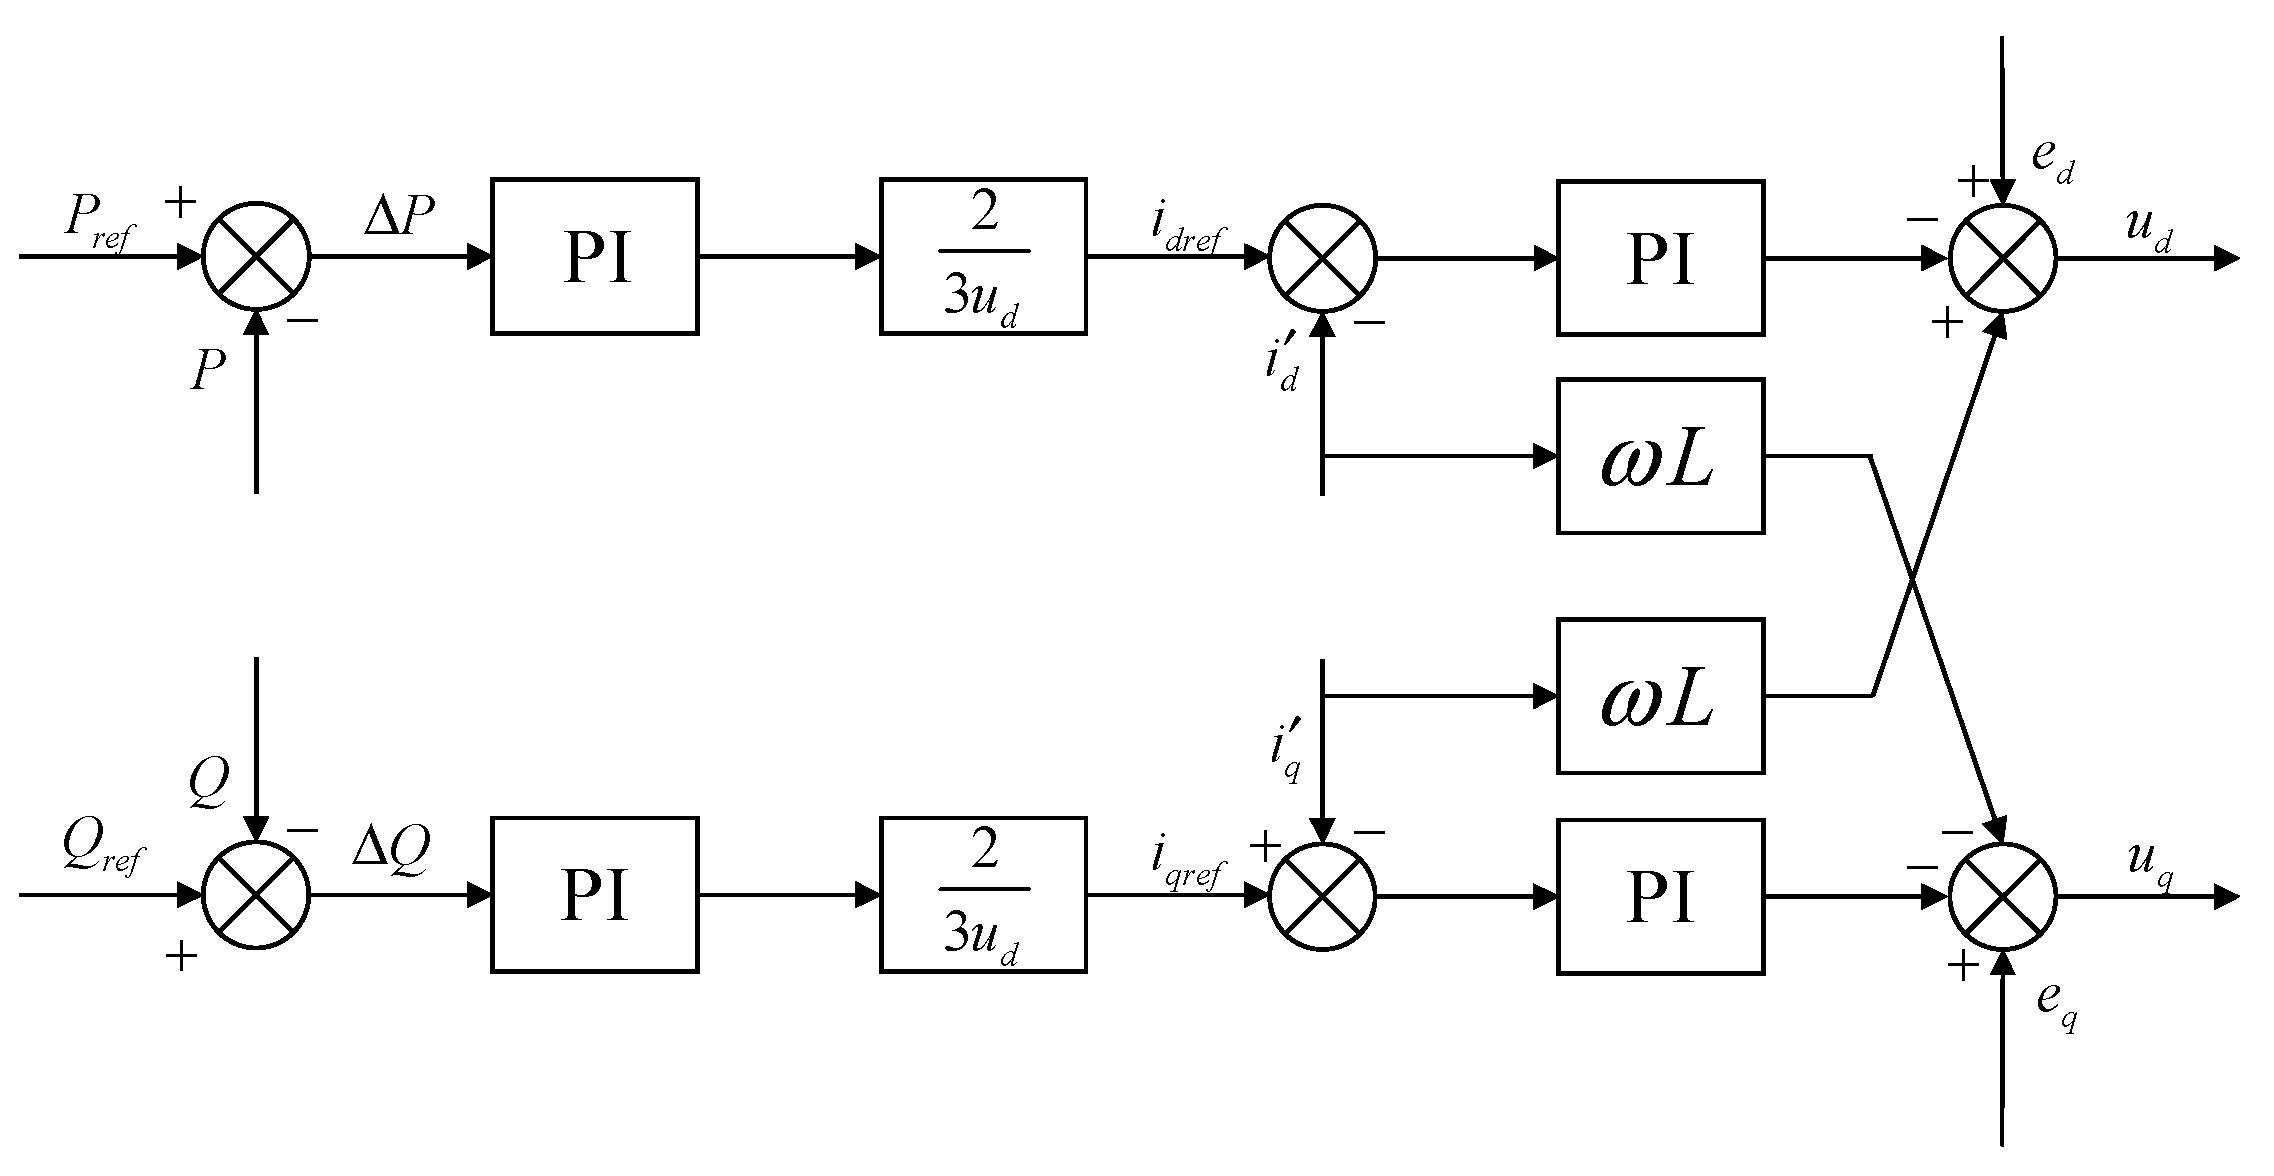
4.2. PQ Control of Energy Storage System

The PQ control of energy storage system is mainly composed of power outer loop, current inner loop and phase-locked loop. The function of its outer loop control is to monitor and adjust the output power of the system, and take the constant power of the power grid as the reference power, that is, Pref = Pload, to achieve no error control and eventually achieve the purpose of grid-connected power demand, as shown in Figure 11.
PI control is still used in the energy storage system, and the calculation formula is as follows:
i d r e f = 2 3 u d K p P + K p I s P r e f P i q r e f = 2 3 u d K p P + K p I s Q r e f Q
In the above equation, KpP and KpI are the proportional adjustment gain and integral adjustment gain of the power outer loop; P and Q are the output active power and reactive power of the PV system; and idref and iqref are the current reference values of the d and q axes in the energy storage system, respectively. The system operates with a unit power factor, iqref = 0, so it is not necessary to consider the reactive power link. The control block diagram is shown in Figure 12.
Because the power outer loop and the current inner loop are the same as the principle of the voltage outer loop and the current inner loop in the PV system, this paper does not repeat it. After the derivation and setting calculation, the proportional adjustment of power outer loop is KpP = 0.01, and the integral adjustment is KpI = 0.5; the proportional regulation gain in the current is KIP = 10, and the integral regulation gain KII = 1000.

4.3. Design of the Three-Phase Software Phase-Locked Loop

The three-phase software phase-locked loop technology is used to realize the control of the three-phase phase-locked loop by converting the static coordinate system of the three-phase system to the synchronous locking of the rotating coordinate system. In this paper, the Single Synchronous Reference Frame Software Phase Locked Loop (SSRF-SPLL) is used. The SSRF-SPLL system includes the following:
u d u q = U c o s θ θ s i n θ θ = U c o s Δ θ s i n Δ θ
In the above formula, θ is the vector angle of the actual voltage vector; θ′ is the voltage vector angle of the phase-locked loop output; and U is the grid voltage amplitude.
When the output voltage vector of the phase-locked loop completely coincides with the actual voltage vector, θ = θ′, ud = U and uq = 0. Therefore, by selecting the PI adjusting control based on the input of uq, the SSRF-SPLL control can be used to realize phase locking, and the adjustment of the control parameters has a direct impact on the dynamic and static performance of the phase-locked loop.
If the regulator function is Ksp(s + 1)/s, and because Δθ is small, sinΔθ = Δθ, it can be treated as a linear control system. When considering the sampling delay corresponding to the equivalent inertial time constant Ts, the control block diagram can be obtained as shown in Figure 13:
In the above figure, ω is the estimated value of the phase-locked loop output angular frequency; ω* is the actual angular frequency of the power grid; KsP is the proportional gain of the phase-locked loop; and τs is the integral time constant.
From the above, the control open-loop transfer function H0(s) can be obtained:
H 0 s = K s P s τ s + 1 s τ s 1 1 + s T s U s
In the above formula, let
a 0 = U K s P a 1 = U K s P τ s a 2 = τ s a 3 = T s τ s
Then, the closed-loop transfer function Hc(s) of the phase-locked loop control structure is as follows:
H c s = H 0 s 1 + H 0 s = s U K s P τ s + U K s P s 3 T s τ s + s 2 τ s + s U K s P τ s + U K s P
The Routh criterion is listed by the characteristic equation; the necessary and sufficient condition for the stability of the phase-locked loop control is τs > Ts. Let τs = α2Ts, α is an undetermined factor, and α > 1. The relationship between damping ratio ξ and undetermined factor α is analyzed as follows:
ξ = α 1 2
If the damping ratio of ξ = 0.707 is selected, then α = 2.414.
Since H0(s) is a third-order type II system, the symmetric optimization method can be used to tune the adjustment parameters, which is characterized by the ability to maximize the phase margin.
A i = a i 2 + α j = 1 i 1 j a i j a i + j
When the system is optimal, Ai = 0, 1, 2, 3, …, m; m is the number of regulator parameters; ai is available from (31). The phase-locked loop is then obtained as follows:
A 1 = a 1 2 α a 0 a 2 = 0 A 2 = a 2 2 α a 1 a 3 = 0
Substituting Equation (31) into Equation (35), the PI adjustment parameters, KsP and KsI, of the phase-locked loop system can be obtained by the following derivation and calculation:
K s P = 1 α U T s τ s = α 2 T s K s I = K s P τ s
Thus, KsP = 19 and KsI = 235 are obtained.

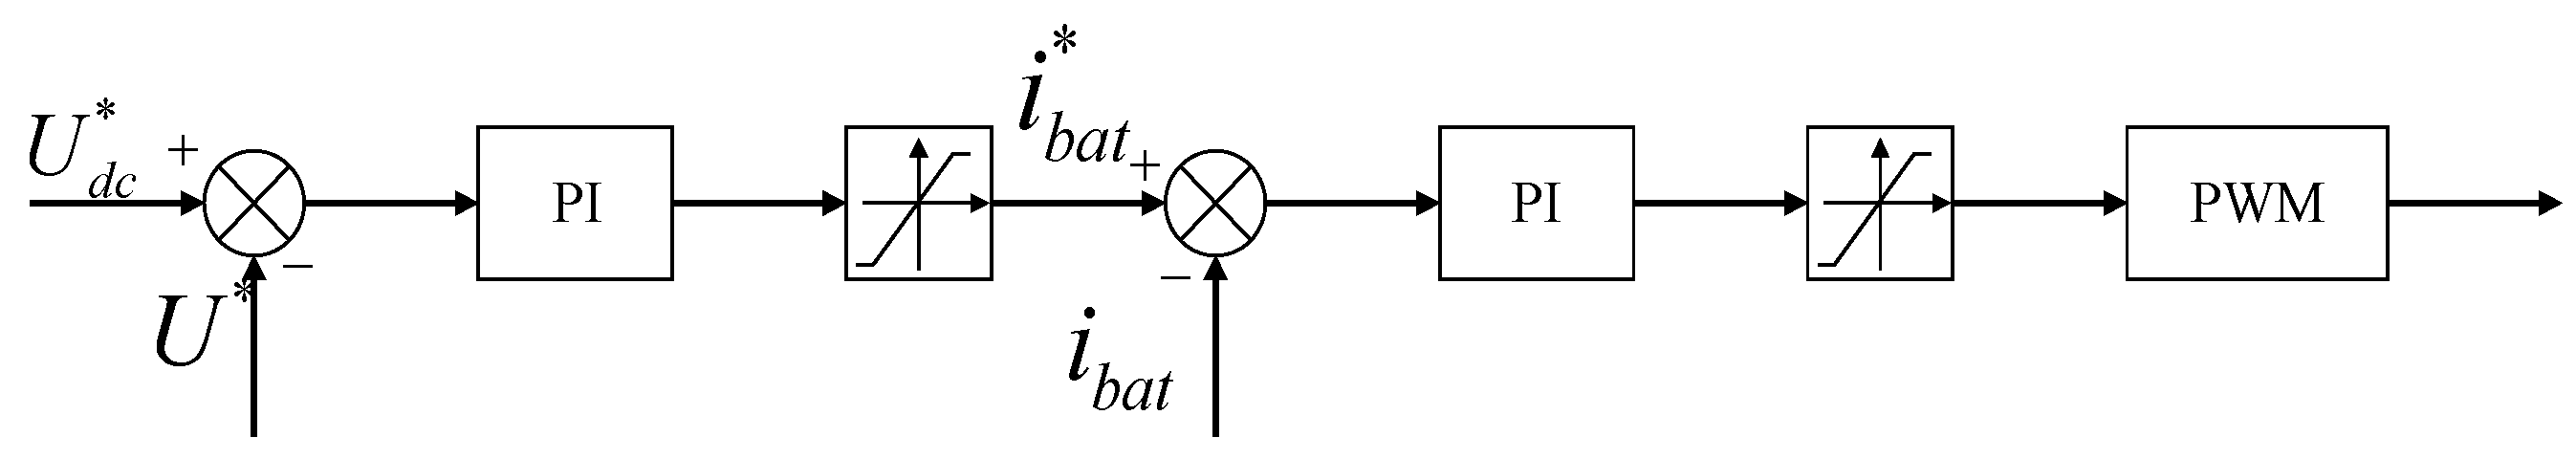
4.4. Control Strategy of Bidirectional DC/DC Converter

The bidirectional converter adopts a constant voltage charge and discharge control strategy. By calculating the difference with the given reference voltage, the PI controller outputs the battery current instruction value, and then outputs the difference with the actual battery current value. The control block diagram of the final output V13 and V14 power switches sign flow through the PI controller, limit, and the PWM generator is shown in Figure 14.

5. Simulation Analysis

To assess the viability of the fuzzy control MPPT method and the constant power grid-connected control strategy proposed in this study, a simulation model of a PV energy storage system is constructed using MATLAB/Simulink.

5.1. MPPT Simulation Analysis Based on Fuzzy Control

The photovoltaic panel chosen for this study is the ISoltech ISTH-215-P. The quantity of parallel connections is 5, while the quantity of series connections is 14. When the light intensity is 1000 W/m2, the maximum power output of a single photovoltaic panel is measured to be 213.15 W. Based on calculations, the theoretical maximum power output of the photovoltaic system is expected to be 14,920 W. Similarly, when the light intensity is 750 W/m2, the maximum power output of a single photovoltaic panel is found to be 161.35 W. The theoretical maximum power output of the photovoltaic system under this condition is calculated to be 11,294 W. In order to more clearly reflect the tracking waveform of MPPT after adding fuzzy control, the simulation time is shortened here to be within 0.15 s. Because temperature has little effect on maximum power, the temperature is kept constant at 25 °C, and the initial light intensity is 1000 W/m2. The simulation is carried out under the condition where illumination is reduced to 750 W/m2 at 0.1 s.
As illustrated in Figure 15, under the initial light intensity of 1000 W/m2, the fuzzy control tracks the maximum power point near 14,900 W at around 0.03 s and gradually becomes stable, while the disturbance observation method tracks the maximum power point around 0.06 s. When the illumination intensity of 0.1 s is reduced to 750 W/m2, the maximum power point is tracked at around 11,000 W. It is worth noting that the disturbance observation method displays excessive oscillation, whereas the fuzzy control method exhibits strong robustness and a higher tracking speed throughout the entire process. This statement affirms the superior performance of the fuzzy control method in comparison to the disturbance observation method. Under different lighting conditions, the simulation effectively monitors the maximum power point, which corresponds with the theoretical calculations. The meticulous monitoring leads to the attainment of the anticipated result.

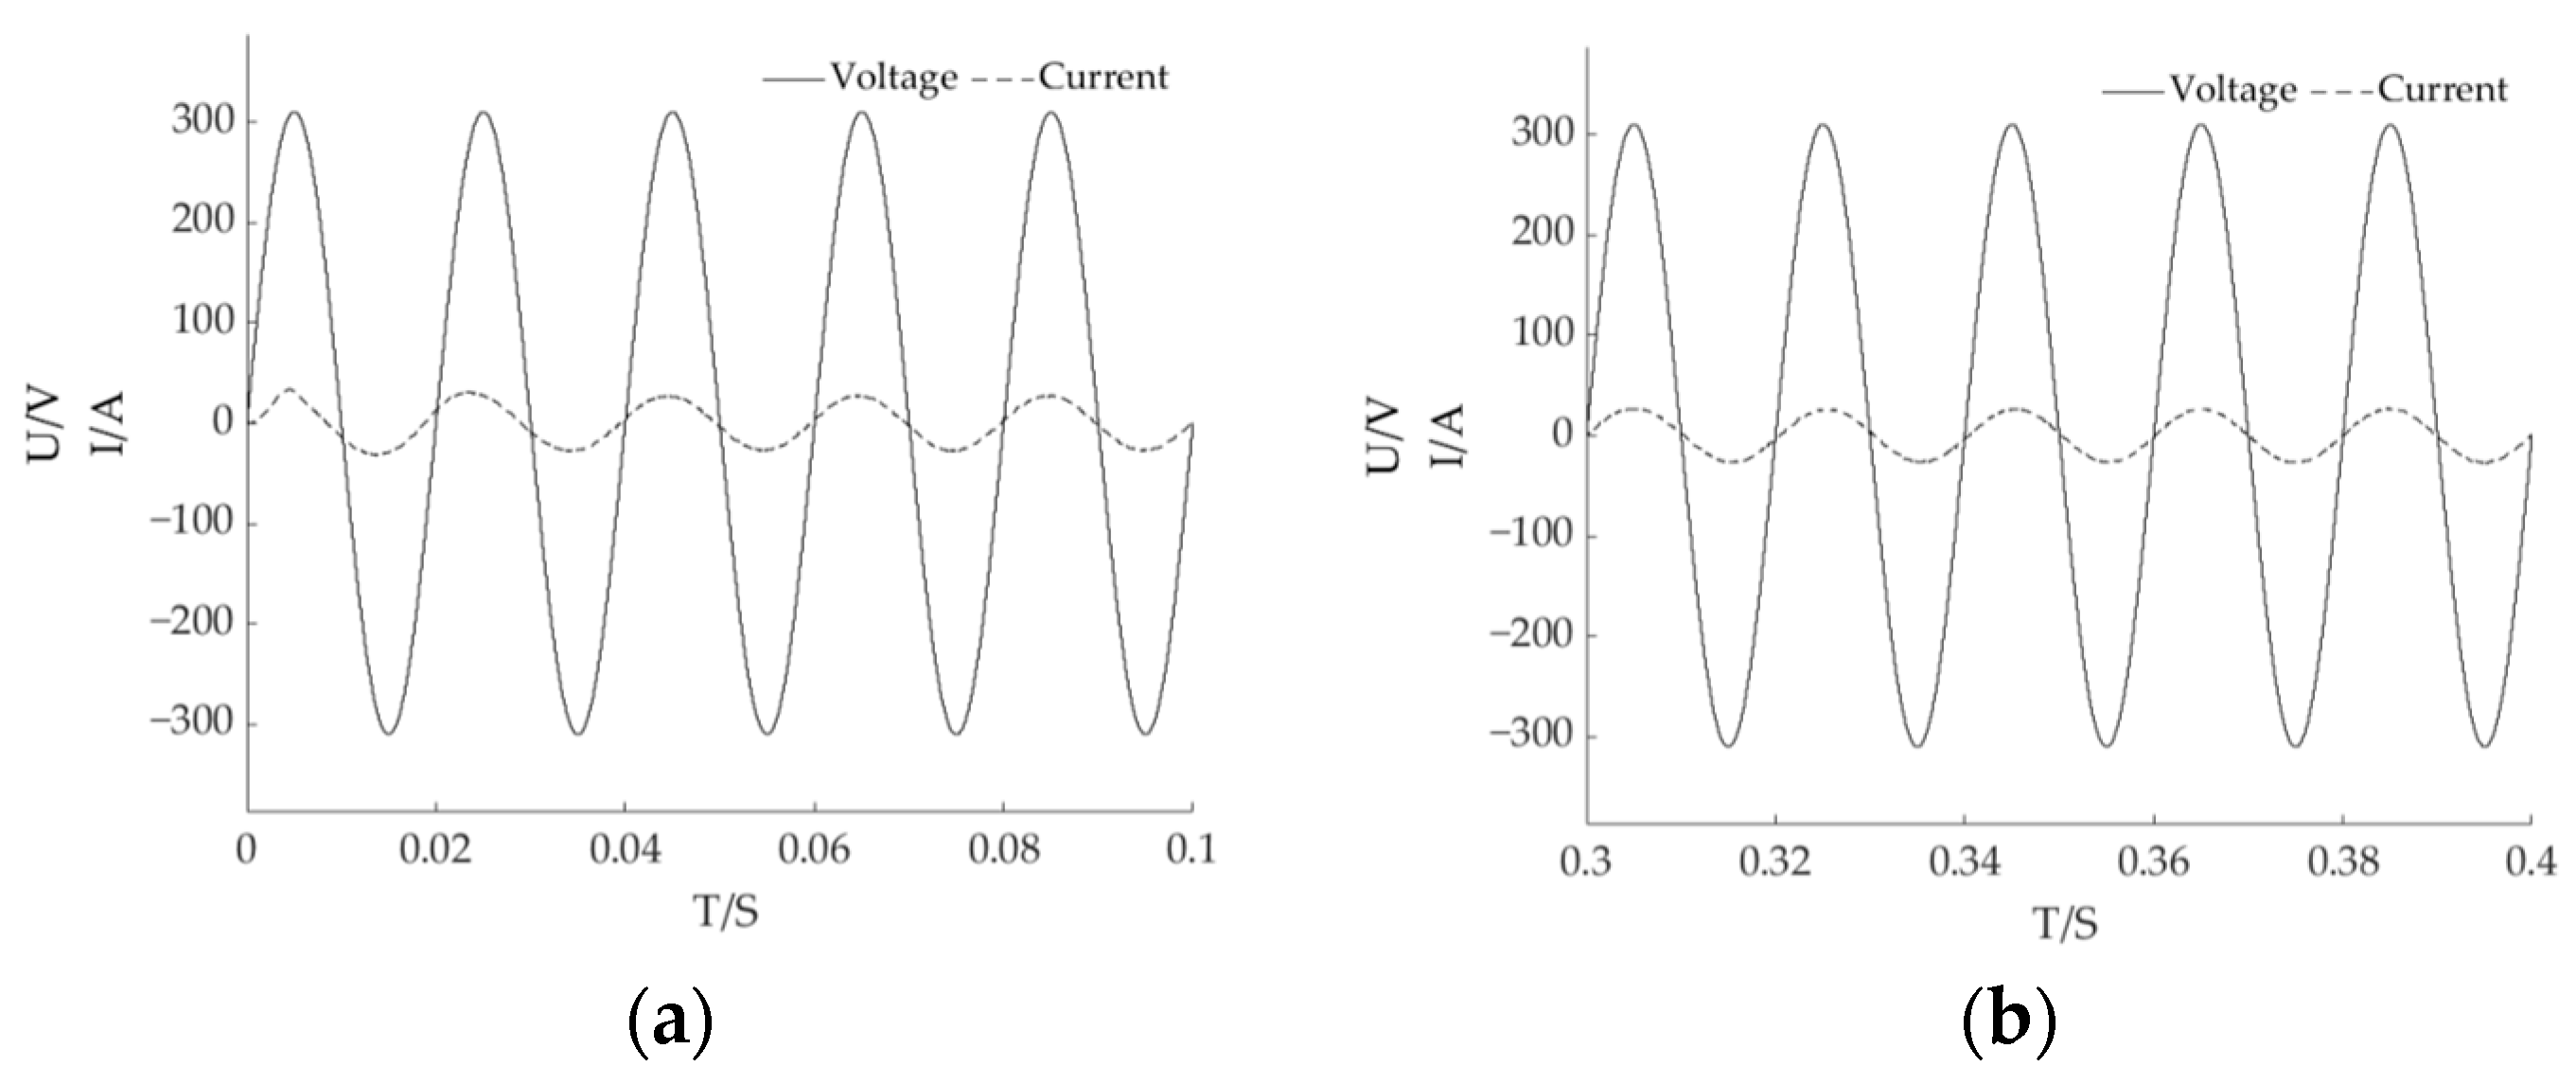
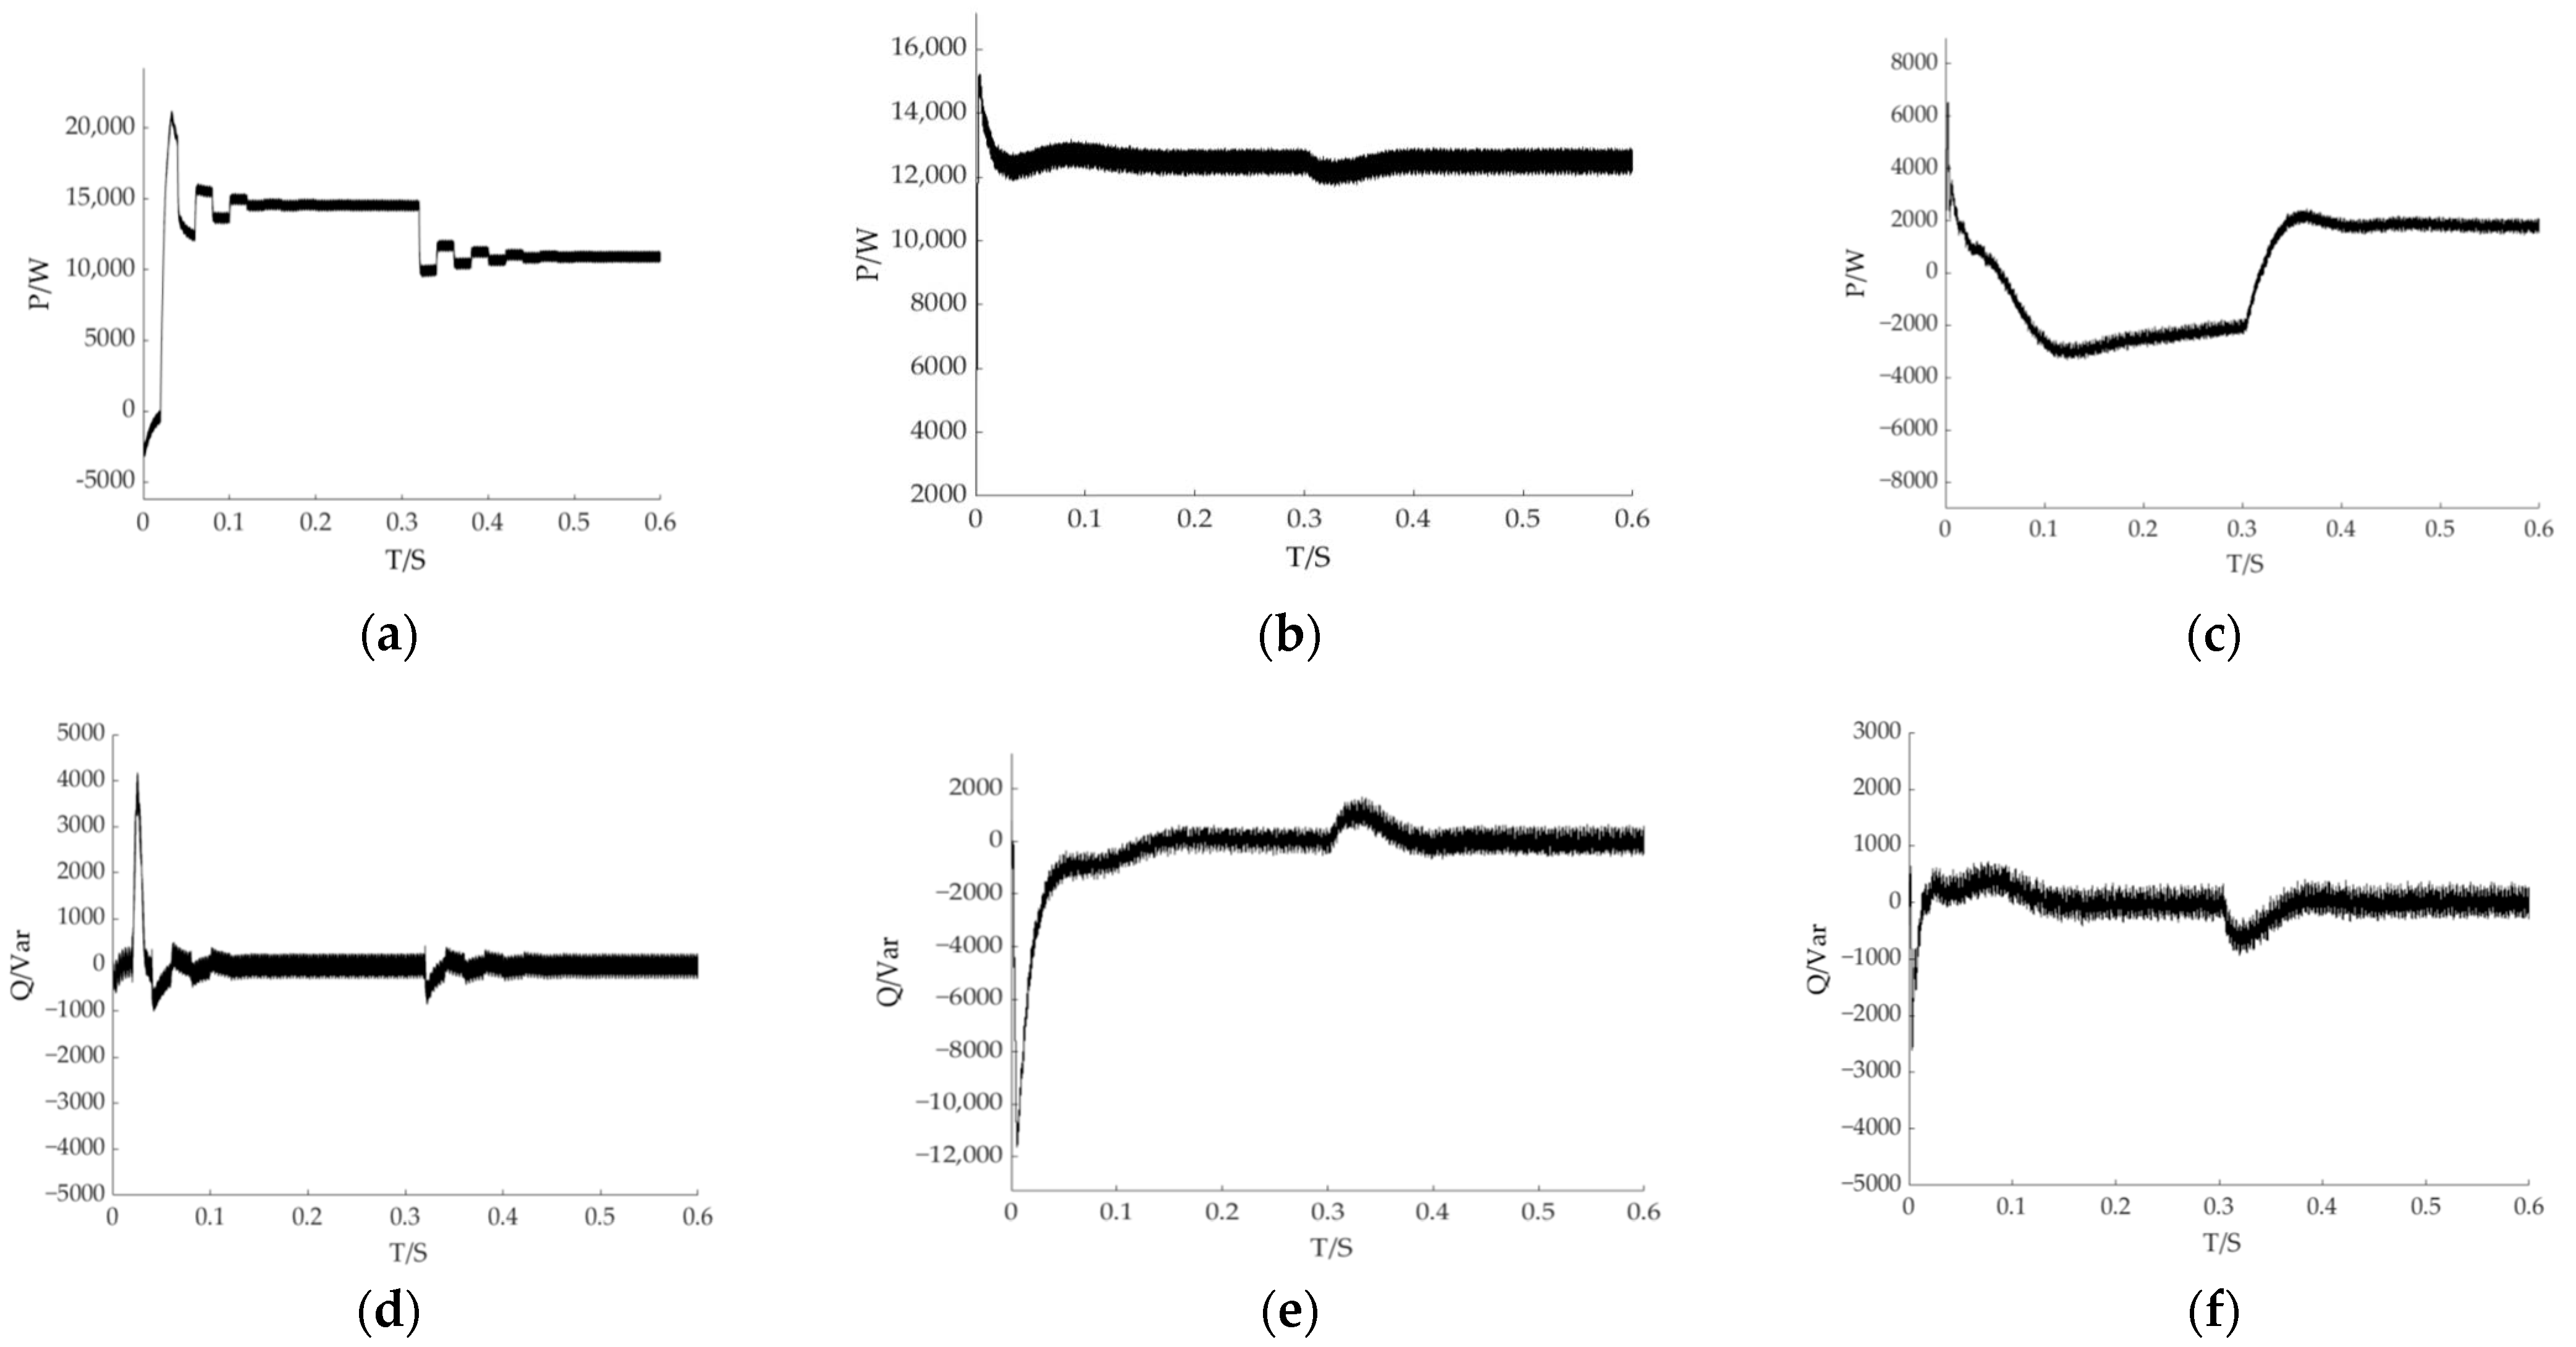
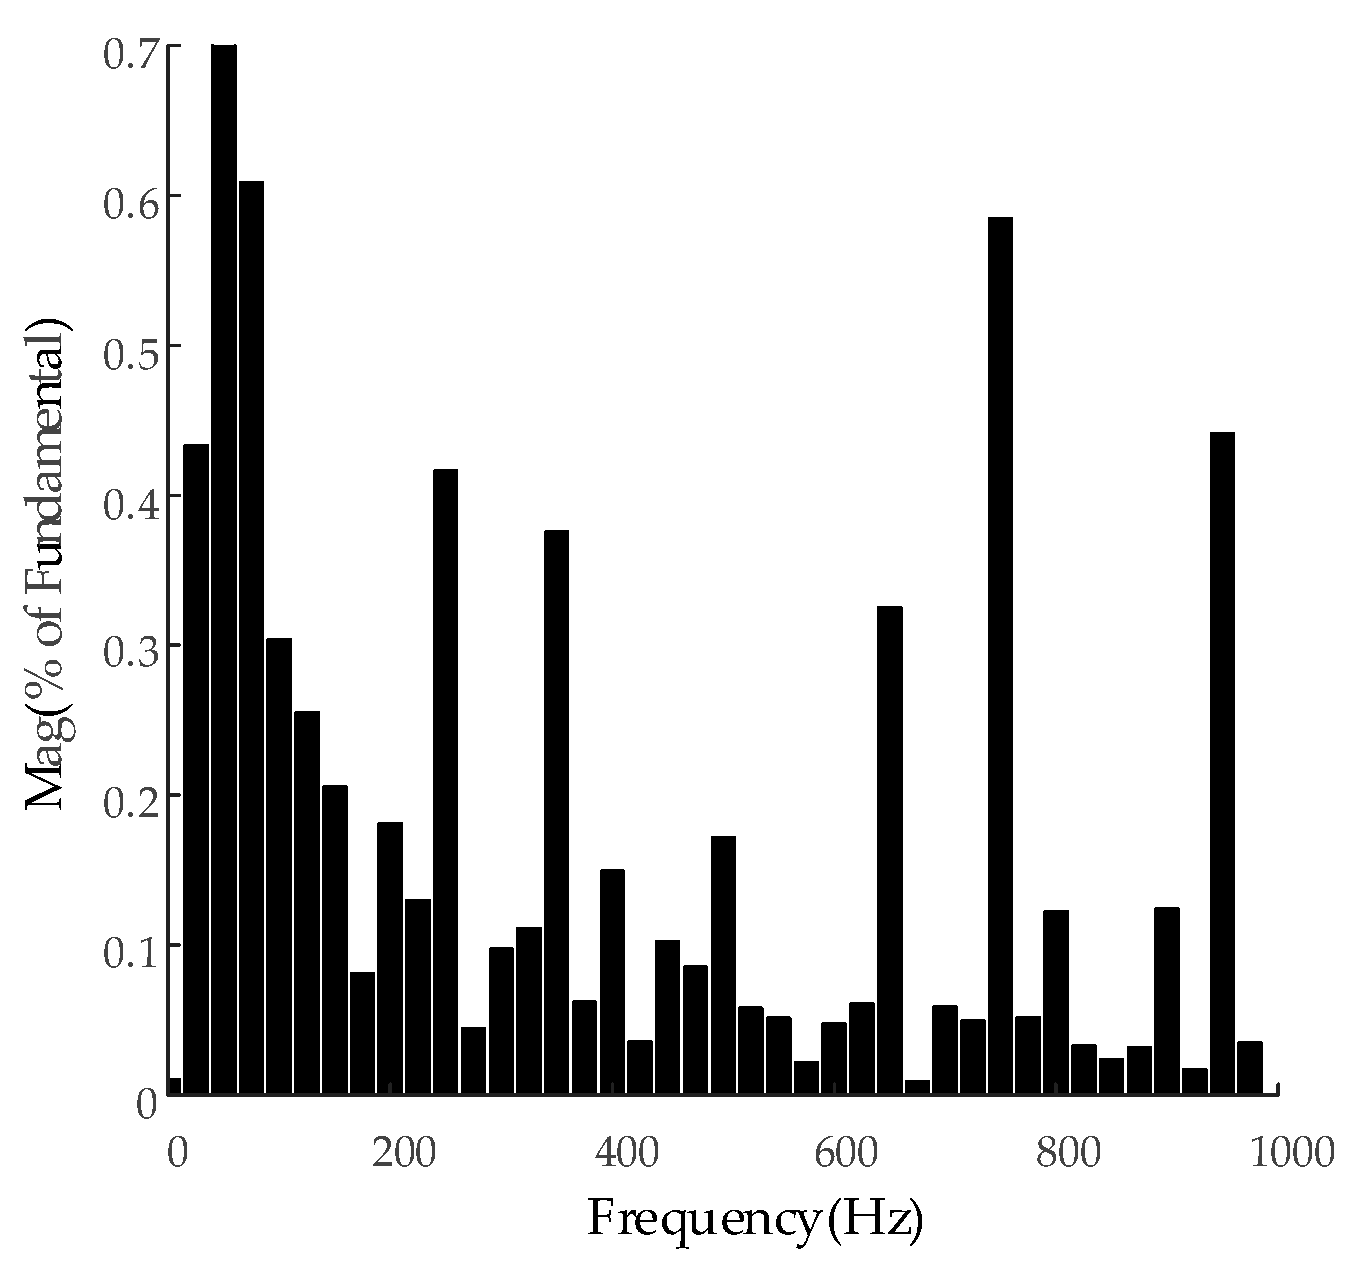
5.2. PV Energy Storage Grid-Connected Simulation Analysis

In order to facilitate a comprehensive analysis of the current and voltage variations in the photovoltaic energy storage system model depicted in Figure 16, the simulation time has been extended to 0.6 s. Additionally, the temperature of the system has been kept constant at 25 °C. The first stage involves an initial light intensity of 1000 W/m2. In the second stage, at 0.3 s, the illumination is reduced to 750 W/m2 for simulation purposes. The lead–acid battery has been chosen as the preferred energy storage battery. The voltage rating of the system is specified as 400 V, while the capacity rating is set at 200 Ah; the initial state of charge is predetermined to be 80%, and the standard discharge current is established at 40 A. Given that the system operates at a unit power factor and is designed to meet the grid-connected requirements, the grid power is a fixed value of Pload = 12,500 W and reactive power Q = 0 Var.
The voltage and current waveforms of the grid side are depicted in Figure 17. The voltage and current waveforms throughout the entire process exhibit sinusoidal wave fluctuations without significant distortion, and there is no presence of any substantial impulse current. The current and voltage exhibit stability at 0.03 s, demonstrating identical frequency and phase alignment, as depicted in Figure 17a. At a time interval of 0.3 s, the light undergoes a change. At this point, the power output of the photovoltaic cell is 11,000 W, which lower than that of the grid. However, the current and voltage on the grid side remain unaffected and fluctuate, as depicted in Figure 17b. This observation suggests that the energy storage battery is currently supplying power.
The waveform of the system power simulation is depicted in Figure 18. In this paper, a quantitative comparison is conducted between the control strategy without PQ and the control strategy with PQ. In the initial stage, the light intensity is measured at 1000 W/m2, and the output power of the system reaches 14,900 W. The system without PQ control significantly fluctuates at 0~0.15 s, and reaches a stable stage at 0.15 s. When the light intensity becomes 750 W/m2, it reaches a stable state after 0.15 s, and the power cannot be modulated at both moments to reach the power required by the grid, as shown in Figure 18a. After adding the PQ control strategy, the grid-connected active power reaches 12,500 W at 0.07 s, and there is no fluctuation. When the light intensity changes at 0.3 s, the active power is not affected. The entire system achieves a constant power output of 12,500 W, and the entire operation fulfills the requirements of grid-connected demand, as depicted in Figure 18b. From the analysis of Figure 18d,e, it is evident that both the reactive power profiles exhibit an overshoot during the initial stage of the system and the sudden change stage of light intensity. After the addition of PQ control, the system demonstrates rapid adjustment to the corresponding values with minimal overshoot, ultimately converging to 0 Var within a time frame of 0.1 s. This observation, in conjunction with the analysis of active power and reactive power, serves to validate the feasibility and necessity of incorporating the PQ control strategy.
According to the above, the initial photovoltaic output power is 14,900 W, which is greater than the grid power of 12,500 W; at this point, the battery is charged at 2400 W power, and the power value is negative. When the light intensity changes at 0.3 s, the photovoltaic output power becomes 11,000 W, which is less than the grid power of 12,500 W; at this point, the battery discharges at 1500 W, and the active power is positive. The whole process of the energy storage battery is reflected in Figure 18c. From Figure 18f, it can be seen that the reactive power of the energy storage battery overshoots in the initial stage of the system and the sudden change stage of the light intensity, but the system quickly makes a corresponding adjustment to 0 Var within 0.1 s.
As depicted in Figure 19, the current and voltage waveforms of the grid-connected side of the energy storage battery exhibit sinusoidal fluctuations. In the charging stage, the current and voltage exhibit the same frequency and phase, as depicted in Figure 19a. The charging current waveform exhibits a gradual stabilization period after 0.06 s, reaching a stable level of approximately ±30 A, without any overshoot. During the discharge stage, both the current and voltage exhibit the same frequency, but with a phase difference of 180°, as depicted in Figure 19b. The discharge current waveform exhibits a gradual stabilization at approximately ±30 A after 0.04 s, with no occurrence of overshoot. The charging and discharging state of the energy storage battery is depicted in Figure 19c. At 0~0.3 s, the energy storage battery is charged and it increases within a time period of 0.3 s. At 0.3~0.6 s, the energy storage undergoes discharge, resulting in a decrease in its charge.
The output process of the PV system and the DC bus is shown in Figure 20a, and the DC bus voltage of the energy storage system is shown in Figure 20b. Initially, the two waveforms that appear after the overshoot phenomenon tend to be stable after about 0.05 s. In the initial phase of the charging process, the voltage of the DC bus exceeds the reference voltage, causing the system to operate in a step-down mode. When the intensity of light diminishes, there is a corresponding decrease in the voltage of the DC bus. In the initial phase of energy storage battery discharge, the voltage of the DC bus is lower than the reference voltage, causing the system to operate in a boost state. At a time of 0.35 s, the system exhibits a gradual stabilization and maintains a voltage level of approximately 800 V.
The results of the Fast Fourier Transform (FFT) analysis of the grid-connected current are depicted in Figure 21. The THD of the grid-connected current is 2.18%, which falls below the acceptable threshold of 5%. This indicates that the grid-connected current meets the requirements for grid connection.

6. Discussion

Based on the theoretical analysis and simulation verification presented above, this study only focuses on analyzing the maximum power tracking method based on fuzzy control under conditions of sudden changes in light intensity, without simulating and verifying the maximum power tracking effect under partial shading. Additionally, this study only verifies the feasibility of the overall system control strategy and does not investigate in-depth the issue of grid harmonics, merely employing LC filtering as a simple solution. Based on the limitations of this paper and the future development of photovoltaic energy storage, the members of this course group plan to conduct in-depth research in the following directions:
  • Employing higher-precision algorithms to address the maximum power tracking issue under partial shading conditions, aiming to achieve more accurate tracking;
  • Designing three-level or even multi-level structures for three-phase voltage-type PWM converters to effectively reduce output current harmonics, minimize electromagnetic interference, reduce losses, and enhance power conversion efficiency and output voltage range;
  • Adopting a hybrid energy storage approach, combining energy storage batteries with capacitors instead of using a single energy storage battery form, which can effectively mitigate power fluctuations caused by sudden changes in photovoltaic and load, thereby offering a longer service life and rapid response capability;
  • Shifting from the PQ control strategy to employ the virtual synchronous generator (VSG) control algorithm for energy storage systems, enabling multi-level parallel operation of multiple energy storage systems, thereby achieving higher power state operation, and centralizing distributed power grids to realize the effect of photovoltaic microgrids, which is more in line with practical life requirements.

7. Conclusions

In this paper, we propose a PV energy storage grid-connected system that operates on constant power. The focus of this study is on the core components of the system, namely the MPPT control strategy, three-phase voltage source PWM converter, and bidirectional DC/DC converter. The steps, topology, working mode, and control strategy of the mathematical modeling are comprehensively presented. The enhancement of PV energy storage grid connection stability is achieved through theoretical analysis and simulation verification. The following conclusions have been derived:
  • The proposed MPPT control strategy, utilizing fuzzy theory, demonstrates enhanced tracking speed, improved tracking accuracy, and reduced oscillation. These advantages contribute to maximizing the output efficiency of PV cells;
  • A control strategy is proposed for the three-phase voltage source PWM converter in the PV system, which involves an outer loop for voltage control and an inner loop for current control. Additionally, a control strategy is proposed for the converter in the energy storage system, which focuses on PQ control. The collaboration between the PV cell and the power grid is essential for optimizing energy utilization. When the PV cell generates more energy than the grid requires, it not only supplies electricity to the grid but also charges the energy storage battery to prevent energy wastage. Conversely, when the PV cell generates less energy than the power grid demands, the PV system and the energy storage system work in tandem to mitigate power fluctuations;
  • A novel constant voltage control strategy is proposed for the bidirectional DC/DC converter, aiming to enhance the stability of the DC bus voltage and optimize the charging efficiency of the energy storage battery.

Author Contributions

Conceptualization, T.W.; Software, writing—original draft preparation and writing—review and editing, C.L.; Formal analysis, K.Z.; Investigation, W.Z.; Validation X.W. All authors have read and agreed to the published version of the manuscript.

Funding

This research received no external funding.

Data Availability Statement

Data are contained within the article.

Conflicts of Interest

The authors declare no conflict of interest.

References

  1. Xin, P. Research on Solar Power Technology Economic Evaluation and Application Prospect. Master’s Thesis, North China Electric Power University, Beijing, China, 2015. [Google Scholar]
  2. Xu, D.; Yang, H. Optimal decision-making method for the ecological compensation of rural photovoltaic power generation adapted to rural revitalization and sustainable energy development. Trans. Chin. Soc. Agric. Eng. 2023, 39, 218–226. [Google Scholar]
  3. Ding, M.; Wang, W. A review on the effect of large-scale PV generation on power systems. Proc. CSEE 2014, 34, 1–14. [Google Scholar]
  4. Liu, C. Research on the influence of grid-connected photovoltaic system on power grid. Master’s Thesis, Shandong University, Jinan, China, 2020. [Google Scholar]
  5. Xu, W.; Bao, W. Review of impact on power quality of distributed power connecting to grid. Chin. J. Power Technol. 2015, 39, 2799–2802. [Google Scholar]
  6. De, S.; Urbanetz, J. Benefit Analysis of Grid Connected Photovoltaic Solar System with Energy Storage. Braz. Arch. Biol. Technol. 2021, 64, 122–142. [Google Scholar]
  7. Liu, J.; Chen, X. Overview on hybrid solar photovoltaic-electrical energy storage technologies for power supply to buildings. Energy Convers. Manag. 2019, 187, 103–121. [Google Scholar] [CrossRef]
  8. Luo, L.; Abdulkareem, S. Optimal scheduling of a renewable based microgrid considering photovoltaic system and battery energy storage under uncertainty. J. Energy Storage 2020, 28, 103–121. [Google Scholar] [CrossRef]
  9. Kitworawut, P.; Ketjoy, N. Best Practice in Battery Energy Storage for PV Systems in Low Voltage Distribution Network: A Case Study of Thailand Provincial Electricity Authority Network. Energies 2023, 16, 2469. [Google Scholar] [CrossRef]
  10. Soares, L.; Souza, A.; Silva, W. Grid-Connected PV Systems with Energy Storage for Ancillary Services. Energies 2023, 16, 7379. [Google Scholar] [CrossRef]
  11. Du, J.; Zhao, H. Outer loop voltage control method based on DC power control of three-phase grid-connected inverter. Acta Energiae Solaris Sin. 2019, 40, 2622–2629. [Google Scholar]
  12. Akbari, H.; Browne, M. Efficient energy storage technologies for photovoltaic systems. Sol. Energy 2019, 192, 144–168. [Google Scholar] [CrossRef]
  13. Huang, K.; Chao, K. Maximum Power Point Tracking of PV Module Arrays Based on a Modified Gray Wolf Optimization Algorithm. Energies 2023, 16, 4329. [Google Scholar] [CrossRef]
  14. Liu, H.; Fang, Q. Application of improved ODPSO algorithm in photovoltaic MPPT. Control. Eng. China 2023, 30, 1357–1367. [Google Scholar]
  15. Benhadouga, S.; Belkaid, A. Experimental Comparative Study MPPT between P&O and Sliding Control of a Small PV System. Int. J. Renew. Energy Res. 2022, 12, 863–869. [Google Scholar]
  16. Bhattacharyya, S.; Kumar, P. Steady Output and Fast Tracking MPPT (SOFT-MPPT) for P&O and InC Algorithms. IEEE Trans. Sustain. Energy 2021, 12, 293–302. [Google Scholar]
  17. Nguyen, H.; Huynh, T. Comparative Efficiency Assessment of MPPT Algorithms in Photovoltaic Systems. Int. J. Renew. Energy Res. 2022, 12, 2061–2067. [Google Scholar]
  18. Kordestani, M.; Mirzaee, A.; Safavi, A. Maximum Power Point Tracker (MPPT) for PV Power Systems-A Systematic Literature Review. In Proceedings of the 2018 European Control Conference (ECC), Limassol, Cyprus, 12–15 June 2018. [Google Scholar]
  19. Manohar, M.; Koley, E. An efficient MPPT and reliable protection scheme for PV-integrated microgrid under partial shading and array faults. Mod. Maximum Power Point Track. Tech. PV Energy Syst. 2020, 10, 303–329. [Google Scholar]
  20. Allahyari, S.; Taheri, N. A novel adaptive neural MPPT algorithm for photovoltaic system. Int. J. Automot. Mech. Eng. 2018, 15, 5421–5434. [Google Scholar] [CrossRef]
  21. Muftah, M.; Salem, M. A grid-tied PV-fuel cell multilevel inverter under PQ open-loop control scheme. Front. Energy Res. 2022, 10, 968371. [Google Scholar] [CrossRef]
  22. Yusof, N.; Ishak, D. Improved Control in Single Phase Inverter Grid-Tied PV System Using Modified PQ Theory. Intell. Autom. Soft Comput. 2023, 37, 2441–2457. [Google Scholar] [CrossRef]
  23. Lao, K.; Deng, W. PQ-Coupling Strategy for Droop Control in Grid-Connected Capacitive-Coupled Inverter. IEEE Access 2019, 7, 31663–31671. [Google Scholar] [CrossRef]
  24. Seo, S.; Choi, H. Digital Implementation of Fractional Order PID-Type Controller for Boost DCDC Converter. IEEE Access 2019, 7, 142652–142662. [Google Scholar] [CrossRef]
  25. Do, D.; Nguyen, M. Three-Level Quasi-Switched Boost T-Type Inverter: Analysis, PWM Control, and Verification. IEEE Trans. Ind. Electron. 2018, 65, 8320–8329. [Google Scholar] [CrossRef]
  26. Chandrasekar, B.; Nallaperumal, C. Non-Isolated High-Gain Triple Port DC–DC Buck-Boost Converter with Positive Output Voltage for PV Applications. IEEE Access 2020, 8, 113649–113666. [Google Scholar] [CrossRef]
  27. Wang, T.; Chen, K. Research on coordinated control strategy of photovoltaic energy storage system. Energy Rep. 2023, 9, 224–233. [Google Scholar] [CrossRef]
  28. Jusoh, M.; Daud, M. Fuzzy logic-based control strategy for hourly power dispatch of grid-connected photovoltaic with hybrid energy storage. Prz. Elektrotechniczny 2022, 98, 112–132. [Google Scholar] [CrossRef]
  29. Ayeng’o, S.; Axelsen, H. A model for direct-coupled PV systems with batteries depending on solar radiation, temperature and number of serial connected PV cells. Solar Energy 2019, 183, 120–131. [Google Scholar] [CrossRef]
  30. Park, H.; Kim, Y. PV Cell Model by Single-diode Electrical Equivalent Circuit. J. Electr. Eng. Technol. 2016, 11, 1323–1331. [Google Scholar] [CrossRef]
  31. Nabipour, M.; Razaz, M. A new MPPT scheme based on a novel fuzzy approach. Renew. Sustain. Energy Rev. 2017, 74, 1147–1169. [Google Scholar] [CrossRef]
  32. Loukil, K.; Abbes, H. Design and implementation of reconfigurable MPPT fuzzy controller for photovoltaic systems. Ain Shams Eng. J. 2020, 11, 319–328. [Google Scholar] [CrossRef]
  33. Chen, Z. The Research on Nonlinear Control Strategy of the Three-Phase Voltage Type PWM Converter. Master’s Thesis, Shanxi University, Taiyuan, China, 2018. [Google Scholar]
Figure 1. PV source load impedance matching circuit diagram.
Energies 16 08056 g001
Figure 2. Flow chart of fuzzy rules.
Energies 16 08056 g002
Figure 3. MPPT rule logic diagram based on fuzzy control.
Energies 16 08056 g003
Figure 4. Membership functions: (a) e membership function; (b) Δe membership function; (c) dU membership function.
Energies 16 08056 g004
Figure 5. Observation diagram of Fuzzy control rule surface.
Energies 16 08056 g005
Figure 6. Main circuit topology diagram of PV energy storage system.
Energies 16 08056 g006
Figure 7. Block diagram of converter control in the PV system.
Energies 16 08056 g007
Figure 8. Current loop control block diagram of grid voltage feedforward decoupling.
Energies 16 08056 g008
Figure 9. Block diagram of current loop control.
Energies 16 08056 g009
Figure 10. Control diagram of voltage outer loop.
Energies 16 08056 g010
Figure 11. Control block diagram of converter in energy storage system.
Energies 16 08056 g011
Figure 12. Control block diagram of power outer loop current inner loop.
Energies 16 08056 g012
Figure 13. Control block diagram of SPFF-SPLL.
Energies 16 08056 g013
Figure 14. Control block diagram of constant pressure.
Energies 16 08056 g014
Figure 15. Comparison of MPPT strategies.
Energies 16 08056 g015
Figure 16. Photovoltaic energy storage grid-connected simulation model.
Energies 16 08056 g016
Figure 17. Grid-side voltage and current power simulation diagram (a) for the first phase A grid voltage and current waveform; and (b) the second phase A phase grid voltage and current waveform.
Energies 16 08056 g017
Figure 18. System power simulation diagram: (a) the active power of the grid-connected side without PQ control; (b) the joint PQ control grid-side active power; (c) the active power waveform of the energy storage battery; (d) the reactive power of grid-connected side without PQ control; (e) the joint PQ control grid-side reactive power; (f) the reactive power waveform of the energy storage battery.
Energies 16 08056 g018
Figure 19. Charging and discharging simulation diagram of AC side of energy storage battery: (a) charging waveform of phase A on AC side of energy storage battery; (b) the A phase discharge waveform of energy storage battery AC side; (c) the diagram of change in battery state of charge.
Energies 16 08056 g019
Figure 20. DC bus voltage simulation diagram: (a) DC bus voltage waveform of PV system; (b) DC bus voltage waveform of the energy storage system.
Energies 16 08056 g020
Figure 21. Fourier transform analysis of grid-connected current.
Energies 16 08056 g021
Table 1. Fuzzy reasoning table.
∆eNBNSZPSPB
e
NBPBPBPBZZ
NSPSPSPSZZ
ZPSPSZNSNB
PSZZNSNSNB
PBZZNBNBNB
Disclaimer/Publisher’s Note: The statements, opinions and data contained in all publications are solely those of the individual author(s) and contributor(s) and not of MDPI and/or the editor(s). MDPI and/or the editor(s) disclaim responsibility for any injury to people or property resulting from any ideas, methods, instructions or products referred to in the content.

