

Kraft Lignin Electro-Oxidation under Ambient Temperature and Pressure

 , , , and
Abstract
:1. Introduction
2. Materials and Methods
2.1. Materials
2.2. Electrochemical Setup
2.3. Catalyst Preparation
2.4. Oxidative Electrolysis of Kraft Lignin
2.5. Characterization
3. Results and Discussion
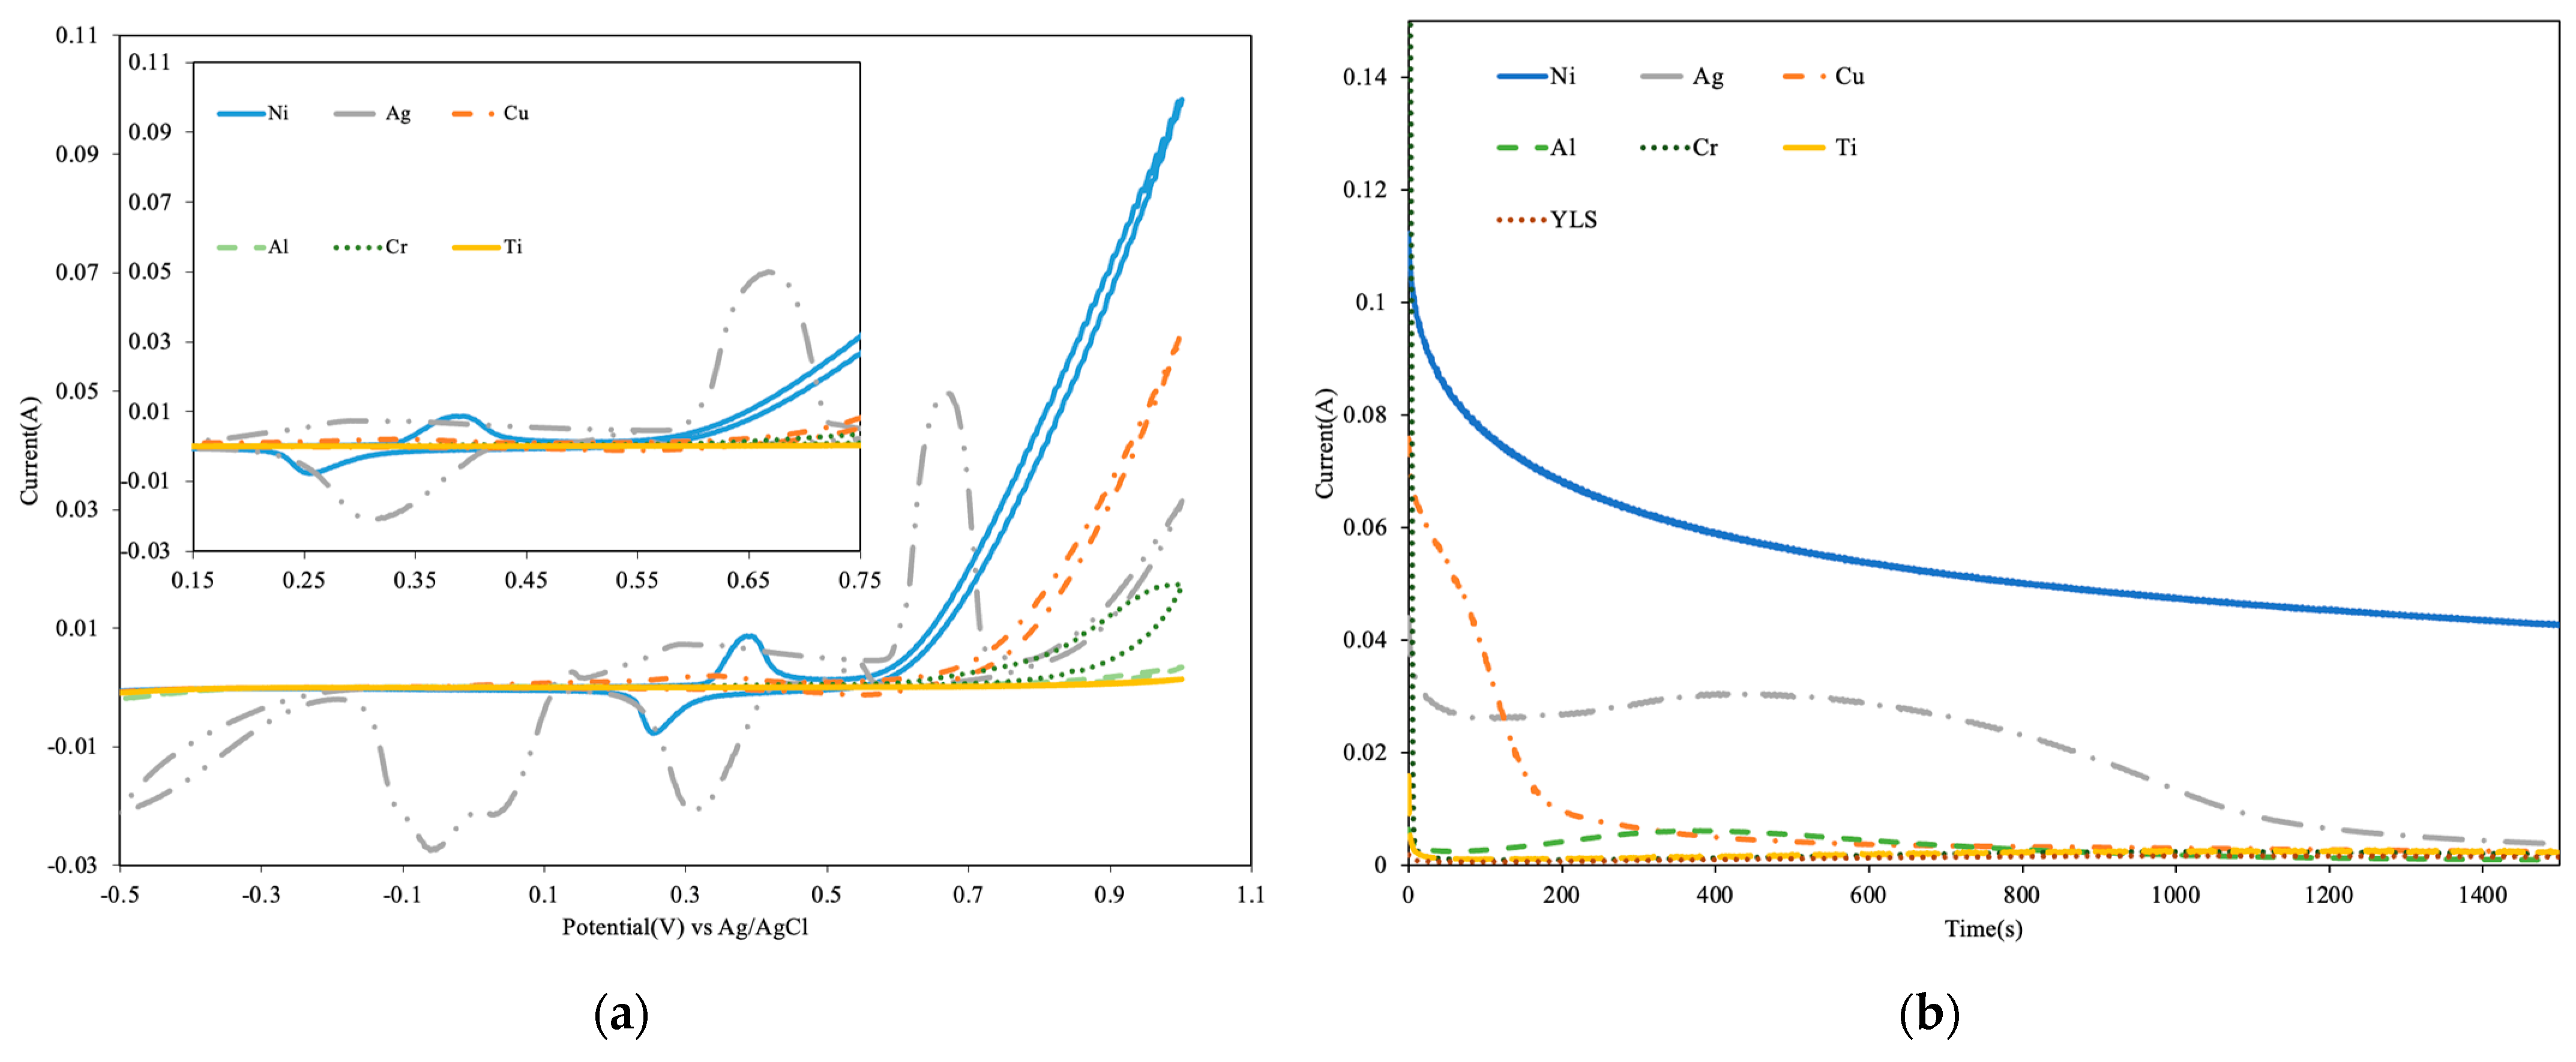
3.1. Preliminary Electrochemical Tests
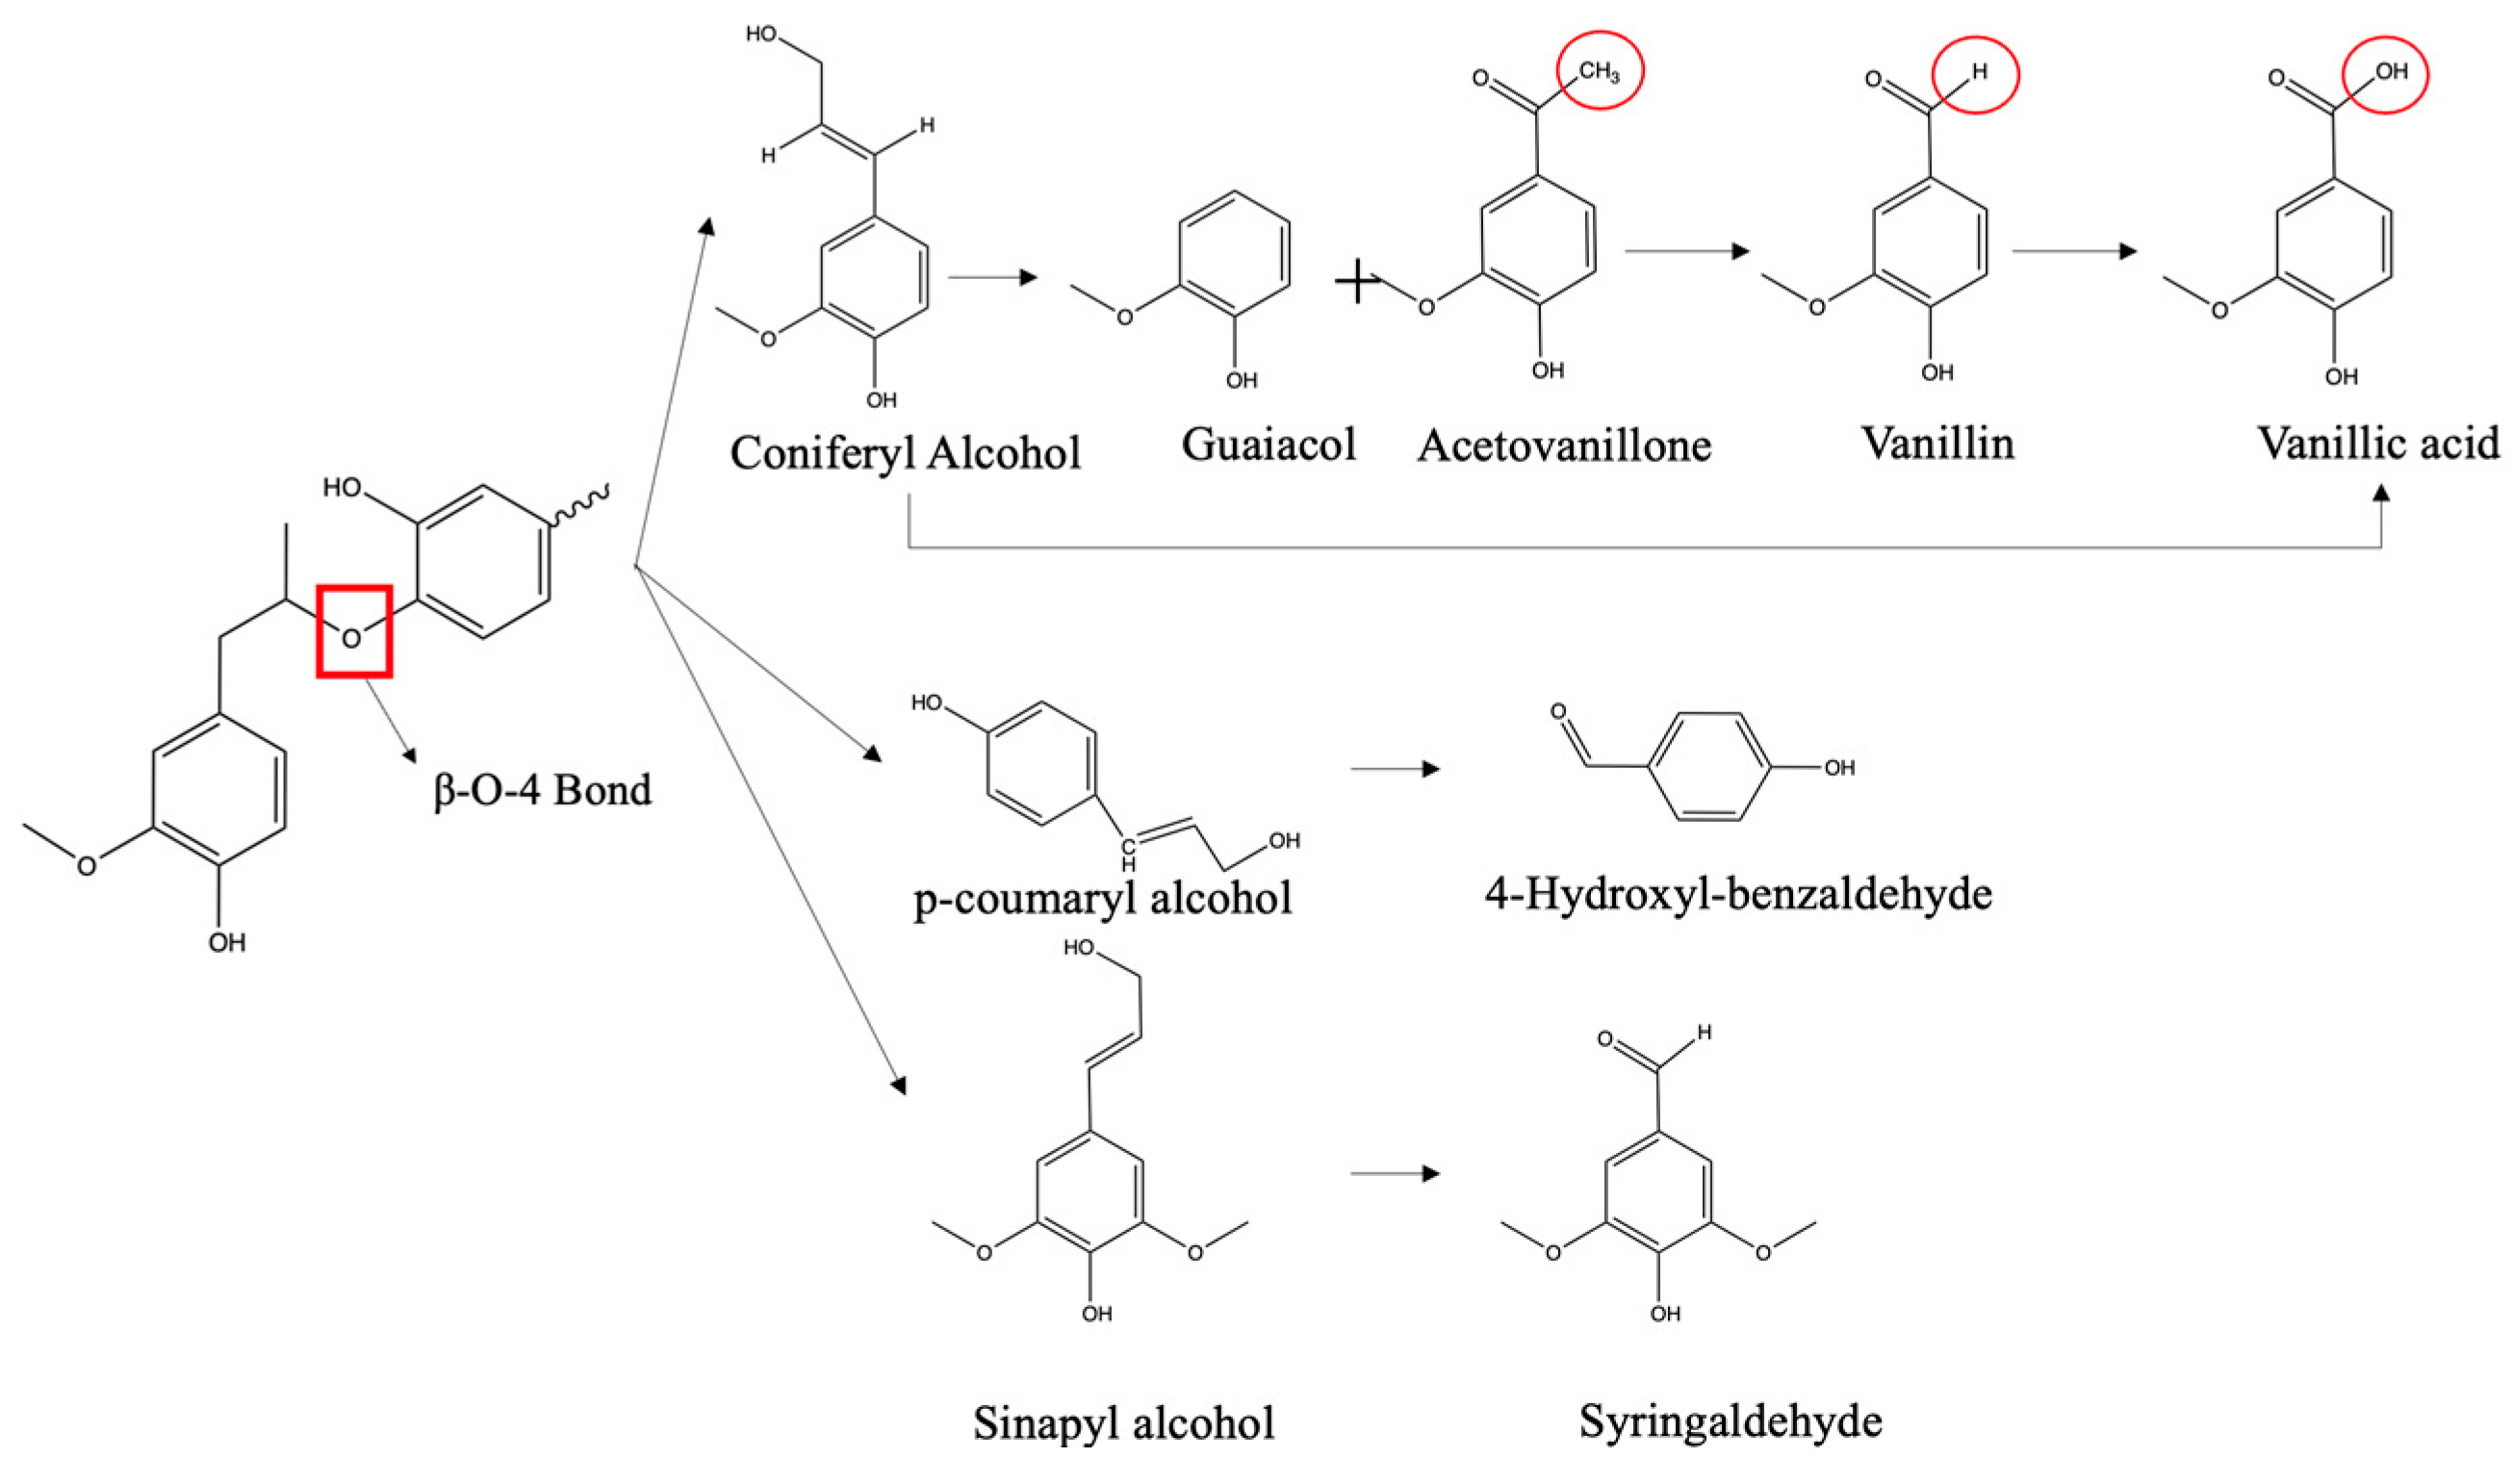
3.2. Chemical Identification
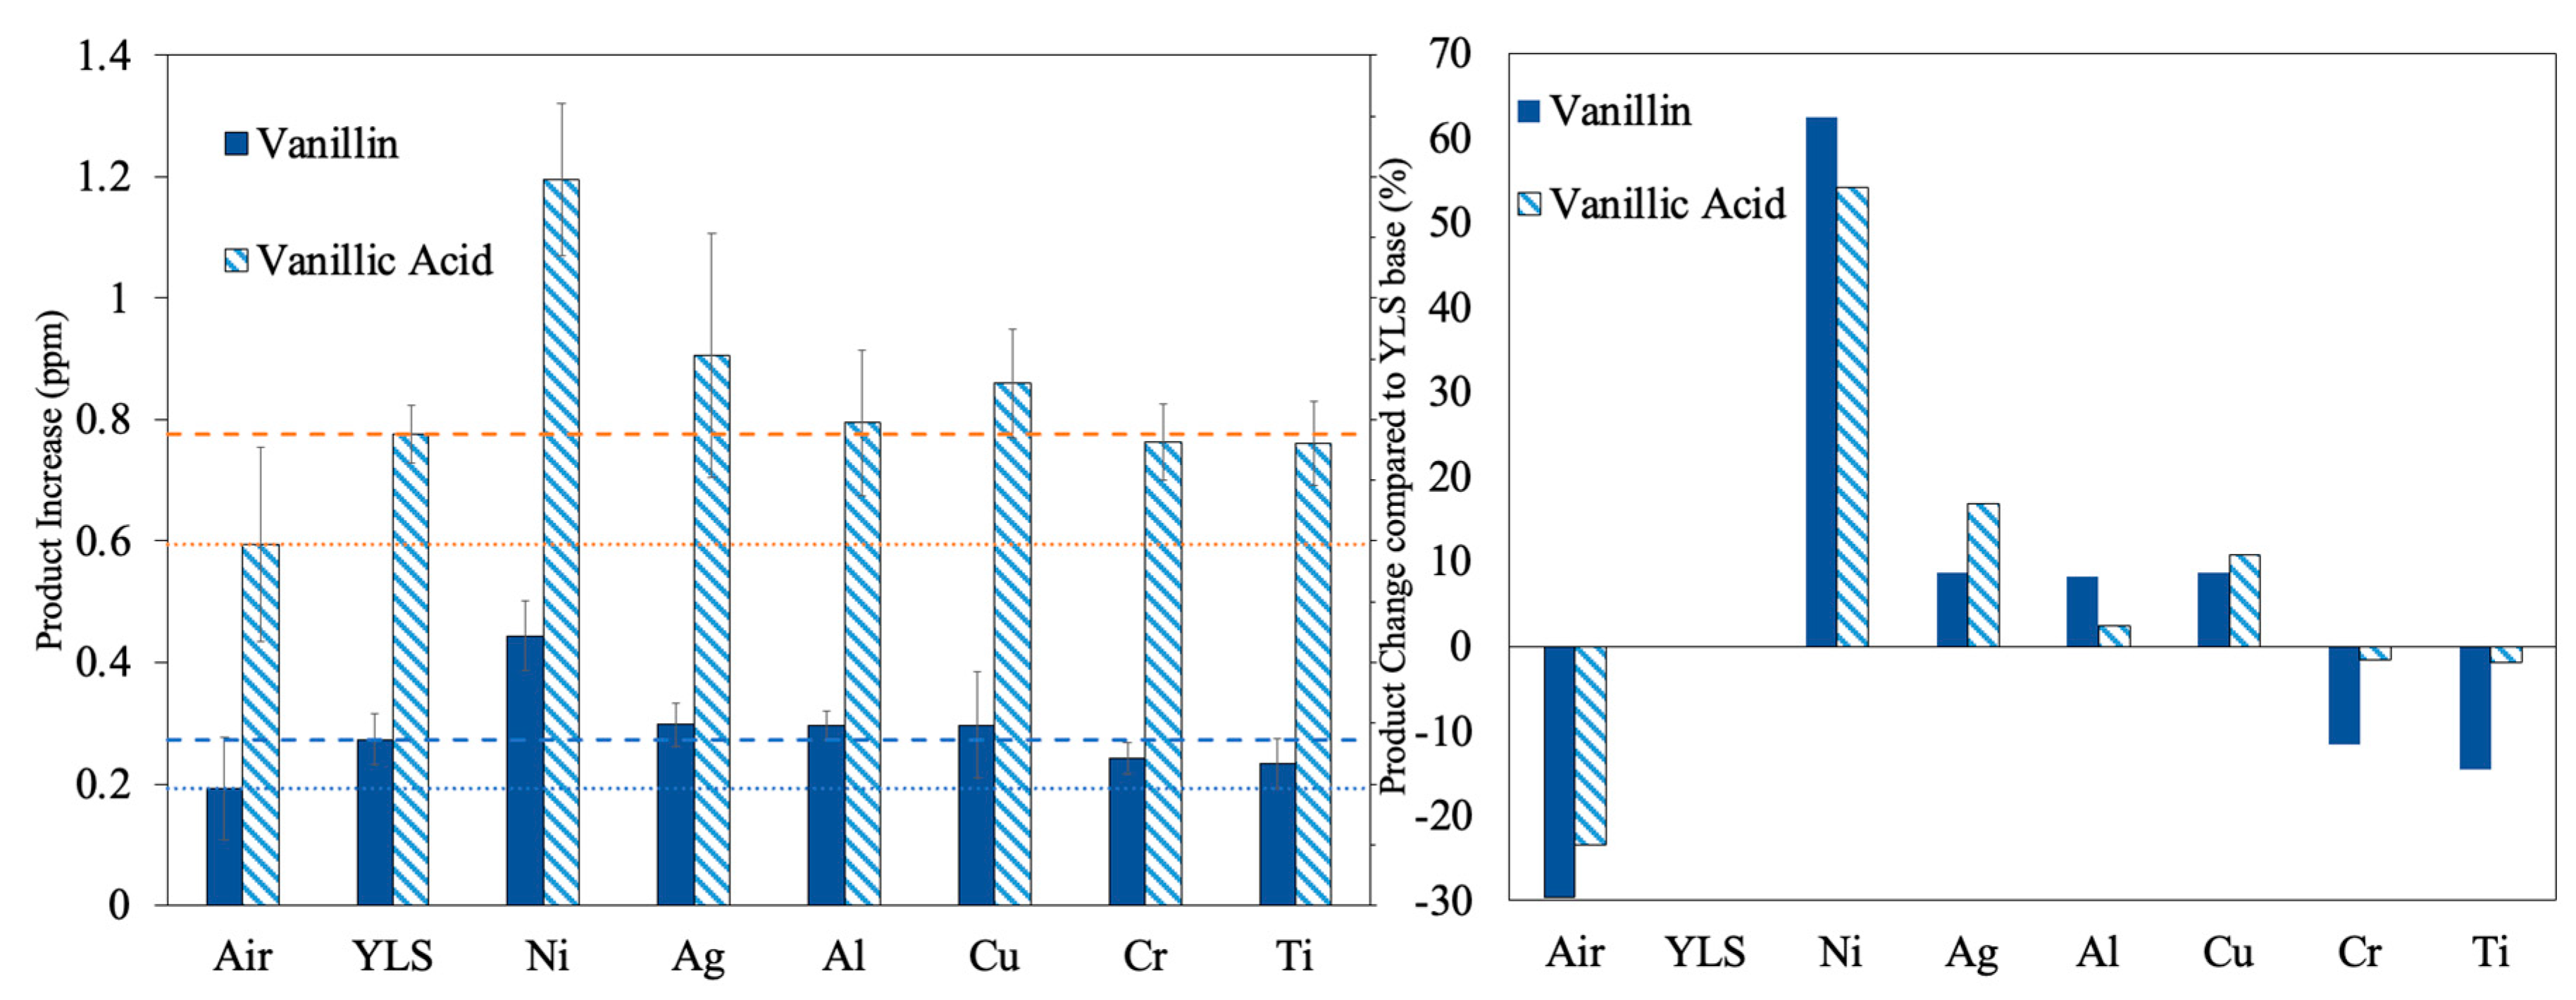
3.3. The Apparent Yield of the Targeted Chemicals
3.4. ESCA Normalization
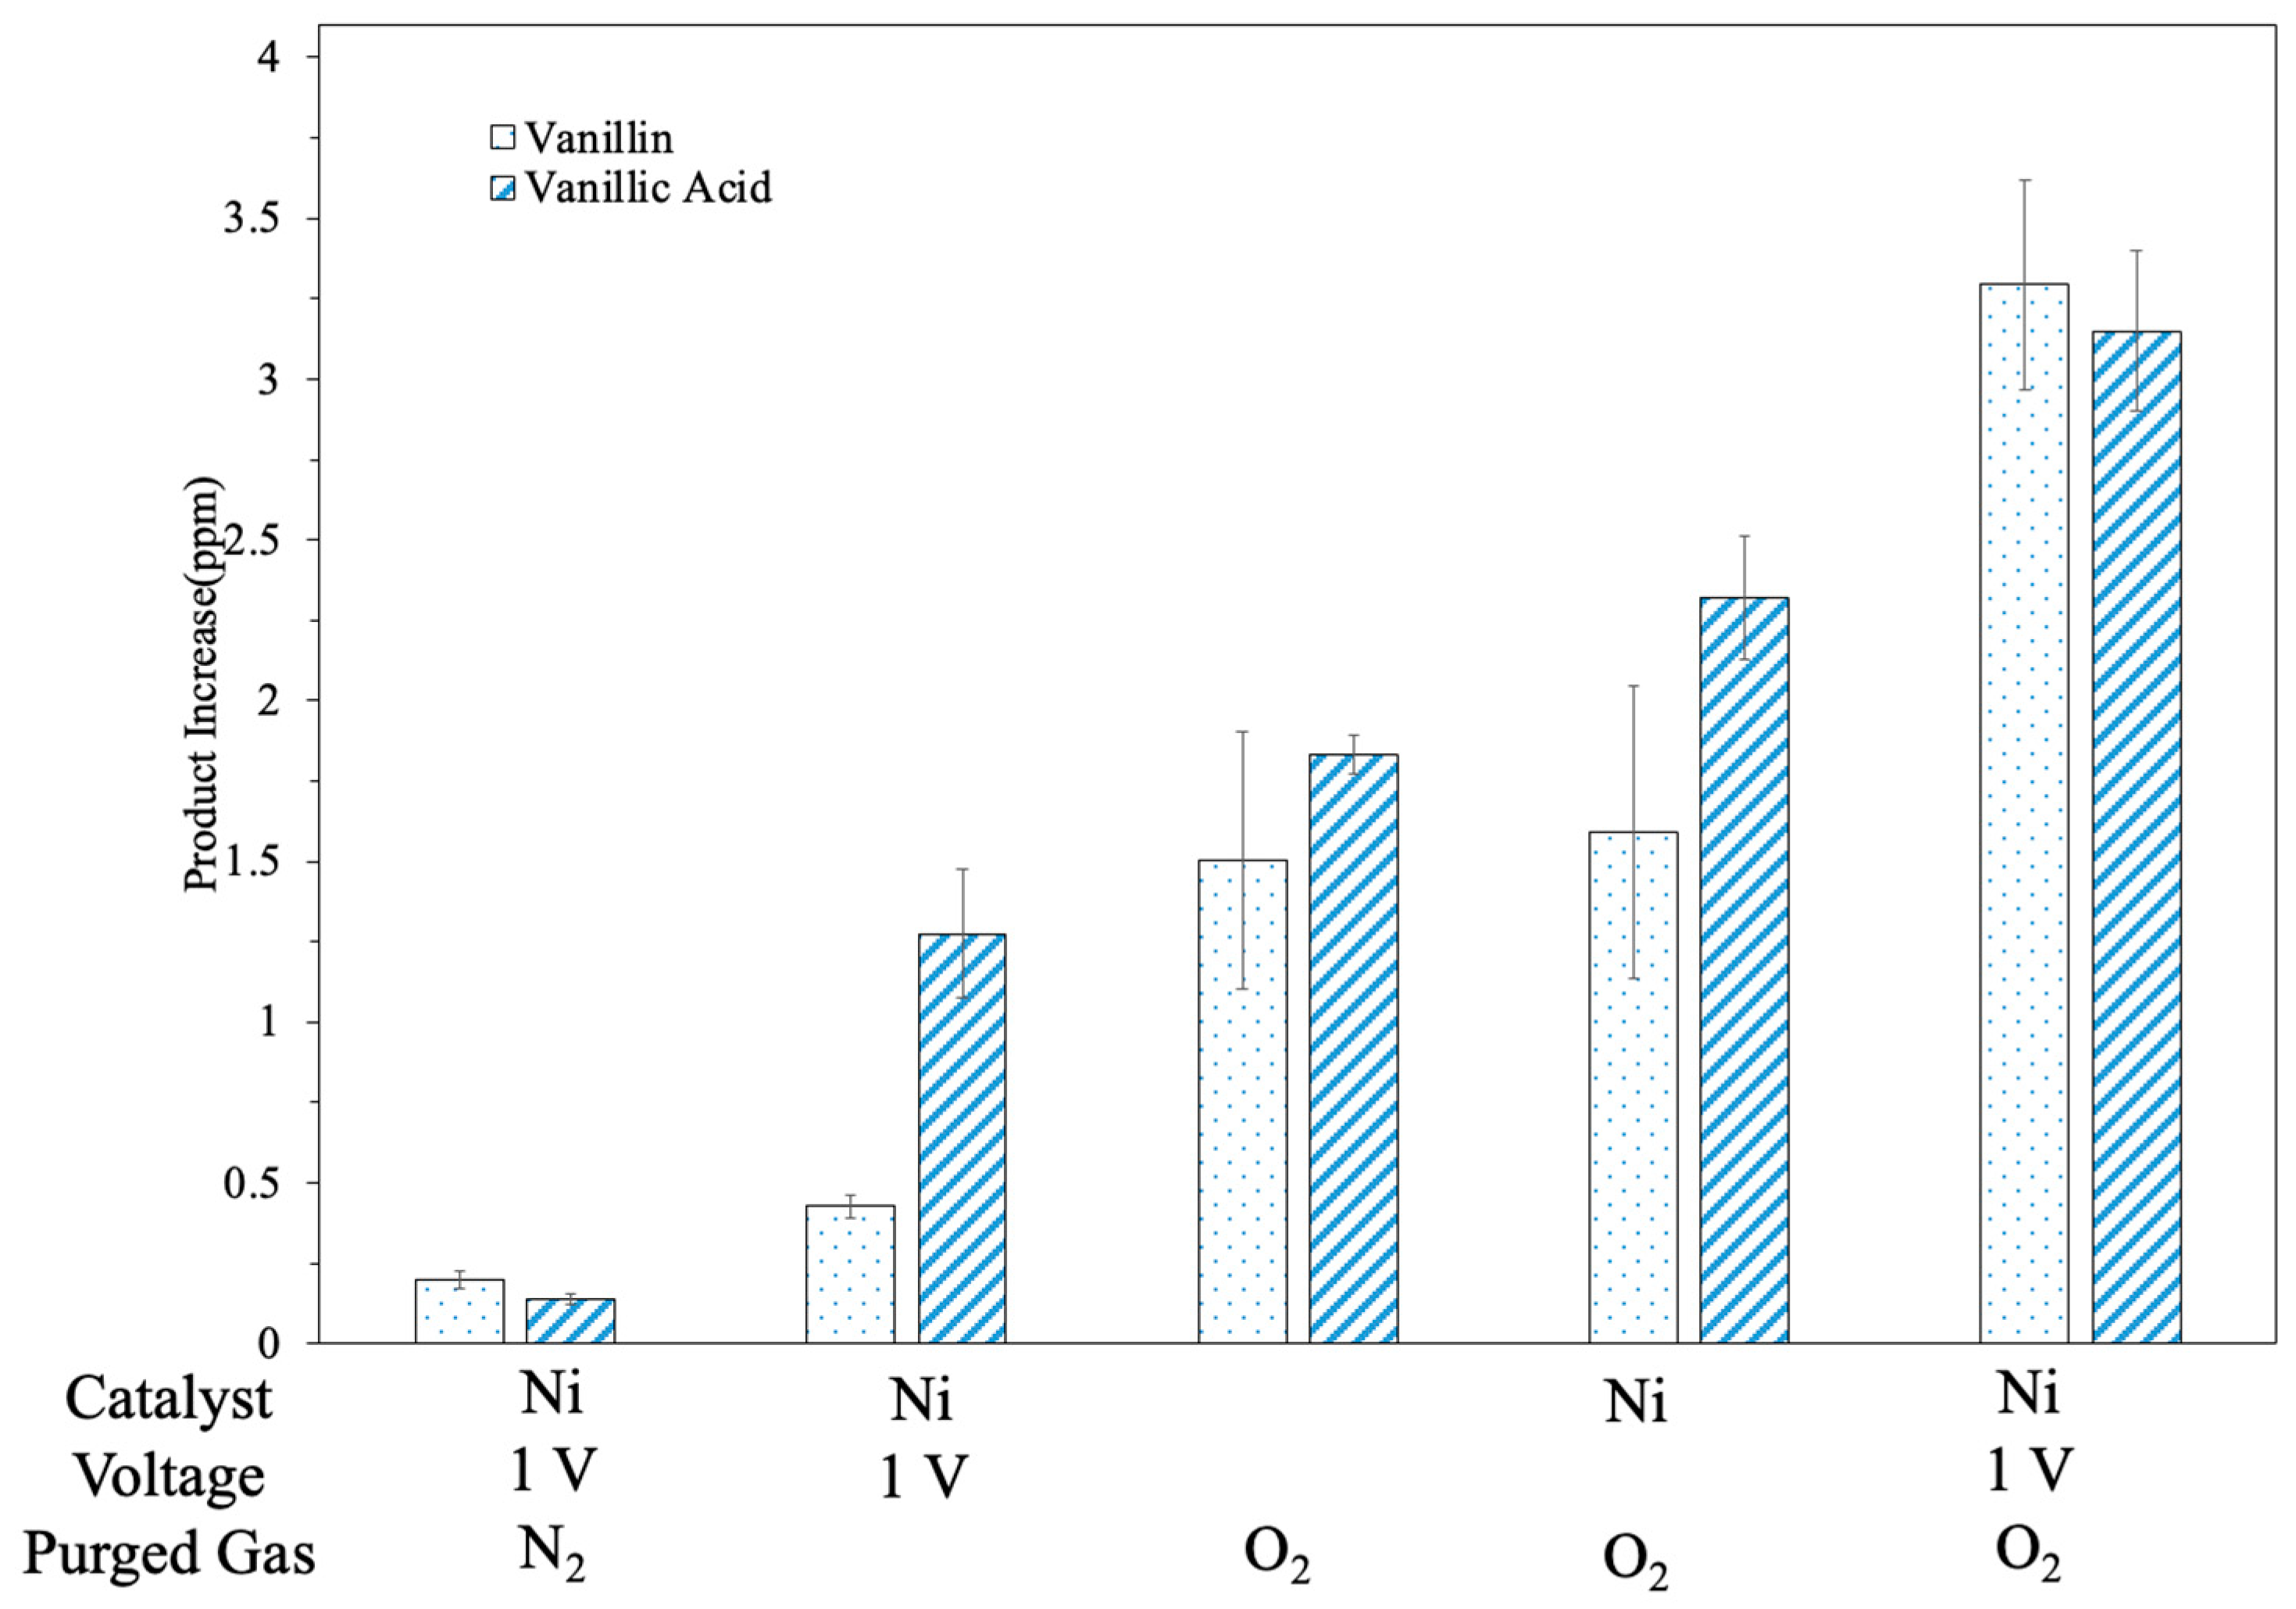
3.5. Effects from OER and Charge Efficiency
4. Conclusions
Supplementary Materials
Author Contributions
Funding
Data Availability Statement
Acknowledgments
Conflicts of Interest
References
- Dale, B.E. ‘Greening’ the chemical industry: Research and development priorities for biobased industrial products. J. Chem. Technol. Biotechnol. 2003, 78, 1093–1103. [Google Scholar] [CrossRef]
- Patel, P.; Schwartz, D.; Wang, X.; Lin, R.; Ajao, O.; Seifitokaldani, A. Technoeconomic and Life-Cycle Assessment for Electrocatalytic Production of Furandicarboxylic Acid. ACS Sustain. Chem. Eng. 2022, 10, 4206–4217. [Google Scholar] [CrossRef]
- Du, X.; Zhang, H.; Sullivan, K.P.; Gogoi, P.; Deng, Y. Electrochemical Lignin Conversion. ChemSusChem 2020, 13, 4318–4343. [Google Scholar] [CrossRef] [PubMed]
- Rinaldi, R.; Jastrzebski, R.; Clough, M.T.; Ralph, J.; Kennema, M.; Bruijnincx, P.C.A.; Weckhuysen, B.M. Paving the Way for Lignin Valorisation: Recent Advances in Bioengineering, Biorefining and Catalysis. Angew. Chem. Int. Ed. 2016, 55, 8164–8215. [Google Scholar] [CrossRef] [PubMed]
- Pettersson, K.; Harvey, S. CO2 emission balances for different black liquor gasification biorefinery concepts for production of electricity or second-generation liquid biofuels. Energy 2010, 35, 1101–1106. [Google Scholar] [CrossRef]
- Ajao, O.; Benali, M.; Faye, A.; Li, H.; Maillard, D.; Ton-That, M.T. Multi-product biorefinery system for wood-barks valorization into tannins extracts, lignin-based polyurethane foam and cellulose-based composites: Techno-economic evaluation. Ind. Crops Prod. 2021, 167, 113435. [Google Scholar] [CrossRef]
- Garedew, M.; Lin, F.; Song, B.; DeWinter, T.M.; Jackson, J.E.; Saffron, C.M.; Lam, C.H.; Anastas, P.T. Greener Routes to Biomass Waste Valorization: Lignin Transformation Through Electrocatalysis for Renewable Chemicals and Fuels Production. ChemSusChem 2020, 13, 4214–4237. [Google Scholar] [CrossRef]
- Chatel, G.; Rogers, R.D. Review: Oxidation of Lignin Using Ionic Liquids—An Innovative Strategy To Produce Renewable Chemicals. ACS Sustain. Chem. Eng. 2014, 2, 322–339. [Google Scholar] [CrossRef]
- Luo, J.; Liu, T.L. Electrochemical valorization of lignin: Status, challenges, and prospects. J. Bioresour. Bioprod. 2023, 8, 1–14. [Google Scholar] [CrossRef]
- Cabral Almada, C.; Kazachenko, A.; Fongarland, P.; Da Silva Perez, D.; Kuznetsov, B.N.; Djakovitch, L. Supported-Metal Catalysts in Upgrading Lignin to Aromatics by Oxidative Depolymerization. Catalysts 2021, 11, 467. [Google Scholar] [CrossRef]
- Zirbes, M.; Quadri, L.L.; Breiner, M.; Stenglein, A.; Bomm, A.; Schade, W.; Waldvogel, S.R. High-Temperature Electrolysis of Kraft Lignin for Selective Vanillin Formation. ACS Sustain. Chem. Eng. 2020, 8, 7300–7307. [Google Scholar] [CrossRef]
- Wu, K.; Cao, M.; Zeng, Q.; Li, X. Radical and (photo)electron transfer induced mechanisms for lignin photo- and electro-catalytic depolymerization. Green Energy Environ. 2023, 8, 383–405. [Google Scholar] [CrossRef]
- Li, C.; Zhao, X.; Wang, A.; Huber, G.W.; Zhang, T. Catalytic Transformation of Lignin for the Production of Chemicals and Fuels. Chem. Rev. 2015, 115, 11559–11624. [Google Scholar] [CrossRef]
- Ayub, R.; Raheel, A. High-Value Chemicals from Electrocatalytic Depolymerization of Lignin: Challenges and Opportunities. Int. J. Mol. Sci. 2022, 23, 3767. [Google Scholar] [CrossRef]
- Abdelaziz, O.Y.; Clemmensen, I.; Meier, S.; Bjelić, S.; Hulteberg, C.P.; Riisager, A. Oxidative Depolymerization of Kraft Lignin to Aromatics over Bimetallic V–Cu/ZrO2 Catalysts. Top. Catal. 2023, 66, 1369–1380. [Google Scholar] [CrossRef]
- Mansfield, S.D.; Kim, H.; Lu, F.; Ralph, J. Whole plant cell wall characterization using solution-state 2D NMR. Nat. Protoc. 2012, 7, 1579–1589. [Google Scholar] [CrossRef] [PubMed]
- Ghahremani, R.; Farales, F.; Bateni, F.; Staser, J.A. Simultaneous Hydrogen Evolution and Lignin Depolymerization using NiSn Electrocatalysts in a Biomass-Depolarized Electrolyzer. J. Electrochem. Soc. 2020, 167, 043502. [Google Scholar] [CrossRef]
- Zirbes, M.; Schmitt, D.; Beiser, N.; Pitton, D.; Hoffmann, T.; Waldvogel, S.R. Anodic Degradation of Lignin at Active Transition Metal-based Alloys and Performance-enhanced Anodes. ChemElectroChem 2019, 6, 155–161. [Google Scholar] [CrossRef]
- Movil, O.; Garlock, M.; Staser, J.A. Non-precious metal nanoparticle electrocatalysts for electrochemical modification of lignin for low-energy and cost-effective production of hydrogen. Int. J. Hydrogen Energy 2015, 40, 4519–4530. [Google Scholar] [CrossRef]
- Ghahremani, R.; Staser, J.A. Electrochemical oxidation of lignin for the production of value-added chemicals on Ni-Co bimetallic electrocatalysts. Holzforschung 2018, 72, 951–960. [Google Scholar] [CrossRef]
- Yan, K.; Zhang, Y.; Tu, M.; Sun, Y. Electrocatalytic Valorization of Organosolv Lignin Utilizing a Nickel-Based Electrocatalyst. Energy Fuels 2020, 34, 12703–12709. [Google Scholar] [CrossRef]
- Zhang, Y.-M.; Peng, Y.; Yin, X.-L.; Liu, Z.-H.; Li, G. Degradation of lignin to BHT by electrochemical catalysis on Pb/PbO2 anode in alkaline solution. J. Chem. Technol. Biotechnol. 2014, 89, 1954–1960. [Google Scholar] [CrossRef]
- Wang, Y.-S.; Yang, F.; Liu, Z.-H.; Yuan, L.; Li, G. Electrocatalytic degradation of aspen lignin over Pb/PbO2 electrode in alkali solution. Catal. Commun. 2015, 67, 49–53. [Google Scholar] [CrossRef]
- Liu, M.; Wen, Y.; Qi, J.; Zhang, S.; Li, G. Fine Chemicals Prepared by Bamboo Lignin Degradation through Electrocatalytic Redox between Cu Cathode and Pb/PbO2 Anode in Alkali Solution. ChemistrySelect 2017, 2, 4956–4962. [Google Scholar] [CrossRef]
- Jia, Y.; Wen, Y.; Han, X.; Qi, J.; Liu, Z.; Zhang, S.; Li, G. Electrocatalytic degradation of rice straw lignin in alkaline solution through oxidation on a Ti/SnO2–Sb2O3/α-PbO2/β-PbO2 anode and reduction on an iron or tin doped titanium cathode. Catal. Sci. Technol. 2018, 8, 4665–4677. [Google Scholar] [CrossRef]
- Cai, P.; Fan, H.; Cao, S.; Qi, J.; Zhang, S.; Li, G. Electrochemical conversion of corn stover lignin to biomass-based chemicals between Cu/NiMoCo cathode and Pb/PbO2 anode in alkali solution. Electrochim. Acta 2018, 264, 128–139. [Google Scholar] [CrossRef]
- Lan, C.; Fan, H.; Shang, Y.; Shen, D.; Li, G. Electrochemically catalyzed conversion of cornstalk lignin to aromatic compounds: An integrated process of anodic oxidation of a Pb/PbO2 electrode and hydrogenation of a nickel cathode in sodium hydroxide solution. Sustain. Energy Fuels 2020, 4, 1828–1836. [Google Scholar] [CrossRef]
- Bateni, F.; Ghahremani, R.; Staser, J.A. Electrochemical oxidative valorization of lignin by the nanostructured PbO2/MWNTs electrocatalyst in a low-energy depolymerization process. J. Appl. Electrochem. 2020, 51, 65–78. [Google Scholar] [CrossRef]
- McCrory, C.C.L.; Jung, S.; Peters, J.C.; Jaramillo, T.F. Benchmarking Heterogeneous Electrocatalysts for the Oxygen Evolution Reaction. J. Am. Chem. Soc. 2013, 135, 16977–16987. [Google Scholar] [CrossRef]
- Li, M.-F.; Sun, S.-N.; Xu, F.; Sun, R.-C. Ultrasound-enhanced extraction of lignin from bamboo (Neosinocalamus affinis): Characterization of the ethanol-soluble fractions. Ultrason. Sonochem. 2012, 19, 243–249. [Google Scholar] [CrossRef]
- Innocenti, M.; Zafferoni, C.; Lavacchi, A.; Becucci, L.; Di Benedetto, F.; Carretti, E.; Vizza, F.; Foresti, M.L. Electroactivation of Microparticles of Silver on Glassy Carbon for Oxygen Reduction and Oxidation Reactions. J. Electrochem. Soc. 2014, 161, D3018. [Google Scholar] [CrossRef]
- Wyantuti, S.; Hartati, Y.W.; Panatarani, C.; Tjokronegoro, R. Cyclic Voltammetric Study of Chromium (VI) and Chromium (III) on the Gold Nanoparticles-Modified Glassy Carbon Electrode. Procedia Chem. 2015, 17, 170–176. [Google Scholar] [CrossRef]
- Beliaeva, K.; Grimaldos-Osorio, N.; Ruiz-López, E.; Burel, L.; Vernoux, P.; Caravaca, A. New insights into lignin electrolysis on nickel-based electrocatalysts: Electrochemical performances before and after oxygen evolution. Int. J. Hydrogen Energy 2021, 46, 35752–35764. [Google Scholar] [CrossRef]
- Calvo-Flores, F.G.; Dobado, J.A. Lignin as Renewable Raw Material. ChemSusChem 2010, 3, 1227–1235. [Google Scholar] [CrossRef] [PubMed]
- Mathias, A.L.; Rodrigues, A.E. Production of Vanillin by Oxidation of Pine Kraft Lignins with Oxygen. Holzforschung 1995, 49, 273–278. [Google Scholar] [CrossRef]
- Alunga, K.R.; Ye, Y.-Y.; Li, S.-R.; Wang, D.; Liu, Y.-Q. Catalytic oxidation of lignin–acetoderivatives: A potential new recovery route for value-added aromatic aldehydes from acetoderivatives. Catal. Sci. Technol. 2015, 5, 3746–3753. [Google Scholar] [CrossRef]
- Valeriy Cherepakhin, T.J.W. Direct Oxidation of Primary Alcohols to Carboxylic Acids. Synthesis 2020, 53, 1023–1034. [Google Scholar] [CrossRef]
- Orozco, G.; Pérez, M.C.; Rincón, A.; Gutiérrez, C. Electrooxidation of methanol on silver in alkaline medium. J. Electroanal. Chem. 2000, 495, 71–78. [Google Scholar] [CrossRef]
- Karatok, M.; Sensoy, M.G.; Vovk, E.I.; Ustunel, H.; Toffoli, D.; Ozensoy, E. Formaldehyde Selectivity in Methanol Partial Oxidation on Silver: Effect of Reactive Oxygen Species, Surface Reconstruction, and Stability of Intermediates. ACS Catal. 2021, 11, 6200–6209. [Google Scholar] [CrossRef]
- Rekik, R.; Hamza, M.; Jaziri, M.; Abdelhedi, R. Electrochemical oxidation of vanillic acid by electro-Fenton process: Toward a novel route of protocatechuic acid electrosynthesis. Arab. J. Chem. 2020, 13, 357–365. [Google Scholar] [CrossRef]
- Stiefel, S.; Lölsberg, J.; Kipshagen, L.; Möller-Gulland, R.; Wessling, M. Controlled depolymerization of lignin in an electrochemical membrane reactor. Electrochem. Commun. 2015, 61, 49–52. [Google Scholar] [CrossRef]
- Lin, R.; Salehi, M.; Guo, J.; Seifitokaldani, A. High oxidation state enabled by plated Ni-P achieves superior electrocatalytic performance for 5-hydroxymethylfurfural oxidation reaction. Iscience 2022, 25, 104744. [Google Scholar] [CrossRef] [PubMed]
- Di Fidio, N.; Timmermans, J.W.; Antonetti, C.; Raspolli Galletti, A.M.; Gosselink, R.J.A.; Bisselink, R.J.M.; Slaghek, T.M. Electro-oxidative depolymerisation of technical lignin in water using platinum, nickel oxide hydroxide and graphite electrodes. New J. Chem. 2021, 45, 9647–9657. [Google Scholar] [CrossRef]


| Time (min) | Name | Structure |
|---|---|---|
| 10.20 | 2-Methoxy-4-vinylphenol |  |
| 12.15 | Homovanillyl alcohol | 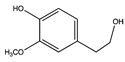 |
| 13.06 | Homovanillic acid |  |
| 13.32 | 2,4′-Dihydroxy-3′-methoxyacetophenone | 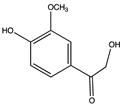 |
| Time (min) | Name | Structure |
|---|---|---|
| 7.88 | Guaiacol |  |
| 10.55 | 4-Acetoxybenzaldehyde OR Benzaldehyde, 4-hydroxy- | 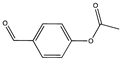 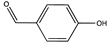 |
| 11.00 | Vanillin |  |
| 11.76 | Acetovanillone | 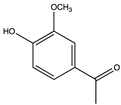 |
| 12.30 | Vanillic acid | 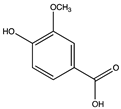 |
| Catalyst Type | Vanillin Apparent Yield from HPLC (ppm) | Vanillic Acid Apparent Yield (ppm) | CDL (F) | ECSA Normalized Vanillin Yield (g/h/F) | ECSA Normalized Vanillic Acid Yield (g/h/F) |
|---|---|---|---|---|---|
| Ni foam | 4.35 | 3.49 | 2 × 10⁻⁴ (R2 = 0.9973) | 2.088 | 1.6752 |
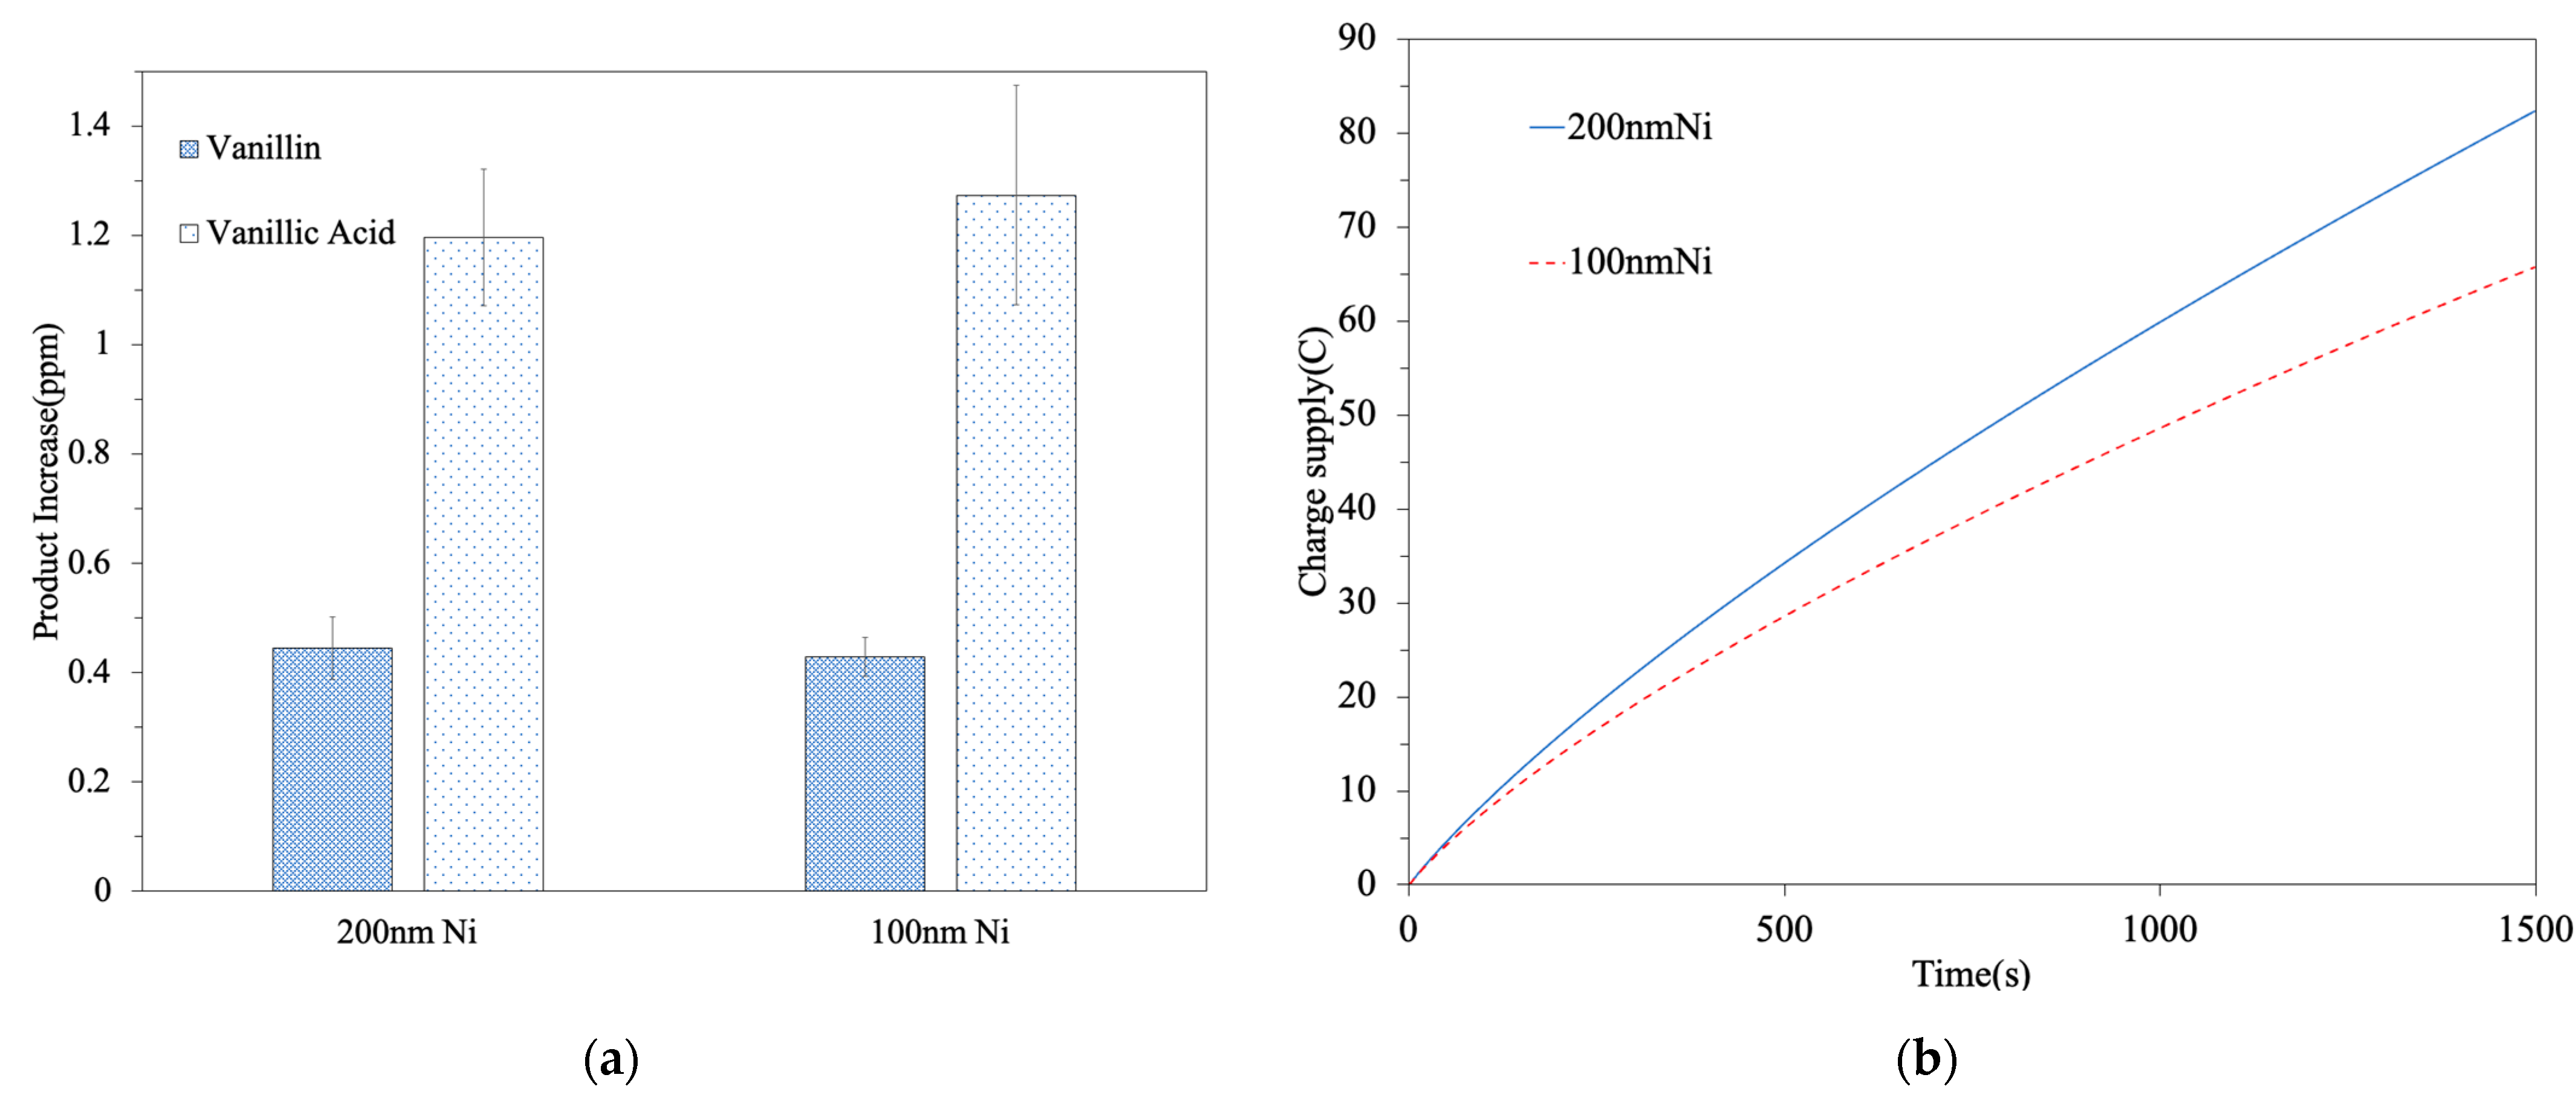
| 200 nm Ni | 0.44 | 1.19 | 8 × 10⁻⁵ (R2 = 0.9994) | 0.528 | 1.428 |
| 100 nm Ni | 0.43 | 1.28 | 4 × 10⁻⁵ (R2 = 0.9933) | 1.032 | 3.072 |
| Catalyst Type | Vanillin Apparent Yield from HPLC (ppm) | Vanillic Acid Apparent Yield (ppm) | Charge (C) | Vanillin Charge Efficiency (ppm/C) | Vanillic Acid Charge Efficiency (ppm/C) |
|---|---|---|---|---|---|
| Ni foam | 4.35 | 3.49 | 75 | 5.80 × 10⁻² | 4.65 × 10⁻² |
| 200 nm Ni | 0.44 | 1.19 | 82 | 5.41 × 10⁻³ | 1.45 × 10⁻² |
| 100 nm Ni | 0.43 | 1.28 | 65 | 6.58 × 10⁻³ | 1.95 × 10⁻² |
Disclaimer/Publisher’s Note: The statements, opinions and data contained in all publications are solely those of the individual author(s) and contributor(s) and not of MDPI and/or the editor(s). MDPI and/or the editor(s) disclaim responsibility for any injury to people or property resulting from any ideas, methods, instructions or products referred to in the content. |
© 2023 by the authors. Licensee MDPI, Basel, Switzerland. This article is an open access article distributed under the terms and conditions of the Creative Commons Attribution (CC BY) license (https://creativecommons.org/licenses/by/4.0/).
Share and Cite
Han, J.; Lin, R.; Salehi, M.; Farzi, A.; Carkner, A.; Liu, K.; Abou El-Oon, O.; Ajao, O.; Seifitokaldani, A. Kraft Lignin Electro-Oxidation under Ambient Temperature and Pressure. Energies 2023, 16, 8007. https://doi.org/10.3390/en16248007
Han J, Lin R, Salehi M, Farzi A, Carkner A, Liu K, Abou El-Oon O, Ajao O, Seifitokaldani A. Kraft Lignin Electro-Oxidation under Ambient Temperature and Pressure. Energies. 2023; 16(24):8007. https://doi.org/10.3390/en16248007
Chicago/Turabian StyleHan, Jiashuai, Roger Lin, Mahdi Salehi, Amirhossein Farzi, Andrew Carkner, Kefang Liu, Omar Abou El-Oon, Olumoye Ajao, and Ali Seifitokaldani. 2023. "Kraft Lignin Electro-Oxidation under Ambient Temperature and Pressure" Energies 16, no. 24: 8007. https://doi.org/10.3390/en16248007
APA StyleHan, J., Lin, R., Salehi, M., Farzi, A., Carkner, A., Liu, K., Abou El-Oon, O., Ajao, O., & Seifitokaldani, A. (2023). Kraft Lignin Electro-Oxidation under Ambient Temperature and Pressure. Energies, 16(24), 8007. https://doi.org/10.3390/en16248007