Article

Pyrolysis and Combustion Behavior of Flax Straw as Biomass: Evaluation of Kinetic, Thermodynamic Parameters, and Qualitative Analysis of Degradation Products

1
Department of Chemical and Biological Engineering, University of Saskatchewan, 57 Campus Drive, Saskatoon, SK S7N 5A9, Canada
2
Prairie Clean Energy, 2221 Cornwall Street, Regina, SK S4P 0X9, Canada
*
Author to whom correspondence should be addressed.
Energies 2023, 16(19), 6932; https://doi.org/10.3390/en16196932
Submission received: 8 September 2023 / Revised: 25 September 2023 / Accepted: 29 September 2023 / Published: 2 October 2023
(This article belongs to the Special Issue Green Technologies in Environment and Energy)

Abstract

:
This study describes an investigation of the pyrolysis and combustion of flax straw as biofuel, focusing on the physicochemical properties and kinetic and thermodynamic parameters, and evaluates the type of degradation products using the thermogravimetry analysis–Fourier transform infrared spectroscopy (TGA-FTIR) technique. Pyrolysis and combustion processes were studied via thermogravimetric analysis at different heating rates of 5-10-15 and 20 °C min, one using three isoconversional methods and one using a model-fitting method. The activation energies, frequency factors, and thermodynamic parameters of flax straw biomass were investigated using different models. The obtained activation energy values for pyrolysis varied between 101.0 and 109.6 kJ mol−1 and for combustion were between 203.3 and 239.2 kJ mol−1. The frequency factors were determined to be 1.7 × 10⁹ for pyrolysis and 1.5 × 10¹⁷ s−1 for combustion. The change in Gibbs free energy (ΔG) for the pyrolysis of flax straw was calculated to be 162.6 kJ mol−1, whereas for combustion it increased to 203.9 kJ mol−1. A notable contrast between the volatiles produced by pyrolysis and combustion is evident from the real-time analysis of the degradation products. Specifically, carboxylic acids, aromatics, alkanes, and alcohols are the principal degradation products during pyrolysis, while carbon dioxide is the primary component produced during combustion. These encouraging research outcomes regarding flax straw pyrolysis and combustion can broaden its application in bioenergy and biofuel, thus contributing significantly to it for resource recovery.

Graphical Abstract

1. Introduction

The world’s dependence on fossil fuels has led to many environmental issues, including climate change and pollution [1,2,3]. The use of renewable energy sources like biomass can significantly reduce the negative impact of fossil fuels on the environment [4]. Biomass refers to any organic material that is available on a renewable or recurring basis, such as plants, trees, crops, and waste materials [5]. There are various types of biomass available, including agricultural residues, wood and wood residues, forestry residues, municipal solid waste, and industrial waste. Each type of biomass has its own unique characteristics, which may affect its suitability for energy production [6]. Biomass is considered a sustainable and renewable energy source as it derives from organic materials that can be replenished quickly, unlike non-renewable fossil fuels [7].
Flax straw is an abundant agricultural waste material in Saskatchewan, Canada, with a vast agricultural land area of 77.3 million hectares that yields considerable quantities of biomass residues [8]. The province’s annual production rate of approximately 750 thousand tons in 2020 has made it one of the leading exporters of flax straw, a promising renewable energy feedstock; optimal utilization of this resource could significantly reduce fossil fuel consumption, subsequently leading to a decrease in greenhouse gas emissions as well instead of letting it go to waste [8]. In addition to reducing waste production in the province, this would also provide a renewable and sustainable source of energy [9]. Due to nonrenewable energy sources’ negative impact on the environment and fossil fuels’ finite availability, renewable energy sources have gained increasing attention over the past decade [10]. Various thermochemical conversion processes, such as pyrolysis, gasification, and combustion, can be used to convert lignocellulosic biomass into bio-oils, char, gaseous fuels, and other products [11,12]. The intricate and diverse composition of biomass presents a challenge as various reactions can take place during the conversion process, and the degree of these reactions is dependent on numerous parameters and conditions [13]. Therefore, studying the thermal decomposition kinetics of biomass is crucial to finding the mechanism of the process, predict the conversion of it, and optimize reactor system design for efficient conversion [14].
Pyrolysis and combustion are advanced bioenergy conversion technologies that utilize thermochemical conditions to convert solid biomass waste rapidly and efficiently into high-energy-density fuel products or materials [15]. A range of useful products, including bio-oil, char, and biogases, are produced through the transformation of solid biomass waste by these processes [16,17]. TGA is a widely accepted and commonly used analytical technique for studying the thermal decomposition of materials, including the pyrolysis and combustion of biomass. It is particularly useful when heat and mass transfer effects are minimal as it provides comprehensive information on the material’s thermal stability, reaction mechanism, decomposition kinetics, and compositional analysis [18,19]. Non-isothermal analysis methods, which utilize temperature programming, have gradually become the primary means of thermal analysis kinetics due to their simplicity and reduced time consumption when compared to isothermal analysis methods [20]. Additionally, non-isothermal techniques with short intervals were found to yield more accurate results. They enable the assessment of kinetics over a broad temperature range in a continuous manner [21]. Kinetic methods for studying non-isothermal solid-state reactions can be divided into two categories: isoconversional methods and model-fitting methods [22]. Among these, isoconversional methods are preferred over model-fitting methods as they can directly calculate the activation energy of the reaction without assuming the mechanism function, and avoiding errors caused by different mechanism function assumptions [23,24].
There exist several models for isoconversional (model-free) kinetics, including differential and integral methods. Among these models, the Friedman, Kissinger–Akahira–Sunose (KAS), and Ozawa–Flynn–Wall (OFW) methods are the most commonly used [25,26]. For calculating the kinetic thermodynamic parameters of pyrolysis reactions, the distributed activation energy model (DAEM) is a widely used model-fitting method that explains the entire reaction process [27,28,29]. Based on previous research, the DAEM is considered to be the best model for describing the devolatilization process of biomass [30]. To study the thermal decomposition behavior and composition of degradation products, the combination of TGA and FTIR as a powerful technique for tracking the gases generated during the pyrolysis and combustion of flax straw was used [31,32]. By combining these two techniques, it is possible to monitor the changes in gas composition as the sample is heated, providing information about the pyrolysis or combustion process and the composition of the resulting gases [33]. This information can be used to optimize the conditions and develop more efficient biomass conversion processes [34].
This paper aims to explore the pyrolysis and combustion characteristics of flax straw and is a unique combination of kinetic, thermodynamic parameters, and evolved gas analysis. To achieve this, we utilized a thermogravimetric analyzer coupled with a Fourier transform infrared spectrometer (TGA-FTIR). To estimate the kinetic parameters, three methods were employed, including Friedman, KAS, and OFW as the model-free methods and DAEM as the model-fitting method. The reliability and applicability of the calculated kinetic parameters were evaluated using a master plot and we compared them with the experimental data. An evaluation was carried out to compare the outcomes of various models utilized for biomass materials derived from agriculture and wood. Furthermore, we employed the TGA-FTIR technique to characterize the volatile products released during pyrolysis and combustion. This study is expected to significantly contribute to the effective utilization of flax straw as a biofuel source in the future.

2. Materials and Methods

2.1. Materials

A bail of flax straw obtained from a local farmer near Saskatoon, Saskatchewan Province, Canada, was used in this work. The flax straw was ground using a Vevor electric grain mill grinder (Canada) and sieved using a 20-mesh sieve. All chemicals were bought from Sigma Aldrich (Oakville, ON, Canada) and used without further purification.

2.2. Methods

2.2.1. Physicochemical Characterization

The flax straw sample was analyzed for its moisture and ash contents in accordance with ASTM D 22866. The moisture analysis (Mettler Toledo, Mississauga, ON, Canada, Model: DSH-50A-10) involved drying ~5 g of the biomass sample at 105 ± 5 °C to reach a constant weight. The Ash content was analyzed using a muffle furnace at 650 °C for 3 h. The volatile matter was determined by burning a sample of biomass in a crucible at 950 °C for 7 min in a muffle furnace, as per ASTM D 3175. The CHNS contents were analyzed using an elementary analyzer (Elementar, Vario, New York, NY, USA). The fixed carbon (FC) and oxygen (O) contents were calculated using Equations (1) and (2), respectively [35]:
FC (%) = 100 − (Volatile + Moisture + Ash)
O (%) = 100 − (Ash + Sulfur + Nitrogen + Hydrogen + Carbon)
The bulk density was obtained using a graduated cylinder and an analytical balance as per ASTM D7263. The higher heating value (HHV) was calculated using Equation (3).
HHV = −4.6246 + 0.2732 N + 0.4120 C + 0.5992 H + 0.01841 O
The chemical composition of the ash was determined using energy dispersive X-ray fluorescence (EDXRF) spectroscopy (Bruker, S2 PUMA), equipped with a Pd anode X-ray tube (50 W), and we also used a Peltier cooled silicon drift detector. The chemical composition of flax straw (Cellulose, Hemicellulose, Lignin and Extractives) was determined as per the Chinese wet chemical component test standard (GB/T5889-86) [36].
The thermogravimetric analysis (TGA) of biomass was performed using a Perkin Elmer (Edmonton, AB, Canada), Thermogravimetric Analyzer, TGA 8000, in a continues atmosphere of N2 (purity 99.99%) for pyrolysis and air for combustion at a flow rate of 30 mL min−1 with four different heating rates of 5, 10, 15, and 20 °C min−1, while ~15 mg of sample was loaded. The temperature range was from 50 °C to 750 °C for all the samples.
Attenuated total reflection Fourier transform infrared spectroscopy (ATR FT-IR) was obtained by a Perkin Elmer, FT-IR/NIR Spectrometer, Spectrum 3 apparatus combined with an ATR unit. The analysis was conducted at a resolution of 4 cm−1 for 256 scans in the range from 4000 to 650 cm−1. The samples were placed against the diamond crystal of the ATR device and a pressure applicator with a torque knob to ensure that the pressure applied was consistent for all the measurements. To analyze the evolved gases during the pyrolysis or combustion of flax straw, the TGA analyzer was coupled with an FT-IR using a Perkin Elmer, TGA-IR-GC/MS Interface, TL 9000e. To prevent the condensation of volatile compounds from pyrolysis, the TGA and FTIR devices were connected by a heated line at 270 °C. The sample was heated from 50 to 800 °C at a heating rate of 10 °C min−1 under N2 or air with a gas flow rate of 30 mL min−1. The FTIR spectra of the gaseous products were continuously recorded every ~4.5 s in the spectral region from 4000 to 650 cm−1.
13C-NMR was recorded using a Bruker AVANCE III HD spectrometer. A 4 mm DOTY CP-TOSS (Cross-Polarization Total Sideband Superposition) was used with a spinning speed of 7.5 kHz operating at 125.77 MHz, while the 1H-NMR frequency was 500 MHz. A proton 90° pulse of 5 μs was applied with a contact time of 1 ms and a ramp pulse on the proton channel. The spectra were acquired with 2000–4000 scans and a recycling delay of 2 s. All spectra were referenced externally to adamantane at 38.48 ppm. The SPINAL-64 1H decoupling sequence was applied with a frequency of 50 kHz during the acquisition.

2.2.2. Kinetic Analysis

Three methods were selected to study the kinetics of pyrolysis and combustion, including Friedman, Ozawa–Flynn–Wall (OFW), and Kissinger–Akahira–Sunose (KAS), which are summarized in Table 1 [37].
The definition of the parameters in Table 1 is as follows: β is the heating rate; α is the conversion of flax straw, and these are explained via Equation (4):
α = m 0 m t m 0 m f
where m0, mt, and mf are the initial mass, mass at a specific time, and final mass. The reaction rate is explained by the Arrhenius equation (Equation (5)):
k = A   e E a R T
where k is the reaction rate, A is the frequency factor (min −1), Ea is the activation energy (KJ mol−1) of the pyrolysis or combustion process, R is the gas constant (8.314 J mol−1 K−1), and T is the temperate (K).
The master plot method for studying the mechanism of pyrolysis or combustion is founded on the Criado method [38], which employs Equation (6) as follows:
Z x = d x d t β   P x T
where x = E/RT and P(x) are the temperature integrals, as described by Senum and Yang approximation [39]. According to Equation (7), the master curve was obtained as a function of the conversion value using the modified models listed in Table S3 [40].
Z x = f x   ×   g x
Combining Equations (6) and (7) gives:
Z x = d x d t   ×   E a R   ×   P x   ×   e E a R T
The reaction mechanism is investigated using Equation (8).

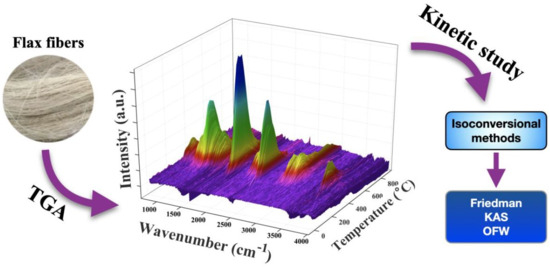
2.2.3. Pyrolysis and Combustion Characteristics

Pyrolysis characteristics refer to the maximum temperature of pyrolysis in the TG curve (Tmax), maximum rate of change in the weight in the DTG curve (DTGmax), and the residue percent that are obtained by analyzing the TGA and DTG profiles of the pyrolysis process. The combustion characteristics include ignition temperature, burnout temperature, and combustion characteristic index, which are derived by the investigation of the TGA and DTG curve of combustion. Figure S1 in Supplementary Information demonstrates the determination of ignition and burnout temperature using the TGA-DTG curves. The method involves plotting a vertical line through the sharpest point of the DTG curve to meet the TG curve, followed by creating a tangent line to the intersection. The ignition temperature is recorded as the temperature corresponding to the intersection of the tangent and upper horizontal line (at the point where the TG curve begins to lose weight). Similarly, the burnout temperature is recorded as the temperature corresponding to the intersection of the tangent and the lower horizontal blue line (at the end of weight loss of the TG curve) [41].
For thermodynamic analysis, the following thermodynamic factors were evaluated: change in Gibbs free energy (ΔG), change in Enthalpy (ΔH), change in Entropy (ΔS), and the frequency factor via Equations (9)–(11). These factors were analyzed and assessed to better understand their impact on and role in the underlying system [42].
A = δ   ×   E   ×   e E R T p R T p 2
ΔH = ERTp
Δ G = E · R · T P · l n K B   T p A   h
where E is the activation energy, A is the frequency factor (s−1), Tp is the peak temperature (K), h is the Plank constant (6.626 × 10⁻³⁴ m2 kg s−1), and KB is the Boltzman constant (1.381 × 10⁻²³ m2 kg s−2 K−1).

3. Results and Discussion

3.1. Characterization of Flax Straw

3.1.1. Physicochemical Properties

Table 2 summarizes the results of proximate, ultimate, biochemical compositional, and ash analysis for flax straw samples [43]. The biomass has a high volatile matter (VM) content of 83.5 wt %, which can result in faster and more complete combustion, leading to higher energy output and lower emissions; however, this may require specialized storage and transportation methods to avoid safety hazards and reduce losses [35]. The results show an acquired moisture content of 5.1%. This low moisture content (<10%) makes the biomass adequate for pyrolysis and combustion purposes [44].
Ash content is an important parameter in determining the heating value of biomass, as a lower ash content is directly proportional to a higher heating value [45,46,47]. The type of biomass, geographical location, and cultivation practices affect the ash content. The mineral composition of biomass determines the ash content. The biomass sample under investigation exhibits an ash content of 5.4%, which falls within the typical range observed for agricultural biomass and indicates a substantial mineral content [48].
The fixed carbon content (FC) of the biomass is a critical component of biomass since it determines the potential energy output that can be harnessed from the material [49]. It depends on a variety of factors, including biomass type, maturity stage, and processing [50]. For the flax straw sample, the FC was 6.5%, in agreement with the results of previous studies [51]. The high volatile matter to fixed carbon ratio (VM/FC) of the sample (12.8%) makes the sample a desirable fuel as it will combust more easily and produce more energy.
The sample’s ultimate analysis reveals that carbon constitutes the highest percentage (46.4%) among the elements present, surpassing oxygen (41.7%) and hydrogen (6.1%). Additionally, the content of nitrogen (N) is low (0.5%), as is the sulfur (S) content (0.1%). Consequently, the emission of air pollutant gases such as nitrogen oxides (NOx) and sulfur oxides (SOx) from the evolved volatile material after pyrolysis or combustion is negligible. This characteristic not only contributes to environmental benefits but also reduces the risk of corrosion in gasifiers [52]. Based on the results of the proximate analysis, the calculated higher heating value (HHV) of the sample is consistent with previous reports [53]. This can be attributed to the low oxygen-to-carbon (O/C) ratio of 1.0 and hydrogen-to-carbon (H/C) ratio of 0.1, indicating a favorable biofuel quality. The HHV reflects the amount of heat energy released per unit mass during complete combustion of the biomass [53].
Elemental analysis of ash shows the presence of K (26.1%), Ca (19.9%), and Si (37.2%) as the main elements, and traces of other elements like magnesium, phosphorus, and chlorine, which predict a basic ash (See Supporting Information) for the full list of elements in Table S1). This analysis is important because it provides information on the mineral composition of the ash and its potential use as a fertilizer or soil amendment.
The biochemical composition of the sample included cellulose, hemicellulose, and lignin (49.4, 19.7, and 20.5 wt %) in the ranges expected for an agricultural biomass. The extractives content (phenols, tannins, sugars, alkaloids, etc.) was 8.5 wt %, showing that it is expected to have low liquids during pyrolysis or combustion.

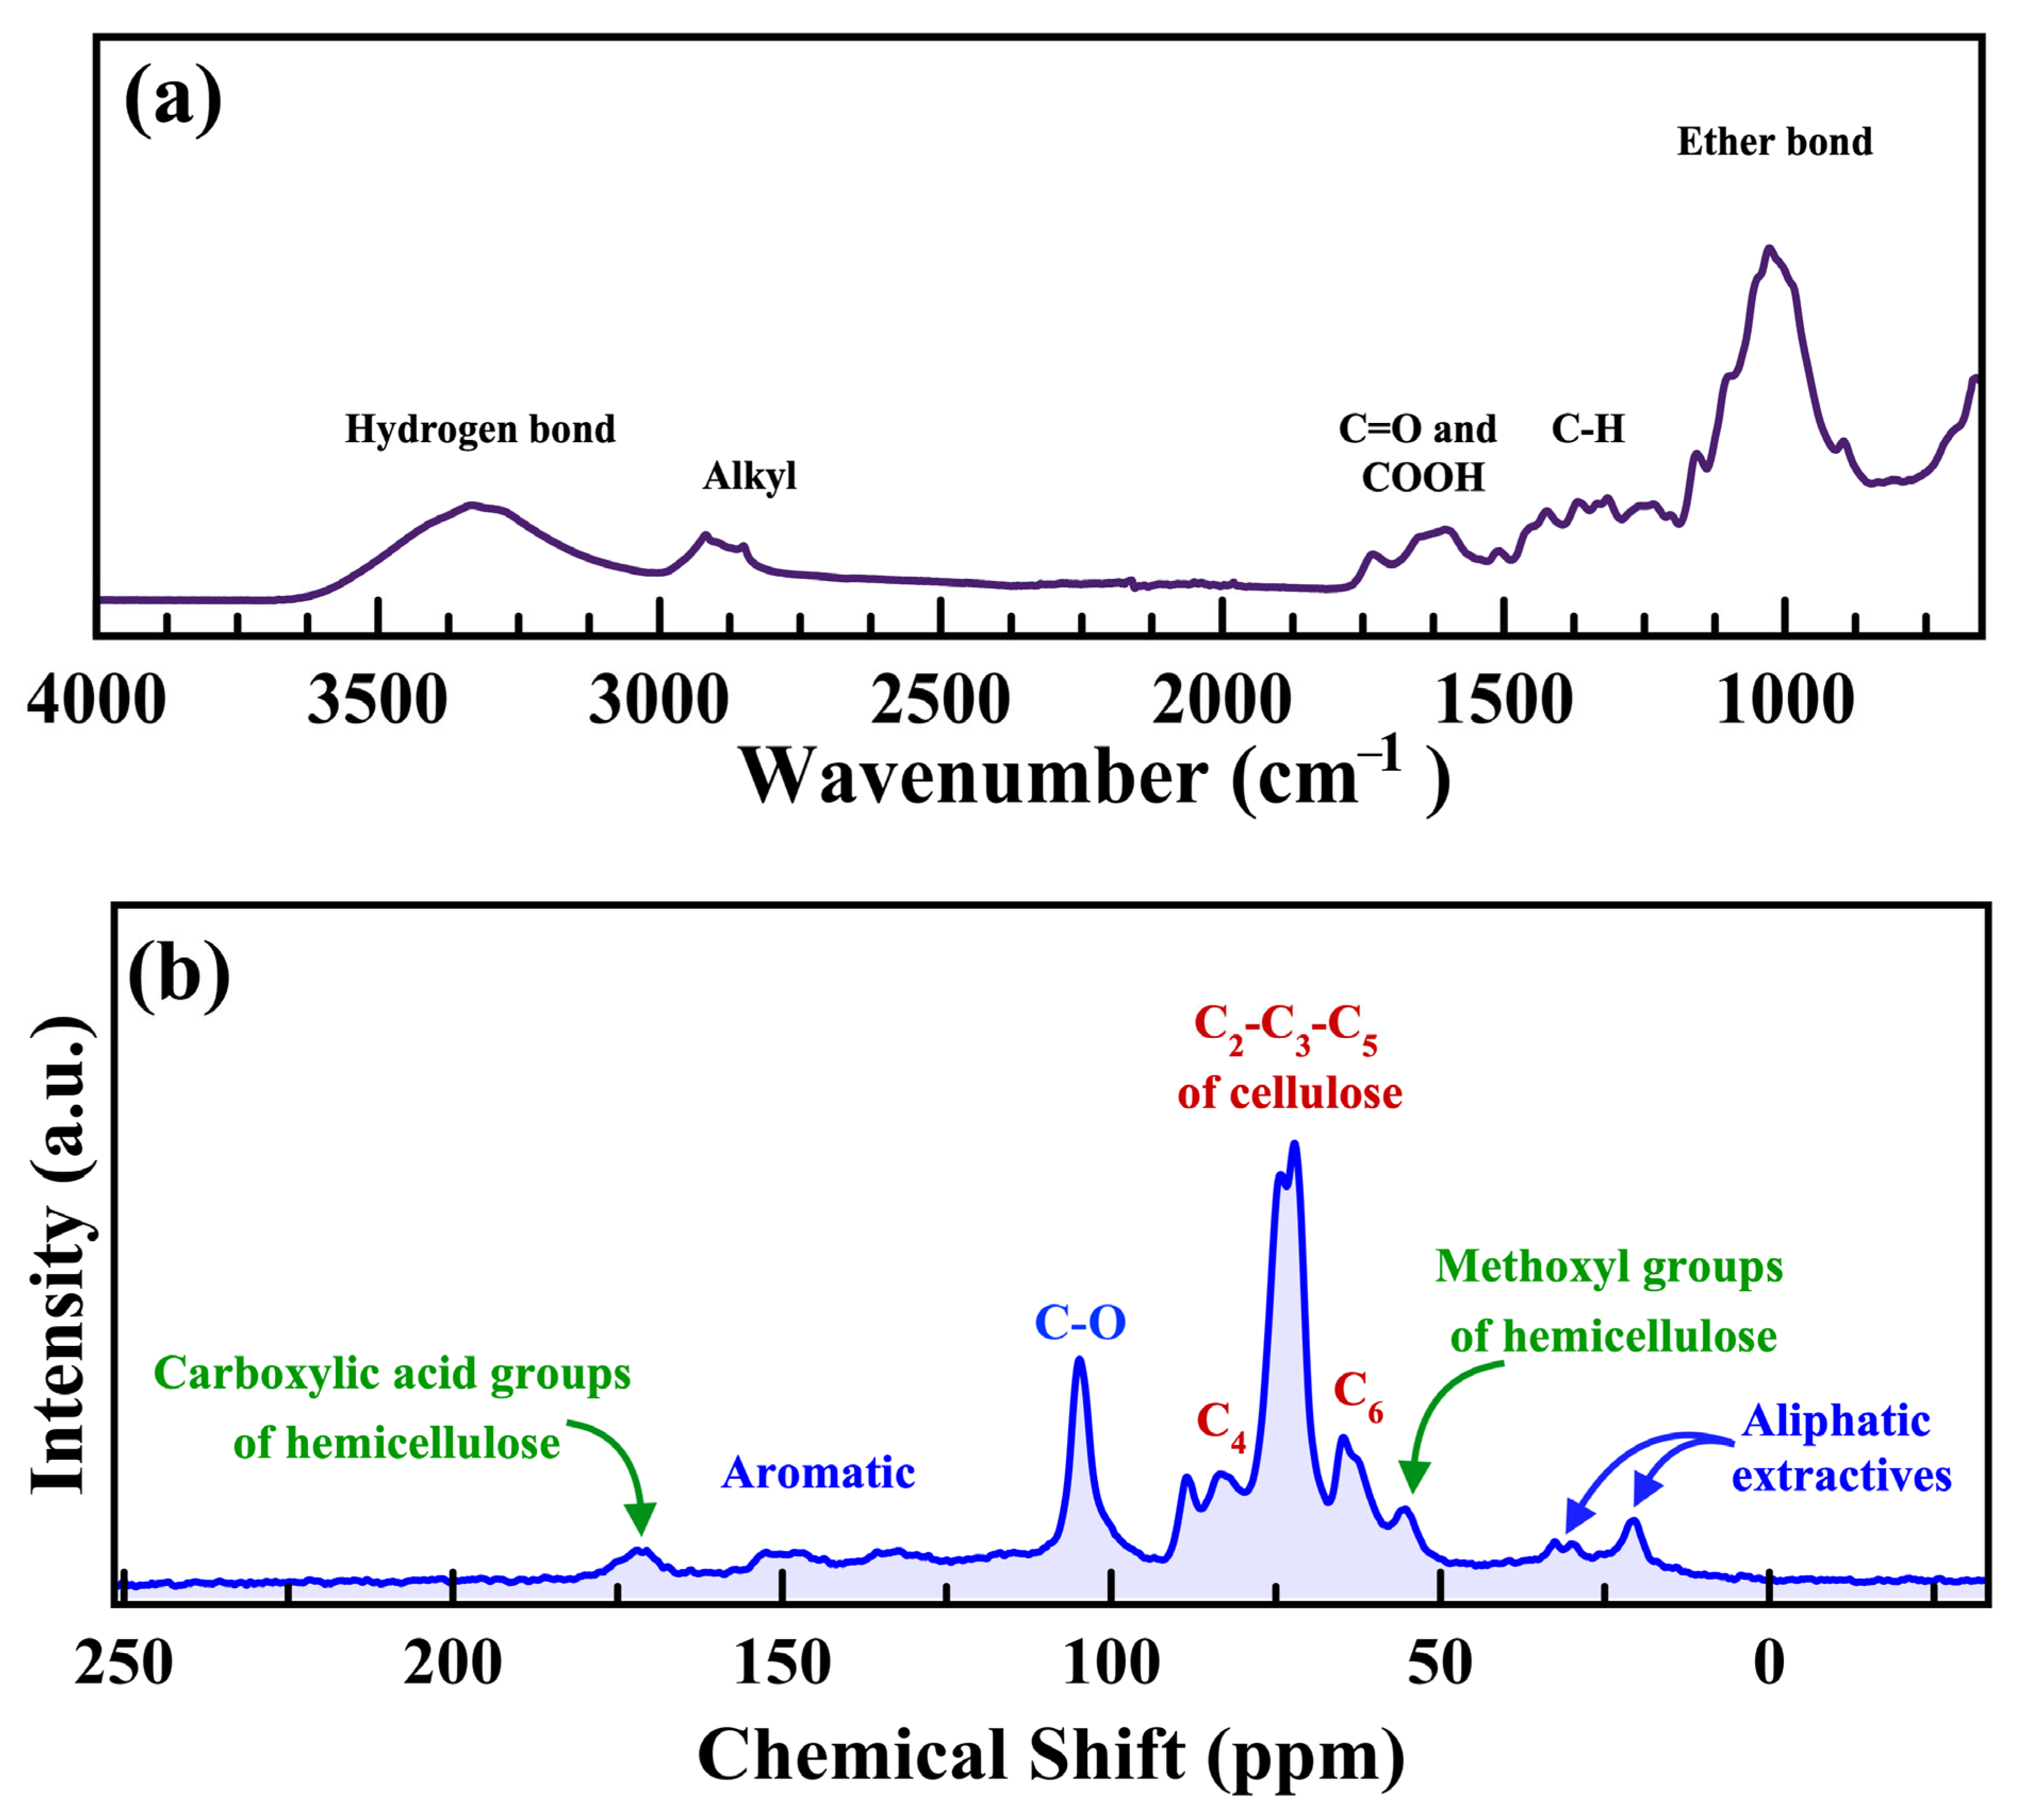
3.1.2. ATR FT-IR and 13C NMR Analysis

Figure 1 displays the ATR FT-IR and 13C NMR spectrum of flax straw. As anticipated in the FT-IR spectrum (Figure 1a), the broad signature of the hydrogen bond of –OH functional groups is obvious at 3000–3500 cm−1. Other features include weak IR bands near 2900 cm−1 related to C-H stretching, 1700 cm−1 to carbonyl and carboxylic acid groups, 1370 cm−1 to –CH and –CHOH, and 1160 cm−1 to C-O-C stretching [54]. The 13C NMR spectra of the biomass sample represented in Figure 1b consists of eight main signatures that appear between 20 and 180 ppm. The chemical shift (δ) values of 13C NMR signals are as follows: aliphatic extractives (20–25 ppm), methoxy groups of hemicellulose (55–60 ppm), C2-3-5 of cellulose (70 ppm) and C4 of cellulose (80–85 ppm), Ether bonds (110 ppm), aromatic groups (125–145 ppm), and carboxylic acid groups of hemicellulose (170 ppm) [55,56]. These results preliminarily support the biochemical composition analysis of the flax straw biomass and are consistent with prior reports [35].

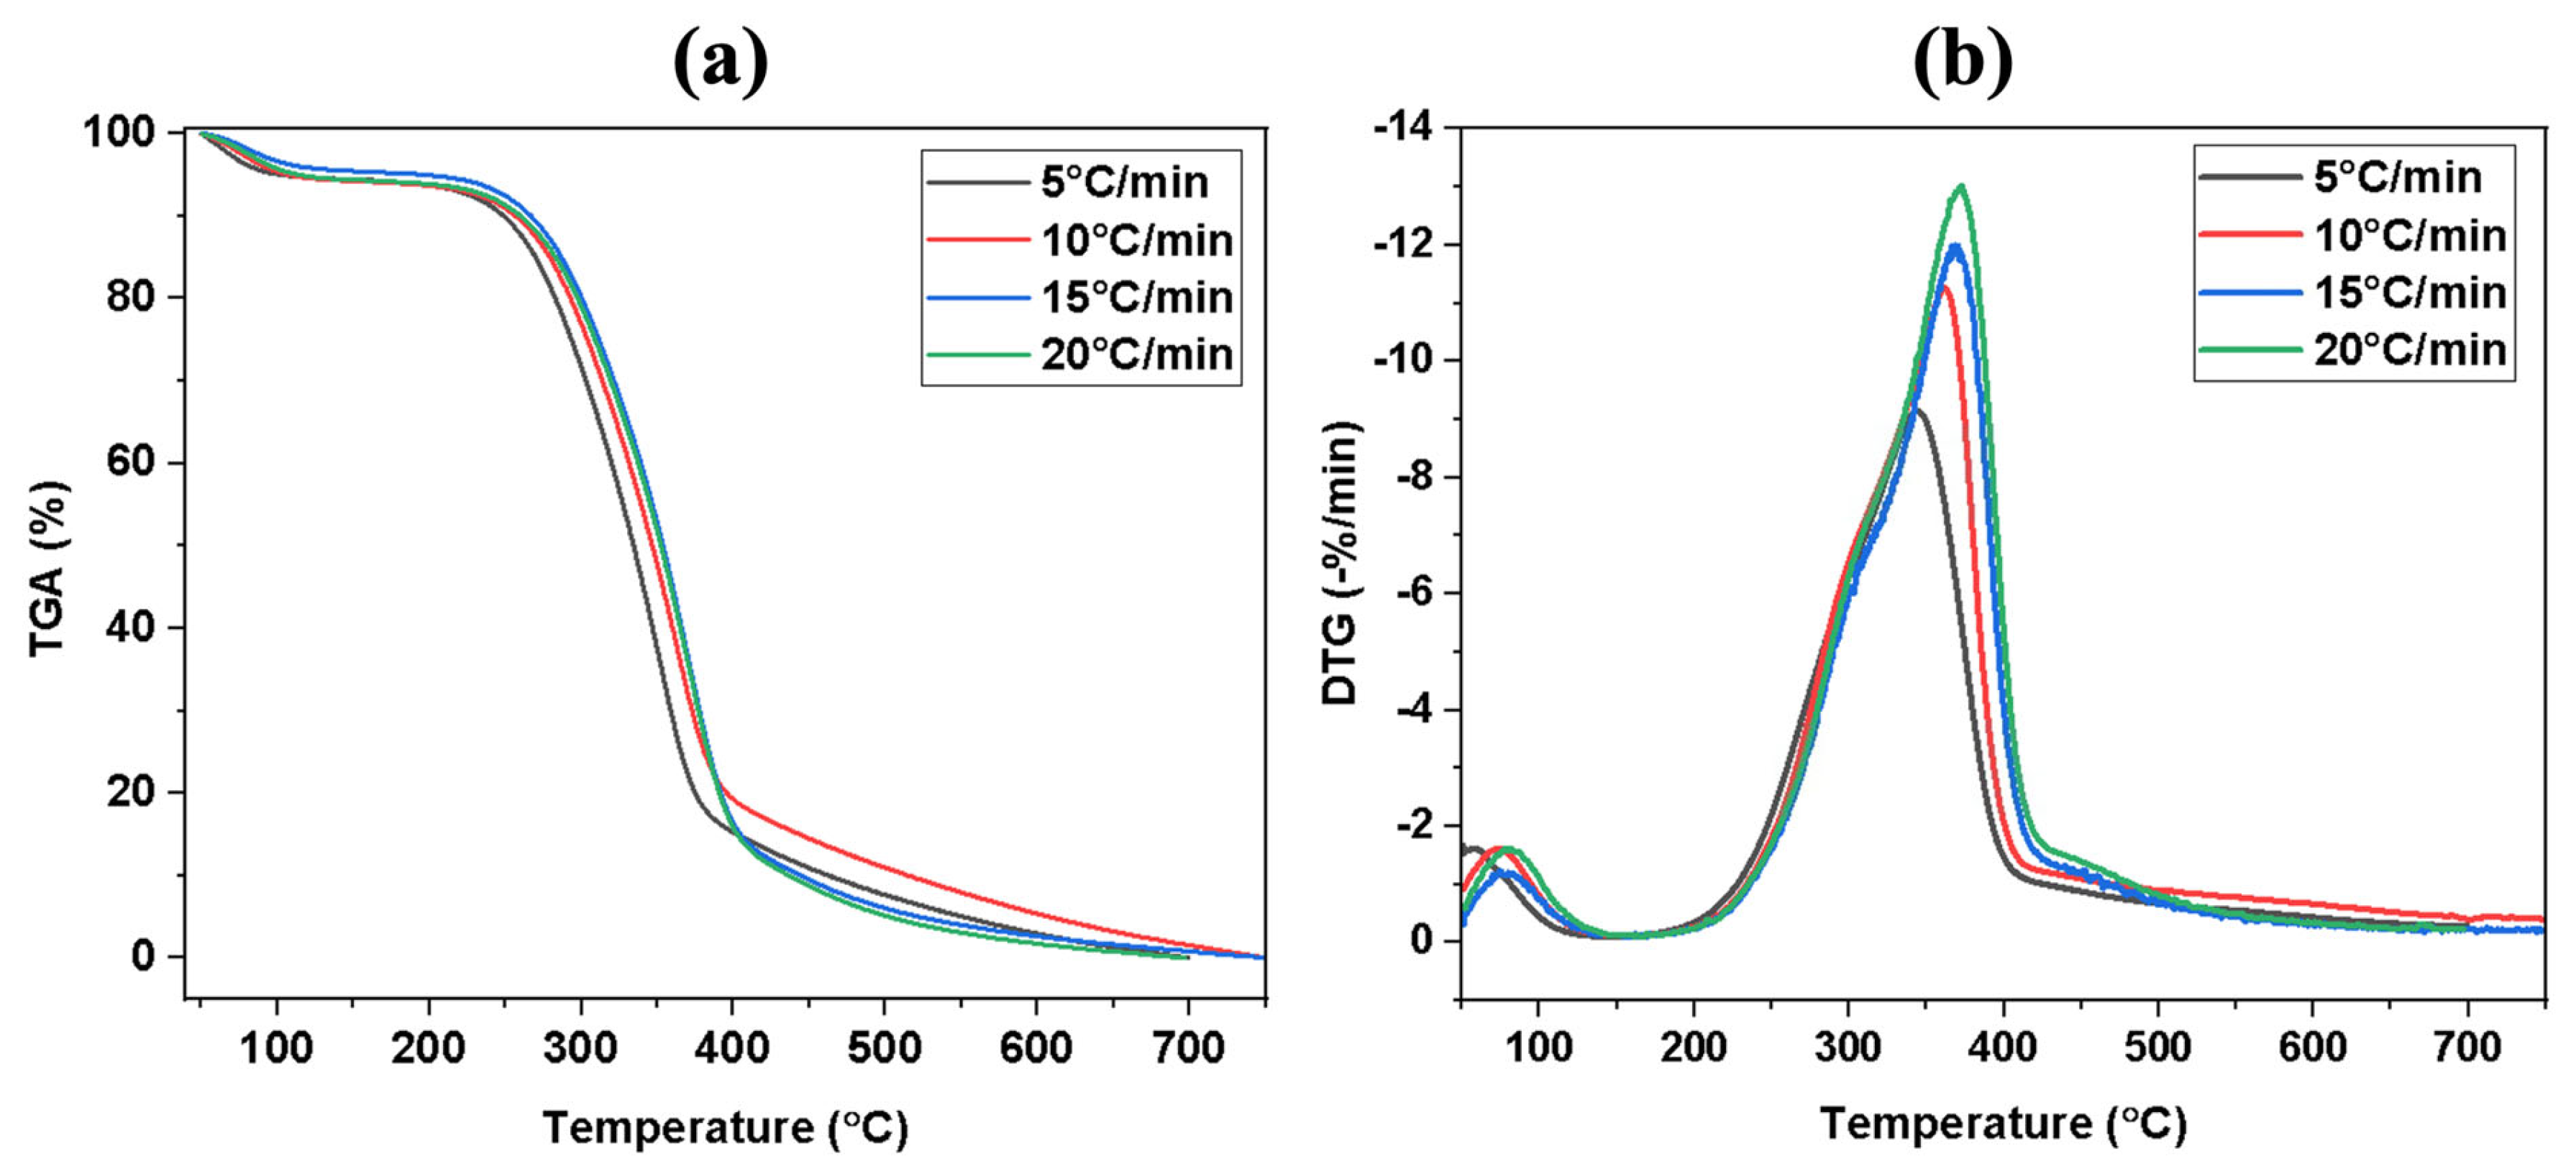
3.1.3. Thermogravimetric Analysis of the Sample

The TG and DTG curves of the flax straw sample under various heating rates for pyrolysis and combustion are displayed in Figure 2 and Figure 3, respectively. The TG curves (a) depict alterations in weight loss as temperature increases, while the DTG curves (b) represent the derivative weight loss curves derived from TG. As mentioned earlier, biomass consists of three key components, namely cellulose, hemicellulose, and lignin, each of which exhibits its own decomposition characteristics. A number of factors influence the decomposition of these components, including the heating rate, temperature, and the presence of contaminants [57]. The three components do not decompose simultaneously during the pyrolysis process. Hemicellulose is the most easily decomposed, followed by cellulose, while lignin poses the greatest challenge to decomposition. Surprisingly, both lignin and hemicellulose have an impact on cellulose decomposition characteristics, whereas they do not significantly affect each other during thermal decomposition [58]. The decomposition of hemicellulose and cellulose during heating produces volatile matter that separates. As the temperature increases, lignin starts to decompose. Table 3 and Table 4 provide a comprehensive list of the pyrolysis and combustion characteristic parameters, including maximum degradation temperature (Tm), mass loss in the first, second, and third stage, the residue weight percent for pyrolysis and ignition temperature, burnout temperature, mass loss in the second stage, maximum and average burning rate, and the combustion characteristic index for the combustion of the sample.

3.2. Pyrolysis

The biomass pyrolysis process is typically divided into three stages, with the first stage being the drying stage (<150 °C), during which free water evaporates, resulting in a minor weight loss on the DTG curve, namely the dehydration step. The second stage is the primary pyrolysis stage (200–400 °C), in which the biomass undergoes significant thermal decomposition and releases of volatile substances, namely the devolatilization step, and the last step (400–550 °C) for lignin degradation and char formation [59].
As shown in Figure 2, the pyrolysis process was studied with different heating rates of 5-10-15 and 20 °C min−1; the initial stage involves the removal of the moisture content, indicated by the small peak in the DTG curve. At heating rates of 5 and 10 °C min−1, the process begins at 50 °C and ends at 120 °C and 125 °C, respectively, resulting in a mass loss of 5.9% and 6.1%. On the other hand, at heating rates of 15 and 20 °C min−1, the process begins at 50 °C and ends at 133 °C and 147 °C, resulting in a mass loss of 4.8% and 5.7%. It is evident that the main mass loss or devolatilization stage produced by the decomposition of hemicellulose and cellulose for heating rates of 5 and 10 °C/min occurred at various temperature zones, ranging from 154 to 410 °C, 170 to 416 °C, 170 to 420 °C, and 170 to 430 °C for heating rates of 5, 10, 15, and 20 °C min−1, respectively. This contributed to 85.7%, 80.8%, 87.6%, and 86.8% of the mass loss, respectively. The DTG curve showed that the maximum mass loss in stage two occurred at temperatures of 341, 360, 370, and 371 °C for heating rates of 5, 10, 15, and 20 °C min−1, respectively. These results are consistent with the studies on other biomass samples [60]. The char formation stage ranged from 407 to 510 °C, 415 to 520 °C, and 425 to 550 °C under heating rates of 5,10, 15, and 20 °C min−1, respectively. Table 3 provides a list of the pyrolysis characteristic parameters, including Tm (maximum degradation temperature), mass loss in the first, second, and third stages, and residue weight percent for the pyrolysis of the flax straw sample [61].

3.3. Combustion

The same degradation steps are observable during combustion, while the mass loss in the char formation step is enhanced considerably [19]. A thermal breakdown profile of flax straw biomass under air atmosphere is presented in Figure 3. The DTG profile analysis indicated that the dehydration step occurred between 50 °C and 150 °C, with mass losses of 2.3%, 4.1%, 1.9%, and 1.7% for heating rates of 5,10, 15, and 20 °C min−1, respectively. Devolatilization took place after the biomass had already lost all its moisture at a temperature range between 170 °C and 380 °C, with mass losses of 76.7%, 67.0%, 69.0%, and 70.0% for heating rates of 5,10, 15, and 20 °C min−1, respectively. For the third stage, at heating rates of 10, 15, and 20 °C/min, the temperature ranges were 370–517 °C, 375–520 °C, 380–530 °C, and 385–550 °C, respectively. These conditions resulted in a mass loss of 20.6%, 28.2%, 25.7%, and 26.2%, respectively. This phenomenon can be attributed to the better degradation of lignin in the presence of oxygen compared to the same condition in the absence of air [41]. Although lignin is not completely degraded, the extent of its degradation is typically higher during combustion compared to other processes such as pyrolysis. This is due to the rapid and complete oxidation of the lignin in the presence of oxygen during combustion, which results in a significant amount of degradation [59]. However, some amount of unburned or partially burned lignin may still remain in the char or ash after combustion. The complete oxidation of biomass results in lower residue formation during combustion compared to pyrolysis. The residual output from combustion is one-tenth of that generated from pyrolysis. Improved heat transfer to the interior of the biomass resulted in less residual after combustion at lower heating rates.

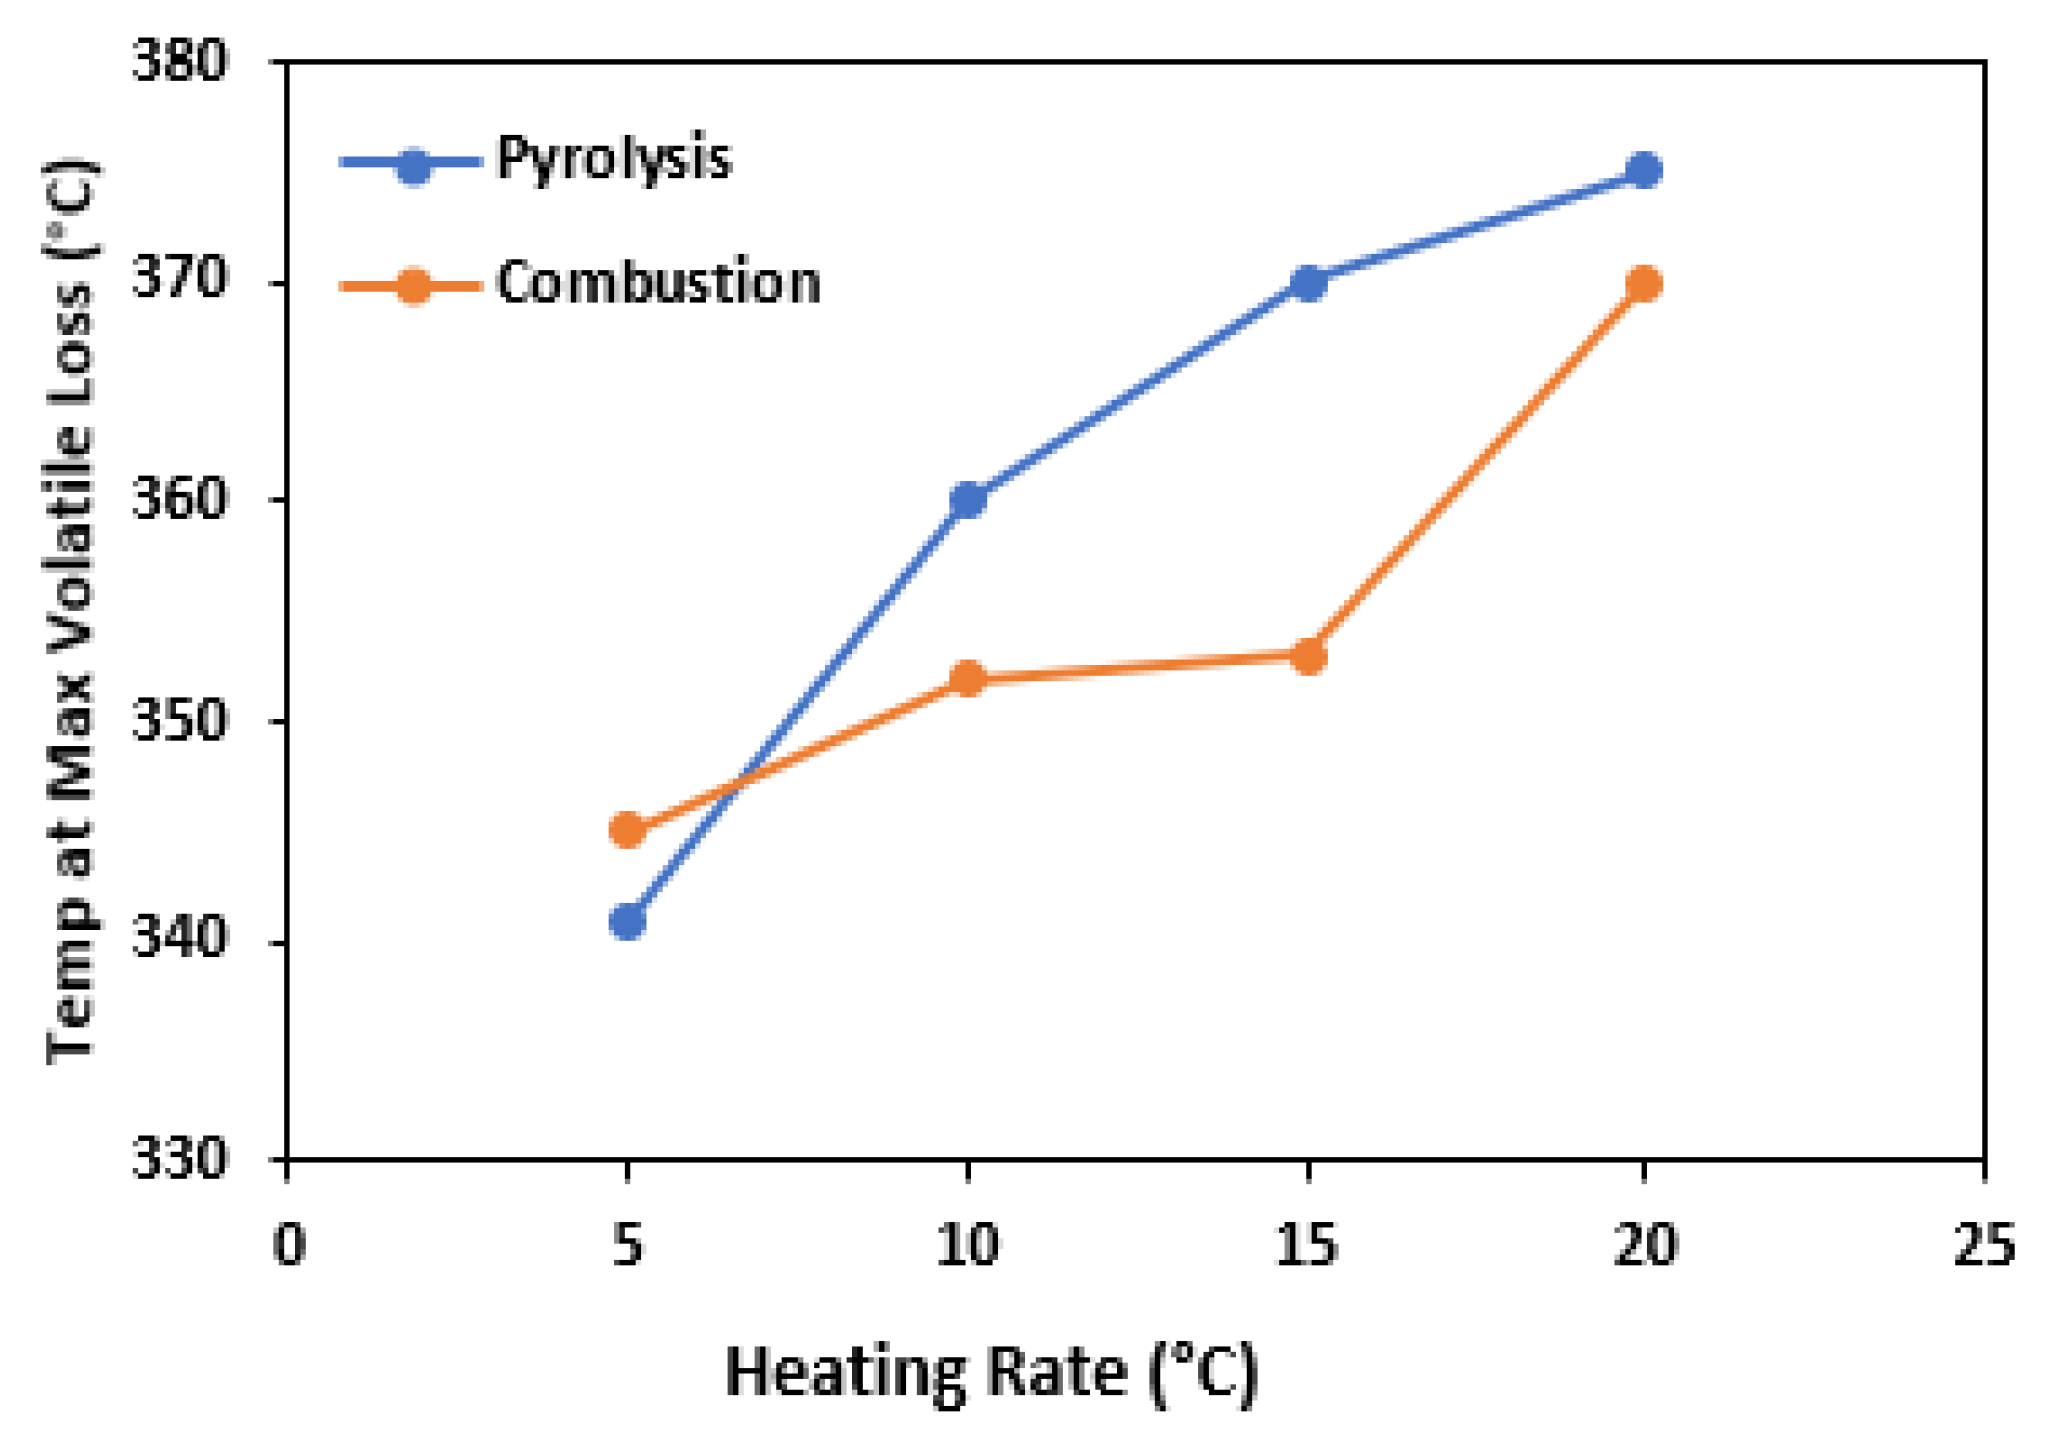
3.4. Effects of Heating Rate

Figure 4 represents the effects of the heating rate on the maximum temperature of degradation for pyrolysis and combustion, respectively. As the rate of heating increases from 5 to 20 °C min−1, the maximum temperature at which degradation occurs also increases. This increase can be attributed to the phenomenon of thermal lag, where biomass requires more time to undergo similar mass loss at a given temperature [59]. As a result, there is a delay in thermal degradation at higher temperatures. In Figure 3a, it was observed that the initiation and completion of devolatilization and char formation steps were postponed as the heating rate was increased. This outcome can be ascribed to the intensified heat flux occurring at higher heating rates, which reduces the cohesion of the material and disrupts its structure, thereby accelerating the reactions and causing more volatile release. A similar phenomenon has also been noted for other biomass samples in the literature [62].
As expected, the residue of pyrolysis is more than combustion in all heating rates. During pyrolysis, only a portion of the biomass is converted into gases; the rest of the organic matter is left behind as solid residue. In contrast, during combustion, the biomass is typically burned completely, and the resulting ash is the only residue.

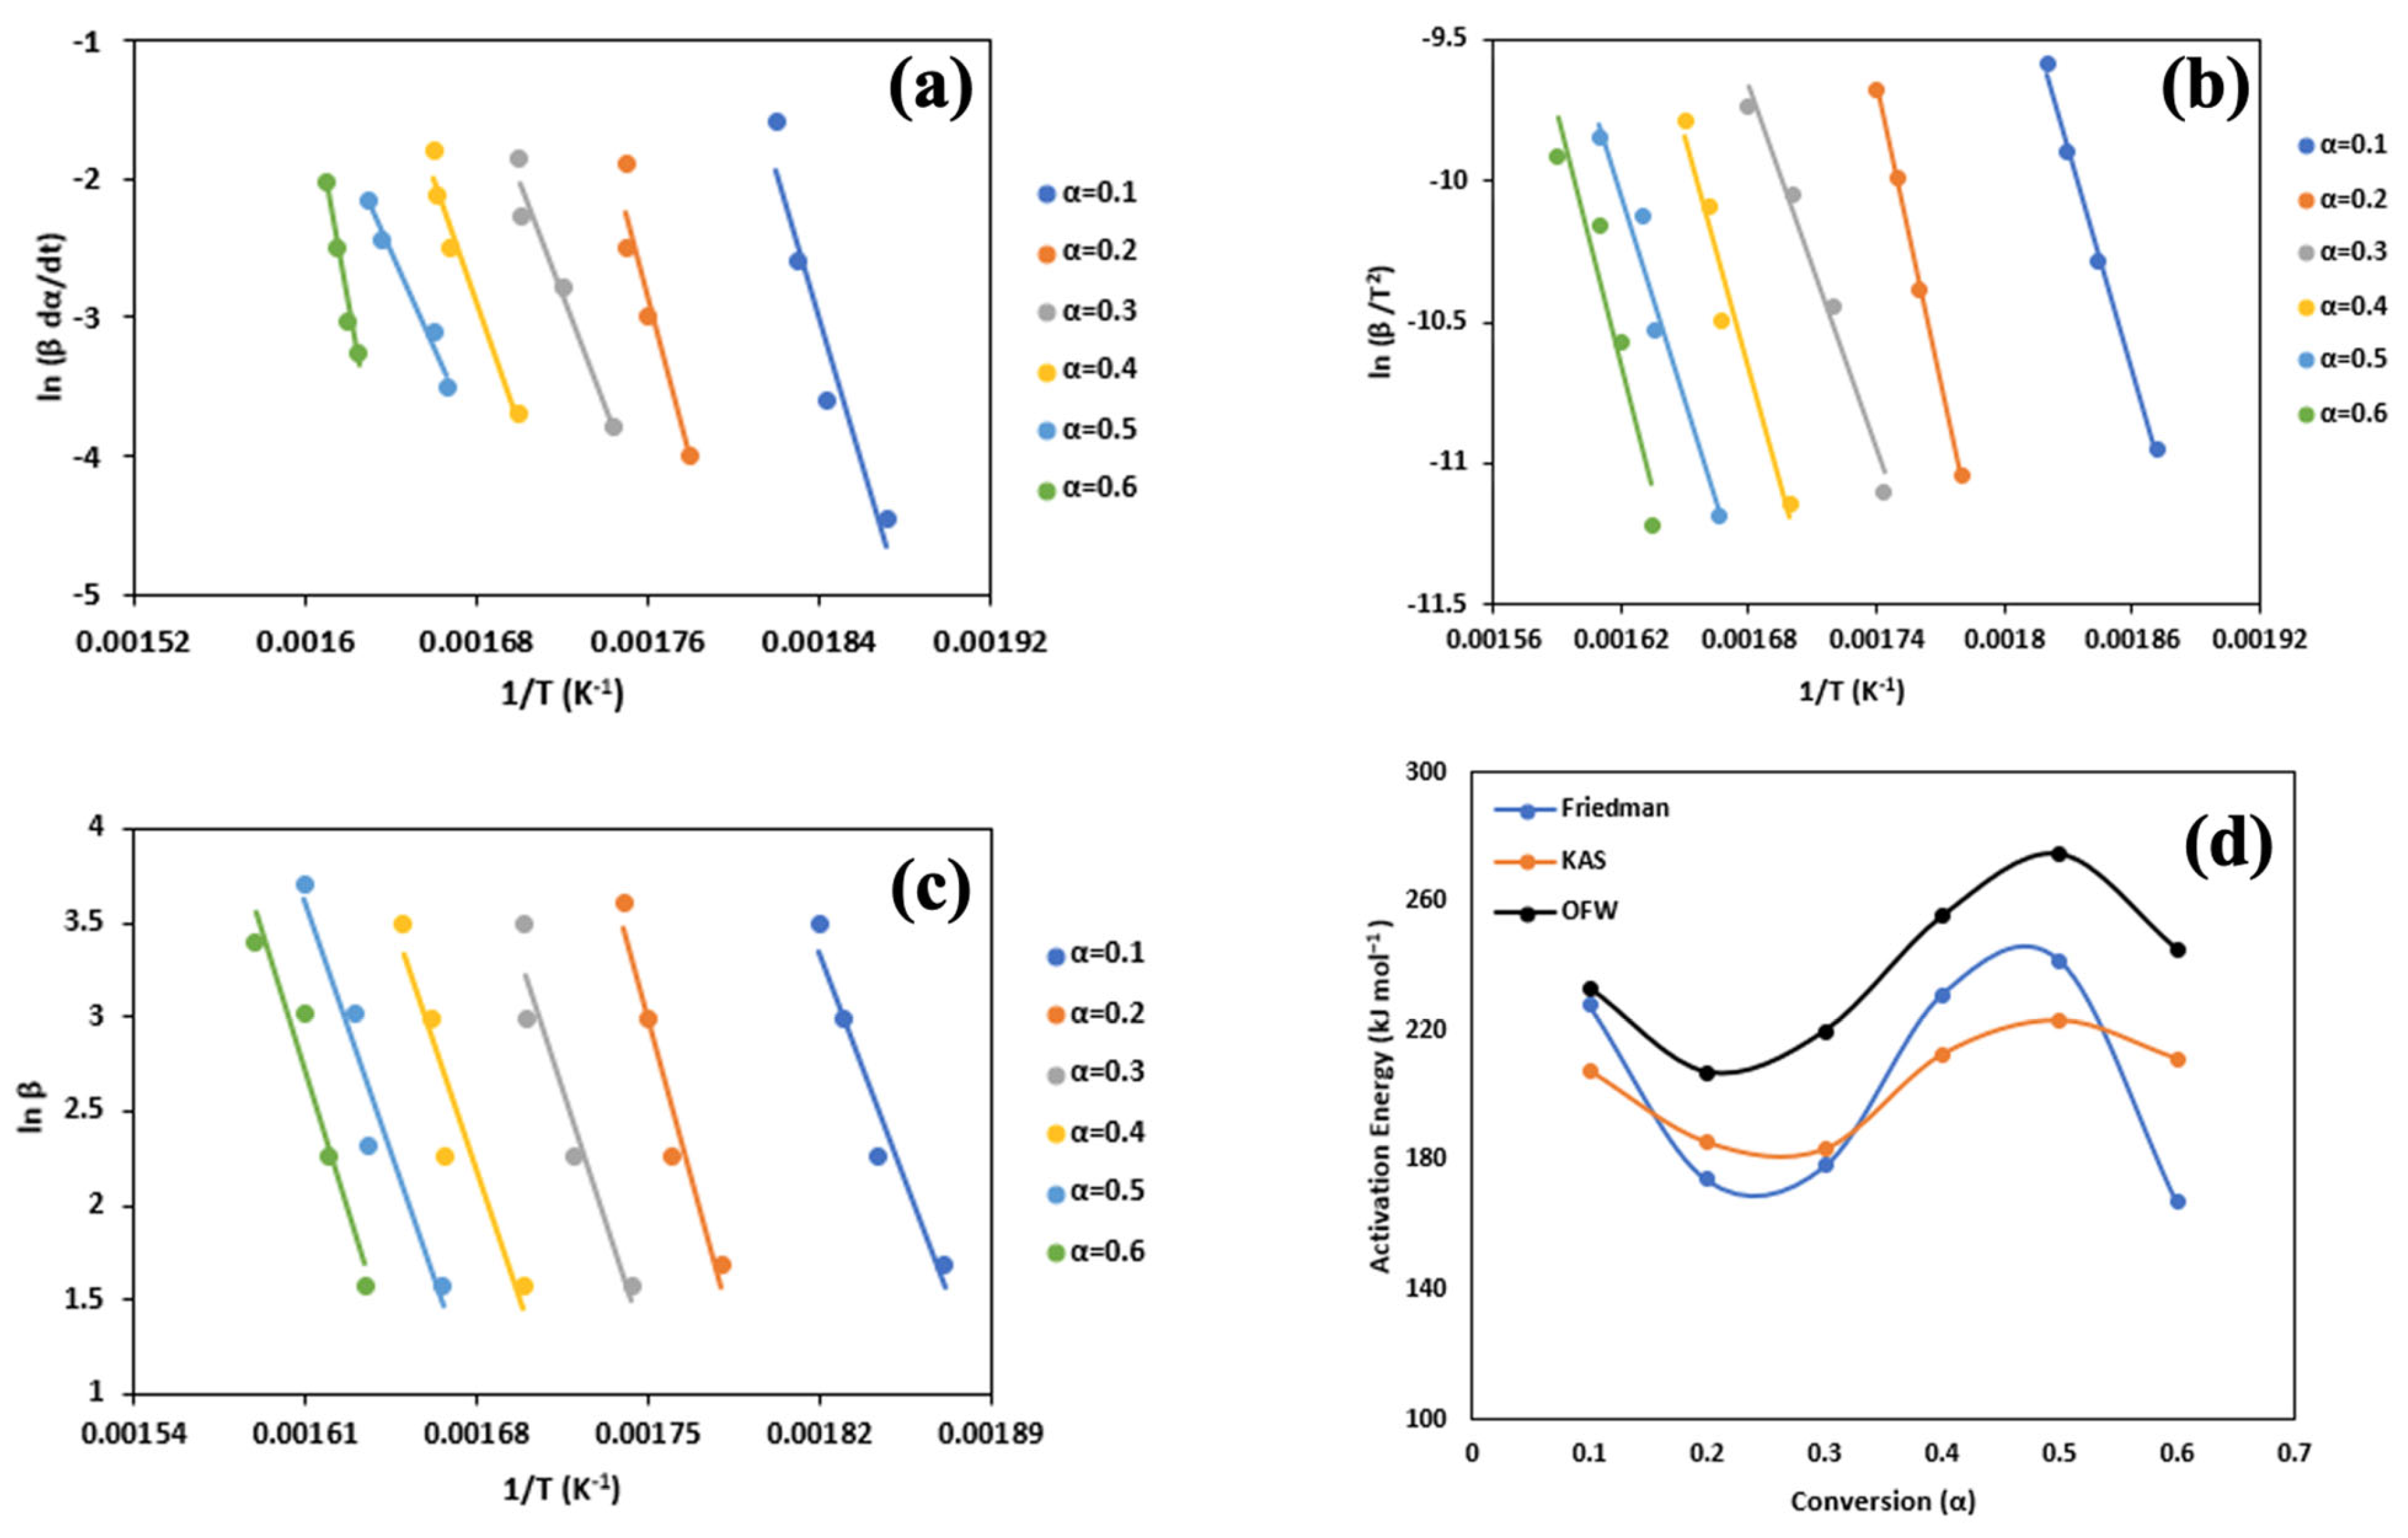
3.5. Kinetic Analysis

In this study, the kinetic analysis of the pyrolysis and combustion of flax straw biomass was estimated using various techniques, including Friedman, KAS, and OFW based on TGA data with different heating rates. The activation energy (Ea), the minimum energy required for pyrolysis or combustion to take place, was determined using these techniques. However, it was observed that the higher conversion value of 0.6 did not fit well due to a lower correlation value [63].
The average apparent activation energy values were determined using isoconversional methods; Friedman, KAS, and OFW for pyrolytic conversion were found to be 109.6, 105.1, and 101.1 kJ mol−1, and for combustion, 203.3, 203.9, and 239.2 kJ mol−1, respectively. The coefficient factor (R2) values were determined for each model and were found to be greater than 0.90, indicating the accuracy of the used methods. Overall, these results demonstrate the efficacy of the model-free techniques in estimating the kinetic parameters of the reaction under investigation. The calculated activation energy and its corresponding coefficient factor (R2) for each conversion value (α) are tabulated in Table 5. The corresponding values for intercept and slop are reported in Table S2.
Figure 5 represents the linear fitting plots generated via Friedman, KAS, and OFW methods for the pyrolytic conversion of flax straw biomass. Figure 5a is the plot of l n ( β d α d T ) vs. 1 T at different conversions based on the Friedman method. Figure 5b,c show plots of l n ( β T 2 ) vs. 1 T and ln(β) vs. 1 T based on the KAS and OFW methods, respectively. Comparing the three methods, this shows an average of 105.2 kJ mol−1 and a percentage difference of 8.3%, which is consistent with previous reports [64].
Figure 5d shows the relationship between the activation energy and conversion for pyrolysis. Based on the results presented in the figure, the activation energy for the Friedman method exhibits an increasing trend up to a value of α = 0.4, beyond which it begins to decrease. In contrast, the activation energy for the KAS and OFW methods shows a consistent increasing trend throughout the entire range of α values, which is in accordance with previous studies [59]. There are several possible explanations for this phenomenon, but one of the main factors is the accumulation of char, which is a solid residue that remains after the pyrolysis of biomass. As the conversion proceeds, the char content increases and becomes more thermally stable. This means that more energy is required to break down the char into volatile gases, resulting in an increase in the activation energy. Another factor is the change in the chemical composition of the biomass as the conversion progresses. As the biomass is converted to simpler compounds, the remaining components become more resistant to pyrolysis and require more energy to be broken down.
Figure 6a–c show the linear fitting plots for the combustion of biomass generated via the Friedman, KAS, and OFW methods, respectively. The graphs were plotted utilizing the same parameters as those employed in Figure 5a–c. The average activation energy is 215.5 kJ mol−1. The higher activation energy of combustion compared to pyrolysis is attributed to the different types of reactions that are occurring during combustion in the presence of oxygen, where oxygen and biomass bonds are breaking to make water vapor and carbon dioxide, which requires a lot of energy input. On the other hand, the energy required for pyrolysis is used to break the chemical bonds within the biomass molecules, which is generally lower [65].
Figure 6d shows the relationship between the activation energy and conversion for combustion. Based on the results presented in the figure, the activation energy for the Friedman method exhibits an increasing trend up to a value of α = 0.4, beyond which it begins to decrease. In contrast, the activation energy for the KAS and OFW methods shows a consistent increasing trend throughout the entire range of α values. There are multiple potential reasons for this occurrence, but a primary element is the buildup of char, which denotes the solid residue left behind following biomass pyrolysis. As the transformation progresses, the amount of char intensifies and gains greater thermal stability. Consequently, a higher amount of energy is needed to disintegrate the char into volatile gases, leading to an elevation in activation energy. Another factor involves alterations in the chemical composition of the biomass during the conversion process. As the biomass is converted into simpler compounds, the residual components develop a greater resistance to pyrolysis, necessitating more energy for their breakdown.

3.6. Master Plot

The theoretical graphs were plotted based on Equation (8), while function f(x) and g(x) are described in Table S3 and utilized to equate theoretical curves with experimental data. This methodology enables the identification of the reaction mechanisms in pyrolysis or combustion. As can be seen from Figure 7a,b, the experimental data of pyrolysis reaction mostly fit with the Avrami–Erofeev (n = 3) mechanism for pyrolysis and Avrami–Erofeev (n = 4) mechanism for combustion, which suggests that a growth of the nucleation mechanism is the predominant mechanism which involves the formation of small clusters of solid products (nuclei) which subsequently grow and coalesce to form larger particles. Imperfections in the biomass contribute to fluctuating local energies that act as nucleation sites for reaction initiation. These sites have lower activation energies, which facilitates the pyrolysis of biomass. The nuclei at these sites then gradually grow and merge with other nuclei until the reaction is complete [59].

3.7. Thermodynamic Analysis

The evaluation of thermodynamic parameters for the pyrolysis or combustion of biomass can provide valuable information about its energy requirements. These parameters can be utilized as inputs for prediction models that estimate gaseous emissions resulting from biomass thermochemical conversion [37]. Furthermore, the assessment of thermodynamic parameters can aid in defining appropriate operating conditions. Table 6 presents the calculated values of changes in enthalpy (ΔH), entropy (ΔS), Gibbs free energy (ΔG), and frequency factor (A) for various conversions using the distributed activation energy model (DAEM). The average frequency factor for pyrolysis is 1.7 × 10⁹ , which is considerably less than the combustion process (1.5 × 10¹⁷). The lower frequency factor is attributed to the slower process of pyrolysis compared to rabidly oxidizing the reaction in the presence of oxygen.
The value of ΔH shows the amount of heat that is released or adsorbed during a reaction. The positive sign of ΔH means an endothermic process [66]. In the case of the pyrolysis of flax straw biomass, the average enthalpy gained from the DAEM method was 102.5 kJ mol−1. The variation in enthalpy with respect to conversion was presented in Table 5. The observed changes in enthalpy during the pyrolysis process of various biomass samples followed a similar trend with increasing conversion values [37]. This can be attributed to the increased energy required for the dissociation of stronger chemical bonds, which occurs at higher thermal energies. In contrast, the change in enthalpy (ΔH) associated with combustion is nearly twice as high as that observed for pyrolysis, reaching up to 201.2 kJ mol−1. This higher enthalpy value in combustion can be attributed to the more extensive and thorough breakdown of the biomass’s chemical structure during the combustion process.
The ΔS measure the disorder or randomness of a system. In general, an increase in entropy corresponds to an increase in disorder [67]. The ΔS of flax straw biomass for pyrolysis and combustion was found to be −187.8 and −8.3 J mol−1 K−1, respectively. The disparity in entropy between pyrolysis and combustion can be attributed to the differing products and molecular complexity generated by each reaction. During pyrolysis, which produces solid char, liquid bio-oil, and a gas mixture, fewer products and more complex molecules are formed. In contrast, combustion yields simpler products and a larger quantity of gases. As a result, pyrolysis exhibits lower entropy compared to combustion.
The ΔG is a metric utilized to quantify the amount of energy that can be released or adsorbed in a chemical reaction. The sign of ΔG (whether negative or positive) indicates the spontaneity (exergonic or endergonic) of the process [68]. The ΔG of the pyrolysis of flax straw is 162.6 kJ mol−1, while for combustion this increased to 203.9 kJ mol−1. This could be attributed to the fact that combustion involves a more complete oxidation process; it releases more energy compared to pyrolysis, leading to a higher ΔG. Additionally, the products of pyrolysis may still contain some unoxidized organic compounds, which can further react to produce more energy if they are burned in the presence of oxygen. In practical terms, this implies that combustion is generally a more efficient process for extracting energy from organic compounds. Nevertheless, certain situations may require pyrolysis, for example, the production of biochar for various purposes.

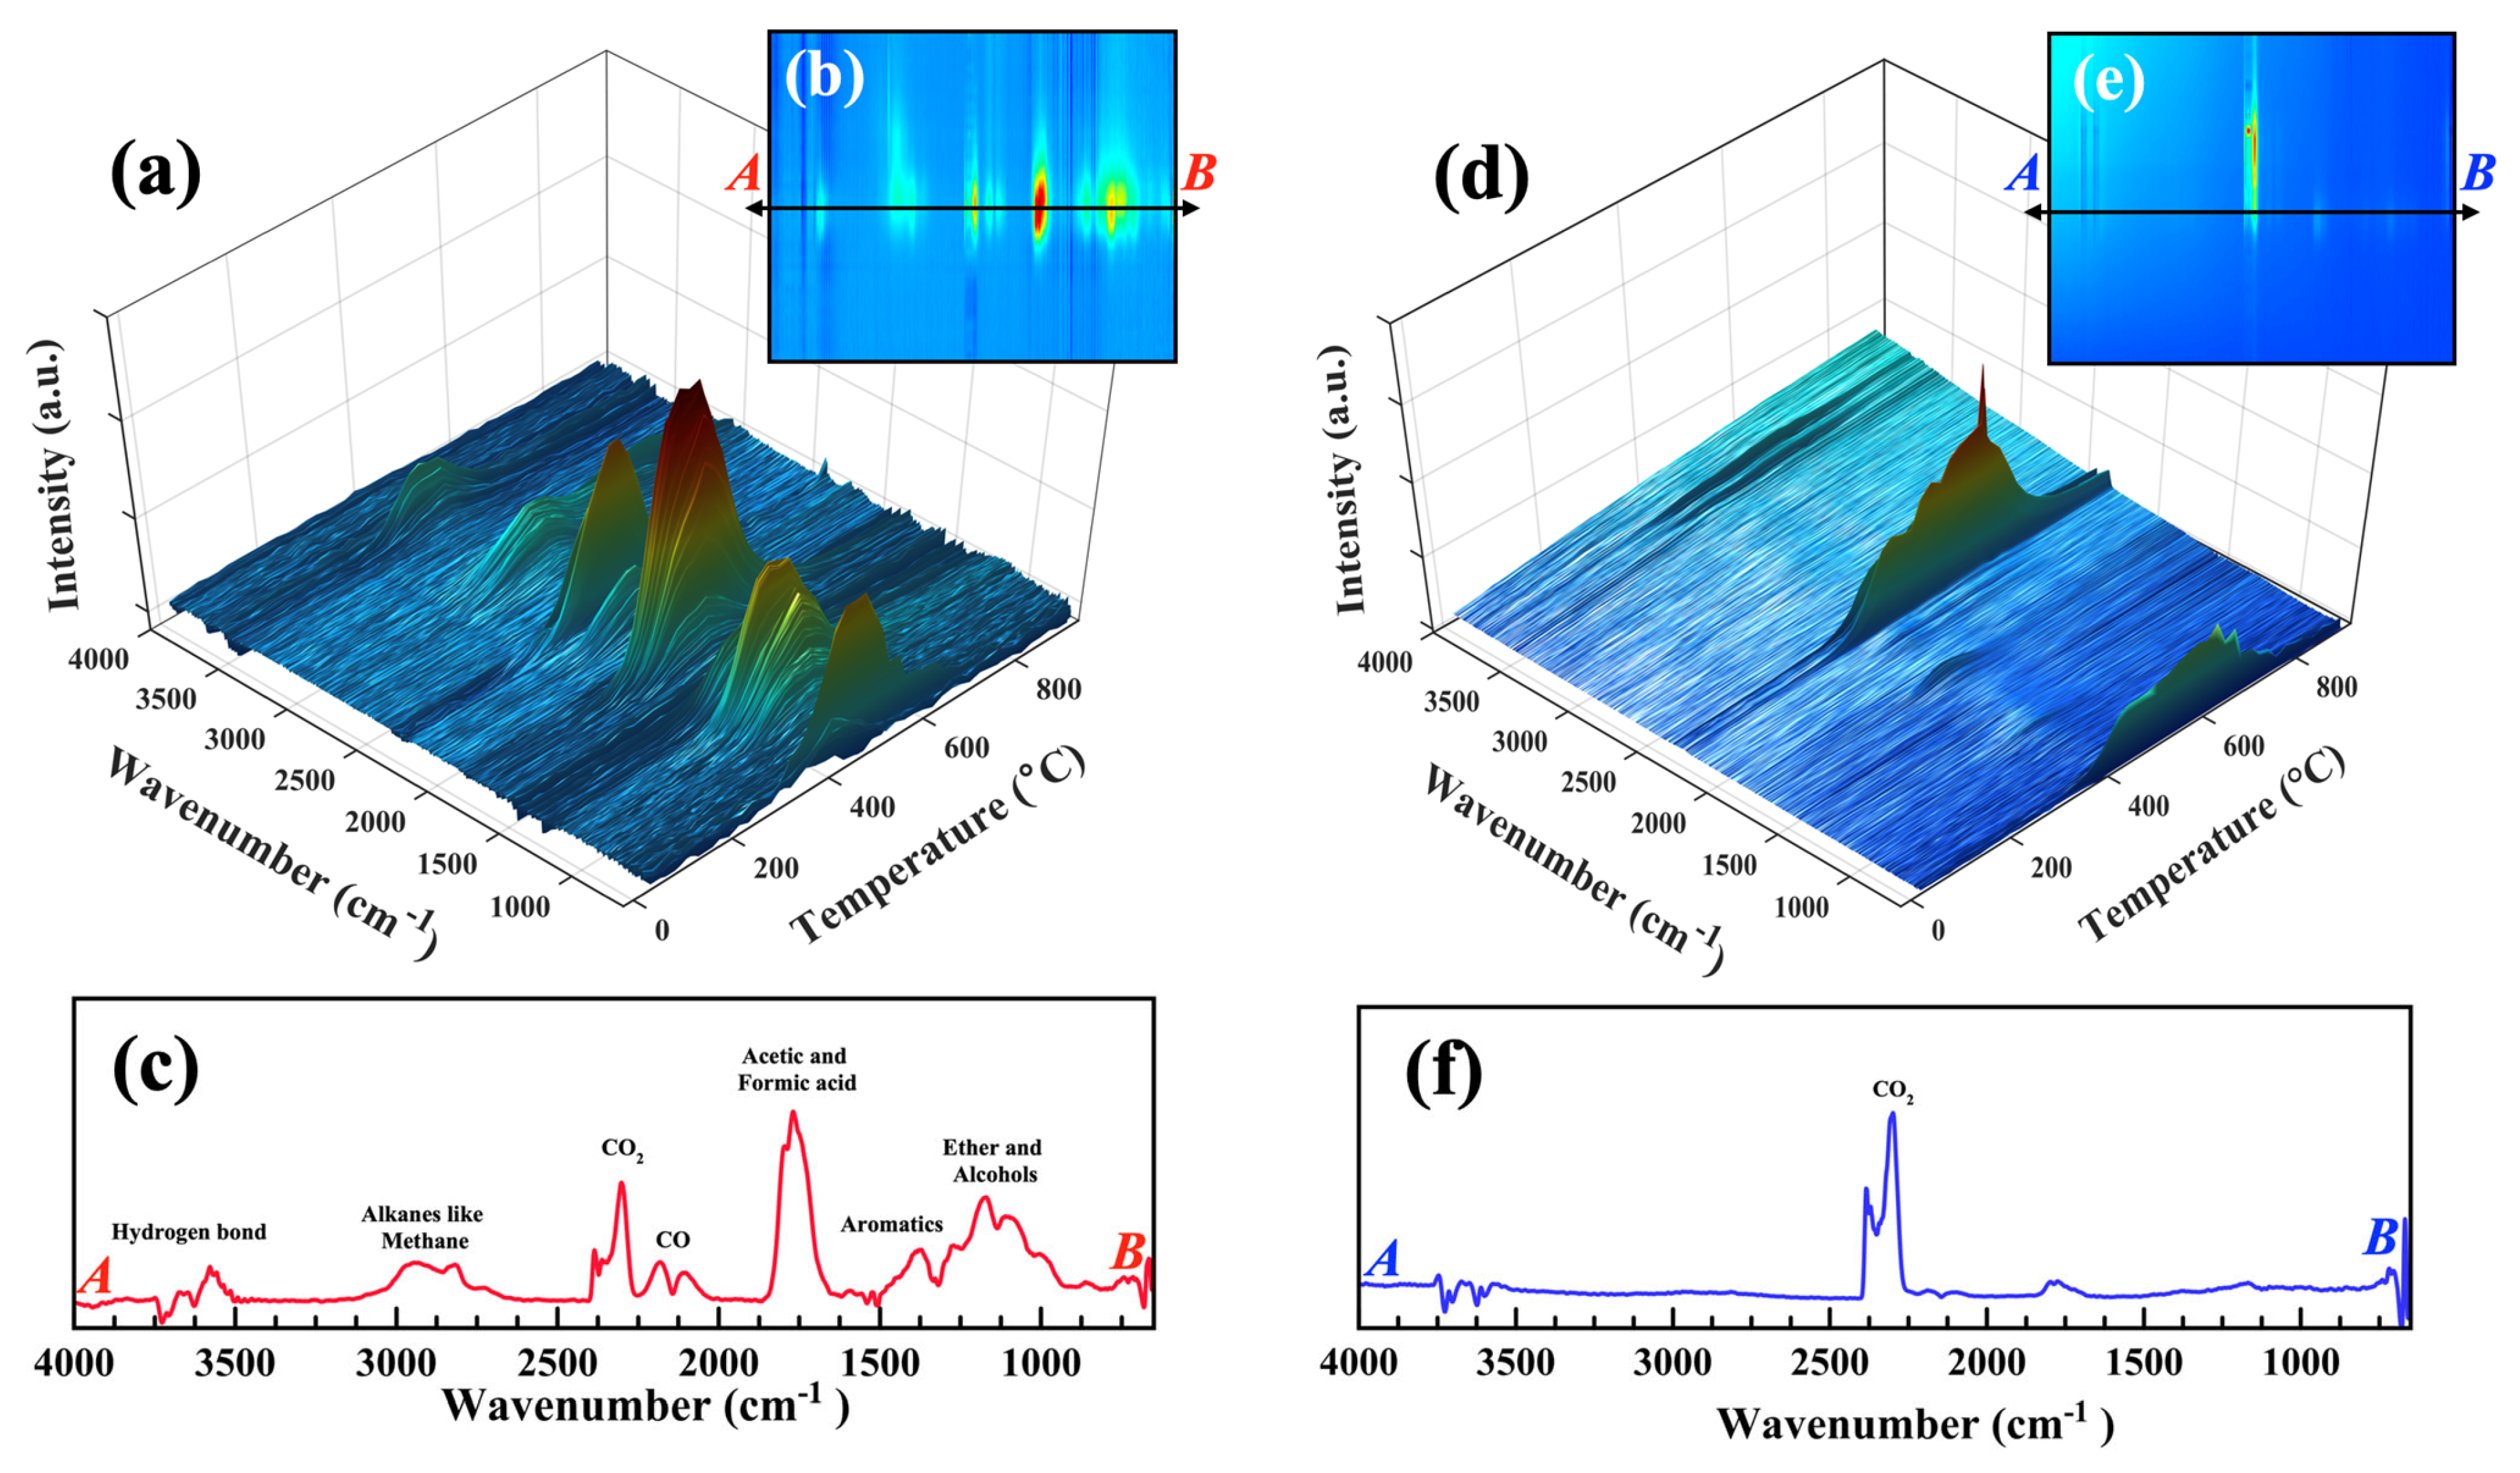
3.8. Real-Time Analysis of Evolved Gases

3.8.1. Pyrolysis

Real-time monitoring of evolved volatiles from the pyrolysis of flax straw biomass was conducted using FTIR at a heating rate of 20 °C min−1, as shown in Figure 8a,b, displaying diverse peaks within the range of wavenumbers from 650 to 4000 cm−1. Different decomposition reactions occur during the biomass pyrolysis process, including decarboxylation, decarbonylation, demethylation, demethoxylation, and dehydration in the pyrolysis stage [69]. The primary pyrolysis products identified from flax straw were carboxylic acids, aldehydes, methane, carbon mono and dioxide, alcohols, aromatics, and ethers [70]. An ether band is observable at 1100–1250 cm−1. Aromatics show their signature at 1300 cm−1. A strong carbonyl characteristic band related to carboxylic acid (acetic and formic acid) and aldehydes (formaldehyde) as the main degradation pyrolysis products was observed at 1700–1800 cm−1, while carbon mono- and dioxide bands were detected at 2000–2200 and 2250–2400 cm−1, respectively [71]. The formation of CO, CO2, and H2O is suggested to occur from the breakage of lateral chains in biomass, such as aliphatic hydroxyl groups and C-C bonds [72]. The presence of methyl and methylene functional groups in hydrocarbons like methane, alcohols, and ethers was signified by a unique band at 2800–3000 cm−1, symmetric and asymmetric stretching vibrations make the hydrogen bonds signature related to water from the dehydration process, and alcohols or acids appear at 3200–3600 cm−1. The 3D FTIR graphs focused on each region were illustrated in Figure S2. Figure 8c illustrates the FTIR spectra of the evolved gases with the highest intensity, plotted from point A to B (indicated by the arrow) as shown in Figure 8b. The profile of gas product evolution during pyrolysis was monitored by both the time and temperature. Gas product release was concentrated at temperatures ranging from 300 to 450 °C, consistent with the biomass weight loss observed in Figure 5a. Figure S3 shows the same correlation of evolved gas intensity with the TGA-DTG profile monitored by time.

3.8.2. Combustion

Figure 8d illustrates the TGA-FTIR spectra of flax straw biomass in the combustion condition. It is noteworthy that the evolved gas pattern during combustion exhibits a distinct contrast to that of pyrolysis. While pyrolysis presents a more varied composition of gases, combustion is characterized by a limited range of gas types, with CO2 serving as the primary degradation product. Water absorption bands around 3500 cm−1 are still present but with a very low concentration. The absorption band of CO2 is more noticeable in combustion. Based on the available evidence, it is indicated that in the presence of oxygen, complete cracking takes place, resulting in carbon dioxide as the ultimate product. The formation of formic and acetic acid is indicated by remarkable bands at 1700–1800 cm−1. Alcohol and ethers are present, with methanol being the most significant alcohol, as shown with a signature at 1100–1300 cm−1. However, the formation of carboxylic acids and alcohols in combustion is substantially less compared to pyrolysis. Figure S4 contains illustrations of 3D FTIR graphs that are focused on individual regions. Figure 8f displays the FTIR spectra of the evolved gases with the highest intensity for combustion, plotted from point A to B (indicated by the arrow on Figure 8e). Figure 8d shows the correlation of evolved gas during combustion with TGA and DTG monitored by temperature with a peak between 300 and 650 °C, which is significantly higher than pyrolysis. This increase in temperature was primarily attributed to the additional cracking and reforming of functional groups within the volatiles during the later stage of combustion, leading to the formation of CO2. The time monitored correlation graph is shown in Figure S5.

4. Conclusions

This study presents the potential use of flax straw as a renewable feedstock for pyrolysis and combustion, based on its abundance in Saskatchewan, Canada, and its physicochemical properties. The chemical characterization of flax straw demonstrates its high HHV, besides its low ash and sulfur content, which makes it a promising alternative to conventional bioenergy feedstocks for bioenergy production. Thermogravimetric analysis at four different heating rates was investigated and utilized for thermal degradation kinetics and thermodynamic studies. The investigation of pyrolysis and combustion of biomass with three different isoconversional methods shows similar activation energy for each process. Thermodynamic analysis demonstrates endothermic and endergonic pyrolysis and conversion. TGA coupled with FT-IR was employed to investigate the flax straw pyrolysis and combustion, revealing a multistep conversion process, indicating the type and ratio of the evolved gas depending on the time and temperature. Furthermore, the thermal decomposition process exhibited several distinct stages, with the type and proportion of each stage varying based on the temperature and duration of the process. The research results point to the significant potential of flax straw as a sustainable resource for generating bioenergy using pyrolysis and combustion methods. These findings are crucial for its future application as a biofuel, offering a renewable alternative to replace fossil fuels and contribute to a more sustainable and environmentally friendly energy landscape.

Supplementary Materials

The following supporting information can be downloaded at: https://www.mdpi.com/article/10.3390/en16196932/s1, Table S1: List of elements presents in ash of flax straw biomass, Table S1: List of elements presents in ash of flax straw biomass, Table S2: Intercept and slope of pyrolysis and combustion of flax straw biomass from Friedman, KAS, and OFW methods, Table S3: Differential and integral forms of kinetic models used in solid-state kinetic., Figure S1: Calculation of Ti and Tf, Figure S2: Three-dimensional FT-IR profiles of the evolved gases released from flax straw during pyrolysis focused spectra in each region., Figure S3: Three-dimensional FT-IR profiles of the evolved gases released from flax straw during pyrolysis (time-based), Figure S4: Three-dimensional FT-IR profiles of the evolved gases released from flax straw during combustion focused spectra in each region, Figure S5: Three-dimensional FT-IR profiles of the evolved gases released from flax straw during combustion (time based).

Author Contributions

Conceptualization, B.V. and B.A.; Methodology, B.V. and B.A.; Formal analysis, B.V. and A.B.-G.; Investigation, B.V.; Resources, B.A.; Writing—original draft, B.V.; Writing—review & editing, B.V., A.B.-G., M.E. and B.A.; Visualization, A.B.-G.; Supervision, B.A.; Funding acquisition, B.A. All authors have read and agreed to the published version of the manuscript.

Funding

This research was funded by Prairie Clean Energy and Mitacs grant number [IT28489].

Data Availability Statement

The data presented in this study are available in this article and Supplementary Materials.

Acknowledgments

The authors acknowledge the Saskatchewan Structural Sciences Centre (SSSC) for providing facilities to conduct this research. The work was supported by financial support from Prairie Clean energy and Mitacs fund #IT28489.

Conflicts of Interest

The authors declare that they have no known competing financial interests or personal relationships that could have appeared to influence the work reported in this paper.

References

  1. Ding, A.J.; Fu, C.B.; Yang, X.Q.; Sun, J.N.; Petäjä, T.; Kerminen, V.-M.; Wang, T.; Xie, Y.; Herrmann, E.; Zheng, L.F.; et al. Intense atmospheric pollution modifies weather: A case of mixed biomass burning with fossil fuel combustion pollution in eastern China. Atmos. Chem. Phys. 2013, 13, 10545–10554. [Google Scholar] [CrossRef]
  2. Sayed, E.T.; Wilberforce, T.; Elsaid, K.; Rabaia, M.K.H.; Abdelkareem, M.A.; Chae, K.-J.; Olabi, A. A critical review on environmental impacts of renewable energy systems and mitigation strategies: Wind, hydro, biomass and geothermal. Sci. Total Environ. 2021, 766, 144505. [Google Scholar] [CrossRef] [PubMed]
  3. Narnaware, S.L.; Panwar, N.L. Biomass gasification for climate change mitigation and policy framework in India: A review. Bioresour. Technol. Rep. 2022, 17, 100892. [Google Scholar] [CrossRef]
  4. Perera, F. Pollution from fossil-fuel combustion is the leading environmental threat to global pediatric health and equity: Solutions exist. Int. J. Environ. Res. Public. Health 2018, 15, 16. [Google Scholar] [CrossRef] [PubMed]
  5. Motghare, K.A.; Rathod, A.P.; Wasewar, K.L.; Labhsetwar, N.K. Comparative study of different waste biomass for energy application. Waste Manag. 2016, 47, 40–45. [Google Scholar] [CrossRef]
  6. Maity, S.K. Opportunities, recent trends and challenges of integrated biorefinery: Part I. Renew. Sustain. Energy Rev. 2015, 43, 1427–1445. [Google Scholar] [CrossRef]
  7. Gyamfi, B.A.; Ozturk, I.; Bein, M.A.; Bekun, F.V. An investigation into the anthropogenic effect of biomass energy utilization and economic sustainability on environmental degradation in E7 economies. Biofuels Bioprod. Biorefining 2021, 15, 840–851. [Google Scholar] [CrossRef]
  8. Benaragama, D.I.; Johnson, E.N.; Gulden, R.H.; Willenborg, C.J. Integrated agronomy for high yield and stable flax production in Canada. Agron. J. 2022, 114, 2230–2242. [Google Scholar] [CrossRef]
  9. Kulkarni, S.; Kaware, J. Regeneration and Recovery in Adsorption—A Review. Int. J. Innov. Sci. Eng. Technol. 2014, 1, 61–64. [Google Scholar]
  10. Bilsback, K.R.; Dahlke, J.; Fedak, K.M.; Good, N.; Hecobian, A.; Herckes, P.; L’orange, C.; Mehaffy, J.; Sullivan, A.; Tryner, J.; et al. A Laboratory Assessment of 120 Air Pollutant Emissions from Biomass and Fossil Fuel Cookstoves. Environ. Sci. Technol. 2019, 53, 7114–7125. [Google Scholar] [CrossRef]
  11. Cruz, N.C.; Silva, F.C.; Tarelho, L.A.C.; Rodrigues, S.M. Critical review of key variables affecting potential recycling applications of ash produced at large-scale biomass combustion plants. Resour. Conserv. Recycl. 2019, 150, 104427. [Google Scholar] [CrossRef]
  12. Hu, X.; Gholizadeh, M. Biomass pyrolysis: A review of the process development and challenges from initial researches up to the commercialisation stage. J. Energy Chem. 2019, 39, 109–143. [Google Scholar] [CrossRef]
  13. Hameed, S.; Sharma, A.; Pareek, V.; Wu, H.; Yu, Y. A review on biomass pyrolysis models: Kinetic, network and mechanistic models. Biomass Bioenergy 2019, 123, 104–122. [Google Scholar] [CrossRef]
  14. Wang, Y.; Yan, B.; Wang, Y.; Zhang, J.; Chen, X.; Bastiaans, R.J.M. A comparison of combustion properties in biomass–coal blends using characteristic and kinetic analyses. Int. J. Environ. Res. Public. Health 2021, 18, 12980. [Google Scholar] [CrossRef] [PubMed]
  15. Liu, L.; Pang, Y.; Lv, D.; Wang, K.; Wang, Y. Thermal and kinetic analyzing of pyrolysis and combustion of self-heating biomass particles. Process. Saf. Environ. Prot. 2021, 151, 39–50. [Google Scholar] [CrossRef]
  16. Sekar, M.; Mathimani, T.; Alagumalai, A.; Chi, N.T.L.; Duc, P.A.; Bhatia, S.K.; Brindhadevi, K.; Pugazhendhi, A. A review on the pyrolysis of algal biomass for biochar and bio-oil—Bottlenecks and scope. Fuel 2021, 283, 119190. [Google Scholar] [CrossRef]
  17. Wang, G.; Dai, Y.; Yang, H.; Xiong, Q.; Wang, K.; Zhou, J.; Li, Y.; Wang, S. A review of recent advances in biomass pyrolysis. Energy Fuels 2020, 34, 15557–15578. [Google Scholar] [CrossRef]
  18. Jia, G. Combustion characteristics and kinetic analysis of biomass pellet fuel using thermogravimetric analysis. Processes 2021, 9, 868. [Google Scholar] [CrossRef]
  19. Guo, F.; He, Y.; Hassanpour, A.; Gardy, J.; Zhong, Z. Thermogravimetric analysis on the co-combustion of biomass pellets with lignite and bituminous coal. Energy 2020, 197, 117147. [Google Scholar] [CrossRef]
  20. Hihu Muigai, H.; Choudhury, B.J.; Kalita, P.; Moholkar, V.S. Physico–chemical characterization and pyrolysis kinetics of Eichhornia crassipes, Thevetia peruviana, and Saccharum officinarum. Fuel 2021, 289, 119949. [Google Scholar] [CrossRef]
  21. Mishra, R.K.; Lu, Q.; Mohanty, K. Thermal behaviour, kinetics and fast pyrolysis of Cynodon dactylon grass using Py-GC/MS and Py-FTIR analyser. J. Anal. Appl. Pyrolysis 2020, 150, 104887. [Google Scholar] [CrossRef]
  22. Barzegar, R.; Yozgatligil, A.; Olgun, H.; Atimtay, A.T. TGA and kinetic study of different torrefaction conditions of wood biomass under air and oxy-fuel combustion atmospheres. J. Energy Inst. 2020, 93, 889–898. [Google Scholar] [CrossRef]
  23. Karaeva, J.V.; Timofeeva, S.S.; Islamova, S.I.; Gerasimov, A.V. Pyrolysis kinetics of new bioenergy feedstock from anaerobic digestate of agro-waste by thermogravimetric analysis. J. Environ. Chem. Eng. 2022, 10, 107850. [Google Scholar] [CrossRef]
  24. Kumar Mishra, R.; Mohanty, K. Kinetic analysis and pyrolysis behavior of low-value waste lignocellulosic biomass for its bioenergy potential using thermogravimetric analyzer. Mater. Sci. Energy Technol. 2021, 4, 136–147. [Google Scholar] [CrossRef]
  25. Stančin, H.; Mikulčić, H.; Manić, N.; Stojiljiković, D.; Vujanović, M.; Wang, X.; Duić, N. Thermogravimetric and kinetic analysis of biomass and polyurethane foam mixtures Co-Pyrolysis. Energy 2021, 237, 121592. [Google Scholar] [CrossRef]
  26. Sahoo, A.; Kumar, S.; Kumar, J.; Bhaskar, T. A detailed assessment of pyrolysis kinetics of invasive lignocellulosic biomasses (Prosopis juliflora and Lantana camara) by thermogravimetric analysis. Bioresour. Technol. 2021, 319, 124060. [Google Scholar] [CrossRef]
  27. Liu, H.; Ahmad, M.S.; Alhumade, H.; Elkamel, A.; Sammak, S.; Shen, B. A hybrid kinetic and optimization approach for biomass pyrolysis: The hybrid scheme of the isoconversional methods, DAEM, and a parallel-reaction mechanism. Energy Convers. Manag. 2020, 208, 112531. [Google Scholar] [CrossRef]
  28. Lancha, J.P.; Colin, J.; Almeida, G.; Guerin, C.; Casalinho, J.; Perré, P. A validated Distributed Activation Energy Model (DAEM) to predict the chemical degradation of biomass as a function of hydrothermal treatment conditions. Bioresour. Technol. 2021, 341, 125831. [Google Scholar] [CrossRef]
  29. Wang, C.; Li, L.; Zeng, Z.; Xu, X.; Ma, X.; Chen, R.; Su, C. Catalytic performance of potassium in lignocellulosic biomass pyrolysis based on an optimized three-parallel distributed activation energy model. Bioresour. Technol. 2019, 281, 412–420. [Google Scholar] [CrossRef]
  30. Xing, J.; Wang, H.; Luo, K.; Wang, S.; Bai, Y.; Fan, J. Predictive single-step kinetic model of biomass devolatilization for CFD applications: A comparison study of empirical correlations (EC), artificial neural networks (ANN) and random forest (RF). Renew. Energy 2019, 136, 104–114. [Google Scholar] [CrossRef]
  31. Mumbach, G.D.; Alves, J.L.F.; da Silva, J.C.G.; Di Domenico, M.; Marangoni, C.; Machado, R.A.F.; Bolzan, A. Investigation on prospective bioenergy from pyrolysis of butia seed waste using TGA-FTIR: Assessment of kinetic triplet, thermodynamic parameters and evolved volatiles. Renew. Energy 2022, 191, 238–250. [Google Scholar] [CrossRef]
  32. Wang, Z.; Wu, M.; Chen, G.; Zhang, M.; Sun, T.; Burra, K.G.; Guo, S.; Chen, Y.; Yang, S.; Li, Z.; et al. Co-pyrolysis characteristics of waste tire and maize stalk using TGA, FTIR and Py-GC/MS analysis. Fuel 2023, 337, 127206. [Google Scholar] [CrossRef]
  33. Ordonez-Loza, J.; Chejne, F.; Jameel, A.G.A.; Telalovic, S.; Arrieta, A.A.; Sarathy, S.M. An investigation into the pyrolysis and oxidation of bio-oil from sugarcane bagasse: Kinetics and evolved gases using TGA-FTIR. J. Environ. Chem. Eng. 2021, 9, 106144. [Google Scholar] [CrossRef]
  34. AlAbbad, M.; Gautam, R.; Romero, E.G.; Saxena, S.; Barradah, E.; Chatakonda, O.; Kloosterman, J.W.; Middaugh, J.; D’agostini, M.D.; Sarathy, S.M. TG-DSC and TG-FTIR analysis of heavy fuel oil and vacuum residual oil pyrolysis and combustion: Characterization, kinetics, and evolved gas analysis. J. Therm. Anal. Calorim. 2023, 148, 1875–1898. [Google Scholar] [CrossRef]
  35. Mukhambet, Y.; Shah, D.; Tatkeyeva, G.; Sarbassov, Y. Slow pyrolysis of flax straw biomass produced in Kazakhstan: Characterization of enhanced tar and high-quality biochar. Fuel 2022, 324, 124676. [Google Scholar] [CrossRef]
  36. Huang, J.; Yu, C. Determination of cellulose, hemicellulose and lignin content using near-infrared spectroscopy in flax fiber. Text. Res. J. 2019, 89, 4875–4883. [Google Scholar] [CrossRef]
  37. Mishra, R.K.; Mohanty, K. Kinetic analysis and pyrolysis behaviour of waste biomass towards its bioenergy potential. Bioresour. Technol. 2020, 311, 123480. [Google Scholar] [CrossRef]
  38. Criado, J.M.; Malek, J.; Ortega, A. Applicability of the Master plots in kinetic analysis of non-isothermal data. Thermochim. Acta 1989, 147, 377–385. [Google Scholar] [CrossRef]
  39. Bianchi, O.; Martins, J.D.N.; Fiorio, R.; Oliveira, R.V.B.; Canto, L.B. Changes in activation energy and kinetic mechanism during EVA crosslinking. Polym. Test. 2011, 30, 616–624. [Google Scholar] [CrossRef]
  40. Khawan, A. Application of Solid-State Kinetics to Desolvation Reactions. Ph.D. Thesis, Iowa State University, Ames, IA, USA, 2007. [Google Scholar]
  41. Liu, J.; Jiang, X.; Cai, H.; Gao, F. Study of Combustion Characteristics and Kinetics of Agriculture Briquette Using Thermogravimetric Analysis. ACS Omega 2021, 6, 15827–15833. [Google Scholar] [CrossRef]
  42. Rasool, T.; Kumar, S. Kinetic and thermodynamic evaluation of pyrolysis of plant biomass using TGA. Mater. Today Proc. 2020, 21, 2087–2095. [Google Scholar] [CrossRef]
  43. Okolie, J.A.; Nanda, S.; Dalai, A.K.; Kozinski, J.A. Hydrothermal gasification of soybean straw and flax straw for hydrogen-rich syngas production: Experimental and thermodynamic modeling. Energy Convers. Manag. 2020, 208, 112545. [Google Scholar] [CrossRef]
  44. Zakari Boubacar Laougé, H.M. Kinetic analysis of Pearl Millet (Penissetum glaucum (L.) R. Br.) under pyrolysis and combustion to investigate its bioenergy potential. Fuel 2020, 267, 117172. [Google Scholar] [CrossRef]
  45. Johansson, A.C.; Molinder, R.; Vikström, T.; Wiinikka, H. Particle formation during suspension combustion of different biomass powders and their fast pyrolysis bio-oils and biochars. Fuel Process. Technol. 2021, 218, 106868. [Google Scholar] [CrossRef]
  46. Samadi, S.H.; Ghobadian, B.; Nosrati, M. Prediction of higher heating value of biomass materials based on proximate analysis using gradient boosted regression trees method. Energy Sources Part A Recover. Util. Environ. Eff. 2021, 43, 672–681. [Google Scholar] [CrossRef]
  47. Lachman, J.; Baláš, M.; Lisý, M.; Lisá, H.; Milčák, P.; Elbl, P. An overview of slagging and fouling indicators and their applicability to biomass fuels. Fuel Process. Technol. 2021, 217, 106804. [Google Scholar] [CrossRef]
  48. Gołab-Bogacz, I.; Helios, W.; Kotecki, A.; Kozak, M.; Jama-Rodzeńska, A. Content and uptake of ash and selected nutrients (K, ca, s) with biomass of Miscanthus × giganteus depending on nitrogen fertilization. Agriculture 2021, 11, 76. [Google Scholar] [CrossRef]
  49. Mariyam, S.; Alherbawi, M.; Pradhan, S.; Al-Ansari, T.; McKay, G. Biochar yield prediction using response surface methodology: Effect of fixed carbon and pyrolysis operating conditions. Biomass Convers. Biorefinery 2023. [Google Scholar] [CrossRef]
  50. Zubairu, A.; Gana, S.A. Production and Characterization of Briquette Charcoal by Carbonization of Agro-Waste. Energy Power 2014, 4, 41–47. [Google Scholar] [CrossRef]
  51. Gil, A.; Pallarés, J.; Arauzo, I.; Cortés, C. Pyrolysis and CO2 gasification of barley straw: Effect of particle size distribution and chemical composition. Powder Technol. 2023, 424, 118539. [Google Scholar] [CrossRef]
  52. Reza, S.; Islam, S.N.; Afroze, S.; Abu Bakar, M.S.; Sukri, R.S.; Rahman, S.; Azad, A.K. Evaluation of the bioenergy potential of invasive Pennisetum purpureum through pyrolysis and thermogravimetric analysis. Energy Ecol. Environ. 2020, 5, 118–133. [Google Scholar] [CrossRef]
  53. Nimmanterdwong, P.; Chalermsinsuwan, B.; Piumsomboon, P. Prediction of lignocellulosic biomass structural components from ultimate/proximate analysis. Energy 2021, 222, 119945. [Google Scholar] [CrossRef]
  54. Hu, G.; Ge, L.; Li, Y.; Mukhtar, M.; Shen, B.; Yang, D.; Li, J. Carbon dots derived from flax straw for highly sensitive and selective detections of cobalt, chromium, and ascorbic acid. J. Colloid Interface Sci. 2020, 579, 96–108. [Google Scholar] [CrossRef] [PubMed]
  55. Akhtar, N.; Gupta, K.; Goyal, D.; Goyal, A. Lignocellulosic biomass characteristics for bioenergy application: An overview. Environ. Eng. Manag. J. 2019, 18, 367–383. [Google Scholar] [CrossRef]
  56. Gao, X.; Laskar, D.D.; Zeng, J.; Helms, G.L.; Chen, S. A 13C CP/MAS-based nondegradative method for lignin content analysis. ACS Sustain. Chem. Eng. 2015, 3, 153–162. [Google Scholar] [CrossRef]
  57. Giudicianni, P.; Cardone, G.; Ragucci, R. Cellulose, hemicellulose and lignin slow steam pyrolysis: Thermal decomposition of biomass components mixtures. J. Anal. Appl. Pyrolysis 2013, 100, 213–222. [Google Scholar] [CrossRef]
  58. Wang, G.; Li, W.; Li, B.; Chen, H. TG study on pyrolysis of biomass and its three components under syngas. Fuel 2008, 87, 552–558. [Google Scholar] [CrossRef]
  59. Emiola-Sadiq, T.; Zhang, L.; Dalai, A.K. Thermal and Kinetic Studies on Biomass Degradation via Thermogravimetric Analysis: A Combination of Model-Fitting and Model-Free Approach. ACS Omega 2021, 6, 22233–22247. [Google Scholar] [CrossRef]
  60. Stefanidis, S.D.; Kalogiannis, K.G.; Iliopoulou, E.F.; Michailof, C.M.; Pilavachi, P.A.; Lappas, A.A. A study of lignocellulosic biomass pyrolysis via the pyrolysis of cellulose, hemicellulose and lignin. J. Anal. Appl. Pyrolysis 2014, 105, 143–150. [Google Scholar] [CrossRef]
  61. Li, J.; Shang, Y.; Wei, W.; Liu, Z.; Qiao, Y.; Qin, S.; Tian, Y. Comparative Study on Pyrolysis Kinetics Behavior and High-Temperature Fast Pyrolysis Product Analysis of Coastal Zone and Land Biomasses. ACS Omega 2022, 7, 10144–10155. [Google Scholar] [CrossRef]
  62. El-Sayed, S.A.; Khairy, M. Effect of heating rate on the chemical kinetics of different biomass pyrolysis materials. Biofuels 2015, 6, 157–170. [Google Scholar] [CrossRef]
  63. Mishra, R.K.; Mohanty, K. Pyrolysis kinetics and thermal behavior of waste sawdust biomass using thermogravimetric analysis. Bioresour. Technol. 2018, 251, 63–74. [Google Scholar] [CrossRef]
  64. Abdelouahed, L.; Leveneur, S.; Vernieres-Hassimi, L.; Balland, L.; Taouk, B. Comparative investigation for the determination of kinetic parameters for biomass pyrolysis by thermogravimetric analysis. J. Therm. Anal. Calorim. 2017, 129, 1201–1213. [Google Scholar] [CrossRef]
  65. Teh, J.S.; Teoh, Y.H.; How, H.G.; Sher, F. Thermal analysis technologies for biomass feedstocks: A state-of-the-art review. Processes 2021, 9, 1610. [Google Scholar] [CrossRef]
  66. Vafakish, B.; Wilson, L.D. Cu(II) Ion Adsorption by Aniline Grafted Chitosan and Its Responsive Fluorescence Properties. Molecules 2020, 25, 1052. [Google Scholar] [CrossRef]
  67. Gajera, B.; Tyagi, U.; Sarma, A.K.; Jha, M.K. Impact of torrefaction on thermal behavior of wheat straw and groundnut stalk biomass: Kinetic and thermodynamic study. Fuel Commun. 2022, 12, 100073. [Google Scholar] [CrossRef]
  68. Rasam, S.; Moshfegh Haghighi, A.; Azizi, K.; Soria-Verdugo, A.; Keshavarz Moraveji, M. Thermal behavior, thermodynamics and kinetics of co-pyrolysis of binary and ternary mixtures of biomass through thermogravimetric analysis. Fuel 2020, 280, 118665. [Google Scholar] [CrossRef]
  69. Ren, X.; Guo, J.; Li, S.; Chang, J. Thermogravimetric analysis-fourier transform infrared spectroscopy study on the effect of extraction pretreatment on the pyrolysis properties of eucalyptus wood waste. ACS Omega 2020, 5, 23364–23371. [Google Scholar] [CrossRef] [PubMed]
  70. Lv, P.; Almeida, G.; Perré, P. TGA-FTIR analysis of torrefaction of lignocellulosic components (cellulose, xylan, lignin) in isothermal conditions over a wide range of time durations. BioResources 2015, 10, 4239–4251. [Google Scholar] [CrossRef]
  71. Singh, S.; Wu, C.; Williams, P.T. Pyrolysis of waste materials using TGA-MS and TGA-FTIR as complementary characterisation techniques. J. Anal. Appl. Pyrolysis 2012, 94, 99–107. [Google Scholar] [CrossRef]
  72. Alves, J.L.F.; da Silva, J.C.G.; Mumbach, G.D.; Di Domenico, M.; Bolzan, A.; Machado, R.A.F.; Marangoni, C. Evaluating the bioenergy potential of cupuassu shell through pyrolysis kinetics, thermodynamic parameters of activation, and evolved gas analysis with TG/FTIR technique. Thermochim. Acta 2022, 711, 723–739. [Google Scholar] [CrossRef]
Figure 1. (a) ATR FT-IR spectrum of flax straw biomass. (b) Solid state 13C-NMR spectrum of flax straw biomass.
Energies 16 06932 g001
Figure 2. (a) TGA and (b) DTG profiles of flax straw at different heating rates under pyrolysis condition.
Energies 16 06932 g002
Figure 3. (a) TGA and (b) DTG profiles of flax straw at different heating rates under combustion conditions.
Energies 16 06932 g003
Figure 4. Relationship of maximum temperature of the degradation of pyrolysis and combustion with heating rate.
Energies 16 06932 g004
Figure 5. Linear fitting of pyrolysis from (a) Friedman, (b) KAS, (c) OFW models, and (d) plot of activation energy of pyrolysis at different conversion.
Energies 16 06932 g005
Figure 6. Linear fitting of combustion from (a) Friedman, (b) KAS, (c) OFW models, and (d) plot of activation energy of combustion at different conversion.
Energies 16 06932 g006
Figure 7. Master plots of theoretical model (Table S3) for (a) pyrolysis and (b) combustion.
Energies 16 06932 g007
Figure 8. (a) Three-dimensional FT-IR profiles of the evolved gases released from flax straw during pyrolysis (temperature based); (b) bird-eye view map of the FT-IR profile evolved gases for pyrolysis; (c) FR-IR spectra of evolved gas with the highest intensity. (d) Three-dimensional FT-IR profiles of the evolved gases released from flax straw during combustion; (e) bird-eye view map of the FT-IR profile evolved gases for combustion; (f) FR-IR spectra of evolved gas with the highest intensity.
Energies 16 06932 g008
Table 1. Isoconversional models used for kinetic studies of pyrolysis and combustion.
Isoconversional MethodEquationEa Calculation
Friedman l n β d α d t = E a R T + l n A   f α Ea is the slope of l n β d α d t vs. 1/T
KAS l n β T 2 = E a R T + l n ( A E a R   g α ) Ea is the slope of l n β T 2 vs. 1/T
OFW l n β = 1.052   E a R T 5.331 + l n ( A E a R   g α ) Ea is the slope of l n β vs. 1/T
Table 2. Physicochemical characteristics of flax straw.
Proximate AnalysisValues
Moisture content (%)5.1
VM (%)83.5
Ash content (%)5.4
FC (%)6.5
VM/FC ratio12.8
Bulk density (kg/m3)75.9
Ultimate analysis (%)
Carbon46.4
Hydrogen6.1
Oxygen41.7
Nitrogen0.5
Sulfur0.1
O/C ratio1.0
H/C ratio0.1
Heating Value Calculation (MJ/kg)
HHV19.0
Elemental Analysis of Ash (%)
K26.1
Ca19.9
Si37.2
Biochemical Composition Analysis (wt %)
Cellulose49.4
Hemicellulose19.7
Lignin20.5
Extractives8.5
Table 3. Pyrolysis characteristic parameters of flax straw biomass.
ParametersHeating Rate (°C/min)
5101520
Maximum temperature of degradation (°C)341360370375
Mass loss in the first stage %5.96.14.85.7
Mass loss in second stage %85.780.887.686.8
Residue (wt %)17.215.320.218.6
Table 4. Combustion characteristic parameters of flax straw biomass.
ParametersHeating Rate (°C/min)
5101520
Ignition temp (°C)216224227228
Burnout temp (°C)350352353370
Mass loss in first stage %2.34.11.91.7
Mass loss in second stage %76.767.069.070.0
Mass loss in third stage %20.628.225.726.2
Max burning rate (%/min)12.415.318.620.6
Average burning rate (%/min)0.080.170.380.58
Combustion characteristic index (10−8)5.2122930
Residue (wt %)1.51.71.82.1
Table 5. Calculated Ea for pyrolysis and combustion of flax straw biomass from Friedman, KAS, and OFW methods.
Kinetic MethodConversion (α)PyrolysisCombustion
EaR2EaR2
Freidman0.196.980.96227.60.92
0.2110.180.98174.10.91
0.3120.210.99178.20.96
0.4132.770.91231.00.96
0.5122.170.90241.50.97
0.675.250.90167.10.97
Average109.6-203.3-
KAS0.166.180.98207.60.99
0.287.410.98185.60.99
0.398.350.98183.40.98
0.4105.750.99212.40.95
0.5116.500.93222.90.96
0.6156.590.94211.20.91
Average105.1-203.9-
OFW0.165.60.93233.20.94
0.289.80.97207.10.96
0.396.70.98219.70.93
0.4111.80.96255.30.90
0.5110.40.94274.60.94
0.6131.90.93245.10.93
Average101.0-239.2-
Table 6. Thermodynamic parameters of flax straw biomass by DAEM method at δ = 10 °C min−1.
PyrolysisCombustion
ConversionFrequency Factor, A, (1/s)ΔH, (kJ/mol)ΔG, (kJ/mol)ΔS, (J/mol·K)Frequency Factor, A, (1/s)ΔH, (kJ/mol)ΔG, (kJ/mol)ΔS, (J/mol·K)
0.12.8 × 10³63.5123.6 7.7 × 1017204.9207.6
0.21.9 × 10584.7144.8 8.5 × 1014182.9185.6
0.31.2 × 10695.7155.8 1.7 × 1014180.8183.4
0.43.7 × 106103.1163.2 2.3 × 1016209.8212.4
0.52.2 × 107113.8173.9 7.9 × 1016220.3222.9
0.65.3 × 108153.9214.0 3.4 × 1015208.6211.2
Average1.2 × 1010102.5162.6−187.8Average201.2203.9−8.3
Disclaimer/Publisher’s Note: The statements, opinions and data contained in all publications are solely those of the individual author(s) and contributor(s) and not of MDPI and/or the editor(s). MDPI and/or the editor(s) disclaim responsibility for any injury to people or property resulting from any ideas, methods, instructions or products referred to in the content.

