Abstract
The humidifier plays a key role in a humidification–dehumidification (HDH) desalination system; it directly affects both the freshwater production efficiency and energy consumption ratio of the system. In this study, for a humidifier in an HDH system, a heat–mass coupled differential equation model of spray water and air on the surface of the packing material was established, and the effects of parameters such as the spray water temperature (tw), mass flow rate of spray water (mw), air temperature (ta), and air mass flow rate (ma) on the humidification performance of humidifiers composed of eight different types of packing materials were investigated. The results show the following: (1) Under the same inlet spray water and air conditions, the humidification performance of different packing materials from good to bad is as follows: cellulose paper, polypropylene, hackettes, saddles, snowflakes, wooden slats, polyvinyl chloride, gunny bag cloth. (2) Increasing the tw can significantly improve the humidification performance. To achieve higher humidification energy efficiency, it is recommended to increase the tw to above 80 °C. (3) With the increase in the mw, although the humidification efficiency (εhum) decreases slightly, the humidification rate (mhum) increases, and the specific humidification energy ratio (ηhum) decreases accordingly. To maintain a high mhum and a low ηhum, it is advisable to control the mw at not less than 0.5 kg/s. (4) Increasing the humidifier inlet ta can improve the mhum, εhum, and ηhum, although not as effectively as increasing tw. (5) Increasing the ma can improve mhum and εhum. However, it simultaneously increases the ηhum. The results of this study can provide theoretical guidance for the selection of efficient packing materials and the optimization of humidifier operating conditions in HDH desalination systems.
1. Introduction
The global shortage of freshwater resources stands as a paramount factor constraining both economic development and the enhancement of people’s quality of life. Desalination, which is the process of converting saltwater into freshwater, is widely regarded as one of the most effective methods to cope with the shortage of freshwater resources [1]. Among the current commercial desalination systems, reverse osmosis (RO), multi-effect distillation (MED), and multi-stage flash (MSF) desalination systems, which demand substantial energy and electricity, are better suited for large-scale industrial water applications (thousands of cubic meters per day) [2]. Humidification–dehumidification (HDH) desalination systems are characterized by their energy efficiency, cost-effectiveness, and adaptability to a wide array of energy sources. They can prove particularly adept at meeting the freshwater supply needs of decentralized and small- to medium-scale applications, especially in remote or offshore island areas [3,4]. In the realm of decentralized water supply, HDH desalination systems present a compelling case for their adoption due to their energy efficiency, scalability, flexibility, and lower environmental impact. An HDH system is uniquely capable of operating effectively with low-grade heat sources such as solar thermal energy or waste heat from industrial processes. This makes it more efficient than other desalination methods like RO or MSF, which require high-grade electrical or thermal energy. The scalability and flexibility of HDH systems are also notable. They can easily be adjusted to meet water demand, making them ideal for decentralized applications. They can also be combined with other renewable energy systems to create hybrid systems that enhance performance and reliability. In terms of environmental impact, HDH systems outshine other desalination methods. They eliminate the need for high-pressure pumps or chemical additives, which are often associated with significant environmental concerns. However, it is important to recognize that the performance and cost-effectiveness of an HDH desalination system depends on various factors, including the availability and cost of heat sources, local climate conditions, and specific design and operating parameters. To optimize HDH desalination systems, several studies have mainly focused on enhancing system performance by making structural improvements and utilizing the condensation–evaporation heat of heat pump systems to increase their energy utilization efficiency, thus improving the freshwater production performance [5,6,7]. Secondly, the selection of appropriate packing materials can significantly improve the contact area and duration between the spray water and air entering the humidifier, thus enhancing the heat–mass transfer effect, improving the humidification efficiency of the humidifier, and consequently improving the energy efficiency of the freshwater production system [8,9,10].
Several researchers have conducted theoretical and experimental studies related to packing materials for HDH desalination systems. Metal–organic frameworks (MOFs) possess a considerable specific surface area. Salama et al. [11,12] characterized MOFs and investigated their potential application in humidification–dehumidification desalination systems. Li et al. [13] conducted an experiment involving the design of a heat-pump-driven HDH domestic pure water machine. They used cellular porous packing made of polypropylene cotton as the packing material in the humidifier. The findings indicated that the system achieved the highest freshwater production per unit of energy consumption, reaching up to 1996.5 g/(kW h), at a system inlet water temperature of 15 °C. Xu et al. [14] experimentally analyzed the freshwater production performance of a system when honeycomb paper and plastic polyhedron empty balls (PPEBs) were used as packing materials, and the results showed that the freshwater production rate of using honeycomb paper as a packing material was 27.76% higher than that of using PPEBs with a spray water mass flow rate of 0.9 m3 /h. Kabeel and Abdelgaied [15] utilized cellulose paper with dimensions of 45 × 45 × 60 cm as the packing material in a humidifier. The results indicated that as the air flow rate increased from 50 m³/h to 75 m³/h, the system’s freshwater production rate increased from 29.55 L/d to 42.30 L/d. Sharshir et al. [16] established a solar-assisted HDH desalination system using cellulose paper with a total surface area of 10 m2 as the packing material. They conducted experimental research on the influence of the spray water mass flow rate on the freshwater production rate and found that the system achieved the best freshwater production rate when the mass flow rate of spray water was 2.5 L/min. Li et al. [17] designed and constructed a small HDH desalination system with a solar air heater. The packing material was cellulose paper with dimensions of 500 × 400 × 150 mm. The results showed that with a spray water mass flow rate of 4 L/min and an increase in spray water temperature from 9 °C to 27 °C, the air temperature at the outlet of the humidifier increased from 35 °C to 42 °C, reaching a maximum relative humidity of 97% and achieving a freshwater production rate of 1000 L/day. Muthusamy and Srithar [18] experimented with two packing materials (gunny bag cloth and sawdust) and found that under the same operating conditions, gunny bag cloth, due to its water-absorbing properties, resulted in better heat and mass transfer efficiency between air and spray water. Al-Hallaj et al. [19] used wood as a packing material to analyze the freshwater production performance of HDH systems under natural and forced air circulation conditions. The results showed that at lower temperatures, forced air circulation significantly increased the humidification efficiency compared to that at higher temperatures. Moumouh et al. [20] used metal with a specific surface area of 200 m2/m3 as the packing material, simulated the conditions at different spray water temperatures, and validated the results experimentally. The results showed that at a spray water temperature of 60 °C, a spray water mass flow rate of 0.008 kg/s, and an air mass flow rate of 0.0264 kg/s, the air outlet temperature was 39 °C, and the freshwater production rate was 2.59 kg/h. Hussain et al. [7] theoretically analyzed and experimentally verified the performance of three hydrophobic plastic packing materials, namely hackettes, saddles, and snowflakes, in an HDH desalination system. The results showed that hackettes had the highest heat transfer coefficient under the same operating conditions, resulting in the best system freshwater production performance. Raj et al. [21] experimentally validated the humidification performance of a humidifier with a base diameter of 30 cm and a height of 30 cm, manufactured using polypropylene. The results indicated that at a spray water mass flow rate of 150 L/h and an air mass flow rate of 0.55 m3/h, the humidifier achieved the highest humidification efficiency, reaching 75%. Ghazouani et al. [22] conducted experiments using the unique Egyptian sponge gourd as the packing material. The results showed that the humidifier achieved maximum humidification efficiency when the air velocity was 0.5 m/s, and the spray water temperature and mass flow rate were 70 °C and 30 kg/min, respectively.
A comprehensive review of the literature reveals a consensus that the choice of humidifier packing materials exerts a notable influence on the freshwater production performance in HDH desalination systems. Researchers have attempted to use many different packing materials to evaluate HDH systems’ freshwater production performance. However, scholarly studies on different types of humidifier packings vary in the type of packing materials, the humidifier height, the humidifier sectional area, and the operating conditions of the spray water and air, which leads to a lack of evaluating the humidification performance of different types of humidifier packings under same operating conditions. This will affect the optimal selection of packing materials. Hence, it is necessary to further investigate the humidification performance of different packing materials under the same operating conditions to elucidate the optimal packing material to improve the freshwater production performance of an HDH desalination system.
In this work, for a humidifier of an HDH desalination system, a differential equation model of heat–mass coupling between spray water and air on the surface of the packing material was established. Eight different types of packing materials were selected, namely wooden slats, snowflakes, polyvinyl chloride, saddles, gunny bag cloth, hackettes, cellulose paper, and polypropylene. A detailed comparative analysis was carried out to investigate the effects of the spray water temperature (tw), mass flow rate of spray water (mw), air mass flow rate (ma), and air temperature (ta) on the humidification performance. It is hoped that a reference can be provided for the selection of efficient humidifier packing materials and the optimization of operating conditions for humidifiers.
2. Heat and Mass Coupled Differential Equation Model
The schematic diagram of the humidifier for the HDH desalination system is shown in Figure 1. In the humidifier, the packing material is the core component. The spray water is evenly sprayed from the top of the humidifier onto the surface of the packing material to form a thin water film. The air is introduced from the bottom of the humidifier, passes through the packing material, increases in temperature and humidity through heat and mass transfer with the spray water, and then exits from the top of the humidifier. Excess spray water is discharged from the bottom of the humidifier.
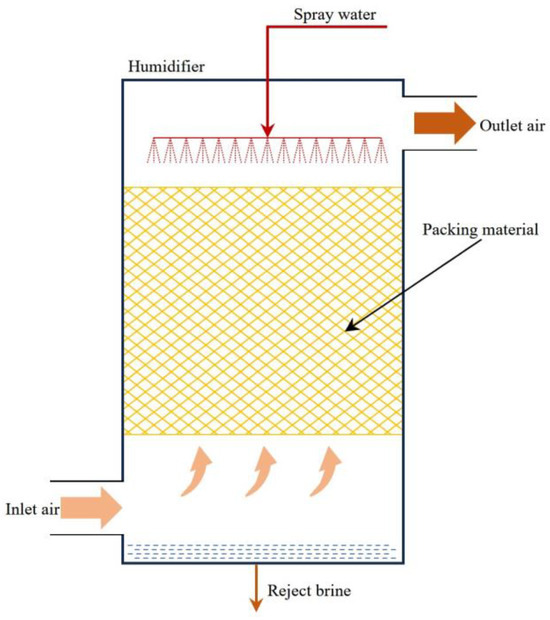
Figure 1.
Schematic diagram of humidifier for HDH desalination system.
For an infinitesimal section of packing material in the z-direction with a height of dz (m) and a cross-sectional area of Apm (m2), the volume dV (m3) of this control body can be calculated as follows:
dV = Apmdz
The heat and mass transfer relationship between air and spray water in the control body is illustrated in Figure 2. At the interface between the air and water, there exists an extremely thin layer of saturated air. Within the boundary layer, the temperature of the air is equal to the temperature of the water. At the boundary layer, the low-temperature air receives heat and mass from the high-temperature spray water [23].
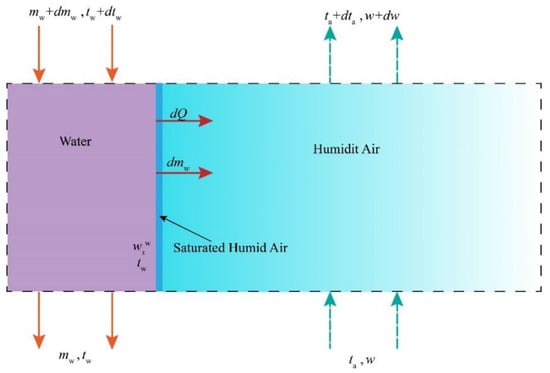
Figure 2.
Principle of heat–mass transfer between spray water and air in microelements of the packing material.
For the air in the control body, the change in mass, dm, is reflected as a change in moisture content:
where ma represents the air mass flow rate (kg/s) and w represents the moisture content of air (kg/kgdry air).
The driving force for mass transfer is the difference in moisture content between the saturated humid air and the humid air, namely:
where represents the moisture content of saturated air in the saturated boundary layer (kg/kgdry air), β represents the mass transfer coefficient (kg/(m2s)), and dA represents the area of heat and mass transfer (m2).
The air mass balance differential equation can be obtained from Equations (2) and (3):
The change in water mass in the control body, dm, is equal to the change in the mass flow rate of the spray water:
During the heat and mass transfer of spray water and air on the packing material surface, the reduction in the mass flow rate of spray water is equal to the increase in the mass flow rate of air. The differential mass balance equation for spray water can be obtained from Equations (4) and (5):
The heat change, dQ, of the air in the control body is reflected as a change in enthalpy:
where ha represents the enthalpy of air (kJ/kg).
The heat gained by the air, dQ, consists of sensible and latent heat transfer:
where Qsen and Qlat represent sensible and latent heat transfer, respectively.
The driving force for sensible heat transfer is the temperature difference between the saturated air in the saturated humid air and the humid air:
where α represents the heat transfer coefficient (W/(m2·K)); tw represents the spray water temperature, which is equal to the saturated air temperature in the saturated boundary layer, °C; and ta represents the air temperature, °C.
The latent heat transfer can be expressed by the enthalpy of water vapor and evaporation of water:
where hwv represents the enthalpy of water vapor at a temperature equal to the water temperature.
By simultaneously considering Equations (7)–(10), we can derive the following:
The enthalpies of air and water vapor in Equation (11) can be expanded as follows, respectively:
where r0 represents the latent heat of vaporization of water (kJ/kg).
The heat and mass transfer surface area of the control body dA (m2) is dependent on both the specific surface area of the packing material and the control body volume:
where Spm represents the specific surface area of the packing material (m2/m3) and Apm represents the cross-sectional area of the packing material (m2).
The energy balance differential equation for the air is obtained by incorporating Equations (12)–(14) into Equation (11).
The heat change of the spray water in the control body, dQ, is reflected as a change in mass flow rate and temperature:
where cpw represents the specific heat of spray water at constant pressure, J/(kg·K).
The heat lost by the spray water, dQ, includes sensible and latent heat transfer. The differential equation for the energy balance of spray water can be obtained by combining Equations (8)–(14):
Based on the principles of mass and energy conservation of spray water and air within the humidifier, Equations (4), (6), (15) and (17) form a model of the coupled differential equations of heat and mass for the humidifier.
During the model’s formulation, several assumptions were made:
- (1)
- The areas of heat and mass transfer were equal.
- (2)
- The heat transfer between the humidifier and the external environment was disregarded during the process of thermal exchange between spray water and air within the humidifier.
- (3)
- The heat and mass exchange process within the humidifier remains in a steady state.
The mass transfer coefficient is used to describe the transfer rate between spray water and air in the humidifier. In this study, the mass transfer coefficient correlation equation described in [24] was used. Eight packing materials that can be used in HDH systems were selected from the related studies [7,22,25]. The correlation equation coefficients for the eight packing materials listed in Table 1 ensure the accuracy and reliability of the calculations. The mass transfer coefficient correlation formula is as follows:
where a and b represent the correlation coefficients.

Table 1.
Physical properties of packing materials.
The heat transfer coefficient is calculated as follows:
where Lef represents the Lewis factor, cpa represents the specific heat of air at constant pressure (J/(kg·K)), and cpv denotes the specific heat of water vapor at constant pressure (J/(kg·K)).
The Lewis factor can be obtained from empirical equations found in the literature [26,27], which can be used to correlate the mass transfer coefficients and heat transfer coefficients:
2.1. Evaluation Indicators of Humidification Performance
- Humidification rate
In the humidifier, the humidification rate is expressed as the mass of water vapor entering the air per unit of time:
where mhum represents the humidification rate (kg/h) and ωin and ωout represent the humidity ratios of the inlet and outlet air in the humidifier (kg/kgdry air).
- 2.
- Humidification efficiency
The humidification efficiency is defined as the rate of actual enthalpy difference of air or spray water between the inlet and outlet of the humidifier to the maximum possible enthalpy difference. The expression is as follows:
In Equation (22), εhum represents the humidification efficiency of the humidifier, ha,in and ha,out represent the enthalpy of the inlet and outlet of air in the humidifier (kJ/kg), hw,in and hw,out represent the enthalpy of the inlet and outlet of spray water in the humidifier (kJ/kg), ha,out,max represents the ideal enthalpy of air when its temperature at the humidifier outlet equals the temperature of the inlet spray water and its relative humidity is 100% (kJ/kg), and hw,out,min represents ideal enthalpy of water when its temperature at the humidifier outlet equals the temperature of inlet air (kJ/kg).
- 3.
- Specific humidification energy ratio
The specific humidification energy ratio is one of the most important parameters for evaluating the performance of humidifiers; it indicates the theoretical minimum energy consumption required to increase the absolute humidity in the air by 1 kg of moisture during humidification. A lower specific humidification energy ratio indicates better humidifier performance, as it can achieve the same humidification with less energy.
where ηhum represents the specific humidification energy ratio (kJ/kg) and Qmin represents the minimum energy consumption required to overcome the resistance of the air passing through the packing material (kW).
The pressure drop, ∆P, of the air as it passes through the packing material is calculated based on the Ergun equation, as expressed in Equation (25) [28]:
where ψ represents the drag coefficient, and a higher drag coefficient indicates that the packing material offers greater resistance to the air flow; B represents the wall factor, which describes the influence of the humidifier’s surface structure on the air flow and pressure drop; and dpm represents the equivalent diameter of the packing material (m).
2.2. Model Validation
To validate the accuracy and reliability of the model proposed in this study, a comparison was made with experiments conducted by Zhang et al. [29] using polypropylene as a packing material. The primary parameters of the main devices in the humidification device are shown in Table 2. The parameters of the measuring instruments for spray water and air are shown in Table 3. The relevant comparison results are shown in Figure 3. It is observed that under the same operating conditions (air mass flow rate of 1.0 kg/(m2s); spray water temperature of 50 °C; air dry bulb temperature and relative humidity of 16 °C and 10%, respectively), the average errors in mhum, εhum, and ηhum are 1.39%, 0.35%, and 0.85%, respectively. The results indicate a strong agreement between the simulation and experimental results, highlighting the model’s high accuracy and credibility. After the accuracy of the model was verified, the relevant operating parameters of the system were changed to analyze the humidification performance of different packing materials.

Table 2.
The primary parameters of main devices.

Table 3.
The parameters of the measuring instruments.
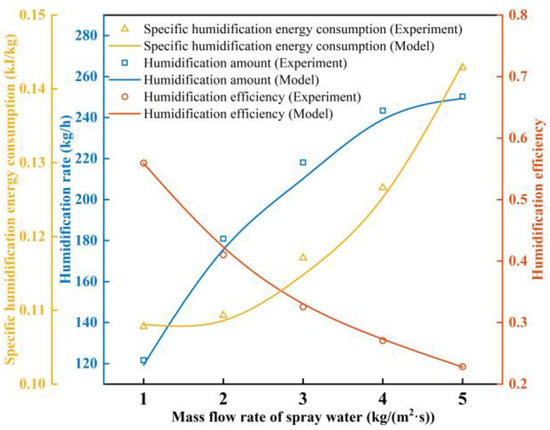
Figure 3.
Comparison of experimental and simulated humidification performances.
3. Results and Discussion
Based on the validated heat–mass transfer differential model of the humidifier, a theoretical analysis was conducted to examine the variations in key parameters such as the humidification rate (mhum), humidification efficiency (εhum), and specific humidification energy ratio (ηhum) for eight different types of packing materials, namely wooden slats, snowflakes, polyvinyl chloride, saddles, gunny bag cloth, hackettes, cellulose paper, and polypropylene. These analyses were carried out under different conditions of spray water temperature (tw), spray water mass flow rate, air temperature (ta), and air circulation rate. It is hoped that the results will provide a reference for the experimental selection of suitable humidifier packing materials and operating conditions.
3.1. Effect of Spray Water Temperature on Humidification Performance with Different Packing Materials
When analyzing the change in humidification performance with spray water temperature with different packing materials, the inlet air and spray water mass flow rates were set to 0.4 kg/s, and the inlet ta was set to 30 °C. Figure 4 shows the effect of the spray water temperature on the humidification rate with different packing materials. As shown in Figure 4, when the tw values are the same, the mhum values of different packing materials from large to small are in the following order: cellulose paper, hackettes, polypropylene, saddles, snowflakes, wooden slats, polyvinyl chloride, and gunny bag cloth. Taking the tw of 60 °C as an example, cellulose paper has the largest mhum of 140.69 kg/h, and gunny bag cloth has the smallest mhum of 12.85 kg/h. Equation (18) indicates that this difference is mainly due to the combined effects of the packing material parameters a, b, and Spm. Under the same operating conditions, cellulose paper has the highest mass transfer coefficient, leading to more efficient heat and mass transfer between air and spray water, resulting in the highest mhum. With the increase in tw, the mhum of various packing materials shows an increasing trend. When the tw increases from 40 °C to 90 °C, the mhum of wooden slats, snowflakes, polyvinyl chloride, saddles, gunny bag cloth, hackettes, cellulose paper, and polypropylene increases from 15.70, 15.92, 5.04, 28.10, 4.04, 47.50, 56.61, 47.67 kg/h to 156.22, 157.11, 83.77, 198.22, 76.08, 271.01, 298.40, and 269.72 kg/h, with an increase of 9.95, 9.87, 16.61, 7.05, 18.81, 5.71, 5.27, and 5.66 times, respectively. This may be due to the increase in the tw leading to an increase in the temperature difference between the spray water and the air, thus improving the efficiency of the heat and mass transfer between the spray water and the air in the humidifier. As the ta increases, the saturated vapor pressure of the moister air also increases, further enhancing the ability of the air to absorb water vapor, so more heat and mass from the spray water are transferred to the air, effectively increasing the mhum. Therefore, raising the tw can significantly increase the mhum of the humidifier.
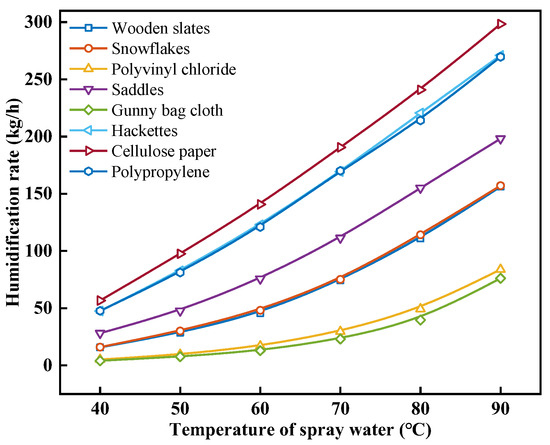
Figure 4.
Effect of spray water temperature on the humidification rate with different packing materials.
Figure 5 shows the effect of the spray water temperature on the humidification efficiency with different packing materials. As shown in Figure 5, when the tw values are the same, the mhum values of different packing materials from large to small are in the following order: cellulose paper, polypropylene, hackettes, saddles, snowflakes, wooden slats, polyvinyl chloride, and gunny bag cloth. When the tw is 60 °C, cellulose paper has the highest εhum of 58.37%, and gunny bag cloth has the lowest εhum of 5.04%. The higher the tw, the greater the εhum of the humidifier. When the tw is increased from 40 °C to 90 °C, the εhum of wooden slats, snowflakes, polyvinyl chloride, saddles, gunny bag cloth, hackettes, cellulose, paper, and polypropylene increases from 10.73%, 11.04%, 3.46%, 19.24%, 2.74%, 32.68%, 39.06%, and 33.32% to 35.76%, 37.01%, 18.29%, 47.93%, 16.04%, 67.91%, 76.34%, and 67.94%, with an increase of 2.33, 2.35, 4.29, 1.49, 4.85, 1.08, 0.95, and 1.04 times, respectively. This is because when the tw increases, it leads to an increase in the heat and mass transfer coefficient. As a result, the temperature and moisture content of the outlet air from the humidifier increase, leading to an increase in the enthalpy of the outlet air. According to the definition of εhum in Equation (22), the εhum increases.
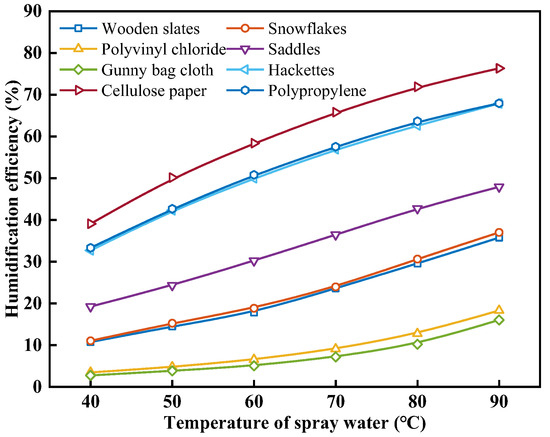
Figure 5.
Effect of spray water temperature on the humidification efficiency with different packing materials.
Figure 6 shows the effect of the spray water temperature on the specific humidification energy ratio with different packing materials. As shown in Figure 6, under the same operating conditions, the higher the tw, the lower the ηhum. When the tw increases from 40 °C to 90 °C, the ηhum for wooden slats, polyvinyl chloride, saddles, gunny bag cloth, hackettes, cellulose paper, and polypropylene decreases from 5.85, 51.35, 7.48, 38.80, 4.62, 2.98, and 14.14 kJ/kg to 0.59, 3.09, 1.06, 2.06, 0.81, 1.72, and 2.50 kJ/kg, with a reduction of 89.95%, 93.98%, 85.82%, 94.68%, 82.47%, 42.47%, and 82.33%, respectively. From Equation (23), it is evident that the ηhum is determined by both the mhum and the minimum energy required to overcome the resistance when air passes through the packing material. Indeed, a higher tw leads to a more efficient heat and mass transfer between the spray water and air in the humidifier. This results in a greater transfer of heat and mass from the spray water to the air, ultimately enhancing mhum. However, it is important to note that with a constant ma, the pressure drop of the air as it passes through the packing material remains unchanged, as does the minimum energy consumption required to overcome the resistance in the packing material. Therefore, under the same ma, as the tw increases, the ηhum decreases for all packing materials. It can also be observed that at a lower tw, there is a significant difference in ηhum among the packing materials. However, when the tw exceeds 80 °C, regardless of the choice of packing material, the ηhum essentially reaches its minimum value, and this minimum value is quite similar among different packing materials. Therefore, to achieve a higher ηhum, it is advisable to select a tw of 80 °C or above. It is worth noting that the additional energy required to increase the spray water temperature can cause a reduction in the overall energy efficiency ratio of the desalination system. Energy recovery from the reject brine should be considered in the desalination system design.
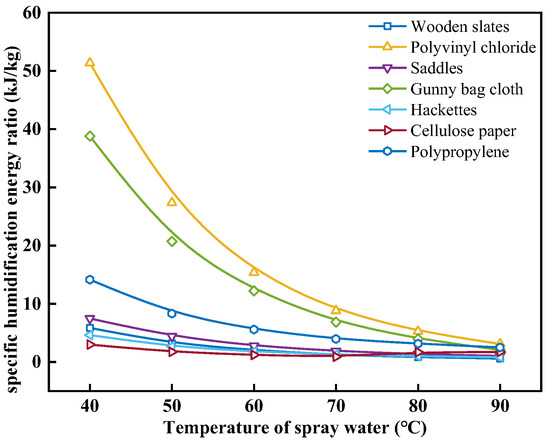
Figure 6.
Effect of spray water temperature on the specific humidification energy ratio with different packing materials.
3.2. Effect of Mass Flow Rate of Spray Water on the Humidification Performance with Different Packing Materials
When analyzing the change in humidification performance with the mass flow rate of spray water with different packing materials, the inlet air mass flow rate was set to 0.4 kg/s, and the inlet temperatures of air and spray water were set to 30 °C and 90 °C. Figure 7 shows the effect of the mass flow rate of spray water on the humidification rate. As can be seen from Figure 7, under the same operating conditions, the mhum values from highest to lowest are in the following order: cellulose paper, polypropylene, hackettes, saddles, snowflakes, polyvinyl chloride, gunny bag cloth, and wooden slats. From Equation (18), it is evident that the difference in mhum between different humidifiers is determined by the physical properties of the packing material, which include Spm, a, and b. As the mw increases, the mhum of each packing material also increases, but the rate of increase diminishes. When the mw is increased from 0.2 kg/s to 0.7 kg/s, the mhum values for wooden slats, snowflakes, polyvinyl chloride, saddles, gunny bag cloth, hackettes, cellulose paper, and polypropylene increase from 65.71, 101.97, 63.90, 126.41, 57.39, 130.43, 170.32, and 153.94 kg/h to 72.79, 219.03, 100.15, 285.05, 80.07, 340.89, 383.63, and 374.59 kg/h, respectively. This is because increasing the mw can enhance the heat and mass transfer efficiency between the spray water and air in the humidifier, promoting the heat and mass transfer process between the air and spray water on the packing material’s surface. This leads to an increase in the temperature and humidity of the air at the outlet of the humidifier. However, when the temperature and humidity of the air at the humidification packing material’s surface increase with an increase in mw, the temperature difference between the air and spray water, as well as the saturation vapor pressure difference between the humid air and the saturated humid air boundary layer on the humidifier’s surface water film, decreases. This reduction is not conducive to the heat and mass transfer process between the air and spray water on the packing material’s surface, and this adverse effect increases with an increase in ma.
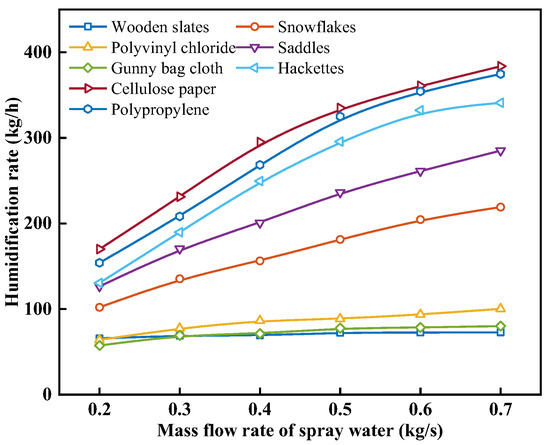
Figure 7.
Effect of mass flow rate of spray water on the humidification rate with different packing materials.
Figure 8 shows the effect of the mass flow rate of spray water on the humidification efficiency with different packing materials. As can be seen from Figure 8, under the same operating conditions, the εhum of cellulose paper is the largest, and with the increase in mw, the εhum of each packing material is reduced, but the magnitude of the reduction is different. The εhum of hackettes is the smallest with the reduction in mw, followed by cellulose paper. When the mw is increased from 0.2 kg/s to 0.7 kg/s, the εhum for wooden slats, snowflakes, polyvinyl chloride, saddles, gunny bag cloth, hackettes, cellulose paper, and polypropylene decreases from 30.25%, 49.10%, 28.98%, 61.79%, 25.91%, 89.59%, 93.86%, and 80.31% to 8.43%, 28.06%, 12.58%, 38.08%, 9.39%, 70.21%, 71.45%, and 57.09%, with a reduction of 72.15%, 42.85%, 56.58%, 38.37%, 63.75%, 21.63%, 23.88%, and 28.91%, respectively. This is because, as analyzed in Figure 7, with the increase in mw, the magnitude of the heat and mass transfer between the air and spray water decreases. However, the increase in mw is linear. Consequently, the outlet temperature of the spray water rises, leading to a reduction in εhum, as indicated by Equation (22).
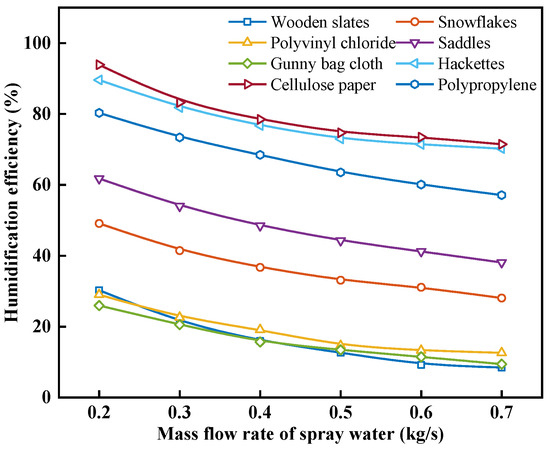
Figure 8.
Effect of mass flow rate of spray water on the humidification efficiency with different packing materials.
Figure 9 shows the effect of the mass flow rate of spray water on the specific humidification energy ratio with different packing materials. As can be seen from Figure 9, it can be observed that under the same operating conditions, cellulose paper has the lowest ηhum, and with the increase in mw, the ηhum decreases for all packing materials, albeit to varying extents. When the mw values were 0.2, 0.3, 0.4, 0.5, 0.6, and 0.7 kg/s, the ηhum for wooden slats, polyvinyl chloride, saddles, gunny bag cloth, hackettes, cellulose paper, and polypropylene decreased from 0.83, 4.05, 1.66, 2.73, 1.73, 0.73, and 4.38 kJ/kg to 0.75, 2.68, 0.74, 1.96, 0.68, 0.44, and 2.75 kJ/kg, with a reduction of 9.72%, 33.72%, 55.65%, 28.33%, 60.51%, 39.75%, and 37.13%, respectively. As the mw increases, the reduction in ηhum gradually decreases. For cellulose paper, at mw of 0.2, 0.3, 0.4, 0.5, 0.6, and 0.7 kg/s, the ηhum is 0.73, 0.63, 0.57, 0.50, 0.48, and 0.44 kJ/kg, respectively. This is because ηhum is determined by both the mhum and the energy required to overcome the resistance as air passes through the humidifier. The magnitude of the increase in mhum gradually decreases as the mw increases. According to Equation (24), the energy required to overcome the resistance in the humidifier remains constant. Therefore, as the mw increases, the ηhum gradually decreases, and the rate of decrease also gradually decreases. When the mw exceeds 0.5 kg/s, the ηhum for humidification basically stops decreasing. Therefore, to ensure the minimum theoretical energy consumption for the humidifier to produce a unit mass of water vapor, it is recommended to have a mw of not less than 0.5 kg/s.
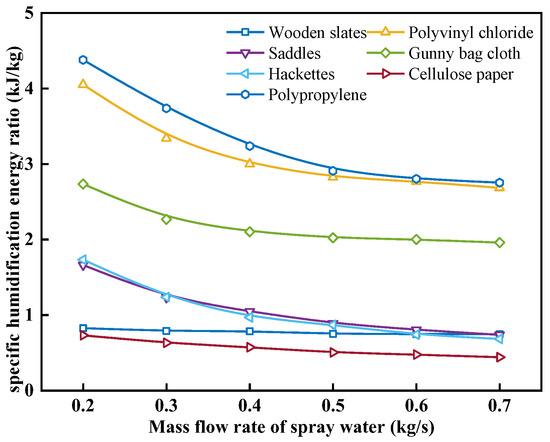
Figure 9.
Effect of mass flow rate of spray water on the specific humidification energy ratio with different packing materials.
3.3. Effect of Air Temperature on Humidification Performance with Different Packing Materials
When analyzing the change in humidification performance with air temperature with different packing materials, the inlet spray water temperature was set to 80 °C, and the inlet air and spray water mass flow rates were set to 0.4 kg/s. Figure 10 shows the effect of the air temperature on the humidification rate with different packing materials. As can be seen from Figure 10, under the same operating conditions, the mhum values from highest to lowest are in the following order: cellulose paper, polypropylene, hackettes, saddles, snowflakes, wooden slats, polyvinyl chloride, and gunny bag cloth. As the ta increases, the mhum of various packing materials increases, but the extent of the increase gradually diminishes. When the ta rises from 30 °C to 70 °C, the mhum of wooden slats, snowflakes, polyvinyl chloride, saddles, gunny bag cloth, hackettes, cellulose paper, and polypropylene increases from 94.44, 99.67, 44.68, 130.32, 37.07, 169.77, 182.78, and 176.70 kg/h to 109.22, 116.39, 49.24, 155.98, 41.52, 217.19, 243.23, and 222.16 kg/h, with an increase of 15.65%, 16.77%, 10.21%, 19.69%, 11.98%, 27.94%, 33.07%, and 25.73%, respectively. The mhum for cellulose paper at a ta of 30, 40, 50, 60, and 70 °C is 182.78, 209.08, 225.78, 238.73, and 243.23 kg/h, respectively. This is because increasing the ta enhances the heat and mass transfer efficiency between the air and the spray water, promoting the heat and mass transfer process between the air and the spray water on the surface of the packing material. Consequently, this results in an increase in both the temperature and moisture content of the air at the humidifier outlet. However, as the ta increases, the temperature difference between the air and the spray water decreases. This reduction leads to a decrease in the difference in moisture content between the saturated air boundary layer and the air. This is unfavorable for the heat and mass transfer between the air and the spray water. Additionally, at a higher ta, this unfavorable effect becomes more pronounced. Therefore, with the rise in ta, the mhum shows an increasing trend, but the growth rate of this trend gradually slows down.
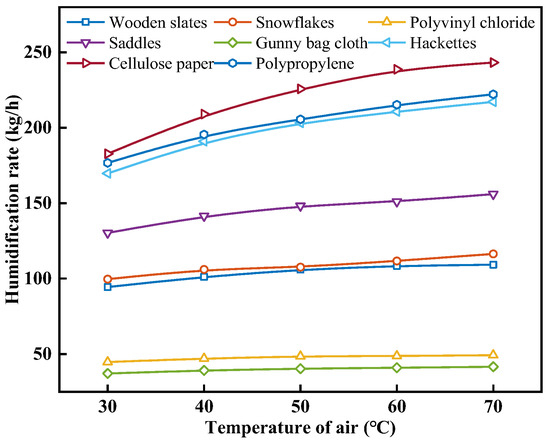
Figure 10.
Effect of air temperature on humidification rate with different packing materials.
Figure 11 shows the effect of the air temperature on the humidification efficiency with different packing materials. As can be seen from Figure 11, under the same operating conditions, cellulose paper exhibits the highest εhum, and with the increase in ta, the εhum of all packing materials increases. When the ta increases from 30 °C to 70 °C, the εhum of wooden slats, snowflakes, polyvinyl chloride, saddles, gunny bag cloth, hackettes, cellulose paper, and polypropylene increases from 29.32%, 30.48%, 12.50%, 42.10%, 10.57%, 63.16%, 70.56%, and 62.87% to 44.59%, 45.01%, 20.03%, 62.36%, 16.00%, 84.70%, 92.46%, and 83.04%, with an increase of 52.08%, 47.66%, 60.33%, 48.13%, 51.41%, 34.10%, 31.04%, and 32.08% for the respective packing materials. This is because, as shown in Figure 10, with the increase in the inlet ta, the rate of increase in the outlet air enthalpy decreases. Therefore, though the εhum increases, the magnitude of the improvement becomes gradually smaller.
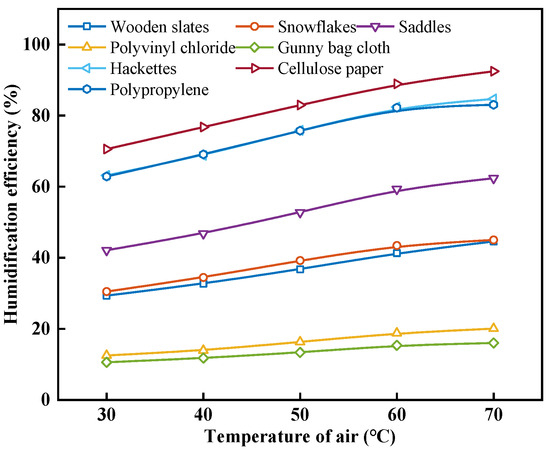
Figure 11.
Effect of air temperature on humidification efficiency with different packing materials.
Figure 12 shows the effect of the air temperature on the specific humidification energy ratio with different packing materials. As can be seen from Figure 12, under the same operating conditions, hackettes have the lowest ηhum, followed by cellulose paper. And as the ta rises, the ηhum of each packing material increases, but the increase is different. When the ta increases from 30 °C to 70 °C, the ηhum of wooden slats, polyvinyl chloride, saddles, gunny bag cloth, hackettes, cellulose paper, and polypropylene increases from 0.84, 5.26, 1.35, 5.79, 0.53, 0.69, and 3.12 kJ/kg to 1.46, 8.69, 2.42, 9.70, 1.01, 1.38, and 5.71 kJ/kg, with an increase of 73.42%, 65.25%, 79.42%, 67.61%, 91.84%, 99.18%, and 82.99%, respectively. With the increase in ta, the magnitude of the increase in ηhum decreases. For cellulose paper, at a ta of 30 °C, 40 °C, 50 °C, 60 °C, and 70 °C, the ηhum is 0.69, 0.77, 0.89, 1.07, and 1.38 kg/h, respectively. This is because the ηhum is determined by both the mhum and the energy consumption required to overcome the resistance of the humidifier. mhum increases at a lower and lower rate as the ta increases. The ma remains constant, so the energy consumption required for the humidifier to overcome the resistance remains essentially the same. Therefore, with an increase in ta, the ηhum gradually increases.
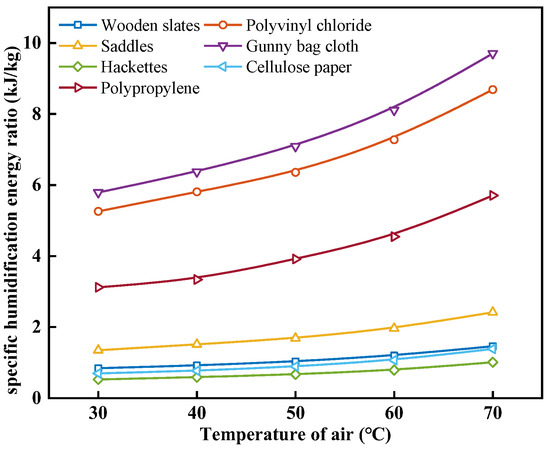
Figure 12.
Effect of air temperature on specific humidification energy ratio with different packing materials.
In summary, increasing the inlet ta can increase the mhum and εhum, but it will also increase the ηhum. Compared to increasing the tw, raising the inlet ta is not as effective in improving the humidification performance of the humidifier.
3.4. Effect of Air Mass Flow Rate on Humidification Performance with Different Packing Materials
When analyzing the change in humidification performance with air mass flow rate with different packing materials, the inlet spray water mass flow rate was set to 0.4 kg/s, and the inlet temperatures of air and spray water were set to 30 °C and 70 °C. Figure 13 shows the effect of the air mass flow rate on the humidification rate with different packing materials. As can be seen from Figure 13, under the same operating conditions, the mhum for each type of packing material increases with the increase in ma. When the ma is increased from 0.1 kg/s to 0.7 kg/s, the mhum for wooden slats, snowflakes, polyvinyl chloride, saddles, gunny bag cloth, hackettes, cellulose paper, and polypropylene increases from 61.30, 27.35, 6.85, 45.79, 4.40, 77.15, 36.08, and 79.09 kg/h to 75.18, 105.07, 48.90, 143.33, 42.55, 201.90, 253.78, and 201.95 kg/h, with an increase of 22.65%, 284.11%, 613.62%, 213.03%, 866.97%, 161.71%, 603.44%, and 155.35%, respectively. Under the same working conditions with different packing materials, with the increase in ma, the mhum increases, but the increase in mhum decreases. When the ma is 0.1, 0.2, 0.3, 0.4, 0.5, 0.6, and 0.7 kg/s, the mhum for cellulose paper is 36.08, 107.93, 152.66, 190.57, 215.49, 238.12, and 253.78 kg/h, respectively. This is because as the ma increases, the heat and mass transfer coefficients between the air and spray water increase, promoting the heat and mass transfer between the air and spray water, resulting in an increase in the outlet ta and moisture content, leading to an increase in mhum. However, when the ta and air humidity at the surface of the packing material increase with the ma, it results in a decrease in the temperature difference between the air and spray water and a decrease in the saturation vapor pressure difference between the air and the saturated water vapor boundary layer near the surface of the packing material. This situation is unfavorable for the heat and mass transfer process between the air and spray water at the surface of the packing material. Moreover, as the ma increases, this adverse effect also intensifies. Therefore, the outlet ta and mhum increase with increasing ma, but the rate of increase gradually decreases.
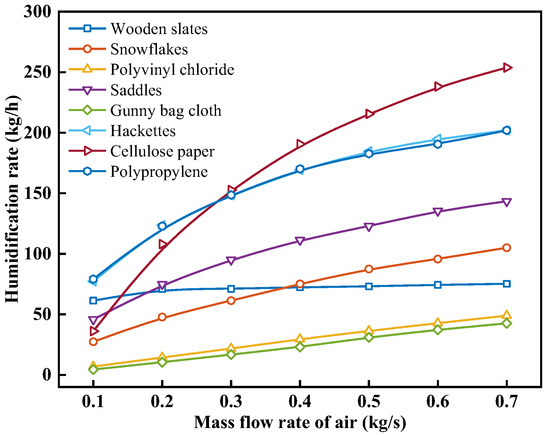
Figure 13.
Effect of air mass flow rate on humidification rate with different packing materials.
Figure 14 shows the effect of the air mass flow rate on the humidification efficiency with different packing materials. As can be seen from Figure 14, the εhum for each type of packing material increases with the increase in ma. When the ma is increased from 0.1 kg/s to 0.7 kg/s, the εhum of wooden slats, snowflakes, polyvinyl chloride, saddles, gunny bag cloth, hackettes, cellulose paper, and polypropylene increases from 19.15%, 8.63%, 2.10%, 14.18%, 1.37%, 24.45%, 11.00, and 24.91% to 24.20%, 34.68%, 15.27%, 48.38%, 13.18%, 70.51%, 83.25, and 70.94%, with an increase of 26.36%, 301.99%, 627.76%, 241.17%, 865.21%, 188.38%, 656.67%, and 184.85%, respectively. Under the same operating conditions with different packing materials, with the increase in ma, the εhum increases, but the increase in εhum decreases. When the ma is 0.1, 0.2, 0.3, 0.4, 0.5, 0.6, and 0.7 kg/s, the εhum for cellulose paper is 11.00%, 34.29%, 52.06%, 65.78%, 73.70%, 79.25%, and 83.25%, respectively. This is because the εhum is closely related to the enthalpy values of the air at the inlet and outlet of the humidifier. While the inlet air enthalpy remains constant, as analyzed in Figure 13, the increase in outlet air enthalpy gradually decreases. According to Equation (22), the εhum increases with the increase in ma, but the magnitude of this increase diminishes.
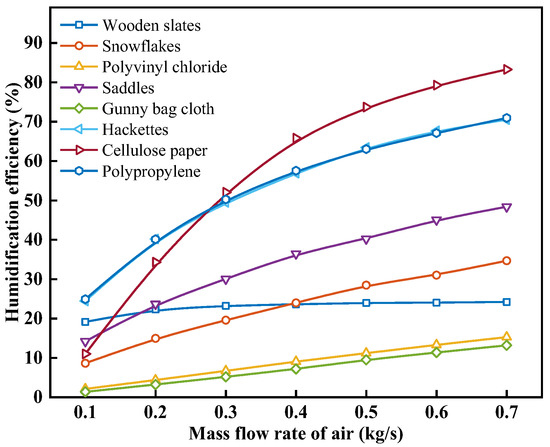
Figure 14.
Effect of air mass flow rate on humidification efficiency with different packing materials.
Figure 15 shows the effect of the air mass flow rate on the specific humidification energy ratio with different packing materials. As can be seen from Figure 15, with the increase in ma, the ηhum increase for each packing material increases, and the magnitude of this increase becomes more significant. When the ma increases from 0.1 kg/s to 0.7 kg/s, the ηhum increase for wooden slats, polyvinyl chloride, saddles, gunny bag cloth, hackettes, cellulose paper, and polypropylene increases from 0.03, 0.70, 0.09, 0.67, 0.05, 0.09, and 0.17 kJ/kg to 6.45, 26.87, 7.43, 18.67, 5.48, 3.30, and 16.77 kJ/kg, with an increase of 231.64, 37.38, 85.86, 26.80, 98.95, 35.34, and 99.15 times, respectively. Among the packing materials, polyvinyl chloride has the highest increase in ηhum as the ma increases, while cellulose paper has the smallest increase. The ηhum of cellulose paper is 0.09, 0.21, 0.48, 0.89, 1.49, 2.29, and 3.30 kJ/kg at the ma of 0.1, 0.2, 0.3, 0.4, 0.5, 0.6, and 0.7 kg/s, respectively. This is because the ηhum is determined by both the mhum and the energy required to overcome the resistance through the humidifier. mhum increases at a decreasing rate as the ma increases, while the energy required to overcome the resistance through the humidifier is approximately cubic to the ma as shown in Equation (24). Therefore, as the ma increases, the ηhum gradually increases, and the trend of increase is more obvious.
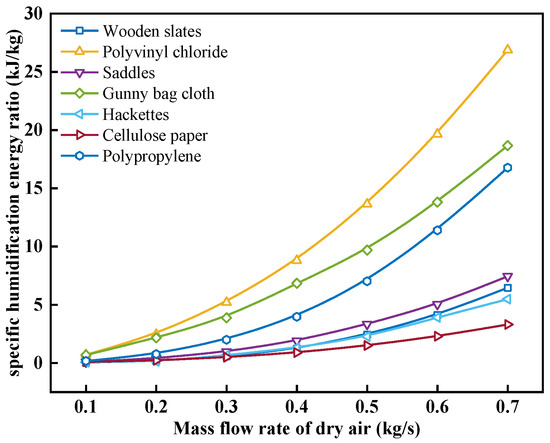
Figure 15.
Effect of air mass flow rate on specific humidification energy ratio with different packing materials.
In general, the gain effect of increasing ma on mhum and εhum gradually decreases, while the ηhum increases more and more with increasing ma.
4. Conclusions
In this study, a heat–mass coupled differential equation model for the humidifier of a humidification–dehumidification seawater desalination system was established. After the accuracy of the model was verified, a theoretical analysis was conducted to study the impact of parameters such as the spray water temperature (tw), mass flow rate of spray water (mw), inlet air temperature (ta), and air mass flow rate (ma) on the humidification performances, including humidification rate (mhum), humidification efficiency (εhum), and specific humidification energy ratio (ηhum), for humidifiers using wooden slats, snowflakes, polyvinyl chloride, saddles, gunny bag cloth, hackettes, cellulose paper, and polypropylene as packing materials. The main conclusions are as follows:
- (1)
- Under the same inlet spray water and air conditions, the humidification performances of different packing materials, from highest to lowest, are as follows: cellulose paper, polypropylene, hackettes, saddles, snowflakes, wooden slats, polyvinyl chloride, and gunny bag cloth.
- (2)
- Increasing the tw significantly enhances the mhum and εhum while reducing the ηhum. When the tw exceeds 80 °C, regardless of the choice of packing material, the ηhum of the humidifier reaches a minimum value, which is approximately similar for different materials. To achieve higher humidification performance, it is recommended to raise the tw to above 80 °C.
- (3)
- With an increase in the mw, although the εhum slightly decreases, the mhum increases, and, in turn, the ηhum decreases. Therefore, to maintain a high mhum and a low ηhum, it is recommended to control the mw at no less than 0.5 kg/s.
- (4)
- Raising the inlet ta of the humidifier can increase the mhum and εhum and decrease the ηhum. However, compared to increasing the tw, its effect on improving the humidification performance is not as significant. Furthermore, as the ta increases, the rate of increase in mhum and εhum gradually decreases, while the rate of increase in ηhum gradually rises.
- (5)
- As the ma increases, the mhum, εhum, and ηhum increase. It is worth noting that with the increase in ma, the rate of increase in mhum and efficiency gradually decreases, while the rate of increase in ηhum gradually increases.
Author Contributions
Conceptualization, Q.Z. and W.W.; methodology, Q.Z. and Y.R.; software, Q.Z. and Y.H.; validation, F.W. and Q.Z.; formal analysis, Q.Z.; investigation, Q.Z. and Y.H.; resources, W.W.; data curation, Q.Z.; writing—original draft preparation, Q.Z.; writing—review and editing, Q.Z., W.W., and Y.R.; visualization, Q.Z.; supervision, W.W.; project administration, W.W.; funding acquisition, W.W. All authors have read and agreed to the published version of the manuscript.
Funding
This research was funded by the National Natural Science Foundation of China (NSFC) (Grant No. 52176016) and the Shanghai Excellent Academic/Technical Leader Program (Grant No. 21XD1433400).
Data Availability Statement
The data are available from the corresponding author upon reasonable request.
Conflicts of Interest
The authors declare no conflict of interest.
Nomenclature
| Symbols | Abbreviations | ||
| A | area (m2) | GOR | gained output ratio |
| α | heat transfer coefficient (W/(m2·K)) | HDH | humidification–dehumidification |
| β | mass transfer coefficient (kg/(m2·s)) | MED | multi-effect desalination |
| ε | efficiency | MSF | multi-stage flash |
| h | enthalpy | MOFs | metal–organic frameworks |
| Lef | Lewis factor | PPEB | plastic polyhedron empty ball |
| m | mass flow rate (kg/s) | RO | reverse osmosis |
| p | pressure drop (Pa) | Subscripts | |
| Q | total heat exchange (W) | a | air |
| Qlat | latent heat exchange (W) | hum | humidification |
| Qsen | sensible heat exchange (W) | pm | packing material |
| T/t | temperature (K/°C) | s | saturated air |
| V | volume (m3) | w | water |
| ω | humidity ratio of moist air (kg/kgdry air) | wv | water vapor |
| z | height (m) | ||
References
- Dave, T.; Krishnan, S. Performance evaluation and characterization of a direct absorption solar humidifier for humidification-dehumidification desalination. J. Sol. Energy Eng. 2021, 143, 011010. [Google Scholar] [CrossRef]
- Lawal, D.U.; Qasem, N.A.A. Humidification-dehumidification desalination systems driven by thermal-based renewable and low-grade energy sources: A critical review. Renew. Sustain. Energy Rev. 2020, 125, 109817. [Google Scholar] [CrossRef]
- Xu, H.; Jiang, S.; Xie, M.X.; Jia, T.; Dai, Y.J. Technical improvements and perspectives on humidification-dehumidification desalination—A review. Desalination 2022, 541, 116029. [Google Scholar] [CrossRef]
- Ge, H.; Cai, Y.; Kang, P.; Liu, J.; Liu, X. Experimental study on humidifier performance in a humidification-dehumidification system. J. Phys. Conf. Ser. 2022, 2186, 12027. [Google Scholar] [CrossRef]
- Lawal, D.; Antar, M.; Khalifa, A.; Zubair, S.; Al-Sulaiman, F. Humidification-dehumidification desalination system operated by a heat pump. Energy Conv. Manag. 2018, 161, 128–140. [Google Scholar] [CrossRef]
- Santosh, R.; Lee, H.; Kim, Y. A comprehensive review on humidifiers and dehumidifiers in solar and low-grade waste heat powered humidification-dehumidification desalination systems. J. Clean Prod. 2022, 347, 131300. [Google Scholar] [CrossRef]
- Hussain Soomro, S.; Santosh, R.; Bak, C.; Yoo, C.; Kim, W.; Kim, Y. Effect of humidifier characteristics on performance of a small-scale humidification-dehumidification desalination system. Appl. Therm. Eng. 2022, 210, 118400. [Google Scholar] [CrossRef]
- Rahimi-Ahar, Z.; Hatamipour, M.S.; Ahar, L.R. Air humidification-dehumidification process for desalination: A review. Prog. Energy Combust. Sci. 2020, 80, 100850. [Google Scholar] [CrossRef]
- Raza, S.; Ghasali, E.; Orooji, Y.; Lin, H.; Karaman, C.; Dragoi, E.N.; Erk, N. Two dimensional (2D) materials and biomaterials for water desalination; structure, properties, and recent advances. Environ. Res. 2023, 219, 114998. [Google Scholar] [CrossRef]
- Mitchell, J.W.; Braun, J.E. Heating, Ventilation, and Air Conditioning in Buildings; Wiley & Sons: Hoboken, NJ, USA, 2013; ISBN 9780470624579. [Google Scholar]
- Salama, R.S.; Mannaa, M.A.; Altass, H.M.; Ibrahim, A.A.; Khder, A.E.S. Palladium supported on mixed-metal–organic framework (Co–Mn-MOF-74) for efficient catalytic oxidation of CO. Rsc. Adv. 2021, 11, 4318–4326. [Google Scholar] [CrossRef]
- Ibrahim, A.A.; Salama, R.S.; El-Hakam, S.A.; Khder, A.S.; Ahmed, A.I. Synthesis of sulfated zirconium supported MCM-41 composite with high-rate adsorption of methylene blue and excellent heterogeneous catalyst. Colloids Surf. A Physicochem. Eng. Asp. 2021, 616, 126361. [Google Scholar] [CrossRef]
- Li, K.; Wu, W.; Hu, K.; Wang, L.; Hua, R. Performance analysis of a novel household water purification system based on humidification-dehumidification principle. Desalination 2019, 469, 114099. [Google Scholar] [CrossRef]
- Xu, H.; Zhao, Y.; Dai, Y.J. Experimental study on a solar assisted heat pump desalination unit with internal heat recovery based on humidification-dehumidification process. Desalination 2019, 452, 247–257. [Google Scholar] [CrossRef]
- Kabeel, A.E.; Abdelgaied, M. Experimental evaluation of a two-stage indirect solar dryer with reheating coupled with HDH desalination system for remote areas. Desalination 2018, 425, 22–29. [Google Scholar] [CrossRef]
- Sharshir, S.W.; Peng, G.; Yang, N.; El-Samadony, M.O.A.; Kabeel, A.E. A continuous desalination system using humidification–dehumidification and a solar still with an evacuated solar water heater. Appl. Therm. Eng. 2016, 104, 734–742. [Google Scholar] [CrossRef]
- Li, X.; Yuan, G.; Wang, Z.; Li, H.; Xu, Z. Experimental study on a humidification and dehumidification desalination system of solar air heater with evacuated tubes. Desalination 2014, 351, 1–8. [Google Scholar] [CrossRef]
- Muthusamy, C.; Srithar, K. Energy and exergy analysis for a humidification–dehumidification desalination system integrated with multiple inserts. Desalination 2015, 367, 49–59. [Google Scholar] [CrossRef]
- Al-Hallaj, S.; Farid, M.M.; Rahman Tamimi, A. Solar desalination with a humidification-dehumidification cycle: Performance of the unit. Desalination 1998, 120, 273–280. [Google Scholar] [CrossRef]
- Moumouh, J.; Tahiri, M.; Salouhi, M.; Balli, L. Theoretical and experimental study of a solar desalination unit based on humidification–dehumidification of air. Int. J. Hydrog. Energy 2016, 41, 20818–20822. [Google Scholar] [CrossRef]
- Raj, A.; Bajaj, R.; Srinivas, T. Performance evaluation of honeycomb structured PVC packed humidifier in a Humidification-Dehumidification Desalination Plant. In Proceedings of the 2016 International Conference on Energy Efficient Technologies for Sustainability (ICEETS), Nagercoil, India, 7–8 April 2016; pp. 68–72. [Google Scholar]
- Ghazouani, N.; Bawadekji, A.; El-Bary, A.A.; Becheikh, N.; Alassaf, Y.; Hassan, G.E.; Elewa, M.M. Greenhouse Desalination by Humidification–Dehumidification Using a Novel Green Packing Material. Water 2022, 14, 869. [Google Scholar] [CrossRef]
- Huang, X.; Chen, H.; Ling, X.; Liu, L.; Huhe, T. Investigation of heat and mass transfer and gas–liquid thermodynamic process paths in a humidifier. Energy 2022, 261, 125156. [Google Scholar] [CrossRef]
- Amer, E.H.; Kotb, H.; Mostafa, G.H.; El-Ghalban, A.R. Theoretical and experimental investigation of humidification–dehumidification desalination unit. Desalination 2009, 249, 949–959. [Google Scholar] [CrossRef]
- Hermosillo, J.; Arancibia-Bulnes, C.A.; Estrada, C.A. Water desalination by air humidification: Mathematical model and experimental study. Sol. Energy 2012, 86, 1070–1076. [Google Scholar] [CrossRef]
- Ke, T.; Huang, X.; Ling, X. Numerical and experimental analysis on air/water direct contact heat and mass transfer in the humidifier. Appl. Therm. Eng. 2019, 156, 310–323. [Google Scholar] [CrossRef]
- Kloppers, J.C.; Kröger, D.G. The Lewis factor and its influence on the performance prediction of wet-cooling towers. Int. J. Therm. Sci. 2005, 44, 879–884. [Google Scholar] [CrossRef]
- Billet, R.; Schultes, M. Prediction of Mass Transfer Columns with Dumped and Arranged Packings: Updated Summary of the Calculation Method of Billet and Schultes. Chem. Eng. Res. Des. 1999, 77, 498–504. [Google Scholar] [CrossRef]
- Zhang, Y.; Zhang, H.; Zheng, W.; You, S.; Wang, Y. Numerical investigation of a humidification-dehumidification desalination system driven by heat pump. Energy Conv. Manag. 2019, 180, 641–653. [Google Scholar] [CrossRef]
Disclaimer/Publisher’s Note: The statements, opinions and data contained in all publications are solely those of the individual author(s) and contributor(s) and not of MDPI and/or the editor(s). MDPI and/or the editor(s) disclaim responsibility for any injury to people or property resulting from any ideas, methods, instructions or products referred to in the content. |
© 2023 by the authors. Licensee MDPI, Basel, Switzerland. This article is an open access article distributed under the terms and conditions of the Creative Commons Attribution (CC BY) license (https://creativecommons.org/licenses/by/4.0/).