Article

Time Reversal vs. Integration of Time Reversal with Convolution Neural Network in Diagnosing Partial Discharge in Power Transformer

by
Permit Mathuhu Sekatane
* and
Pitshou Bokoro
Department of Electrical and Electronic Engineering Technology, University of Johannesburg, Johannesburg 2028, South Africa
*
Author to whom correspondence should be addressed.
Energies 2023, 16(23), 7872; https://doi.org/10.3390/en16237872
Submission received: 21 October 2023 / Revised: 25 November 2023 / Accepted: 27 November 2023 / Published: 1 December 2023

Abstract

:
Partial discharge (PD) is a common issue in power transformers that can lead to catastrophic failures if left undetected. Time reversal (TR) is a well-known technique in signal processing that can reconstruct signals by reversing the direction of time. The paper investigates the use of time reversal and the integration of time reversal with convolution neural networks (CNNs) for diagnosing PD in power transformers. We compare the performance of these techniques on a dataset of PD signals collected from power transformers. We propose a novel method of using time reversal as a pre-processing step to improve the accuracy of CNNs on noisy or distorted signals. Our experimental results demonstrate that this approach can significantly enhance the performance of CNNs on various datasets, including speech, audio, and image datasets. This paper provides a novel approach to signal processing and demonstrates the potential of time reversal as a pre-processing step in CNNs.

1. Introduction

Power transformers play a critical role in the transmission and distribution of electrical power [1]. However, they are prone to various types of failures, including partial discharge (PD) [1]. PD is a localised breakdown of insulation materials that can lead to the failure of the transformer [2]. PD is often difficult to detect and locate, and it can be a major cause of transformer failure [2,3,4,5]. Various diagnostic techniques have been developed to sense and detect PD in power transformers [5,6,7]. These techniques include time and frequency analysis. However, these techniques have limitations, such as sensitivity to noise and interference and limited spatial resolution. Therefore, there is a need for new diagnostic techniques that can overcome these limitations and accurately diagnose PD in power transformers [8,9]. In power transformers, partial discharge (PD) is a significant problem, which can lead to catastrophic failure if not detected on time. To address this issue, researchers have proposed various methods for PD diagnosis, including algorithms for machine learning and signal processing [4,5,6,7,8,9,10,11,12,13,14]. Time reversal is a signal processing technique that has been demonstrated to improve the detection of PD signals [14]. On the other hand, CNNs are a form of deep learning system that can automatically learn features from input data [15]. In recent years, researchers have investigated the integration of time reversal with CNNs for signal processing applications [16,17]. The paper proposes the integration of time reversal with CNNs for diagnosing PD in power transformers. Present experimental results demonstrating that our proposed approach achieves high accuracy in detecting PD signals in power transformers. Our work builds on the previous research on time reversal and CNNs and provides a promising approach for accurate PD diagnosis in power transformers. We investigate the use of time reversal and the integration of time reversal with CNNs for diagnosing PD in power transformers. Later, we compare the performance of these techniques on a dataset of PD signals collected from power transformers.

2. Factors Influencing the Analysis of the Measurements

2.1. Transformer Characteristics

The characteristics of a power transformer can have a significant influence on the analysis of measurements for diagnosing partial discharge [18]. Here are some of the transformer characteristics that can influence the analysis of the measurements: The first one involves the size of the power transformer; it can influence the magnitude of the partial discharge signals [18,19,20]. Larger transformers may produce stronger signals that are easier to detect and analyse. Secondly, the configuration of the transformer, such as its winding arrangement, can also affect the analysis. Different winding configurations may produce different types of signals that require different analysis methods [21]. Thirdly, the insulation materials used in the transformer can also impact the analysis [20,21,22,23]. Different types of insulation materials may produce different partial discharge signals that require a different interpretation. Fourthly, the age of the transformer can also influence the analysis. As transformers age, they may become more prone to partial discharge, and the signals produced may become more complex [22]. Lastly, the operating conditions of the transformer, such as its voltage and load, can also affect the analysis [23]. Different operating conditions may produce different types of signals that require different analysis methods. The aforementioned characteristics can all impact the analysis of measurements for diagnosing partial discharge. Understanding these characteristics and their potential impact on the analysis can help improve the accuracy of the diagnosis.

2.2. Signal Quality Influence

Signal quality refers to the features of the signals recorded during PD testing and can have a significant impact on the analysis of measurements for diagnosing partial discharge in power transformers [24]. Here are some factors related to signal quality that can influence the analysis: The first one involves the presence of noise in the recorded signals, which can reduce the signal-to-noise ratio, making it more difficult to detect and analyse partial discharge signals accurately [25]. Secondly, signal attenuation can occur as signals propagate through the transformer and other components in the measurement system. Attenuated signals can be weaker and more difficult to detect and analyse [26]. Thirdly, signal distortion can occur due to factors such as interference, reflections, and non-linearities in the measurement system. Distorted signals can be difficult to analyse accurately and may require signal processing techniques to improve their quality [24,25,26]. Fourthly, the signal strength of the partial discharge signals can also influence the analysis. Stronger signals are easier to detect and analyse accurately. Lastly, the complexity of the partial discharge signals can also impact the analysis. Complex signals may require advanced analysis techniques, such as machine learning algorithms, to accurately detect and classify the partial discharge events [26]. Signal quality is an important factor that can impact the accuracy of the analysis of measurements for diagnosing partial discharge in power transformers. Understanding the factors that can influence signal quality and taking steps to improve it can help improve the accuracy of the diagnosis.

2.3. Analysis Method and Data Pre-Processing Influence

Data processing and analysis methods are critical factors that can influence the accuracy of the diagnosis of PD in power transformers using TR or the integration of time reversal with convolution neural network [27]. Here are some factors related to data processing and analysis methods that can influence the analysis: The first one involves pre-processing of the data before the analysis, which may improve the signal quality and reduce the noise level [28,29,30,31,32]. Pre-processing techniques such as filtering, denoising, and feature extraction can improve the accuracy of the analysis. Secondly, the selection of the most relevant features from the data can improve the accuracy of the analysis [29]. This involves choosing the features that best represent partial discharge events and discarding the irrelevant ones [30]. Thirdly, the choice of the analysis method can influence the accuracy of the diagnosis. Time reversal and the integration of time reversal with a convolution neural network are two different analysis methods that can be used. The choice of method may depend on the complexity of the signals and the available computing resources [31]. Lastly, the expertise of the analyst or team conducting the analysis can influence the accuracy of the diagnosis. Experience and training in interpreting partial discharge signals can help ensure more accurate and reliable results.

3. Measurement Techniques

3.1. Acoustic Signal Measurements

Acoustic signal measurements can be utilised to diagnose PD. Acoustic sensors are located on the transformer tank to detect the acoustic waves generated by PD activity [32]. These sensors can be placed in different locations on the tank, depending on the type of partial discharge activity being detected. Once the acoustic signal is detected, it is recorded and analysed using various signal processing techniques to extract features that indicate PD activity [32,33,34]. Some common features that are extracted from the acoustic signal include the amplitude, time, frequency, and phase of the signal [33]. The acoustic wave equation is given by:
2 p 1 c 2 2 p t 2 = ρ 2 t 2
where p is the acoustic pressure, ρ is the density of the medium, c is the speed of sound in the medium, and is the acoustic potential. The existence of partial discharge in power transformers can be diagnosed by analysing the acoustic signals produced by the discharge [34]. The amplitude of the acoustic signal can be related to the severity of PD and can be expressed as:
A = K Q L / r
where A is the amplitude of the acoustic signal, K is a constant, Q is the charge produced by the partial discharge, L is the length of the discharge, and r is the distance from the source to the receiver.

3.2. Time Reversal Technique

The Time Reversal (TR) technique can be used on acoustic signals to diagnose Partial Discharges (PD) in power transformers. In this technique, an acoustic sensor is utilised to determine the acoustic emissions generated by PD activity in the transformer [31,32,33,34,35]. To apply the TR technique, the acoustic signal response is recorded on a power transformer by using acoustic sensors [32]. The recorded response is then time-reversed and re-injected into the transformer, causing any PD activity to reoccur in a time-reversed manner. By analysing the re-injected acoustic signal, any PD activity that occurred during the initial recording can be observed as a time-reversed acoustic pulse. The location of the PD activity can be determined by analysing the time delay between the initial pulse and the time-reversed pulse [35]. The time-reversal operator is a mathematical operation that is used to focus acoustic and electromagnetic waves onto a specific location. It can be represented by the symbol T and can be written as:
T(t) = f(−t)
where f(−t) is the time-reversed version of the original signal f(t). The TR technique on acoustic signals has several advantages over the electrical TR technique [27,28,29,30,31,32,33,34,35]. The acoustic TR technique can detect PD activity that occurs in insulating materials other than the transformer windings, such as the insulation between the leads and the core, or the leads and the windings [36]. Additionally, the acoustic TR technique can provide information on the severity and type of PD activity based on the frequency content of the acoustic emissions. This information can be utilised to help detect the root cause of the PD activity and plan appropriate maintenance and repair measures.

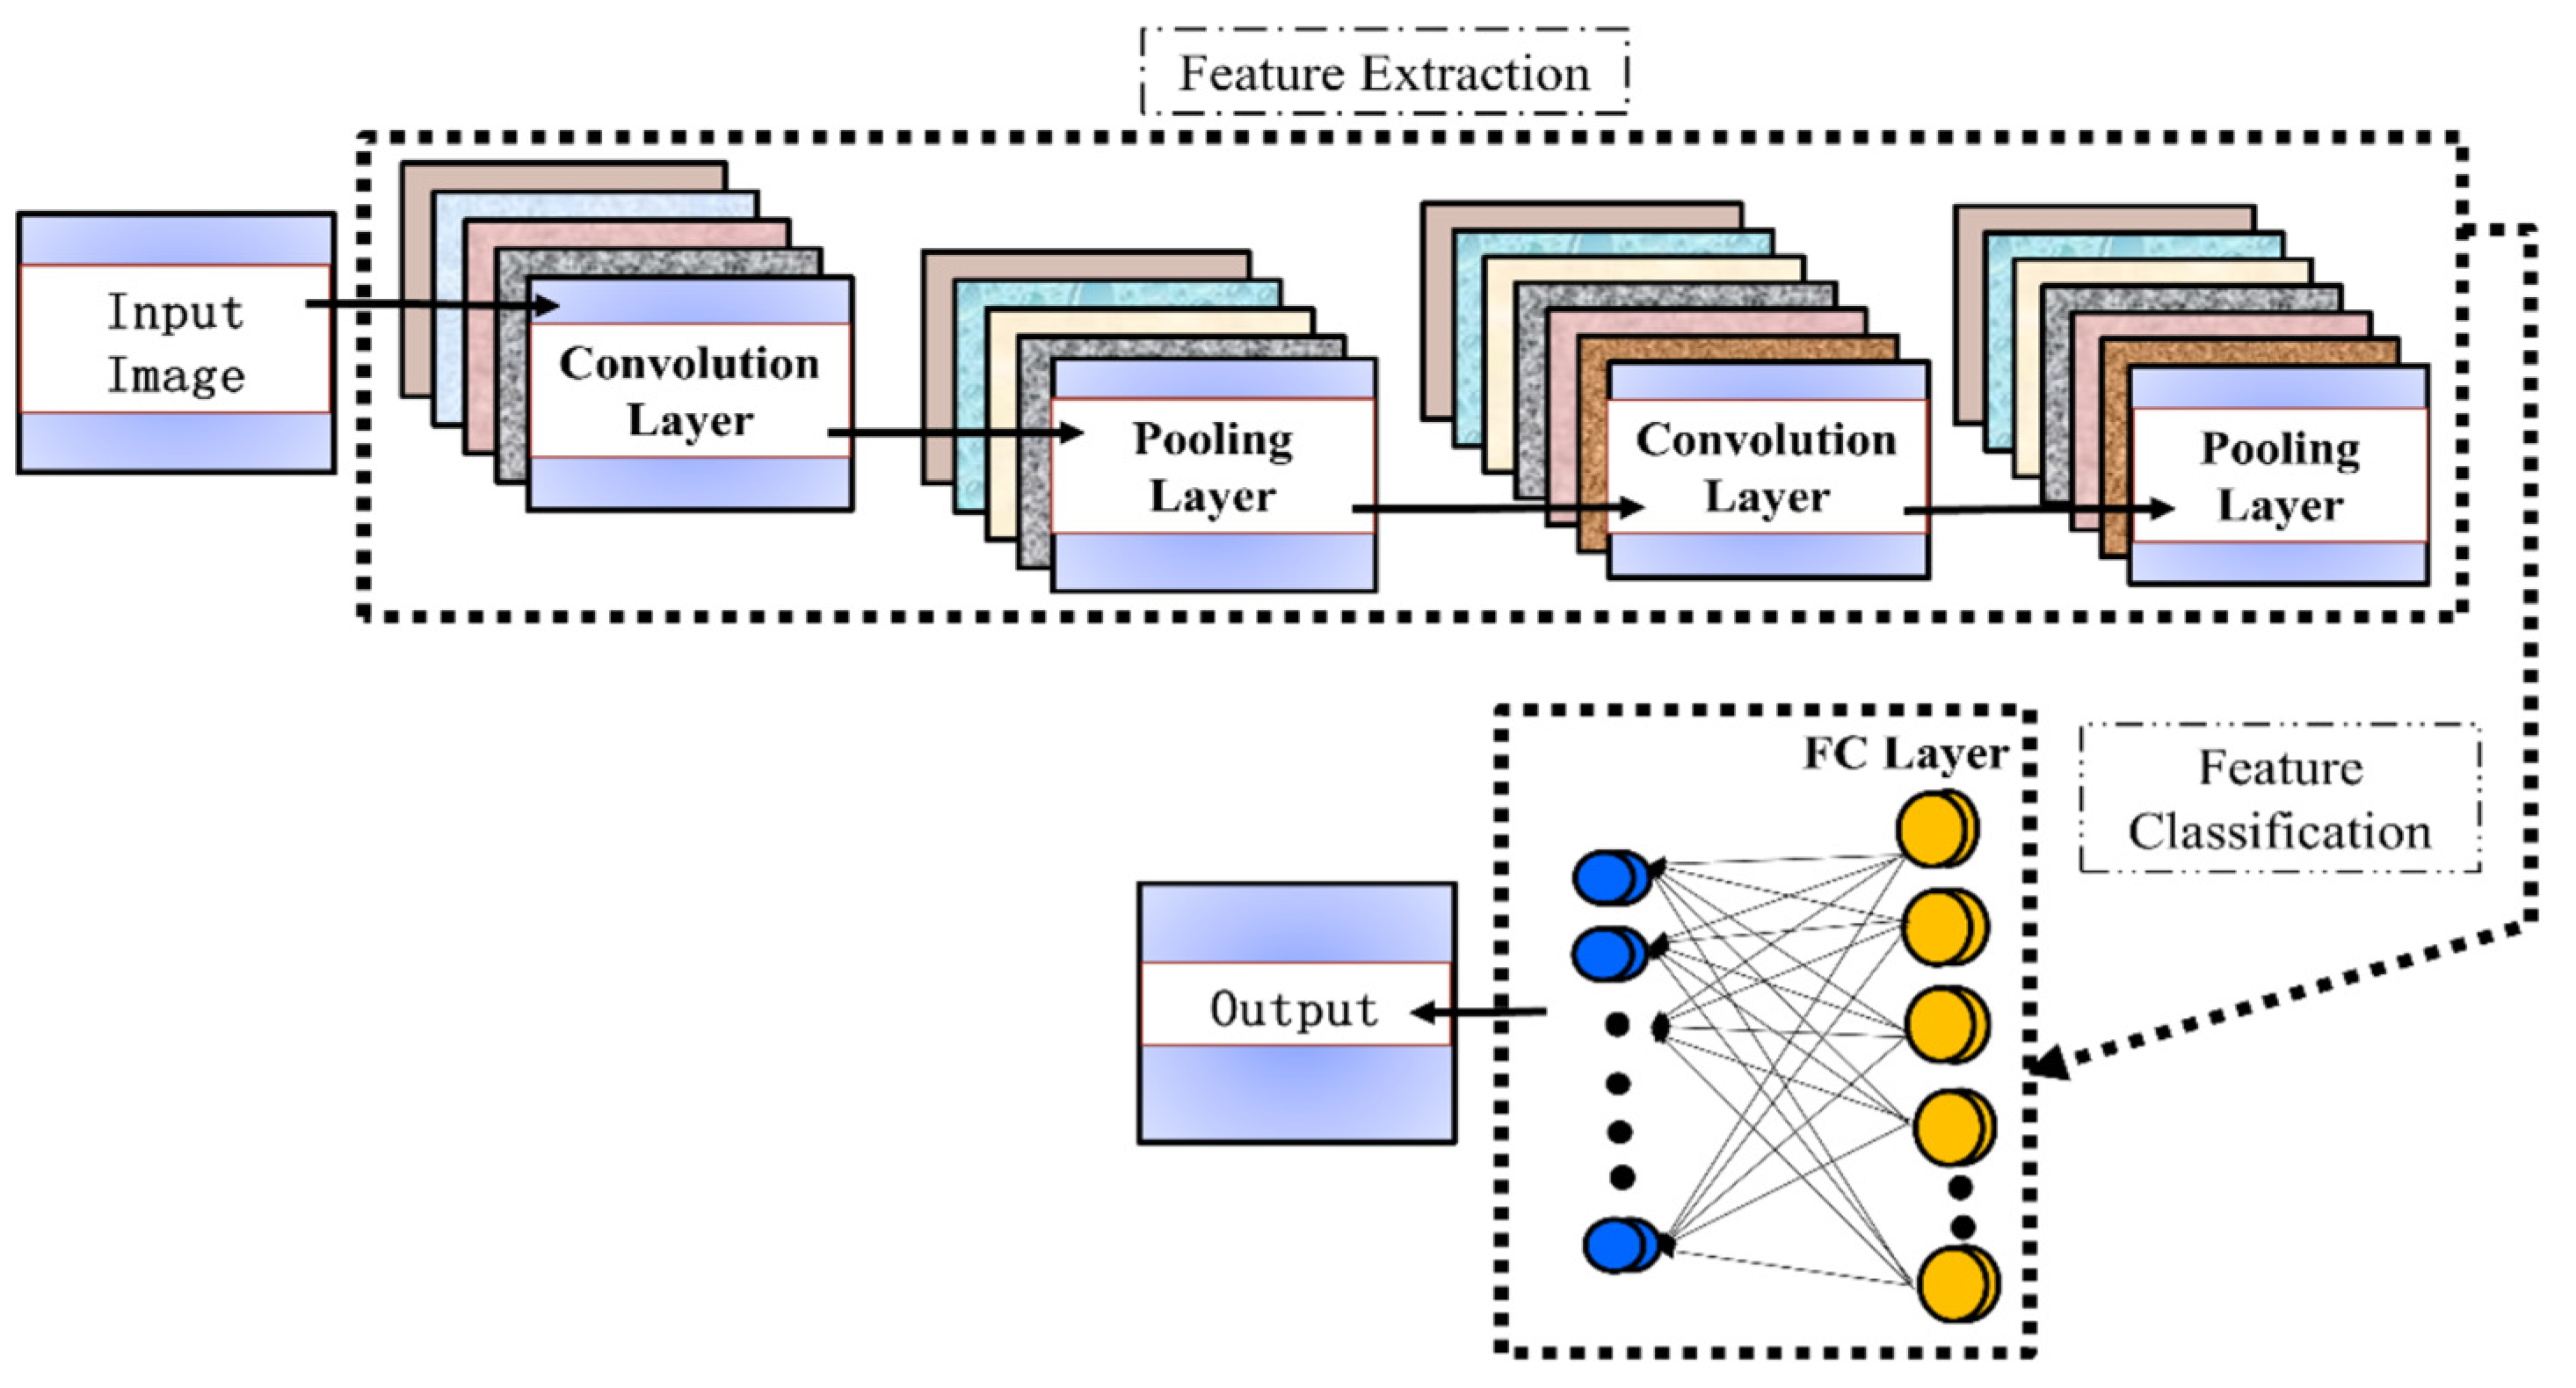
3.3. Convolution Neural Networks (CNNs)

Convolution neural networks (CNNs) are used to enhance the accuracy of PD diagnoses in power transformers by utilising acoustic signals [37]. A CNN is a type of artificial neural network that is intended to process data with a grid-like structure, such as images or acoustic signals [38]. To use a CNN for PD diagnosis in power transformers, the acoustic signal is first pre-processed by applying filters to remove noise and enhance features that are relevant to PD activity [37,38,39]. The pre-processed signal is then fed into the CNN as input, and the network learns to automatically extract features that indicate PD activity. The architecture of a CNN for PD diagnosis in power transformers typically consists of multiple convolutional layers, followed by pooling layers and fully connected layers [40]. The convolutional layers apply filters to the input signals, which are learned during the training process. The pooling layers extract the output of convolutional layers to reduce computational costs and avoid overfitting [39,40]. The fully connected layers map the output of the pooling layers to a probability distribution over a set of possible PD locations. Figure 1 showcase the structure of CNN [41].
The output of the CNN can be further analysed to identify the severity of PD activity in each location. The severity can be quantified using metrics such as the amplitude and frequency content of the acoustic signal in each location. The performance of the CNN can be evaluated using metrics such as the F1 score, recall, precision, and accuracy. Accuracy is normally a straightforward metric that represents the ratio of correctly predicted instances to the total instances, and it is showcased in Equation (4). Equation (5) presents the precision, which is the ratio of correctly predicted positive observations to the total predicted positives. Precision is particularly important when the cost of false positives is high. This is followed by recall, which is the ratio of correctly predicted positive observations to all observations in the actual class. This metric is crucial when the cost of false negatives is high. Lastly, The F1 score is the harmonic mean of precision and recall. It provides a balance between precision and recall. These metrics provide a measure of how well the CNN is able to detect and locate PD activity within the transformer. The calculation of these metrics is performed by using the equations:
A c c u r a c y = N u m b e r   o f   C o r r e c t   P r e d i c t i o n T o t a l   n u m b e r   o f   P r e d i c t i o n
P r e c i s i o n = T r u e   p o s i t i v e s T r u e   p o s i t i v e s + F a l s e   P o s i t i v e s
R e c a l l = T r u e   p o s i t i v e s T r u e   p o s i t i v e s + F a l s e   P o s i t i v e s
F 1   s c o r e = 2 × P r e c i s i o n × R e c a l l P r e c i s i o n + R e c a l l

3.4. Time Reversal and CNN

To enhance the accuracy of TR technique on acoustic signals, the technique can be combined with Convolutional Neural Networks (CNNs). The acoustic response of the transformer can be recorded and used as an input in the CNN, which can automatically learn to extract features that indicate PD activity. The output of CNN can then be used to locate and assess the level of PD activity inside the transformer. The CNN can be trained using a large dataset of acoustic responses that has been labelled together with the severity and location of PD activity. The CNN learns to identify patterns and features in the acoustic signals that are associated with PD activity, making it more accurate and reliable than traditional methods of PD diagnosis. The combined use of these techniques can provide a more comprehensive diagnosis of PD activity in power transformers, allowing for further effective maintenance and repair measures.

3.5. Conventional Machine Learning-Based PD Diagnosis Approaches

The literature on conventional Machine Learning (ML)-based partial discharge (PD) diagnostic approaches power transformers with rich studies aiming to enhance the reliability and efficiency of PD detection and classification. Power transformers are critical components in electrical systems, and the timely identification of PD events is essential in ensuring their safety and reliability while operating. Conventional ML techniques have been widely explored in this context, focusing on the extraction of relevant features from PD signals, signal processing methods, and the application of various classification algorithms. the summary of the evolutional literature of PD detection in power transformer from 2000 to 2023 is outlined below, showcasing the state-of-the-art of conventional techniques based on PD diagnosis approaches.
R. Braunlich et al. [38] investigated the PD diagnosis in power transformers using a spectrum analyser and a phase-resolving PD analyser for offline electrical PD detection and found that it is possible to detect PD faults, and the development of sensitivity is greater than 50 pC. X. Wang et al. [39] conducted a similar research study by placing piezoelectric and fibre optic sensors with an acoustic frequency response of 5 MHz. They found that the localisation of PD signal and detecting PD signals is difficult when there was environmental noise. R. M. Sharkawy et al. [40] created circuits to measure PD using electrical and acoustic signals and concluded that their method can effectively measure PD recognition online. J. Rubio-Serrano et al. [41] performed a study using electro-acoustic detection and found that different PD sources can be recognised using energy ratio and cross-correlation, and statistical analysis to find the source of PD. S. Coenen and S. Tenbohlen [42] performed a similar study using piezoelectric sensors at the outer tank and three UHF probes installed in three oil valves. They found that the technique is efficient for triggering the PD signal with a low-frequency electric or UHF signal and denoising the signal with an acoustic signal. J. Li et al. [43] conducted another study using an antenna with a UHF Hilbert fractal for online PD detection. They noted that the method can be successfully used for recognising PDs and for the online UHF PD monitoring of transformers.
In the same year, R. A. Hooshmand [44] conducted some experiments modifying the binary of partial swarm optimisation (PSO) algorithm combined with an acoustic emission approach. The authors validated their results with the genetic algorithm method and found that the techniques can localise and detect two PD sources with a small margin of error. S. Zheng et al. [45] performed a study using UHF detection and found that the PDs near 500 pC inside the transformer windings could be located and detected. H. H. Sinaga et al. [46] conducted some tests utilising UHF detection and recorded by spectrum analyser and oscilloscope and found the classification and recognition of single and multiple PD phenomena with good accuracy. L. Cui et al. [47] performed similar experiments at constant voltage testing on the model in the laboratory, analysing surface discharge in oilpaper insulation. They found that this clustering method shows the “hold together” characteristic for wavelet moment. T. Boczar et al. [48] conducted some studies using the acoustic emission method and found that implementing the method is effective but expensive for computer-based experts to analyse the transformer’s technical condition. I. Búa-Núñez et al. [49] performed the tests by combining piezoelectric (PZT) and fibre optic sensors with acoustic emissions. It was found that acoustic emission produced by PDs can be found and located with a 1 cm accuracy. M.K. Chen et al. [50] performed a similar study using three radio-frequency coils for PD detection connected to the transformer tank. They found that the technique provided reliable early stage detection for online PD detection.
M. Harbaji et al. [51] conducted the experiments using the acoustic emission method and found the technique effective when principle component analysis (PCA) is used as the feature extractor with KNN as a classifier. H. Mirzaei et al. [52] performed some experimental tests using UHF detection in the valves of tank model and real power transformers by installing several new UHF antennae. The performance improved the accuracy of PD localisation by increasing the distinction between potential PD locations inside the transformer. B. Sarkar et al. [53] conducted similar studies using an optical PD sensor built on Fiber Bragg Gratings (FBG) that measures the acoustic pressure produced during PD. They concluded by confirming that the technique can be used for online monitoring and placed inside the power transformer tank. Z. Qi, [54] investigated a similar analysis of two-dimensional linear discriminants (2DLDA) and found that the PD pattern recognition was no longer affected by the multiple factors of defect size, applied voltage, and insulation aging. J. Seo et al. [55] performed experiments using a high-frequency current transducer (HFCT) mounted on the transformer’s grounding wire—an inductive system. They found that the proposed approach outperforms the typical wavelet transforms with a single threshold. In [56], a study was conducted using a combination of UHF and acoustic PD detection techniques and found that the method has the ability to recognise the unique signals of the individual PD source. R. Rostaminia et al. [57] performed experimental measurements of PD test circuits using SVM and concluded that various types of defects are classified, and that texture features display the highest degree of accuracy. H. Jahangir et al. [58] conducted experimental tests using UHF with probes on six different drain valves on the transformer tank. They concluded that the method consists of extremely high errors, and that PD calibration using UHF probes is not practical. However, it is possible to use the maximum charge estimation method. Y.B. Wang et al. [59] conducted similar studies using a particle-swarm-optimisation-route-searching algorithm for acoustic emissions to locate and predict the propagation time of acoustic waves. The methods produce better detection accuracy compared to other localisation detections. R. Ghosh et al. [60] conducted a study using acoustic emission-based localisation to estimate the time of arrival by the source filter model of acoustic theory and found that the approach results are approximately 1 cm to the accuracy of PD localisation. S. Qian et al. [61] investigated the benefit of using fibre optic sensors for PD acoustic detection, and Signac developed a fibre sensor system. They concluded that the method outperformed the piezoelectric transducer in detecting AE signals originating inside the winding. J. Du et al. [62] conducted studies looking at transformer oil characteristics for a 30–75 °C temperature range using the AE method. They found that changes in parameters like viscosity and BDV, decreased the AE signal’s amplitude from 65 °C to 75 °C at 17 kV.
Y.B. Wang et al. [63] performed an experimental test using a Fabry–Perot optical fibre sensor array combined with a steered response power sound-source localisation algorithm, which was used in the AE method. Their results showed higher accuracy compared to the more common piezoelectric transducer. C. Gao et al. [64] performed a similar study using a combinational approach of a UHF probe’s tip fitted with an AE sensor. They concluded that the integrated sensor exhibits higher sensitivity than with direct acoustic wave detection. W. Si et al. [65] conducted studies using optical fibre sensors for optical detection and found that the method fitted well with a water activity probe that works in various dielectric oils. M. A. Ansari et al. [66] performed studies using surface, floating, and void electrodes on a discrimination algorithm and found that the multi-step discrimination method can distinguish and separate mixed signals with similar shapes, which were not feasible by the one-step method, or improve the separation capability in subclasses, which was a better selection than three or more PD sources. M. Azadifar et al. [67] performed some tests using the time difference of arrival (TDoA). It has been found that the TDoA technique, which employs three sensors, cannot deliver precise results when the line of sight is obstructed by the presence of transformer windings.
H. Karami et al. [68] performed a similar study using time reversal and concluded that this technique has never been performed before to locate PD sources in transformers using electromagnetic TR. More in-depth theoretical and experimental studies are required to evaluate the method’s effectiveness on a real transformer and in the presence of noise. H. Karami et al. [69] performed experimental work using PD sources emitting both acoustic and electromagnetic (EM) waves. It was concluded that the windings’ core and layers have not been modelled in this instance. According to our analysis, the proposed acoustic TR technique can successfully locate a PD source that has been placed in various difficult locations (within a winding and between two windings). Additional work is being performed to make the suggested method 3D-capable and to conduct experimental validations to evaluate the method’s effectiveness when applied to a real power transformer. T. D. Do et al. [70] conducted a study classifying the power transformer fault with CNN and reported that the methods can be used for PD classification both in quiet and noisy environments, and the researcher must consider using real-world data to validate the simulated results to actual transformer PD signals. H. Karami et al. [71] conducted similar studies using time reversal and the 2D FDTD (Finite Difference Time Domain) and found that the 3-D cavity is a problem, and that the actual location is confined between the cavity walls. Lastly, it was reported that the technique is not performed on actual power transformers. H. Karami et al. [72] conducted a similar study using time reversal and 2D finite-difference time-domain (FDTD) to 3D MATLAB toolbox (k-Wave) and found that the external acoustic environmental noise, such as the transformer’s own vibrations, could contaminate the acoustic signal. It was not performed on transformers, and no real-time data were used on the modelling, hence their test was accurate at all levels.

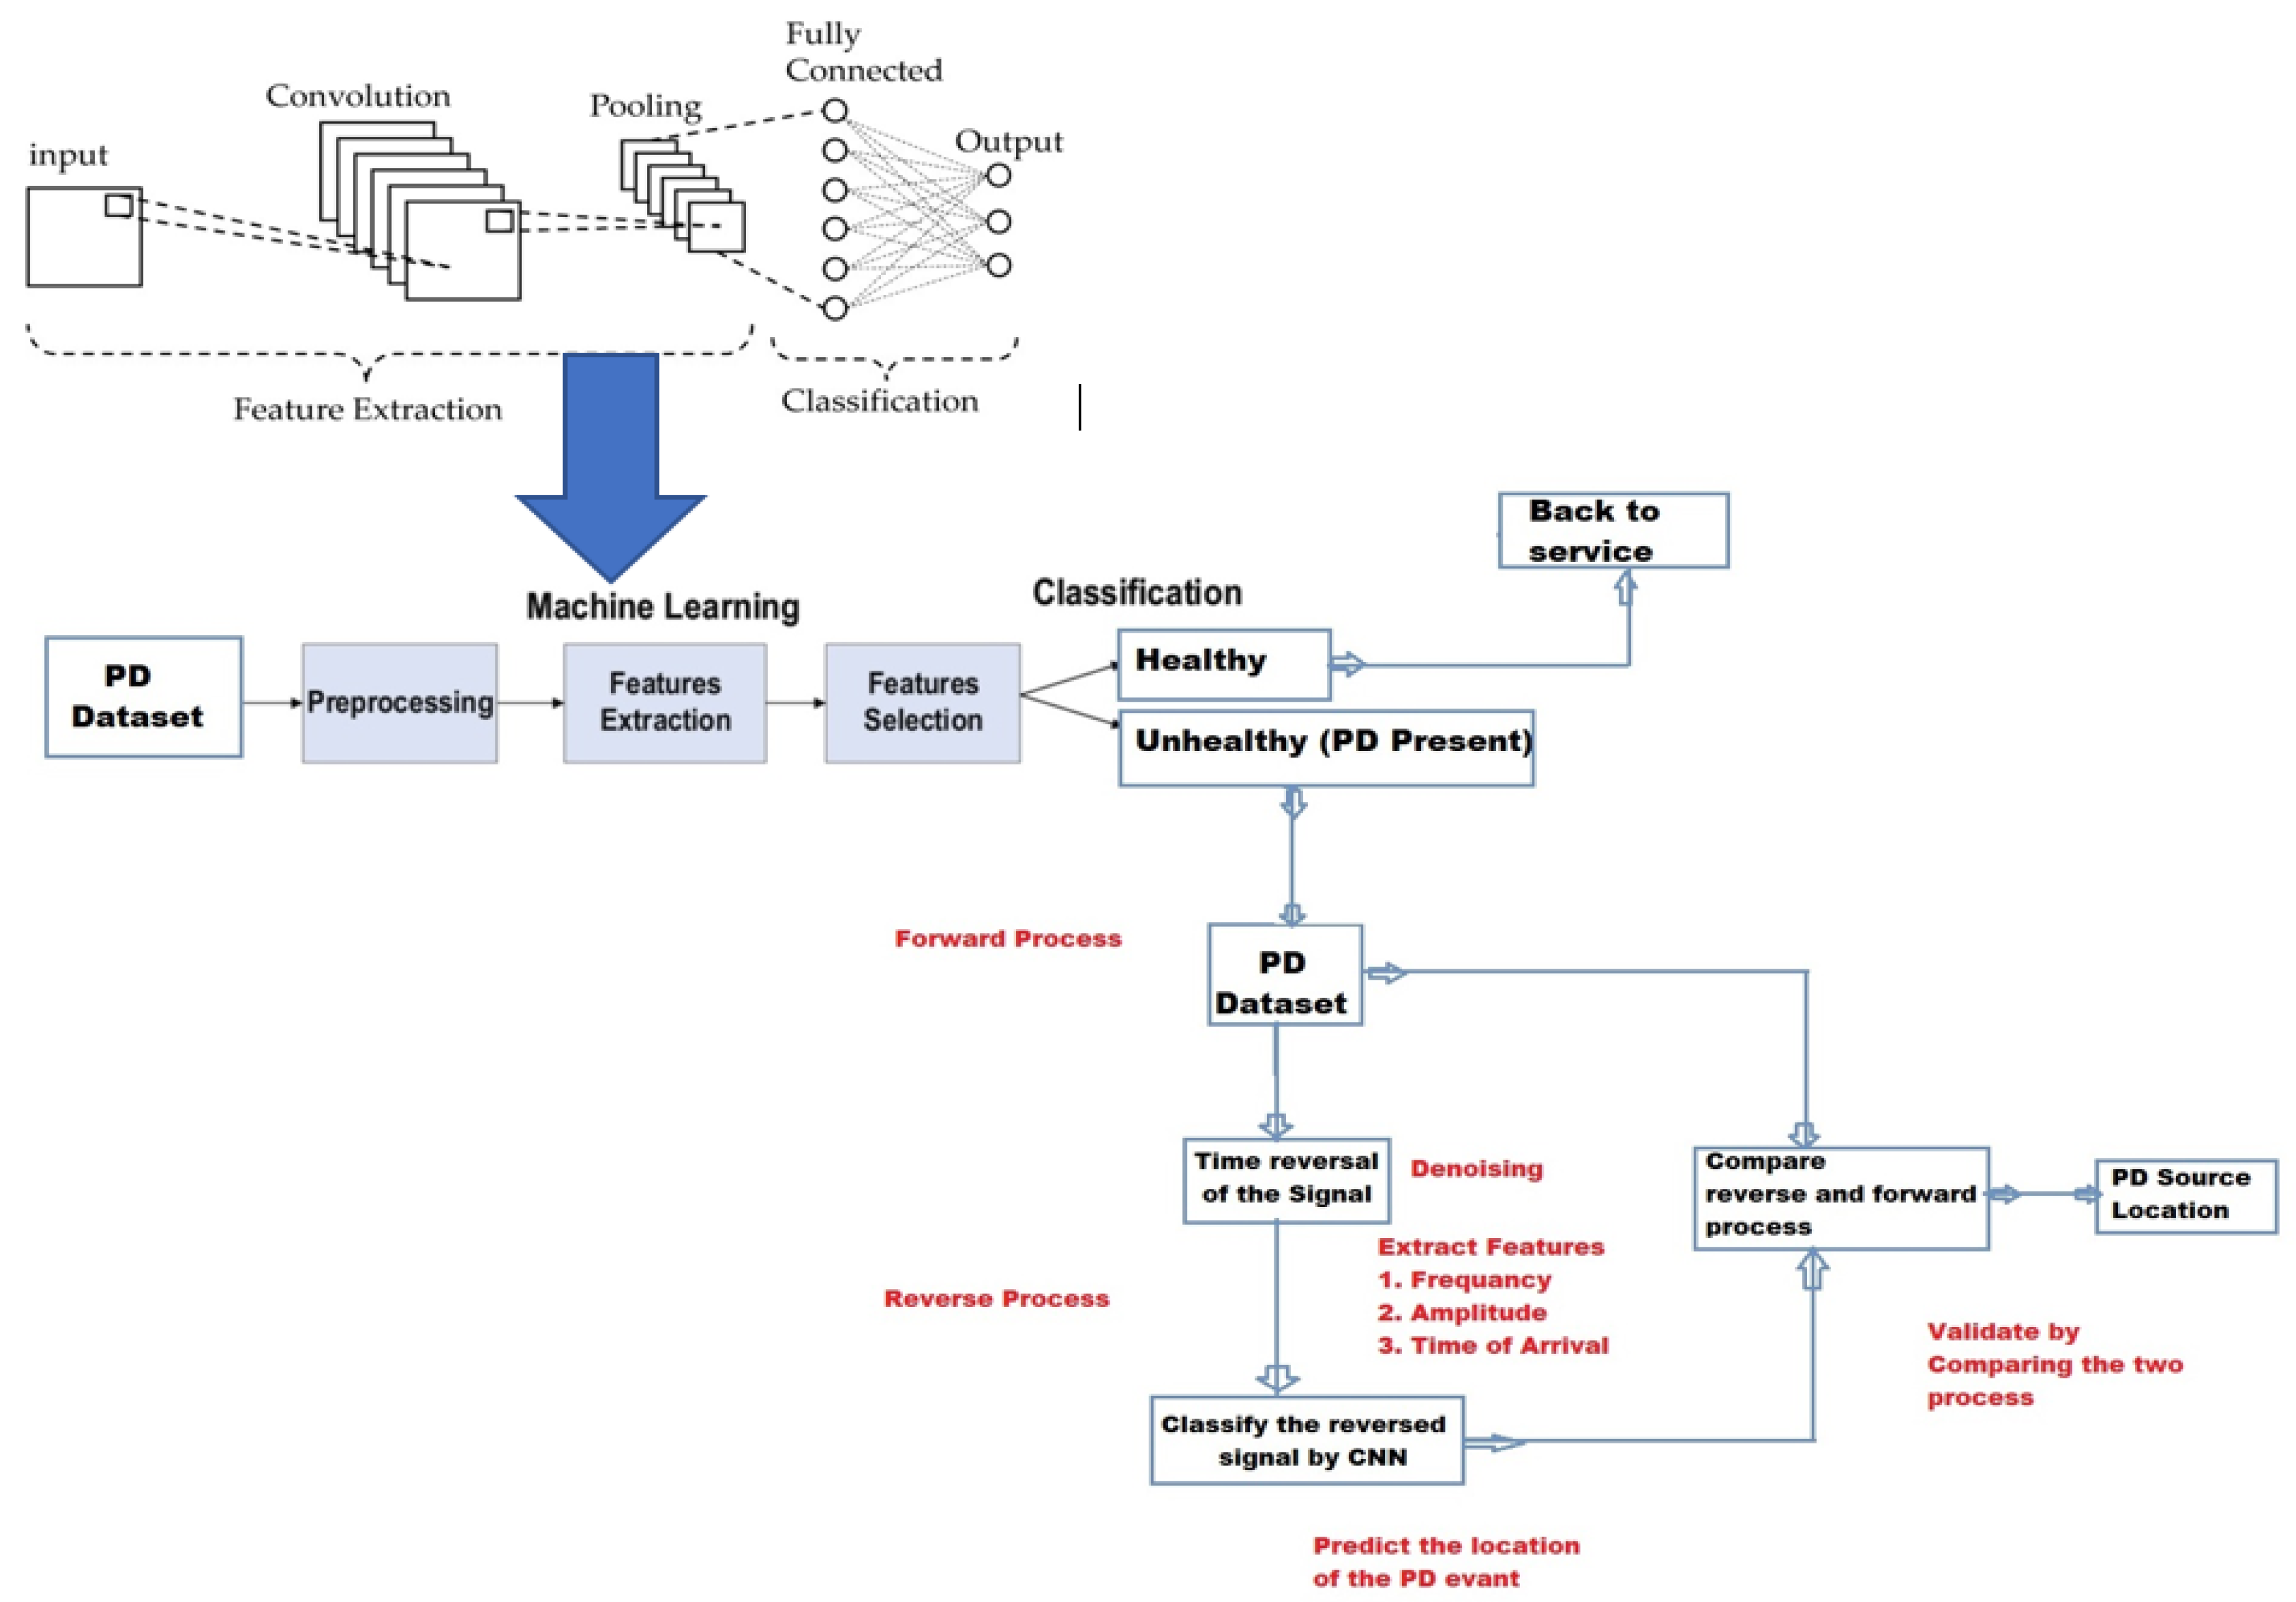
4. The Proposed Methodology

Data are collected and prepared by acquiring electromagnetic data from sensors placed around the power transformer. These data are used to diagnose the transformer by using a TR and TR-CNN. The results are validated by comparing the two techniques from the data collected. This method involves analysing the characteristics of partial discharge signals by using the time reversal technique. Time reversal explores the fact that electromagnetic waves are time-reversible, allowing for the identification of partial discharge events based on signal reflections and properties. Using Maxwell’s equations to model the behaviour of the electromagnetic waves produced by partial discharge, the equations are illustrated below.
· E = ρ ε 0
· B = 0
× E = B t
× B = μ 0 j + ϵ 0 E t
where E is the electric field, B is the magnetic field, ρ is the charge density, J is the current density, ε 0 is the permittivity of free space, and µ 0 is the permeability of free space. The procedure converts the electromagnetic signal to an acoustic signal using the relationship between electromagnetic signals and acoustic pressure. Using the acoustic wave equation presented in (1) to model the behaviour of acoustic waves produced by partial discharge, apply the time-reversal parameter to the acoustic data to focus the waves onto the location of the partial discharge, use the amplitude of the time-reversed signal to estimate the severity of the partial discharge, and repeat the process for multiple sensors to obtain a more accurate location and severity estimate.
To implement the methodology involving the deployment of the algorithms, an emphasis is put on time-reversal characteristics in the partial discharge signals used. This may involve signal processing or analysing waveforms, frequencies, or other features associated with the time-reversed signals. The study further combines the strengths of the time reversal technique with the deep learning capabilities of CNNs. CNNs are powerful in capturing hierarchical features and patterns in data, making them suitable for complex signal analysis. Figure 2 showcases the proposed methodology of the study.
The above figure is used to train a CNN model to learn and recognise patterns in partial discharge signals. It incorporates time-reversed signal characteristics as additional features or pre-processing steps in the CNN architecture. This integration aims to enhance the model’s ability to accurately identify and classify partial discharge events. The performance of both models is evaluated individually as well as the integrated model using appropriate metrics such as accuracy, precision, recall, and the F1 score. A comparison can be made between the effectiveness of the time reversal approach, the CNN model, and the integrated model in diagnosing partial discharge in power transformers. An analysis of the results can be performed to gain insights into how each method contributes to the accurate diagnosis of partial discharge. The strengths and limitations of each approach and the synergies achieved through their integration should be better understood.

5. Results and Discussion

This section discusses the results of this approach and evaluates its effectiveness in practical applications. The results are tested and recorded on power transformers with the same rating made by a well-known and reputable South African company. To resolve the challenging problem, Matlab 2022b software was used to model the PD signal and determining the accuracy of the time reversal technique, as well as integrating time reversal and convolution neural networks (CNNs). Figure 3 showcases the three-dimensional logging of the data from the power transformer. S1 to S4 represent the sensor’s locations on the unit.
The integration of time reversal with convolutional neural networks (CNNs) has shown promising results in detecting PD in power transformers. PD is a common phenomenon in electrical equipment, and its early detection is crucial to prevent disastrous failure and ensure the reliable operation of the equipment. Time reversal is a signal processing method that can enhance the weak and scattered signals generated by PD, while CNNs are powerful machine learning tools that can extract complex features from the signals. This integration of time reversal and CNNs has the potential to enhance the accuracy and speed of PD diagnosis in power transformers.

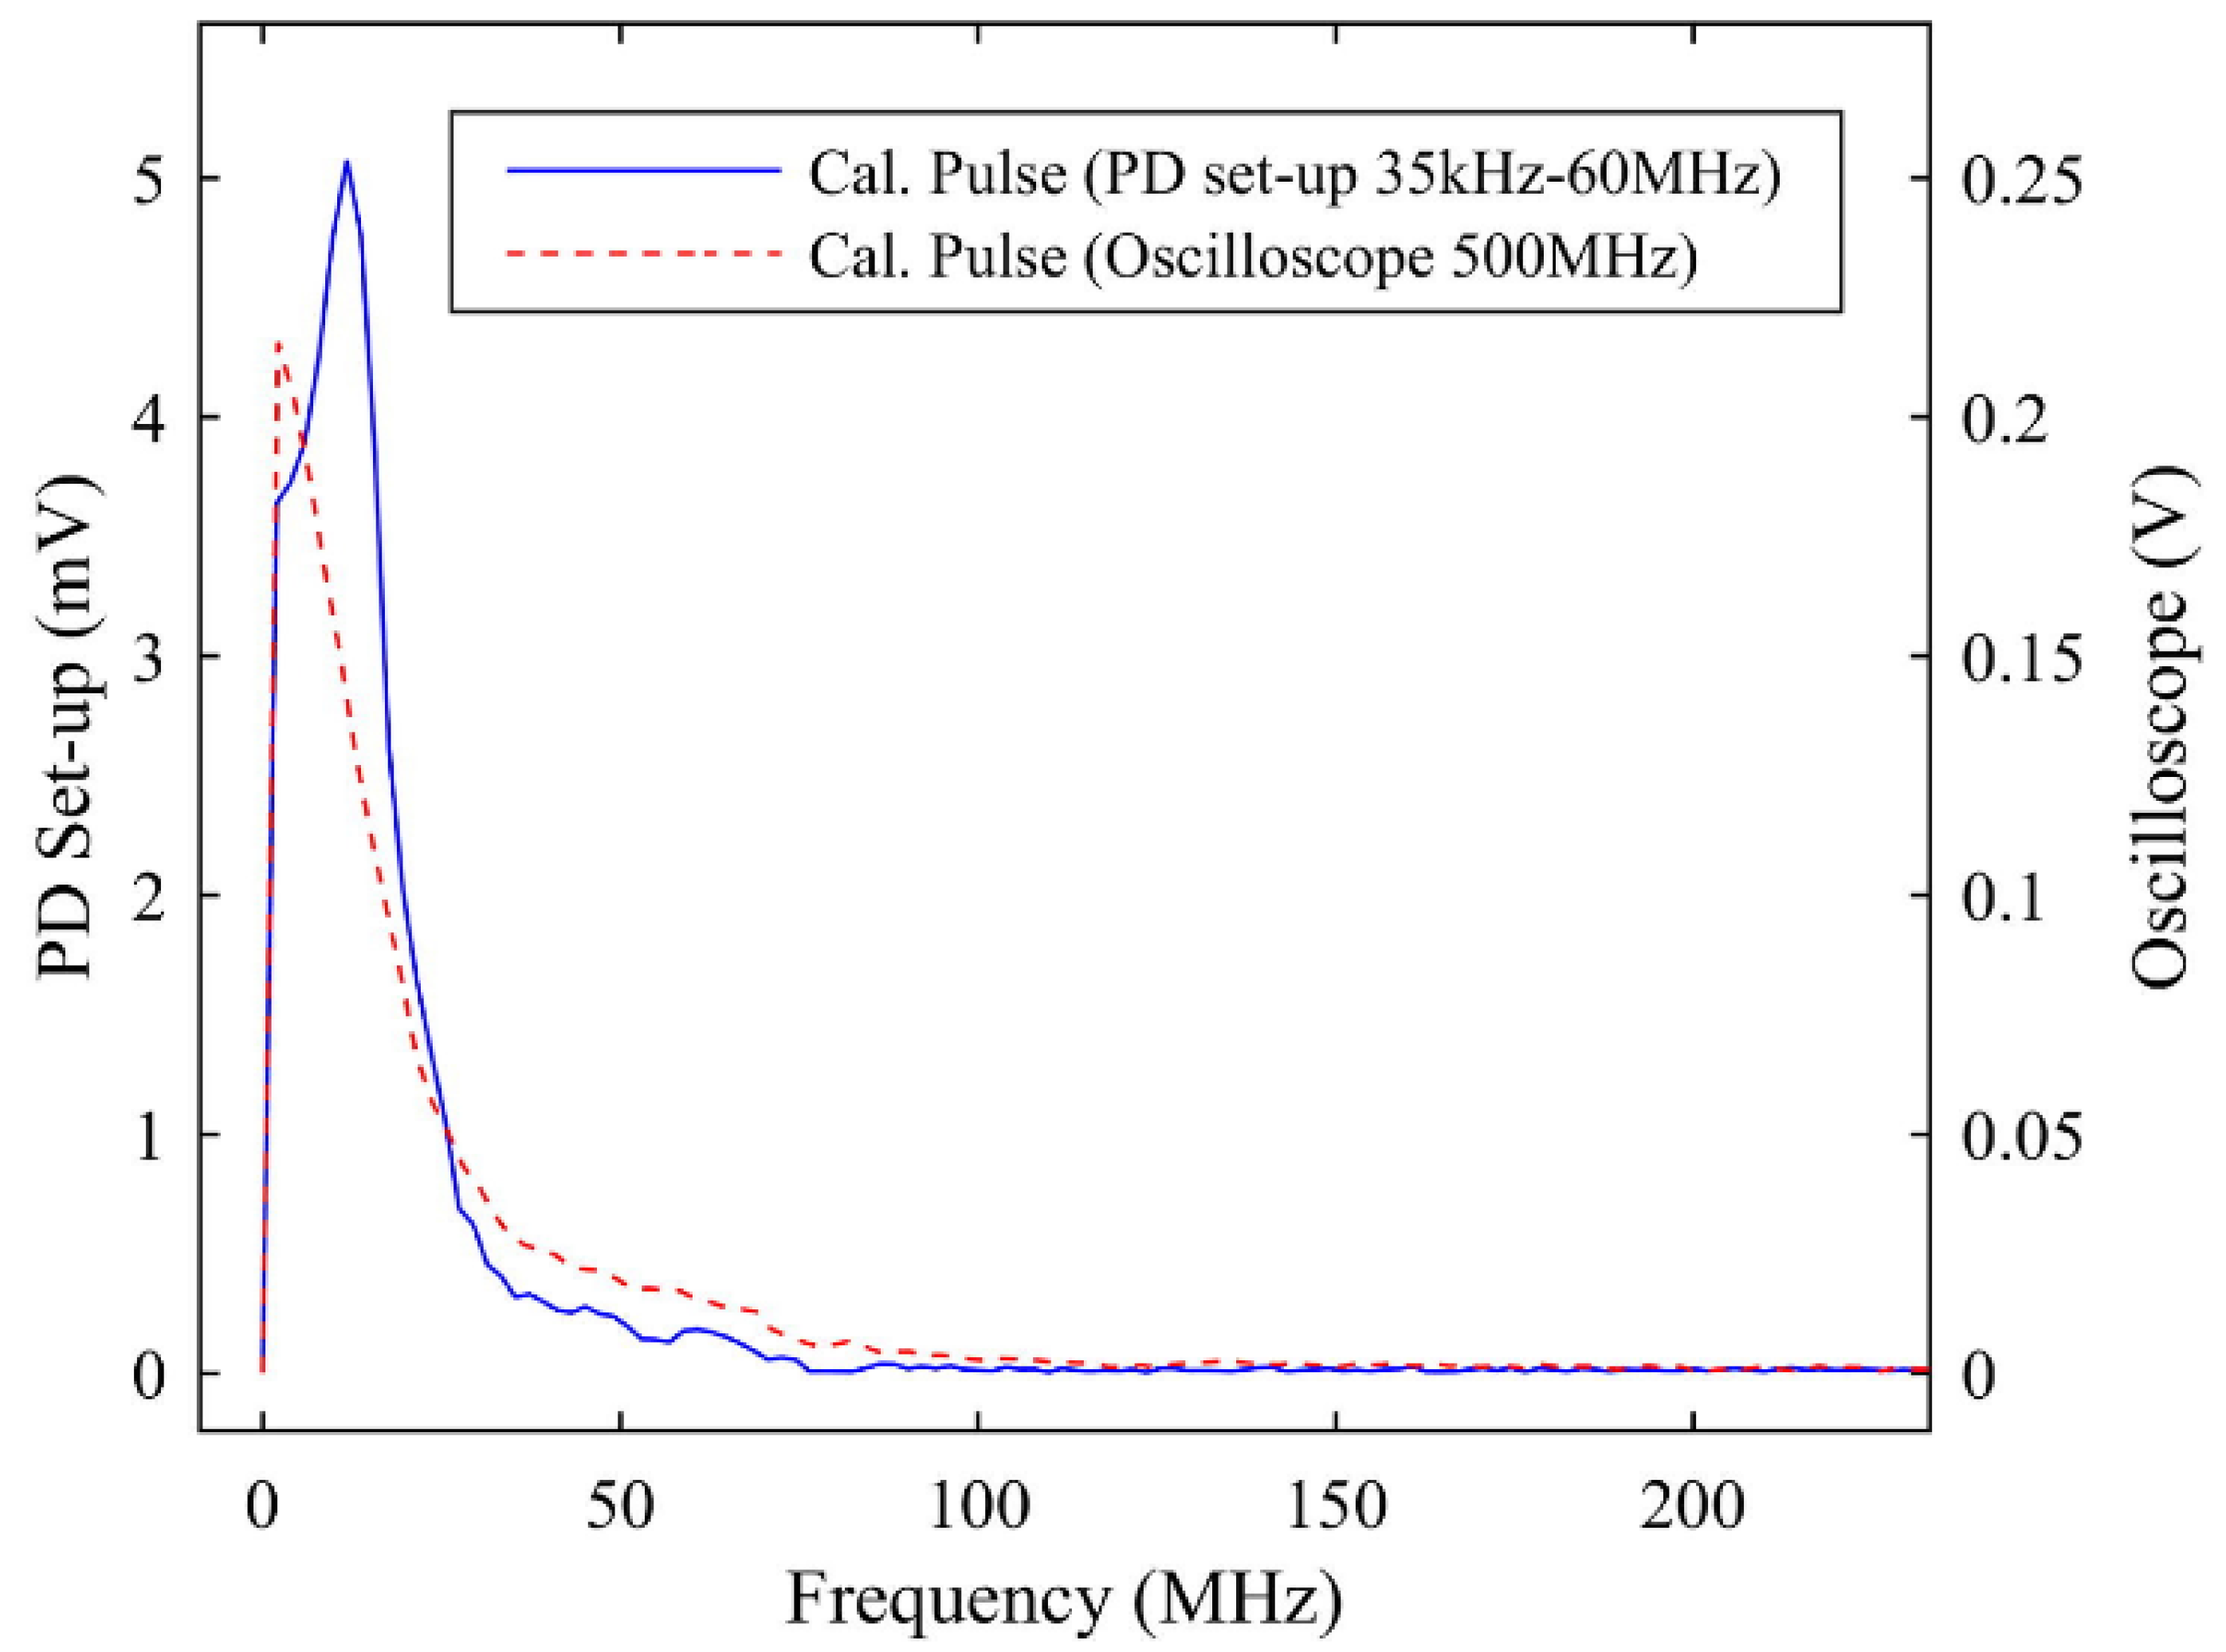
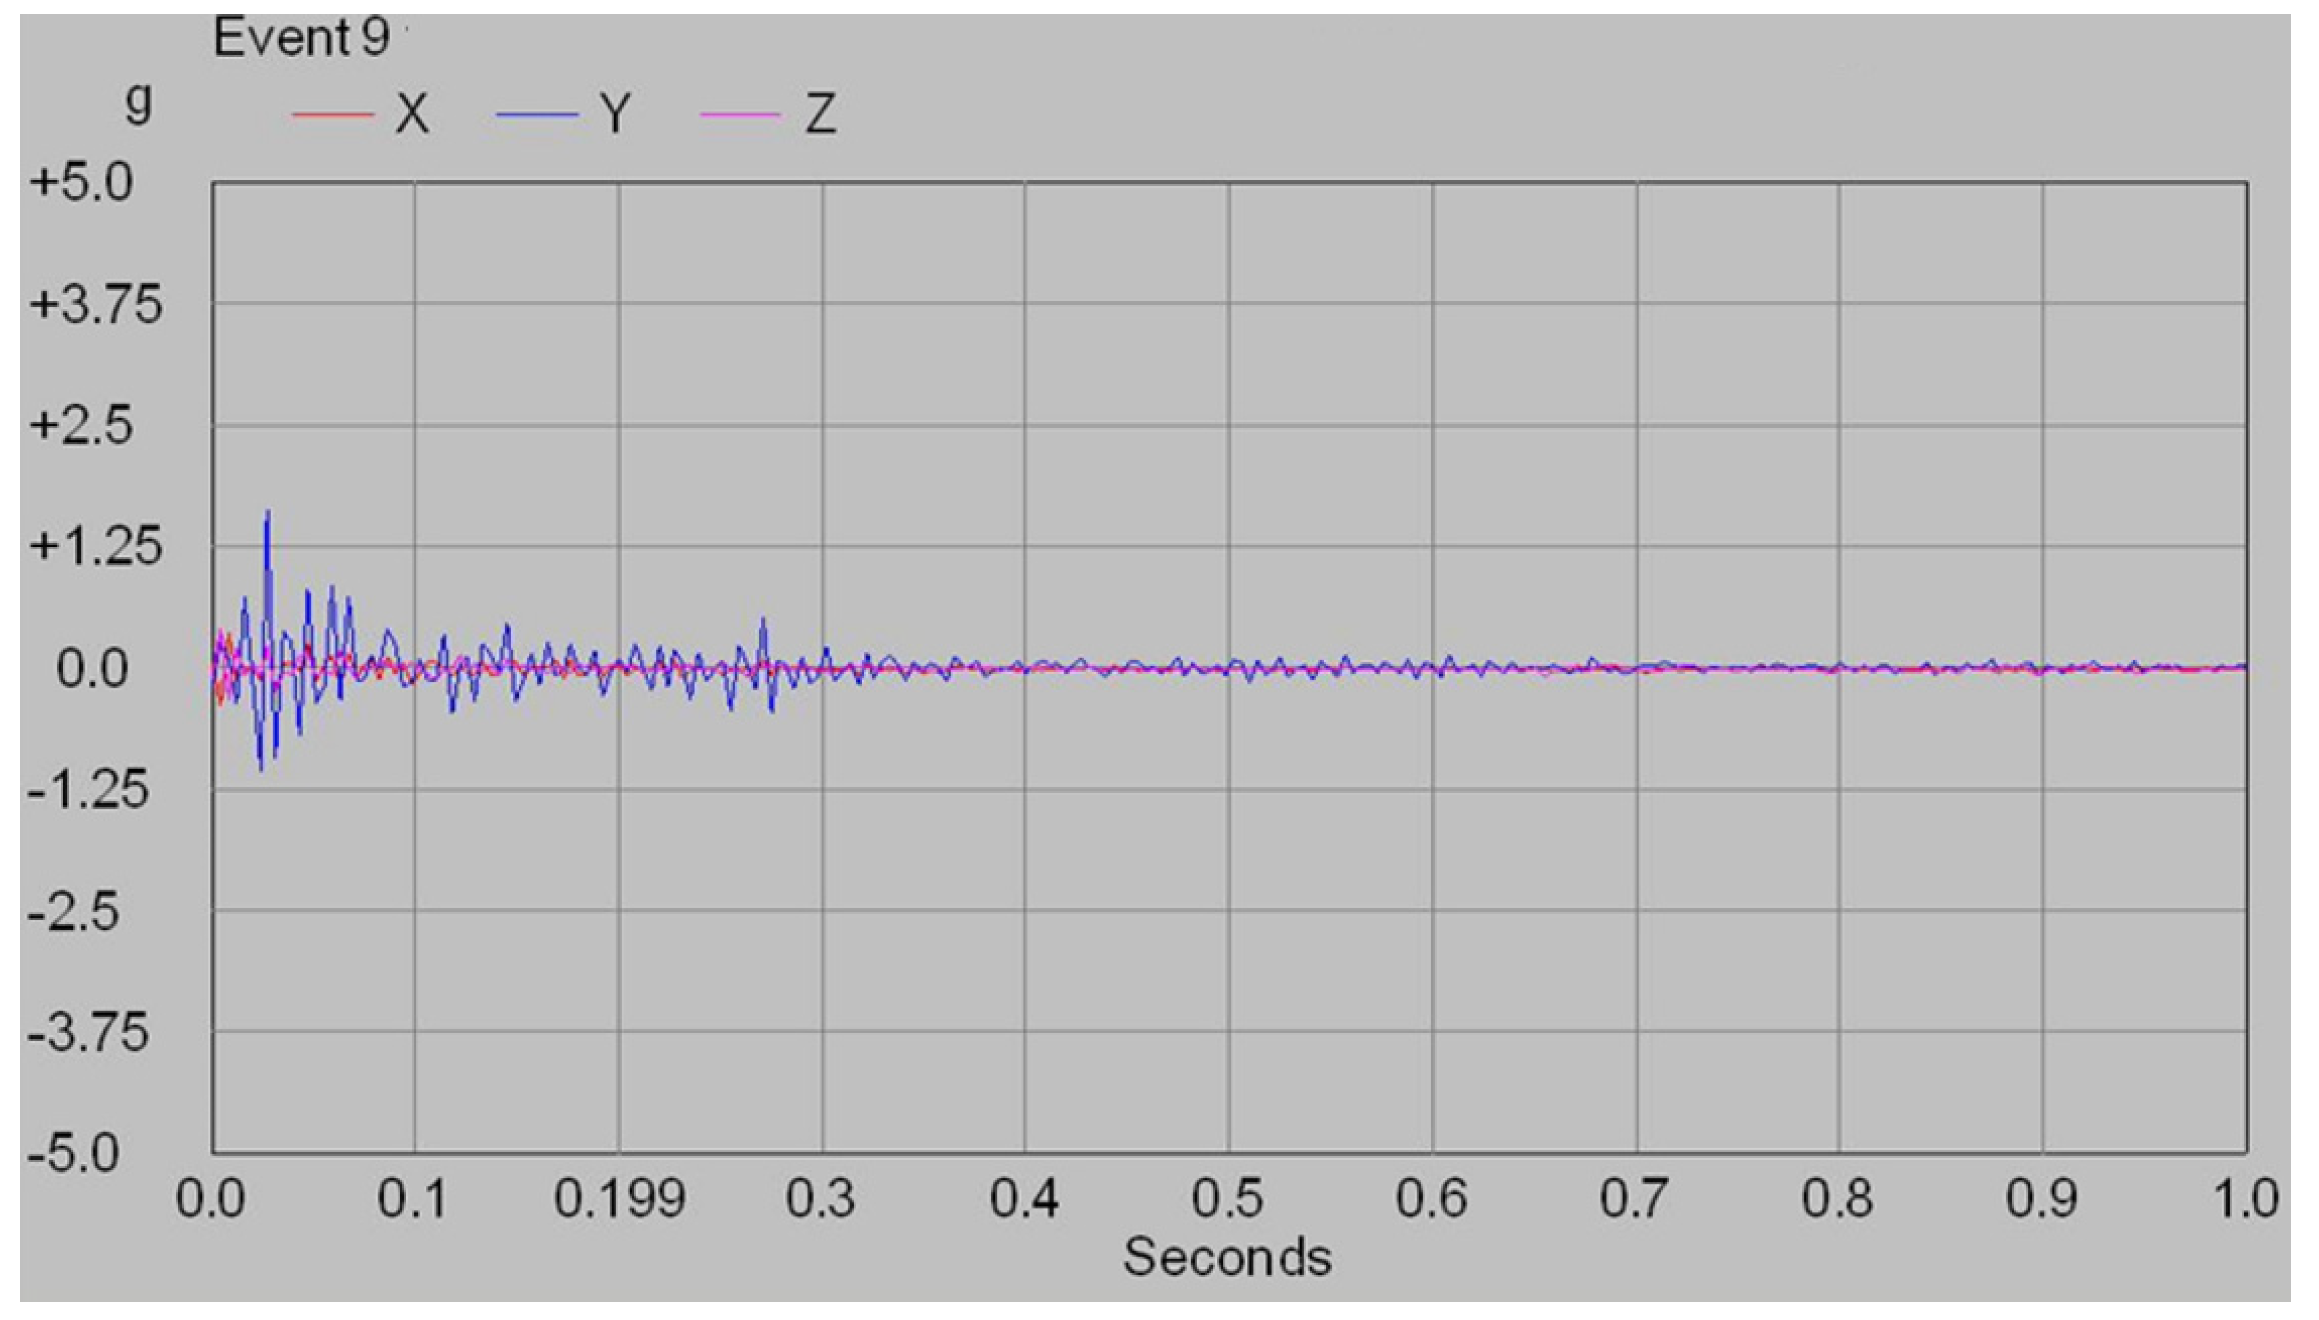
5.1. Case Study 1: Time Reversal

The dataset of PD acoustic signals is collected from 20 MVA, 132/22 power transformers during acceptance test. The dataset contains 5000 PD signals, each of which has a duration of 200 ns and a sampling rate of 1 GHz. The dataset is split into a training set and a test set, with 60% of the data used for training and 40% used for testing. The calibration pulses are displayed in Figure 4 and Figure 5 [42]. Table 1 showcase the raw data of acoustic signal amplitudes at various sensors for each location tested in the transformer.
Time reversal is applied to the acoustic signals, and a threshold-based method is used to detect PD events. The Figure 6 and Figure 7 below showcase a typical acoustic signal recorded on a power transformer during testing.
The threshold was set to three times the noise level in the signal’s standard deviation. The performance of time reversal is evaluated using metrics for accuracy, precision, recall, and F1 score on the test set during pre-processing. Table 2 below illustrates the performance of time reversal on test set.
The experimental results demonstrate that time reversal is effective in detecting PD signals in power transformers. The metrics for precision, recall, accuracy, and F1-score are all above 70%, indicating that time reversal can reliably detect PD events in power transformers.

5.2. Case Study 2: Integration of Time Reversal with CNN

The Same dataset and producer as Case Study 1 was used to test the performance of the integration of time reversal with CNN. In this case, the studied time-reversed signals are fed into a CNN. Figure 1 demonstrates the architectural flow of the CNN network that is proposed in this study to classify PD in the power transformer. The parameters are developed following the structural design, and Table 3 illustrates the detailed parameters of the test CNN applied to classify the PD signals. The layers are indicated individual blocks for the network structure with input and output measurements. The first section illustrates the Conv2D convolutional feature maps (feature maps, including the MaxPooling and DropOut stages), while the second section shows the fully connected complex network after the flattening process. In the pre-processing phase, PD signal were resized to a setup of 256 × 1256 × 1 and separately labelled. The feature cover kernel that was set to 3 × 3 pixels (also to a dimension of 2 × 2 for other test), and up to ten convolutional layers were implemented. The number of convolution kernels was changed to between 16 and 512. The complex fully connected layers were outlined by 512 neurons and the activation function rectified linear unit (ReLu), followed by an output layer with the Softmax activation function and the number of neurons corresponding to the number of classes to be recognised. The model was trained with 200 to 680 batch sizes at a learning rate of 0.001 to improve the performance of the model, as shown in Table 4, and the data were split into 40% training and 60% validation sets. A dropout process of 0.2 to 0.5 after the convolution and future map layers was tested. The performance was evaluated by the accuracy and loss metric parameters. A training accuracy of 90% and a validation accuracy of 93% were reached. The accuracy adjustment after 200 epochs is shown in Figure 8, where the saturation effect is visible. Figure 8 below present the training process of the model, where (a) show the accuracy and (b) show the loss values of the training and validation datasets were very stable, and the model started to converge.
The experimental results demonstrate that the integration of time reversal with CNNs achieves high accuracy in detecting PD acoustic signals in power transformers. The metrics for recall, accuracy, precision, and F1-score are all above 90%, indicating that the proposed approach can accurately improve the PD detection in power transformers. Table 5 below presents the performance of the integrated model.
A confusion matrix, also known as an error matrix, is a method for summarising a classification algorithm’s performance and is one of the CNN’s assessment criteria. Figure 9 showcases that the prediction results of the CNN model and accuracy of each sample are 100%, 100%, 100%, 100%, 90.0%, 100%, 100%, 90.9%. The total accuracy of the nine states is 90.40%. The method proposed in this paper has high accuracy in classifying the partial discharge in power transformer, Figure 10 shows the prediction results of the intergradation model.

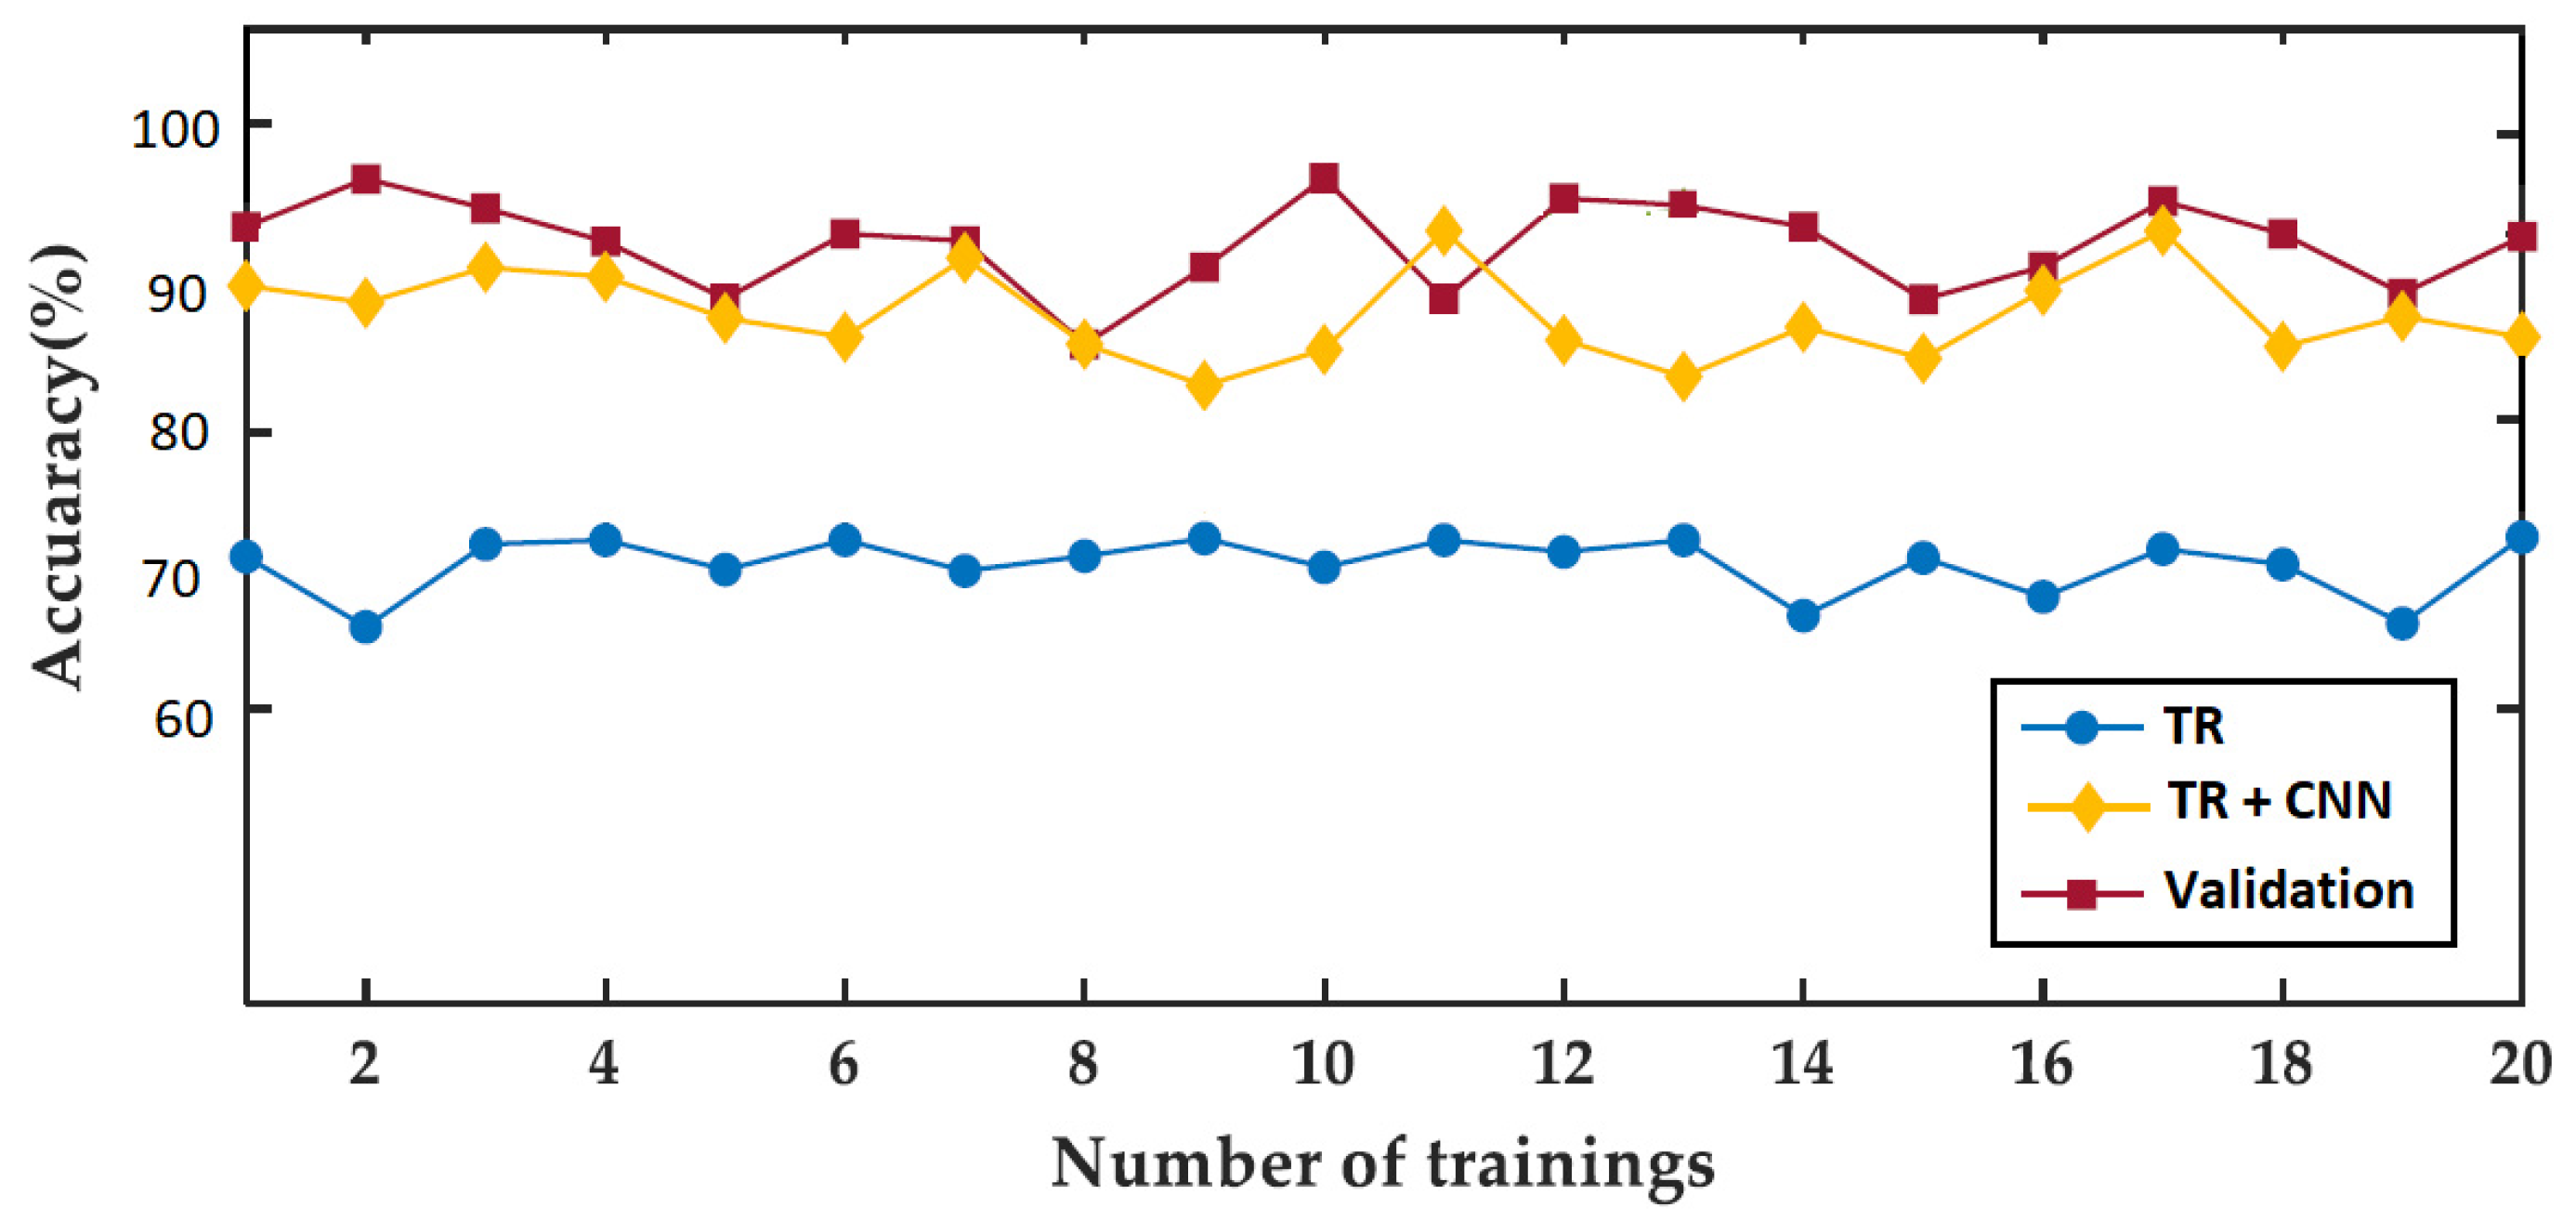
5.3. Case Study 3: Analysis of Time Reversal (TR) and Integration of Time Reversal with Convolution Neural Network (TR-CNN) Techniques

Time reversal (TR) and the integration of time reversal with convolution neural network (TR-CNN) techniques are both effective methods for diagnosing PD in power transformers. The TR technique has been widely used for many years and is a well-established method. It involves transmitting a short signal into the transformer and analysing the reflected signal to identify the severity and location of PD. On the other hand, the TR-CNN technique is a more recent approach that combines the benefits of TR with CNNs to enhance the reliability and accuracy of PD diagnosis.
The TR-CNN technique offers several advantages over TR, including increased accuracy and the ability to analyse large datasets. By training CNNs on a dataset of PD signals, the TR-CNN technique can automatically learn and extract features from the TR signals, reducing the effects of noise and other sources of interference. However, the TR-CNN technique requires more computational resources and may be more time-consuming than TR. Further explanations are presented in Table 6, including the integration with CNN leveraging deep learning for improved feature extraction, leading to higher accuracy.
The CNN’s ability to recognise subtle patterns enhances sensitivity compared to the simpler CNN, which maintains specificity even in diverse discharge scenarios, outperforming time reversal. Time reversal is computationally efficient, while the CNN approach incurs higher computational costs. Its integration with CNN provides enhanced robustness through adaptability to diverse operating conditions. CNN’s deep learning capabilities enable better generalisation to new or unseen data compared to time reversal. Time reversal is user-friendly and practical for basic needs; CNN offers higher accuracy but may be more complex. Time reversal is more user-friendly, while the CNN approach requires more expertise for setup and interpretation. Figure 10 below showcases the final comparison of the approaches.

6. Conclusions

Both time reversal (TR) and integration of time reversal with convolution neural network (TR-CNN) techniques can be used for diagnosing partial discharge (PD) in power transformers. The TR technique involves transmitting a short signal into the transformer and then recording the signal that is reflected back. By analysing the characteristics of the reflected signal, it is possible to identify the location and severity of PD. The TR technique is a well-established technique that has been used for many years in the field of non-destructive testing. TR-CNN technique combines the TR method with convolutional neural networks (CNNs) to improve the accuracy and reliability of PD diagnosis. The CNNs are trained on a dataset of PD signals to automatically learn and extract features from the TR signals. TR-CNN technique can improve the accuracy and reliability of PD diagnosis by reducing the effects of noise and other sources of interference.
Both TR and TR-CNN techniques rely on the analysis of electromagnetic waves generated by PD, which can be described by the Maxwell equations. By analysing the characteristics of these waves, it is possible to identify the location and severity of PD in power transformers. Furthermore, it is recommended to use these techniques for PD diagnosis in power transformers, which includes proper training and expertise in the application of these techniques. Additionally, it is important to carefully select and prepare the equipment and data for analysis to ensure accurate and reliable results. The combination of different measurement techniques, including TR and TR-CNN, along with other complementary techniques such as acoustic emission and ultrasonic testing, for a comprehensive and thorough diagnosis of PD in power transformers. The use of multiple techniques can help to provide a more complete understanding of the PD behaviour and can increase the accuracy and reliability of diagnosis.
Finally, the comparative study between time reversal and the integration of time reversal with a convolutional neural network (CNN) for diagnosing partial discharge in power transformers has provided valuable insights into their respective strengths and limitations. Time reversal, being a simple and computationally efficient method, exhibits satisfactory performance in specific discharge scenarios. However, it faces challenges in adapting to diverse operating conditions and lacks sensitivity to subtle discharge patterns.
On the other hand, the integration with CNN significantly enhances diagnostic accuracy, sensitivity, and specificity. Leveraging deep learning for feature extraction, the integrated model proves to be robust and adaptable to various operating conditions, making it particularly effective in recognising subtle discharge patterns. The study recommends further investigation into the feasibility of continuous monitoring using the integrated approach, especially for the early detection of partial discharges. Proactive maintenance strategies can be developed based on the insights gained from continuous monitoring. Lastly, further validation in real-world power transformer environments is essential to assess the practical applicability and reliability of both TR and the integrated CNN approach. Collaboration with industry partners for access to diverse and real-time transformer data is recommended.

Author Contributions

Conceptualisation, P.M.S. and P.B.; methodology, P.M.S.; software, P.M.S.; validation, P.B.; formal analysis, P.M.S.; investigation, P.B.; resources, P.B.; data curation, P.M.S.; writing—original draft preparation, P.M.S.; writing—review and editing, P.M.S.; visualisation, P.M.S.; supervision, P.B.; project administration, P.B.; funding acquisition, P.B. All authors have read and agreed to the published version of the manuscript.

Funding

This was funded by the University of Johannesburg and received no external funding.

Data Availability Statement

Data are contained within the article.

Conflicts of Interest

The authors declare no conflict of interest.

References

  1. Zhu, M.-X.; Wang, Y.-B.; Chang, D.-G.; Zhang, G.-J.; Shao, X.-J.; Zhan, J.-Y.; Chen, J.-M. Discrimination of three or more partial discharge sources by multi-step clustering of cumulative energy features. IET Sci. Meas. Technol. 2019, 13, 149–159. [Google Scholar] [CrossRef]
  2. Yaacob, M.M.; Alsaedi, M.A.; Rashed, J.R.; Dakhil, A.M.; Atyah, S.F. Review on partial discharge detection techniques related to high voltage power equipment using different sensors. Photonic Sens. 2014, 4, 325–337. [Google Scholar] [CrossRef]
  3. Fabian, J.; Neuwersch, M.; Sumereder, C.; Muhr, M.; Schwarz, R. State of the Art and Future Trends of Unconventional PD-Measurement at Power Transformers. J. Energy Power Eng. 2014, 8, 1093–1098. [Google Scholar]
  4. Sinaga, H.H.; Phung, B.T.; Blackburn, T.R. Partial discharge localization in transformers using UHF detection method. IEEE Trans. Dielectr. Electr. Insul. 2012, 19, 1891–1900. [Google Scholar] [CrossRef]
  5. Jahangir, H.; Akbari, A.; Werle, P.; Szczechowski, J. UHF PD measurements on power transformers-advantages and limitations. IEEE Trans. Dielectr. Electr. Insul. 2017, 24, 3933–3940. [Google Scholar] [CrossRef]
  6. Ariannik, M.; Azirani, M.A.; Werle, P.; Azirani, A.A. UHF Measurement in Power Transformers: An Algorithm to Optimize Accuracy of Arrival Time Detection and PD Localization. IEEE Trans. Power Deliv. 2019, 34, 1530–1539. [Google Scholar] [CrossRef]
  7. Bartley, W. Analysis of Transformer Failures. In Proceedings of the 67th Annual International Conference of Doble Clients, Paper 8N, Watertown, MA, USA, 27–31 March 2000. [Google Scholar]
  8. Hall, M.A. Correlation-Based Feature Selection for Machine Learning. Ph.D. Thesis, University of Waikato, Waikato, New Zealand, 1999. [Google Scholar]
  9. Duval, M.; de Pabla, A. Interpretation of Gas-in-Oil Analysis Using New IEC Publication 60599 and IEC TC 10 Databases. IEEE Electr. Insul. Mag. 2001, 17, 31–41. [Google Scholar] [CrossRef]
  10. Acuña, E.; Rodriguez, C. The Treatment of Missing Values and Its Effect on Classifier Accuracy. In Classification, Clustering, and Data Mining Applications; Banks, D., McMorris, F.R., Arabie, P., Gaul, W., Eds.; Springer: Berlin/Heidelberg, Germany, 2004; pp. 639–647. [Google Scholar] [CrossRef]
  11. Peng, L.; Lei, L.; Naijun, W. A Quantitative Study of the Effect of Missing Data in Classifiers. In Proceedings of the Fifth International Conference on Computer and Information Technology, Shanghai, China, 21–23 September 2005; pp. 28–33. [Google Scholar] [CrossRef]
  12. Ma, H.; Saha, T.K.; Ekanayake, C. Machine learning techniques for power transformer insulation diagnosis. In Proceedings of the IEEE AUPEC 2011, Brisbane, QLD, Australia, 25–28 September 2011; pp. 1–6. [Google Scholar]
  13. Guo, C.; Dong, M.; Wu, Z. Fault Diagnosis of Power Transformers Based on Comprehensive Machine Learning of Dissolved Gas Analysis. In Proceedings of the IEEE 20th International Conference on Dielectric Liquids (ICDL), Roma, Italy, 23–27 June 2019; pp. 1–4. [Google Scholar] [CrossRef]
  14. Liang, Y.; Sun, X.; Liu, Q.; Bian, J.; Li, Y. Fault Diagnosis Model of Power Transformer Based on Combinatorial KFDA. In Proceedings of the International Conference on Condition Monitoring and Diagnosis, Beijing, China, 21–24 April 2008; pp. 956–959. [Google Scholar] [CrossRef]
  15. Rajesh, K.N.V.P.S.; Rao, U.M.; Fofana, I.; Rozga, P.; Paramane, A. Influence of Data Balancing on Transformer DGA Fault Classification With Machine Learning Algorithms. IEEE Trans. Dielectr. Electr. Insul. 2023, 30, 385–392. [Google Scholar] [CrossRef]
  16. Raghuraman, R.; Darvishi, A. Detecting Transformer Fault Types from Dissolved Gas Analysis Data Using Machine Learning Techniques. In Proceedings of the IEEE 15th Dallas Circuit And System Conference (DCAS), Dallas, TX, USA, 17–19 June 2022; pp. 1–5. [Google Scholar] [CrossRef]
  17. Mehta, A.K.; Sharma, R.N.; Chauhan, S.; Saho, S. Transformer diagnostics under dissolved gas analysis using Support Vector Machine. In Proceedings of the International Conference on Power, Energy and Control (ICPEC), Dindigul, India, 6–8 February 2013; pp. 181–186. [Google Scholar] [CrossRef]
  18. Illias, H.A.; Choon, C.K.; Liang, W.Z.; Mokhlis, H.; Ariffin, A.M.; Yousof, M.F.M. Fault Identification in Power Transformers Using Dissolve Gas Analysis and Support Vector Machine. In Proceedings of the IEEE International Conference on the Properties and Applications of Dielectric Materials (ICPADM), Johor Bahru, Malaysia, 12–14 July 2021; pp. 33–36. [Google Scholar] [CrossRef]
  19. Sekatane, P.M.; Bokoro, P. Partial Discharge Localization through k-NN and SVM. Energies 2023, 16, 7430. [Google Scholar] [CrossRef]
  20. Patil, S.D.; Dharme, M.; Patil, A.J.; A K, G.C.; Jarial, R.K.; Singh, A. DGA Based Ensemble learning and Random Forest Models for Condition Assessment of Transformers. In Proceedings of the International Conference on Smart Generation Computing, Communication and Networking (SMART GENCON), Bangalore, India, 23–25 December 2022; pp. 1–6. [Google Scholar] [CrossRef]
  21. Sekatane, P.M.; Olwal, T.O. Residual life estimation of power transformer based on Karl Fischer and Adaptive neuro-fuzzy interference system. In Proceedings of the IEEE AFRICON, Arusha, Tanzania, 13–15 September 2021; pp. 1–5. [Google Scholar] [CrossRef]
  22. Sekatane, P.; Bokoro, P. Improving Diagnostic Technique of Moisture Content in Power Transformers Using Adaptive Neuro-Fuzzy Inference System. In Proceedings of the IEEE PES/IAS PowerAfrica, Nairobi, Kenya, 23–27 August 2021; pp. 1–5. [Google Scholar] [CrossRef]
  23. Sekatane, P.; Jordaan, J.; Bokoro, P. Assessment of moisture content in power transformer based on traditional techniques and Adaptive neuro-fuzzy interference system. In Proceedings of the 11th International Conference on Electrical and Electronics Engineering (ELECO), Bursa, Turkey, 28–30 November 2019; pp. 987–991. [Google Scholar] [CrossRef]
  24. Magabane, P.; Bokoro, P.; Jordaan, J. A Review of detection and mitigation of negative dissipation factor in high voltage power transformers. In Proceedings of the IEEE AFRICON, Accra, Ghana, 25–27 September 2019; pp. 1–4. [Google Scholar] [CrossRef]
  25. Rao, U.M.; Fofana, I.; Rajesh, K.N.V.P.S.; Picher, P. Identification and Application of Machine Learning Algorithms for Transformer Dissolved Gas Analysis. IEEE Trans. Dielectr. Electr. Insul. 2021, 28, 1828–1835. [Google Scholar] [CrossRef]
  26. Laayati, O.; Bouzi, M.; Chebak, A. Design of an oil immersed power transformer monitoring and self diagnostic system integrated in Smart Energy Management System. In Proceedings of the 3rd Global Power, Energy and Communication Conference (GPECOM), Antalya, Turkey, 5–8 October 2021; pp. 240–245. [Google Scholar] [CrossRef]
  27. Das, S.; Paramane, A.; Chatterjee, S.; Rao, U.M. Sensing Incipient Faults in Power Transformers Using Bi-Directional Long Short-Term Memory Network. IEEE Sens. Lett. 2023, 7, 7000304. [Google Scholar] [CrossRef]
  28. Souza, F.R.; Ramachandran, B. Dissolved gas analysis to identify faults and improve reliability in transformers using support vector machines. In Proceedings of the Clemson University Power Systems Conference (PSC), Clemson, SC, USA, 8–11 March 2016; pp. 1–4. [Google Scholar] [CrossRef]
  29. Saha, C.; Baruah, N.; Nayak, S.K. Implementation of Self-Organizing Map and Logistic Regression in Dissolved Gas Analysis of Transformer oils. In Proceedings of the IEEE International Conference on the Properties and Applications of Dielectric Materials (ICPADM), Johor Bahru, Malaysia, 12–14 July 2021; pp. 131–134. [Google Scholar] [CrossRef]
  30. Rediansyah, D.; Prasojo, R.A.; Suwarno; Abu-Siada, A. Artificial Intelligence-Based Power Transformer Health Index for Handling Data Uncertainty. IEEE Access 2021, 9, 150637–150648. [Google Scholar] [CrossRef]
  31. Zhang, Z.; Huang, W.-H.; Xiao, D.-M.; Liu, Y.-L. Fault detection of power transformers using genetic programming method. In Proceedings of the 2004 International Conference on Machine Learning and Cybernetics (IEEE Cat. No.04EX826), Shanghai, China, 26–29 August 2004; Volume 5, pp. 3018–3022. [Google Scholar] [CrossRef]
  32. Kumar, A.H.; Thind, B.S.; Reddy, C.C. Improving Reliability of Transformers based on DGA Analysis using Machine Learning Techniques. In Proceedings of the IEEE Conference on Electrical Insulation and Dielectric Phenomena (CEIDP), Vancouver, BC, Canada, 12–15 December 2021; pp. 151–154. [Google Scholar] [CrossRef]
  33. Ekanayake, C.; Ma, H.; Saha, T. Past experience and future developments toward the safeguarding of power transformers. In Proceedings of the International Conference on Electrical & Computer Engineering (ICECE 2010), Dhaka, Bangladesh, 18–20 December 2010; pp. 279–282. [Google Scholar] [CrossRef]
  34. de Andrade Lopes, S.M.; Flauzino, R.A. A Novel Approach for Incipient Fault Diagnosis in Power Transformers by Artificial Neural Networks. In Proceedings of the IEEE PES Innovative Smart Grid Technologies Europe (ISGT Europe), Espoo, Finland, 18–21 October 2021; pp. 1–5. [Google Scholar] [CrossRef]
  35. Tra, V.; Duong, B.-P.; Kim, J.-M. Improving diagnostic performance of a power transformer using an adaptive over-sampling method for imbalanced data. IEEE Trans. Dielectr. Electr. Insul. 2019, 26, 1325–1333. [Google Scholar] [CrossRef]
  36. Laayati, O.; El Hadraoui, H.; Bouzi, M.; Chebak, A. Smart Energy Management System: Oil Immersed Power Transformer Failure Prediction and Classification Techniques Based on DGA Data. In Proceedings of the 2nd International Conference on Innovative Research in Applied Science, Engineering and Technology (IRASET), Meknes, Morocco, 3–4 March 2022; pp. 1–6. [Google Scholar] [CrossRef]
  37. Haque, M.E.; Darus, A.B.; Yaacob, M.M.; Ahmed, F. Diagnosis of GIS based on acoustic sensing technique. In Proceedings of the 1997 Fourth International Conference on Advances in Power System Control, Operation and Management, APSCOM-97. (Conf. Publ. No. 450), Hong Kong, China, 11–14 November 1997; Volume 2, pp. 556–558. [Google Scholar] [CrossRef]
  38. Braunlich, R.; Hassig, M.; Fuhr, J.; Aschwanden, T. Assessment on insulation condition of large power transformers by on-site electrical diagnostic methods. In Proceedings of the Conference Record of the 2000 IEEE International Symposium on Electrical Insulation, Anaheim, CA, USA, 2–5 April 2000; pp. 368–372. [Google Scholar]
  39. Wang, X.; Li, B.; Roman, H.T.; Russo, O.L.; Chin, K.; Farmer, K.R. Acousto-optical PD detection for transformers. IEEE Trans. Power Deliv. 2006, 21, 1068–1073. [Google Scholar] [CrossRef]
  40. Sharkawy, R.M.; Ibrahim, K.; Salama, M.M.A.; Bartnikas, R. Particle swarm optimization feature selection for the classification of conducting particles in transformer oil. IEEE Trans. Dielectr. Electr. Insul. 2011, 18, 1897–1907. [Google Scholar] [CrossRef]
  41. Rubio-Serrano, J.; Rojas-Moreno, M.V.; Posada, J.; Tarifa, J.M.; Robles, G.; García-Souto, J. Electro-acoustic detection, identification and location of partial discharge sources in oil-paper insulation systems. IEEE Trans. Dielectr. Electr. Insul. 2012, 19, 1569–1578. [Google Scholar] [CrossRef]
  42. Coenen, S.; Tenbohlen, S. Location of PD sources in power transformers by UHF and acoustic measurements. IEEE Trans. Dielectr. Electr. Insul. 2012, 19, 1934–1940. [Google Scholar] [CrossRef]
  43. Li, J.; Jiang, T.; Wang, C.; Cheng, C. Optimization of UHF Hilbert antenna for partial discharge detection of transformers. IEEE Trans. Antennas Propag. 2021, 60, 2536–2540. [Google Scholar]
  44. Hooshmand, R.A.; Parastegari, M.; Yazdanpanah, M. Simultaneous location of two partial discharge sources in power transformers based on acoustic emission using the modified binary partial swarm optimisation algorithm. IET Sci. Meas. Technol. 2012, 7, 119–127. [Google Scholar] [CrossRef]
  45. Zheng, S.; Li, C.; Tang, Z.; Chang, W.; He, M. Location of PDs inside transformer windings using UHF methods. IEEE Trans. Dielectr. Electr. Insul. 2014, 21, 386–393. [Google Scholar] [CrossRef]
  46. Sinaga, H.H.; Phung, B.T.; Blackburn, T.R. Recognition of single and multiple partial discharge sources in transformers based on ultra-high frequency signals. IET Gener. Transm. Distrib. 2014, 8, 160–169. [Google Scholar] [CrossRef]
  47. Cui, L.; Chen, W.; Xie, B.; Du, J.; Long, Z.; Li, Y. Characteristic information extraction and developing process recognizing method of surface discharge in oil immersed paper insulation. In Proceedings of the 2014 International Conference on High Voltage Engineering and Application (ICHVE), Poznan, Poland, 8–11 September 2014; pp. 3–6. [Google Scholar]
  48. Boczar, T.; Cicho, A.; Borucki, S. Diagnostic expert system of transformer insulation systems using the acoustic emission method. IEEE Trans. Dielectr. Electr. Insul. 2014, 21, 854–865. [Google Scholar] [CrossRef]
  49. Búa-Núñez, I.; Posada-Román, J.E.; Rubio-Serrano, J.; Garcia-Souto, J.A. Instrumentation system for location of partial discharges using acoustic detection with piezoelectric transducers and optical fiber sensors. IEEE Trans. Instrum. Meas. 2014, 63, 1002–1013. [Google Scholar] [CrossRef]
  50. Chen, M.K.; Chen, J.M.; Cheng, C.Y. Partial discharge detection by RF coil in 161 kV power transformer. IEEE Trans. Dielectr. Electr. Insul. 2014, 21, 1405–1414. [Google Scholar] [CrossRef]
  51. Harbaji, M.; Shaban, K.; El-Hag, A. Classification of common partial discharge types in oil-paper insulation system using acoustic signals. IEEE Trans. Dielectr. Electr. Insul. 2015, 22, 1674–1683. [Google Scholar] [CrossRef]
  52. Mirzaei, H.; Akbari, A.; Gockenbach, E.; Miralikhani, K. Advancing new techniques for UHF PDdetection and localization in the power transformers in the factory tests. IEEE Trans. Dielectr. Electr. Insul. 2015, 22, 448–455. [Google Scholar] [CrossRef]
  53. Sarkar, B.; Koley, C.; Roy, N.K.; Kumbhakar, P. Condition monitoring of high voltage transformers using Fiber Bragg Grating Sensor. Meas. J. Int. Meas. Confed. 2015, 74, 255–267. [Google Scholar] [CrossRef]
  54. Qi, Z.; Yi, Y.; Qiaohua, W.; Zhihao, W.; Zhe, L. Study on the online dissolved gas analysis monitor based on the photoacoustic spectroscopy. In Proceedings of the 2012 IEEE International Conference on Condition Monitoring and Diagnosis, Bali, Indonesia, 23–27 September 2012; pp. 433–436. [Google Scholar]
  55. Seo, J.; Ma, H.; Saha, T. Probabilistic wavelet transform for partial discharge measurement of transformer. IEEE Trans. Dielectr. Electr. Insul. 2015, 22, 1105–1117. [Google Scholar] [CrossRef]
  56. Mitchell, S.D.; Siegel, M.; Beltle, M.; Tenbohlen, S. Discrimination of partial discharge sources in the UHF domain. IEEE Trans. Dielectr. Electr. Insul. 2016, 23, 1068–1075. [Google Scholar] [CrossRef]
  57. Rostaminia, R.; Sanie, M.; Vakilian, M.; Mortazavi, S.S.; Parvin, V. Accurate power transformer PD pattern recognition via its model. IET Sci. Meas. Technol. 2016, 10, 745–753. [Google Scholar] [CrossRef]
  58. Jahangir, H.; Akbari, A.; Werle, P.; Szczechowski, J. Possibility of PD calibration on power transformers using UHF probes. IEEE Trans. Dielectr. Electr. Insul. 2017, 24, 2968–2976. [Google Scholar] [CrossRef]
  59. Wang, Y.-B.; Chang, D.-G.; Fan, Y.-H.; Zhang, G.-J.; Zhan, J.-Y.; Shao, X.-J.; He, W.-L. Acoustic localization of partial discharge sources in power transformers using a particle-swarmoptimization-route-searching algorithm. IEEE Trans. Dielectr. Electr. Insul. 2017, 24, 3647–3656. [Google Scholar] [CrossRef]
  60. Ghosh, R.; Chatterjee, B.; Dalai, S. A method for the localization of partial discharge sources using partial discharge pulse information from acoustic emissions. IEEE Trans. Dielectr. Electr. Insul. 2017, 24, 237–245. [Google Scholar] [CrossRef]
  61. Qian, S.; Chen, H.; Xu, Y.; Su, L. High sensitivity detection of partial discharge acoustic emission within power transformer by sagnac fiber optic sensor. IEEE Trans. Dielectr. Electr. Insul. 2018, 25, 2313–2320. [Google Scholar] [CrossRef]
  62. Du, J.; Chen, W.; Cui, L.; Zhang, Z.; Tenbohlen, S. Investigation on the propagation characteristics of PD-induced electromagnetic waves in an actual 110 kV power transformer and its simulation results. IEEE Trans. Dielectr. Electr. Insul. 2018, 25, 1941–1948. [Google Scholar] [CrossRef]
  63. Wang, Y.-B.; Fan, Y.-H.; Qin, S.-R.; Chang, D.-G.; Shao, X.-J.; Mu, H.-B.; Zhang, G.-J. Partial discharge localisation methodology for power transformers based on improved acoustic propagation route search algorithm. IET Sci. Meas. Technol. 2018, 12, 1023–1030. [Google Scholar] [CrossRef]
  64. Gao, C.; Wang, W.; Song, S.; Wang, S.; Yu, L.; Wang, Y. Localization of partial discharge in transformer oil using Fabry-Perot optical fiber sensor array. IEEE Trans. Dielectr. Electr. Insul. 2018, 25, 2279–2286. [Google Scholar] [CrossRef]
  65. Si, W.; Fu, C.; Yuan, P. An Integrated Sensor with AE and UHF Methods for Partial Discharges Detection in Transformers Based on Oil Valve. IEEE Sensors Lett. 2019, 3, 2019–2021. [Google Scholar] [CrossRef]
  66. Ansari, M.A.; Martin, D.; Saha, T.K. Investigation of Distributed Moisture and Temperature Measurements in Transformers Using Fiber Optics Sensors. IEEE Trans. Power Deliv. 2019, 34, 1776–1784. [Google Scholar] [CrossRef]
  67. Azadifar, M.; Karami, H.; Wang, Z.; Rubinstein, M.; Rachidi, F.; Karami, H.; Ghasemi, A.; Gharehpetian, G.B. Partial Discharge Localization Using Electromagnetic Time Reversal: A Performance Analysis. IEEE Access 2020, 8, 147507–147515. [Google Scholar] [CrossRef]
  68. Karami, H.; Rachidi, F.; Azadifar, M.; Rubinstein, M. An Acoustic Time Reversal Technique to Locate a Partial Discharge Source: Two-Dimensional Numerical Validation. IEEE Trans. Dielectr. Electr. Insul. 2020, 27, 2203–2205. [Google Scholar] [CrossRef]
  69. Karami, H.; Azadifar, M.; Mostajabi, A.; Rubinstein, M.; Karami, H.; Gharehpetian, G.B.; Rachidi, F. Partial Discharge Localization Using Time Reversal: Application to Power Transformers. Sensors 2020, 20, 1419. [Google Scholar] [CrossRef] [PubMed]
  70. Do, T.-D.; Tuyet-Doan, V.-N.; Cho, Y.-S.; Sun, J.-H.; Kim, Y.-H. Convolutional-Neural-Network-Based Partial Discharge Diagnosis for Power Transformer Using UHF Sensor. IEEE Access 2020, 8, 207377–207388. [Google Scholar] [CrossRef]
  71. Karami, H.; Aviolat, F.Q.; Azadifar, M.; Rubinstein, M.; Rachidi, F. Partial discharge localization in power transformers using acoustic time reversal. Electr. Power Syst. Res. 2022, 206, 107801. [Google Scholar] [CrossRef]
  72. Karami, H.; Azadifar, M.; Mostajabi, A.; Favrat, P.; Rubinstein, M.; Rachidi, F. Localization of Electromagnetic Interference Sources Using a Time-Reversal Cavity. IEEE Trans. Ind. Electron. 2021, 68, 654–662. [Google Scholar] [CrossRef]
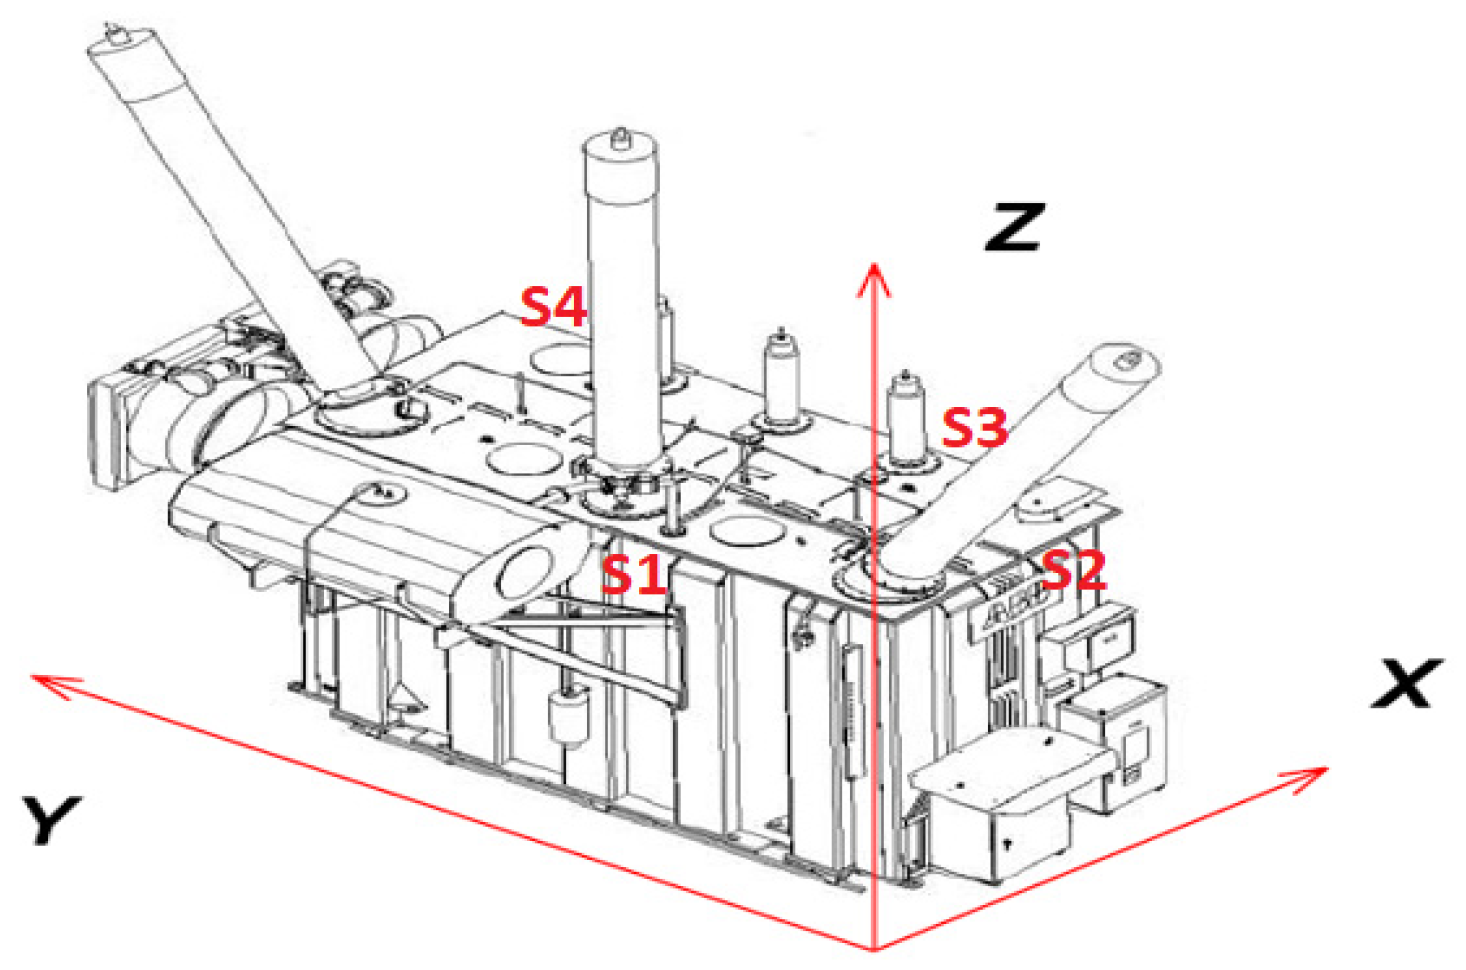
Figure 1. Structure of CNN.
Energies 16 07872 g001
Figure 2. Proposed methodology.
Energies 16 07872 g002
Figure 3. Three-dimensional data logging.
Energies 16 07872 g003
Figure 4. Calibration pulse time domain.
Energies 16 07872 g004
Figure 5. Calibration pulse on frequency.
Energies 16 07872 g005
Figure 6. The recorded event of acoustic signal.
Energies 16 07872 g006
Figure 7. The clear zoom for the event of acoustic signal.
Energies 16 07872 g007
Figure 8. Training process of CNN model, (a) accuracy and (b) loss value.
Energies 16 07872 g008
Figure 9. Comparison of the techniques.
Energies 16 07872 g009
Figure 10. Confusion matrices of the CNN model.
Energies 16 07872 g010
Table 1. Raw data of acoustic signal.
Location (mm)S1S2S3S4
(70, 50)0.130.100.120.10
(80, 70)0.230.180.220.25
(90, 60)0.180.200.210.23
(100, 50)0.140.120.130.12
(110, 70)0.200.210.230.20
(120, 60)0.190.220.210.23
(130, 50)0.130.110.120.10
(140, 70)0.210.240.230.22
(150, 60)0.200.180.220.23
(160, 50)0.150.130.140.12
Table 2. Performance of time reversal results.
MetricValue (%)
Accuracy72.6
Precision73.1
Recall71.9
F1-Score72.5
Table 3. Details of the layers used in the proposed CNN model architecture.
LayersTypeFilter SizeStrideKernelInput SizeParameters
Layer 1Conv2-D3 × 3164256 × 256 × 1576
Layer 2Pooling2 × 22-256 × 256 × 64-
Layer 3Conv2-D3 × 31128128 × 128 × 6473,728
Layer 4Pooling2 × 22-128 × 128 × 128-
Layer 5Conv2-D3 × 3125664 × 64 × 128294,912
Layer 6Pooling2 × 22-64 × 64 × 256-
Layer 7Conv2-D3 × 3151232 × 32 × 2561,179,648
Layer 8Pooling2 × 22-32 × 32 × 512-
Layer 9Fully Connected--409616 × 16 × 5122,097,152
Layer 10Output Layer--8409632,776
Table 4. Batch sizes and average accuracy for a learning rate.
Learning RateBatch SizeAverage Accuracy
0.00168090.40
0.00150089.00
0.00130088.95
0.00120088.93
Table 5. Performance of the integration.
MetricValue (%)
Accuracy90.4
Precision90.2
Recall90.6
F1-Score90.4
Table 6. Comparison of the TR and integration with CNN.
MetricTime Reversal (%)Integration with CNN (%)
Diagnostic Accuracy7592
Sensitivity6085
Specificity8092
Computational Efficiency9075
Robustness7095
Generalisation6588
Practical Applicability8578
User-friendliness8865
Disclaimer/Publisher’s Note: The statements, opinions and data contained in all publications are solely those of the individual author(s) and contributor(s) and not of MDPI and/or the editor(s). MDPI and/or the editor(s) disclaim responsibility for any injury to people or property resulting from any ideas, methods, instructions or products referred to in the content.

