Article

Enhanced Thermal Properties of Phase Change Materials through Surfactant-Functionalized Graphene Nanoplatelets for Sustainable Energy Storage

1
Faculty of Mechanical and Automotive Engineering Technology, Universiti Malaysia Pahang Al-Sultan Abdullah, Pekan 26600, Pahang, Malaysia
2
Centre for Research in Advanced Fluid and Process, University Malaysia Pahang Al-Sultan Abdullah, Lebuhraya Tun Razak, Gambang, Kuantan 26300, Pahang, Malaysia
3
Research Centre for Nano-Materials and Energy Technology (RCNMET), School of Engineering and Technology, Sunway University, No. 5, Jalan Universiti, Bandar Sunway, Petaling Jaya 47500, Selangor Darul Ehsan, Malaysia
4
Center of Excellence for Energy and Eco-Sustainability Research, Uttaranchal University, Dehradun 248007, India
5
Institute of Sustainable Energy, Universiti Tenaga Nasional (UNITEN), Jalan Ikram-Uniten, Kajang 43000, Selangor, Malaysia
*
Authors to whom correspondence should be addressed.
Energies 2023, 16(22), 7668; https://doi.org/10.3390/en16227668
Submission received: 29 September 2023 / Revised: 10 November 2023 / Accepted: 18 November 2023 / Published: 20 November 2023
(This article belongs to the Section D1: Advanced Energy Materials)

Abstract

:
Phase change materials (PCMs) are increasingly gaining prominence in thermal energy storage due to their impressive energy storage capacity per unit volume, especially in applications with low and medium temperatures. Nevertheless, PCMs have significant limitations regarding their ability to conduct and store heat, primarily due to their inadequate thermal conductivity. One potential solution for improving the thermal conductivity of PCMs involves the inclusion of nanoparticles into them. However, a recurring issue arises after several thermal cycles, as most nanoparticles have a tendency to clump together and settle at the container’s base due to their low interfacial strength and poor compatibility. To address this challenge, including surfactants such as sodium dodecylbenzene sulfonate (SDBS) has emerged as a prevalent and economically viable approach, demonstrating a substantial impact on the dispersion of carbon nanoparticles within PCMs. The foremost objective is to investigate the improvement of thermal energy storage by utilizing graphene nanoplatelets (GNP), which are dispersed in A70 PCM at various weight percentages (0.1, 0.3, 0.5, 0.7, and 1.0), both with and without the use of surfactants. The findings indicate a remarkable enhancement in thermal conductivity when GNP with surfactants is added to the PCM, showing an impressive increase of 122.26% with a loading of 1.0 wt.% compared to conventional PCM. However, when 1.0 wt.% pure GNP was added, the thermal conductivity only increased by 48.83%. Additionally, the optical transmittance of the composite containing ASG-1.0 was significantly reduced by 84.95% compared to conventional PCM. Furthermore, this newly developed nanocomposite exhibits excellent stability, enduring 1000 thermal cycles and demonstrating superior thermal and chemical stability up to 257.51 °C. Due to its high thermal stability, the composite NePCM is an ideal candidate for preheating in industrial and photovoltaic thermal (PVT) applications, where it can effectively store thermal energy.

1. Introduction

Addressing environmental degradation and energy shortages necessitates the advancement of cutting-edge technology. Effectively harnessing thermal energy presents challenges due to the wide range of operating and material properties involved. Familiar sources of thermal energy loss include hot flue gases, thermal power plants, and industrial processes. Thermal energy storage (TES) methods offer the potential to recover both sensible and latent heat from waste heat sources [1]. However, the irregular and intermittent supply of renewable energy—influenced by weather patterns, solar radiation, wind conditions, and more—has driven the need for specialized technologies to store thermal energy cost-effectively, ensuring its efficient utilization [2].
Latent heat storage in TES offers superior storage capacity with minimal volume requirements, achieved through phase change materials (PCMs) [3,4], as opposed to sensible heat storage. PCMs maintain constant temperatures while changing their phase by absorbing and releasing significant amounts of heat. Three major types of PCMs exist: organic PCM, inorganic PCM, and eutectic PCM. Examples of organic PCMs include fatty acids and paraffin wax (PW), known for their excellent latent heat (LH), lower vapor pressure during melting, and stable thermal behavior [5]. However, paraffin wax’s heat conductivity is relatively low, ranging between 0.18 and 0.24 W/mK [6], limiting its ability to capture excess heat for other applications.
Researchers have proposed incorporating nanoparticles, including metallic particles, oxides [7], and carbon-based nanoparticles [8], into PCMs to enhance their thermophysical properties. For instance, Babapoor et al. [9] observed significant changes in PCM’s thermal properties by adding various nanomaterials. Highly heat-conductive nanomaterials can be dispersed within them to enhance the heat conductivity of these PCMs. Hamilton and Yu et al. [10,11] demonstrated that the heat conductivity of TiO2 nanofluids increases with a higher water content beyond model predictions. Smaller nanoparticles result in higher nanofluid thermal conductivity. Several studies on improving PCM thermal conductivity using carbon-based nanoparticles have been published. Tang et al. [12] reported that including multi-walled carbon nanotubes (MWCNTs) in organic PCMs greatly enhances thermal conductivity. Cut et al. [13] used a CNT additive to boost the thermal behavior of soy and PW PCMs, noting increased thermal conductivity with CNT/PCM ratios but no change in LH. Recently, a researcher [14] explored the impact of carbon additives (MWCNT, graphite, and graphene) on stearic acid heat performance in PCM, concluding that carbon additives improve PCMs’ thermal conductivity, especially when polyvinyl pyrrolidone is added as a dispersion stabilizer.
However, incorporating carbon-based nanomaterials into organic PCMs can lead to stability issues and slashed thermal performance [14,15], primarily due to clustering and sedimentation. Researchers have suggested using surfactants to address these challenges [7,16,17]. Surfactants consist of amphipathic molecules that alter the surface charge of nanoparticles through electrostatic stabilization, ensuring proper dispersion in organic PCMs [15]. Various surfactants have been studied, such as tetramethyl ethylene diamine (TMEDA), sodium dodecyl sulfate (SDS), sodium dodecanoate (1-decanol), and Triton X-100 (TEMED). Zhang et al. [18] used surfactants to disperse MWCNTs in hexadecane to reduce supercooling. Choi et al. [14] applied poly vinyl pyrrolidone (PVP) as a stabilizer to improve dispersion stability and minimize aggregation, enhancing thermal management capabilities.
Rufus et al. [19] employed sodium dodecylbenzene sulfonate (SDBS) as a stabilizer to prepare nano-dispersed PCM with TiO2, CuO, and GO nanoparticles. They found that adding nanoparticles lowered the phase change temperature while improving thermal conductivity. Wu et al. [20] synthesized PW with added carbon nanotubes (CNTs) using a solvent-based dispersant, noting increased thermal conductivity with CNTs but reduced latent heat. The study also revealed that CNT concentration affects particle stability in PCM. Prado and Lugo [21] utilized acetic acid as a surfactant to create stearate PCM supplemented with GNP or MgO, increasing thermal conductivity for both materials.
Researchers have explored various methods to enhance nanoparticle dispersion and stability in PCMs, including modifying nanoparticle surfaces during synthesis or adding surfactants to liquid PCMs. Surfactant addition stands out as a low-cost and practical approach. This research introduces a novel paraffin PLUSICE A70 graphene-nano-enhanced PCM with SDBS as a surfactant, which had not been previously reported to the authors’ knowledge. The study aims to investigate how SDBS affects the thermophysical performance and chemical stability of graphene nano-enhanced PCMs after 1000 cycles. Characterization techniques, including FESEM, DSC, FTIR, UV-VIS, and TGA, were employed to examine the materials’ morphology, chemical compatibility, thermal stability, thermophysical properties, and other aspects in detail. The resulting material can be applied in various medium-temperature-based applications, including cooling photovoltaic systems, electronic devices, automotive battery cooling, and hot water systems. The integration of surfactants into graphene-nano-enhanced phase change materials (NePCM) for TES is following the Sustainable Development Goals established by the United Nations, particularly Goals 7 (affordable and clean energy) and 13 (climate change).
The applications of NePCMs in solar energy utilization extend to various sectors, such as solar water heaters, concentrated solar power (CSP) systems, and photovoltaic (PV) cells. NePCMs can store excess thermal energy generated by solar collectors during the day and release it when needed, ensuring a steady and reliable energy supply, even during non-sunlight hours. Additionally, NePCMs can be integrated into heat transfer and storage systems in CSP systems to improve overall efficiency.
While the prospects for NePCMs in solar energy are promising, several challenges must be addressed. These challenges include the selection of suitable nanoparticles, encapsulation techniques, material compatibility, and long-term stability. Furthermore, the economic feasibility and scalability of NePCM-based solar systems are critical factors to consider for widespread adoption.

2. Materials and Methodology

2.1. Materials

Graphene nanoplatelets (GNP) with an average size of <2 µm, a surface area of 300 m2/g, and 100% purity were procured from Sigma-Aldrich Chemistry (St. Louis, MO, USA). Additionally, SDBS surfactant was employed as the emulsifier for the Carbon-based nanoparticles. The PCM PLUSICE A70 was acquired from PCM Products Ltd. (Peterborough, UK), and the manufacturer’s specifications indicate a phase transition temperature of 70 °C and a latent heat (LH) of 173 kJ/kg. The properties of PLUSICE A70, GNP, and SDBS are detailed in Table 1.

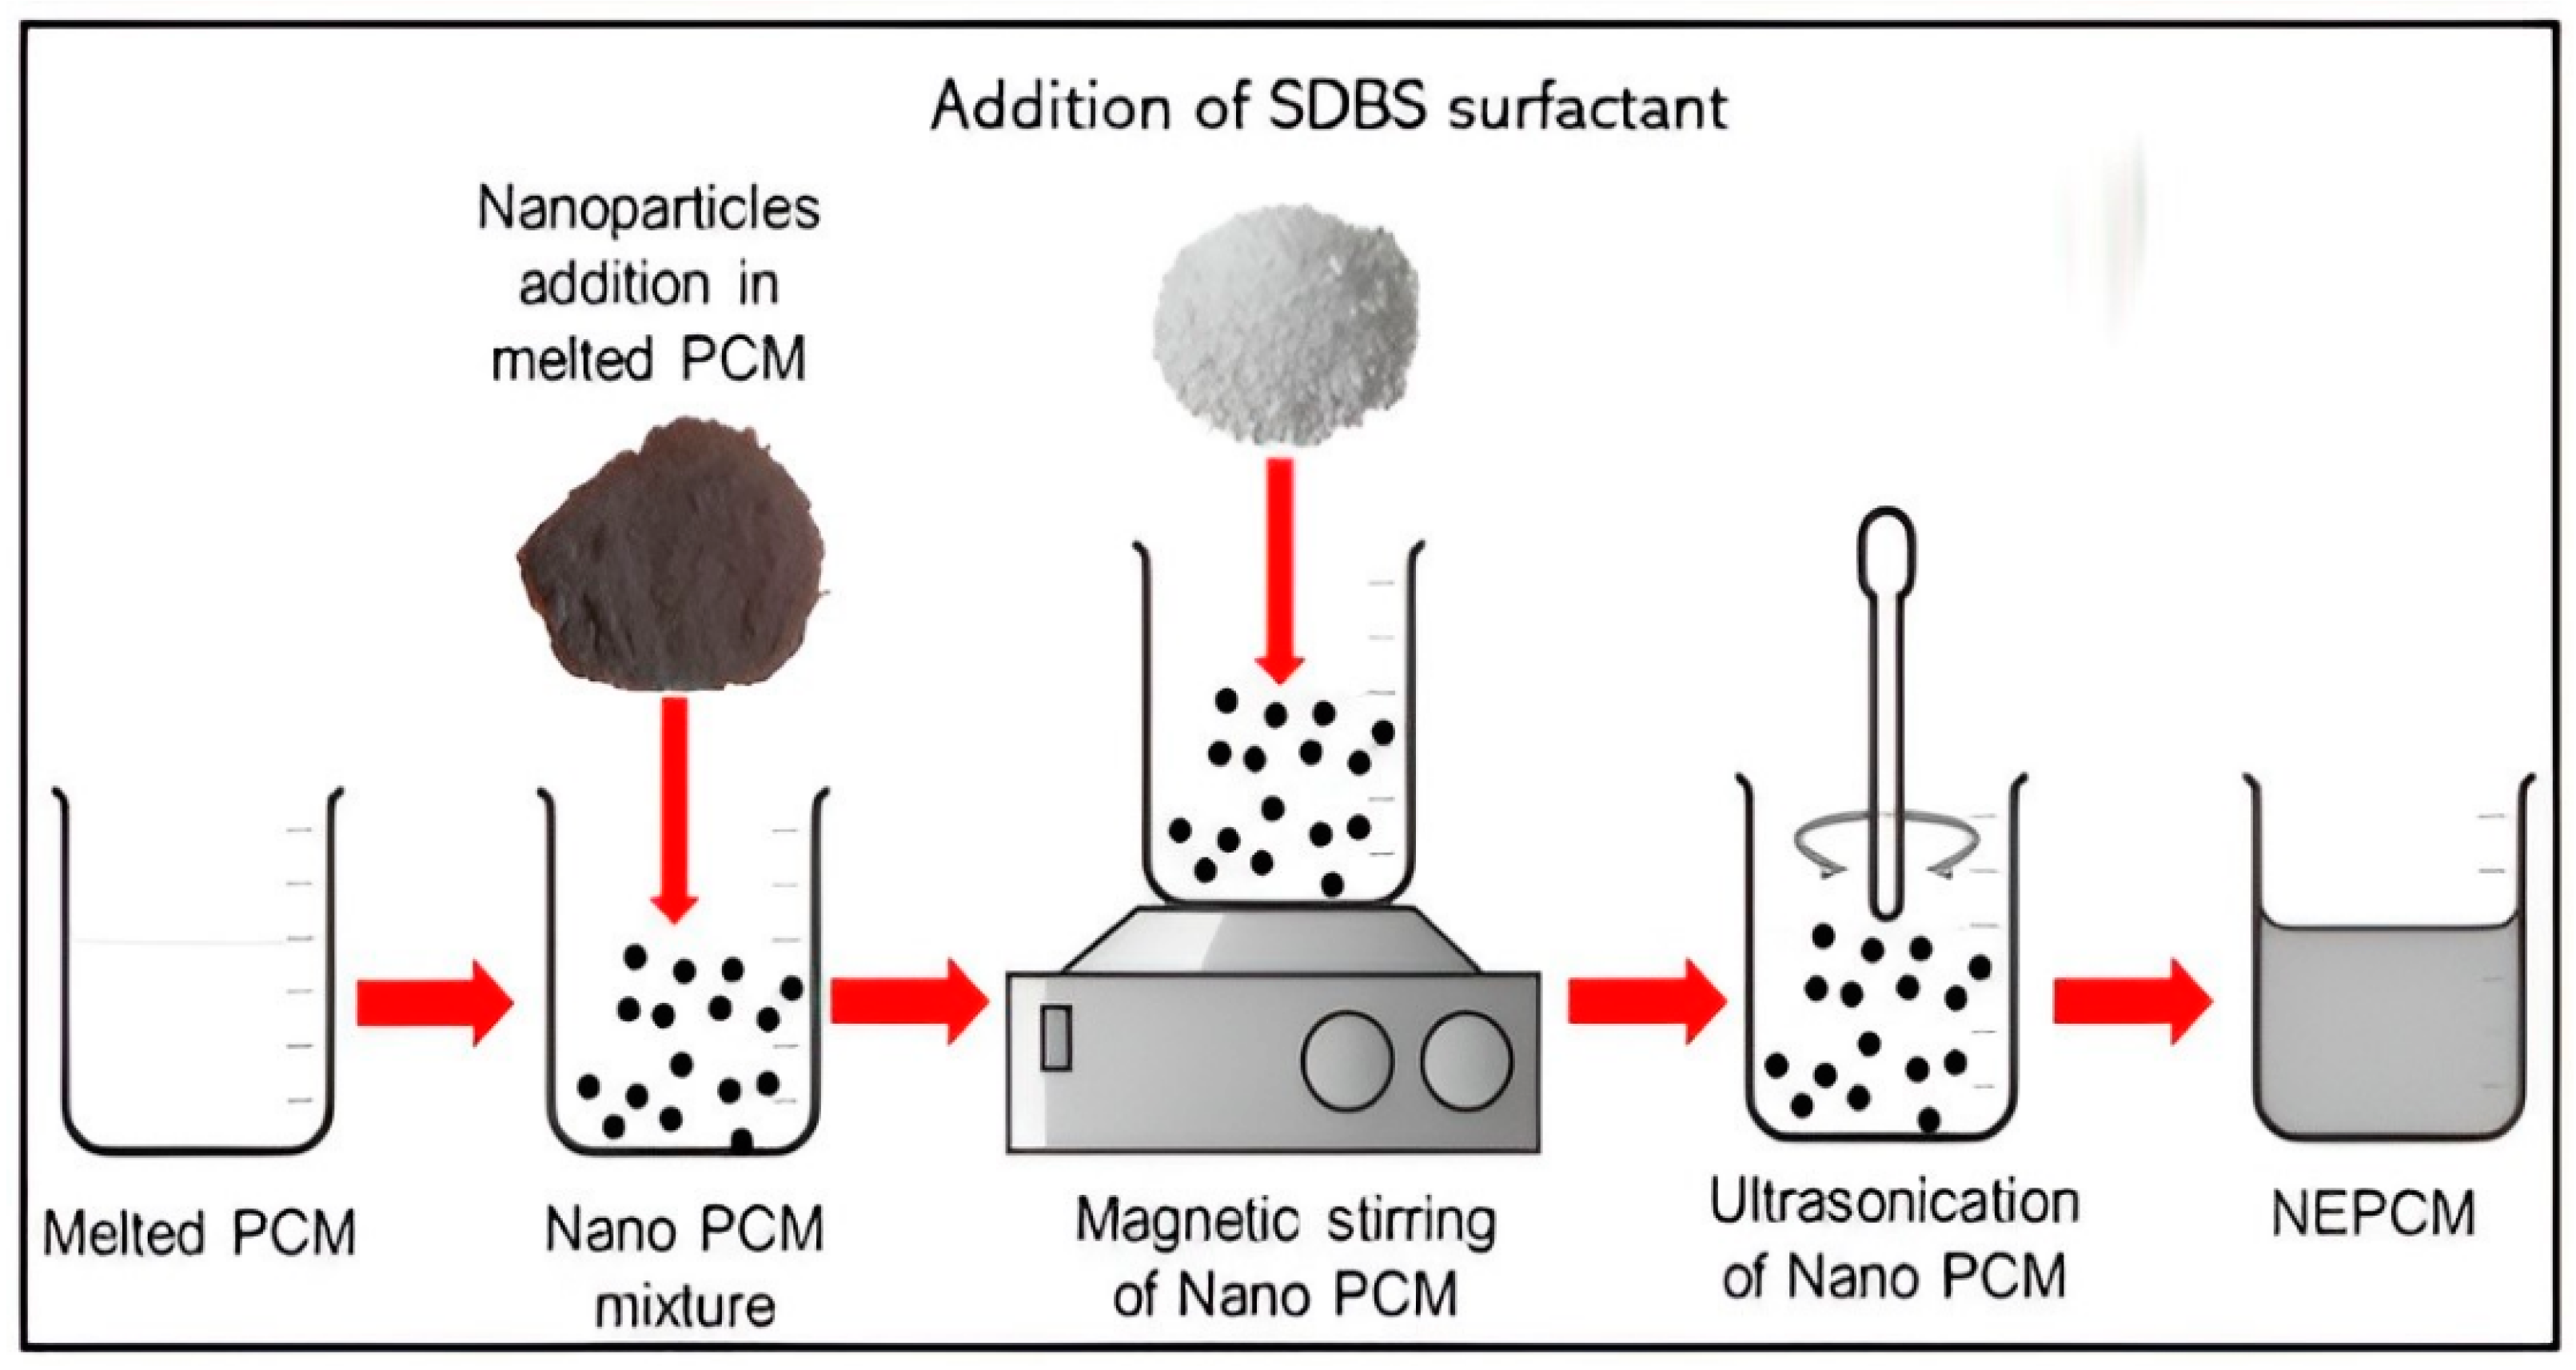
2.2. Preparation of Nanocomposites

The weight of the PCM was measured using an analytical macro balance, namely the TX323XL type manufactured by UNIBLOC (Kennesaw, GA, USA). The nanoparticles were weighed using an OHAUS (Parsippany, NJ, USA) EX224-type analytical microbalance. To enhance the distribution of nanoparticles within the PCM, the researchers employed probe sonication Model FS 1200N from Henan Chengyi Co., Ltd. (Zhengzhou, China). The synthesis of GNP included with surfactant within A70 PCM was conducted using a two-step procedure, as depicted by researchers Faisal et al. [22] in Figure 1. The first phase included melting the PCM, which was achieved by transferring the pure PCM into a beaker and then placing it on a hot plate. Subsequently, the substance was subjected to a temperature of 70 °C until the PCM underwent complete liquefaction. The integration of nanoparticles into the molten PCM was conducted as the second phase. Following that, the introduction of pristine graphene nanoplatelets (GNP) and the SDBS was integrated into the melting PCM.
Subsequently, various weight percentages (0.1%, 0.3%, 0.5%, 0.7%, and 1.0% by weight) of GNP and SDBS were introduced into the molten PCM using an analytical microbalance for precise measurement. Next, the resultant mixture was subjected to a 2 h probe sonication procedure to achieve proper nanomaterial dispersion inside the PCM. The exact process was used to produce all samples without including a surfactant. Throughout the manuscript, the nomenclature used to represent the composites is as follows: A70 with the addition of SDBS as a surfactant in the composite is referred to as ASG-0.1, ASG-0.3, ASG-0.5, ASG-0.7, and ASG-1.0. Similarly, AG-0.1, AG-0.3, AG-0.5, AG-0.7, and AG-1.0 denote GNP without SDBS as a surfactant in the NePCM.

2.3. Characterization of Nano PCM Composite

The AG and ASG composites were subjected to various characterization techniques to investigate their thermophysical attributes, morphology, and light absorbance. A field emission scanning electron microscope (FESEM), JOEL JSM-7800F brand from JEOL Ltd. (Akishima, Japan), was employed to visualize and measure the PCM surface structure, size, and diameter distribution, offering a comprehensive view of morphology. The thermal conductivity of the composites was measured with a TEMPOS thermal analyzer from METER group (Pullman, WA, USA), capable of precision within the 0.1 to 30 W/m.K range, with an accuracy of ±10% with the help of SH-3-type sensors. Differential scanning calorimetry (DSC) from Perkin Elmar DSC 8500 (Waltham, MA, USA) unveiled the phase transition temperature and melting enthalpy of AG and ASG composites. Additionally, FTIR spectroscopy (model: Perkin Elmer, USA) explored transmission across the 450 cm−1 to 4000 cm−1 range, while thermogravimetric analysis (TGA) with a TGA 4000 model from Perkin Elmer examined mass reduction up to 1000 °C. Lastly, ultraviolet visible spectroscopy (UV–Vis) using a UV–Vis-NIR Lambda 750 model from Perkin Elmer, originating in the USA, measured light absorbance within the ultraviolet and visible electromagnetic spectra. Once the nanocomposite mixture was prepared, a thermal cycle tester fabricated at Sunway University was employed to simulate repeated heating and cooling, mimicking the conditions NePCM might experience in industrial preheating and photovoltaic systems. This process involved subjecting the composites to up to 1000 cycles, equivalent to approximately three (3) years, to evaluate their thermal and chemical stabilities for various applications.

3. Result and Discussion

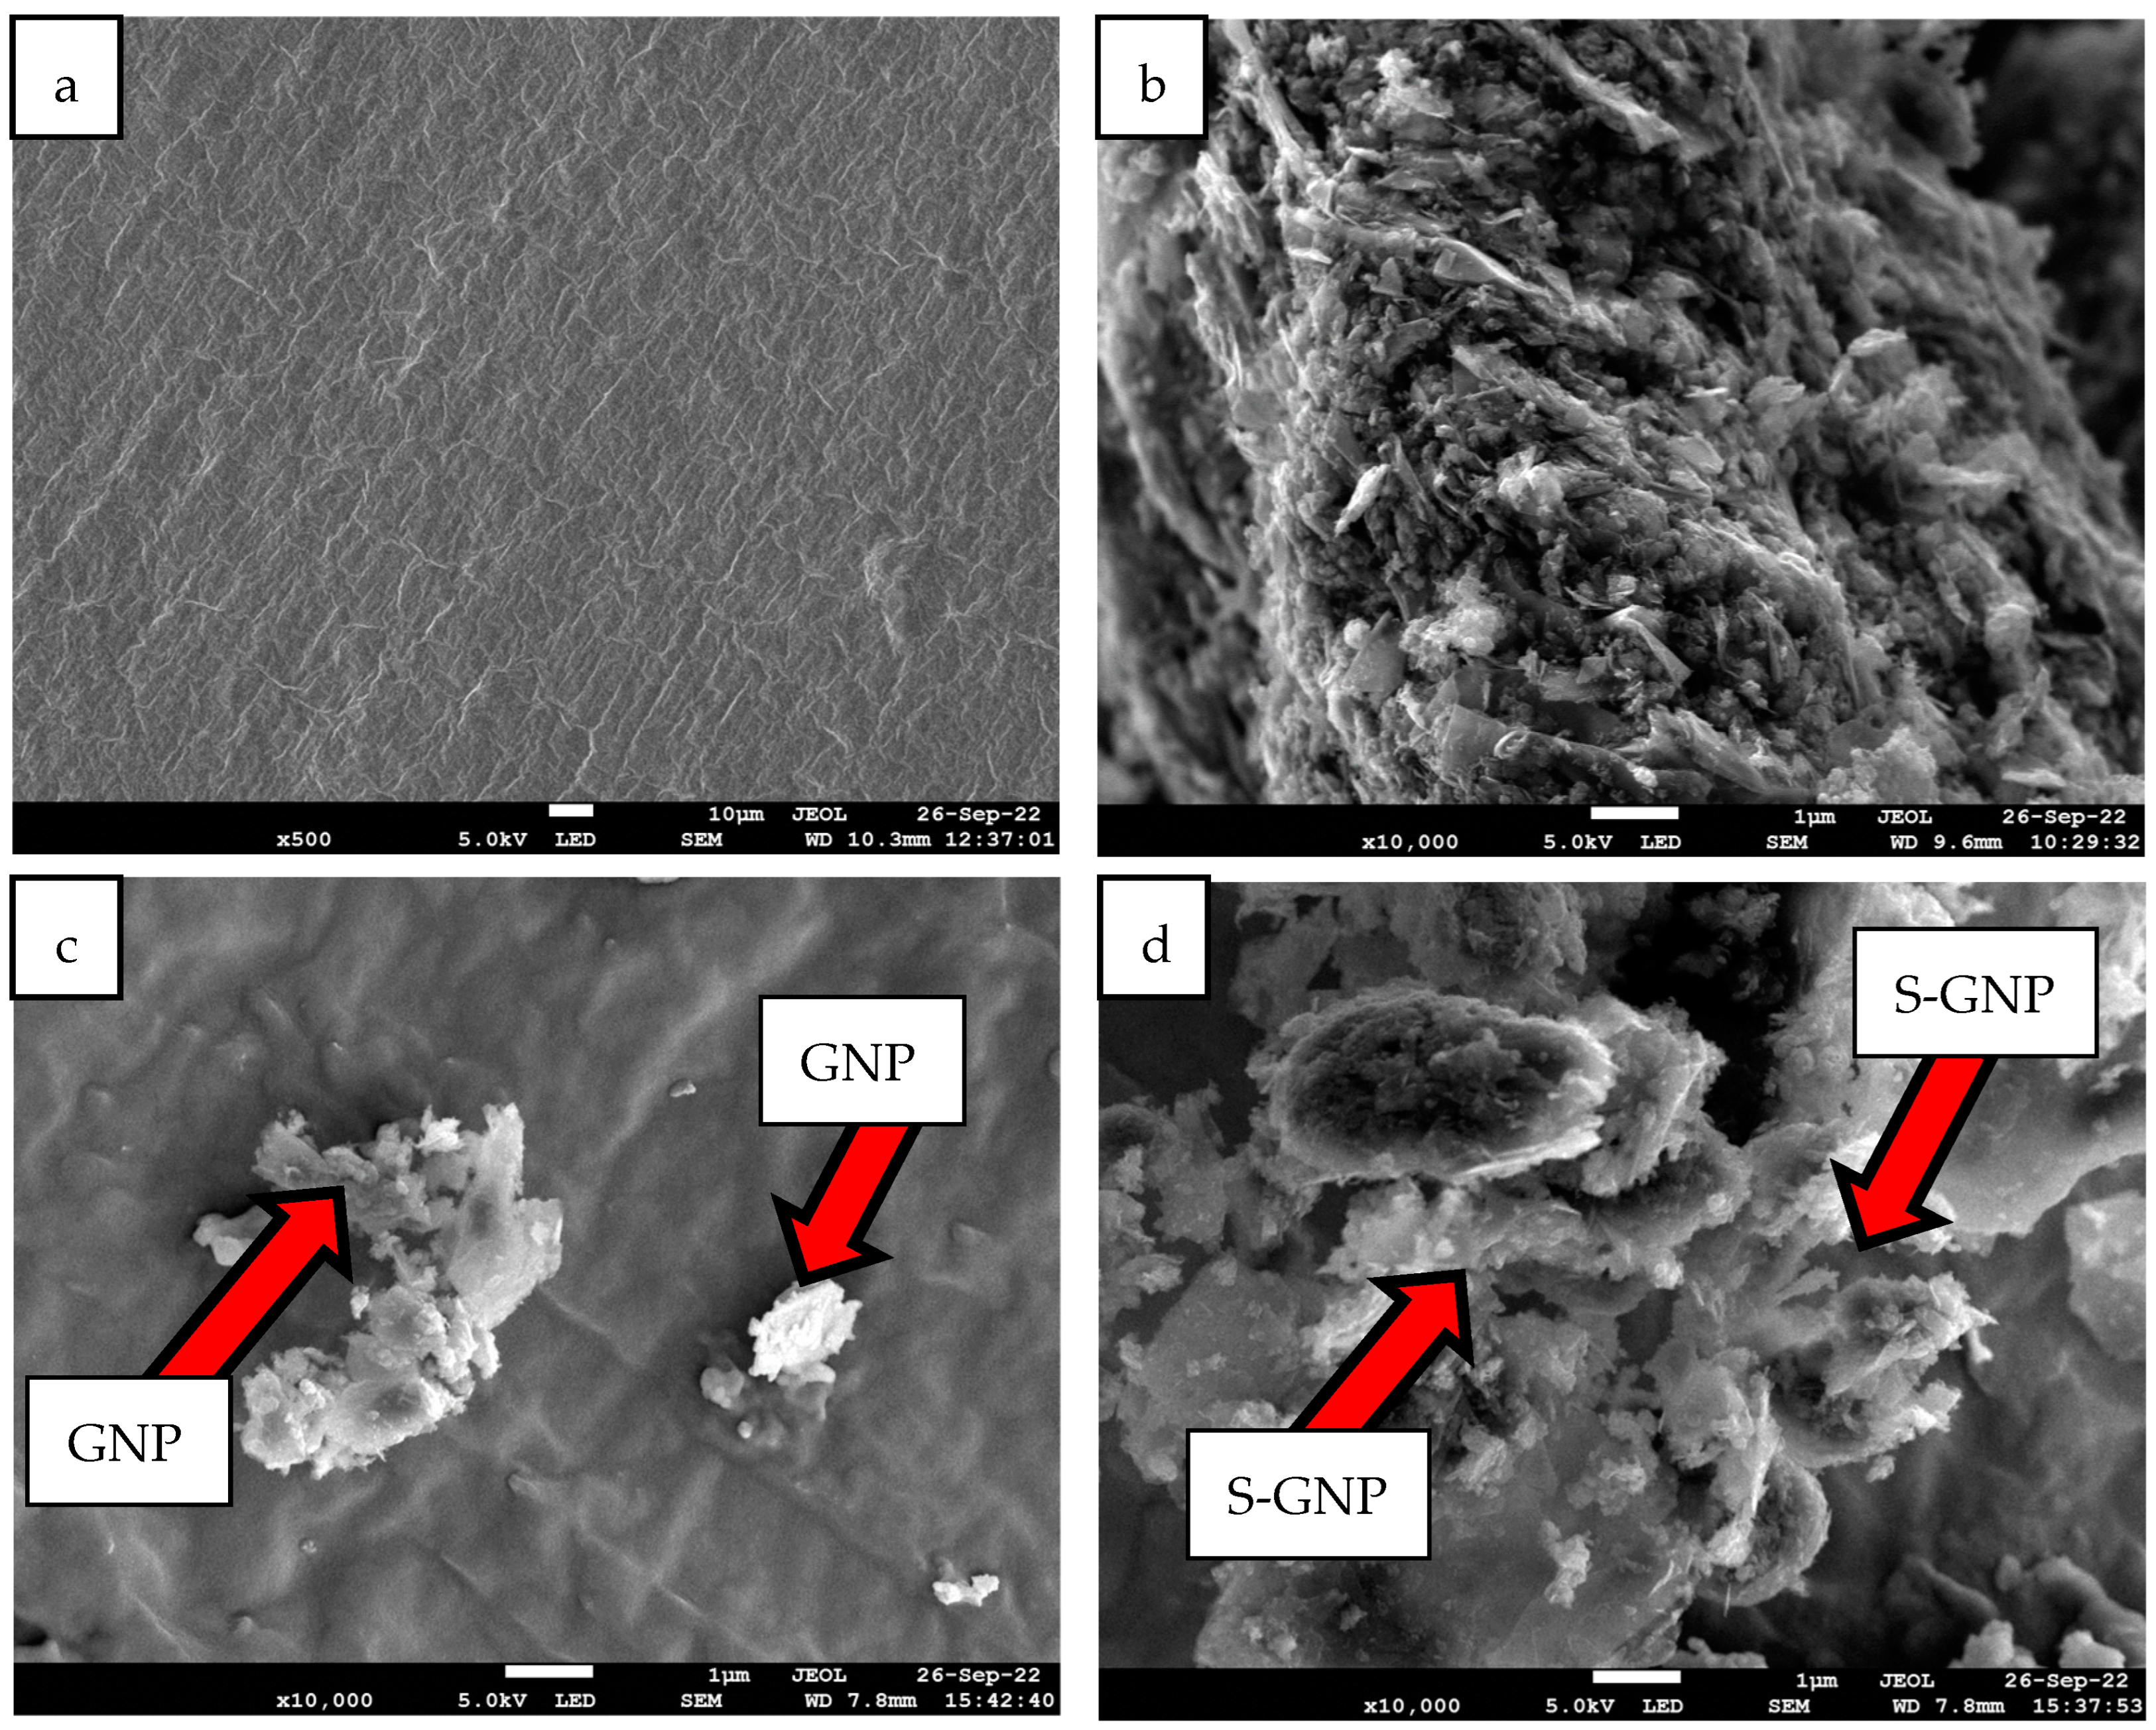
3.1. Morphology of Nanoparticles and NePCM

Figure 2 illustrates FESEM micrographs showcasing the distinct characteristics of pure A70, pure GNP, AG-1.0, and ASG-1.0. In Figure 2b, GNP is observed to exist in the form of two-dimensional plates with varying sizes. Notably, pure GNP, obtained directly from the manufacturer, appears stacked together. However, when incorporated into the PCM, GNP is broken down into smaller fragments evenly dispersed within the material, although some aggregates are visible, as shown in Figure 2c. ASG-1.0 exhibits a homogenous distribution of GNP with surfactant within A70, as evident in Figure 2d. This uniform dispersion of GNP in the base A70 can be attributed to the occurrence of SDBS as the capping agent, enhancing the compactness of the composite. No agglomeration is observed on the A70 surface, signifying even nanoparticle dissemination. This homogeneity creates a heat transfer network, providing efficient pathways for heat conduction throughout the NePCM.
Figure 3 depicts the optical images of an aqueous solution containing GNP and GNP with surfactant (0.1 wt%) in PLUSICE A70, following a 2 h ultrasonic treatment and settling on a hot plate for 1 day. In Figure 3a,b, the AG composite tends to agglomerate at the container’s bottom, causing partial diffraction of infrared rays within the liquid A70. This sedimentation could ultimately impact the composite’s thermophysical properties due to a non-homogeneous double layer within the A70. An infrared laser is utilized to detect diffraction in red light rays from the GNP dispersion, revealing a Tyndall effect in the colloidal dispersion of “black” carbon materials. This effect indicates non-homogeneity in the GNP colloidal dispersion, likely stemming from hydrophobic groups on the carbon nanoparticles’ surface.
Conversely, Figure 3c,d illustrate the homogeneous mixing of GNP and PLUSICE A70, even at low mass fraction loadings (0.1 wt%), facilitated by SDBS as a surfactant in the composite. These components are rapidly and continuously distributed in the mixed solution. The ASG-0.1 composite considerably impedes the passage of visible and infrared rays compared to AG-0.1.

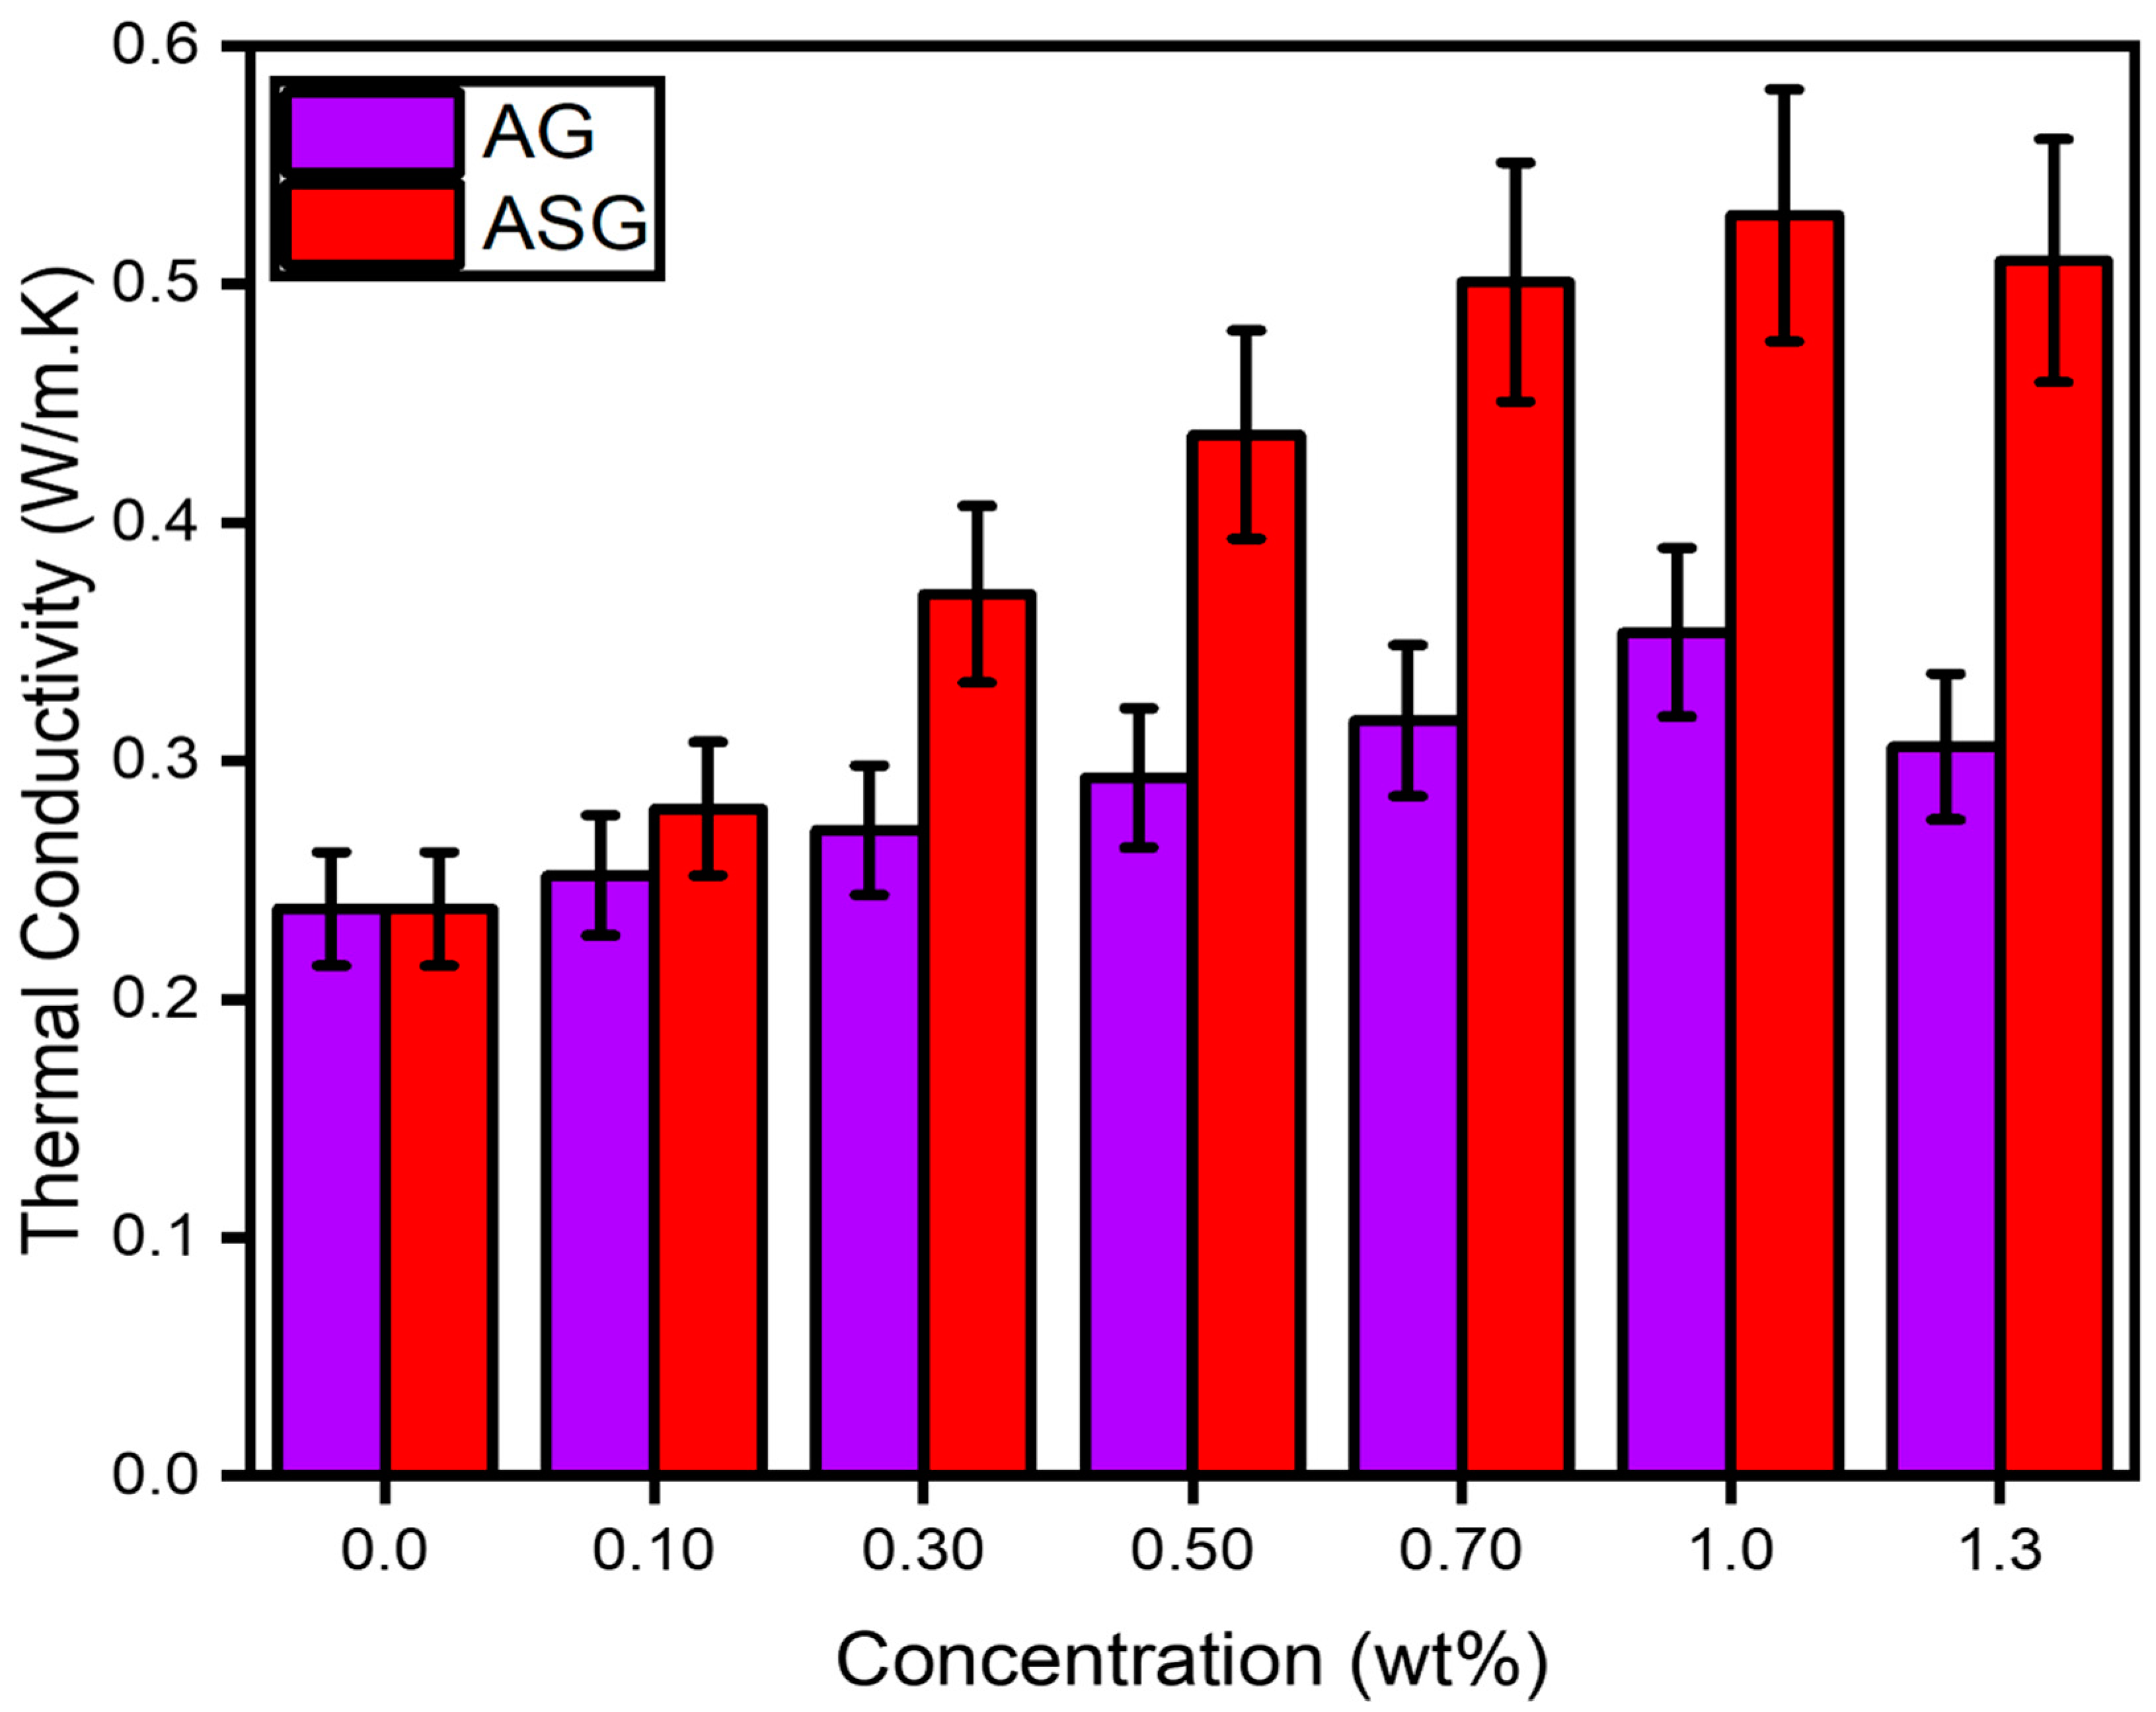
3.2. Thermal Conductivity

The thermal conductivity of NePCMs is significantly influenced by the degree of nanoparticle dispersion within the PCMs. Effective dispersion of the nanoparticles required stirring and ultrasonic agitation for a specific duration. The thermal conductivity of the composites was tested at room temperature with a 10% margin of error using a thermal analyzer (SH-03, METER). Figure 4 illustrates the thermal conductivity values of AG and ASG composites at varying concentrations. The conductivity escalated from 0.238 to 0.354 Wm−1K−1 when treated with concentration ranges from 0.1 to 1.0. Furthermore, ASG-0.1, ASG-0.3, ASG-0.5, ASG-0.7, and ASG-1.0 composites’ conductivities were enhanced from 0.238 to 0.280, 0.370, 0.437, 0.501, and 0.529 Wm−1K−1, respectively.
Compared to AG-1.0, the most significant increase in thermal conductivity is 48.83% relative to pure A70. Several factors may have contributed to this enhancement, which are explored in the following section. Two mechanisms can be employed to facilitate heat transfer within a material: phonon transport and electron transport. In electron transport, the kinetic energy of free electrons is amplified by their thermal energy. Still, this energy dissipates as it moves from high-energy to low-energy regions in the material.
In contrast, phonon transport relies on phonon or lattice vibration to transfer energy. The mean free path of phonons, the distance they travel from high-energy to low-energy regions, governs heat conduction in a material. Three processes can shorten phonon mean free paths: phonon–phonon scattering, phonon–boundary scattering, and phonon–impurity scattering. One of the processes typically limits heat conductivity due to an increase in the length of the thermal pathway [23]. Adding GNP enhances the phonon transport mechanism inside the sample, potentially accounting for the increased heat conductivity of the sample. At low nanoparticle concentrations, interactions between nanoparticles are minimized, reducing the mean free path of phonons through phonon–boundary scattering. Conversely, when the weight fraction of nanoparticles increases, the continuous thermal channel or network within the sample expands. This expansion occurs due to the link between two or more nanoparticles, leading to an augmentation in thermal conductivity [24]. The correlation between samples’ thermal conductivity and nanoparticles’ concentration is linear.
Including SDBS as a surfactant enhanced the conductivity of ASG at the same concentration as AG without a surfactant; these findings can be compared to the thermal conductivity data for ASG and AG composites. The increase in thermal conductivity in ASG was attributed to homogeneous mixing, while NP aggregation in AG led to a decrease. The primary reason for the reduction in thermal conductivity was nanoparticle aggregation, which disrupted the thermal network as nanoparticle concentration increased. The most significant increase observed was 122.26% for ASG-1.0, whereas only 48.83% for AG-1.0. For ASG-1.3, thermal conductivity decreased, indicating that the surfactant did not fully emulsify specific nanoparticles, leading to their agglomeration and settling as sediment at the bottom of the mixture. This observation is consistent with the literature, which suggests that non-covalent surface modifications may not significantly affect the overall behavior of nanoparticles. It is important to note that including SDBS enhanced the intermolecular free mobility of particles, rendering the NePCM more stable than GNPs and resulting in increased thermal conductivity. After analyzing this data for maximum thermal conductivity, the composite is undergoing further testing to evaluate the remaining thermophysical properties from AG-0.1 until AG-1.0 and ASG-0.1 until ASG-1.0.

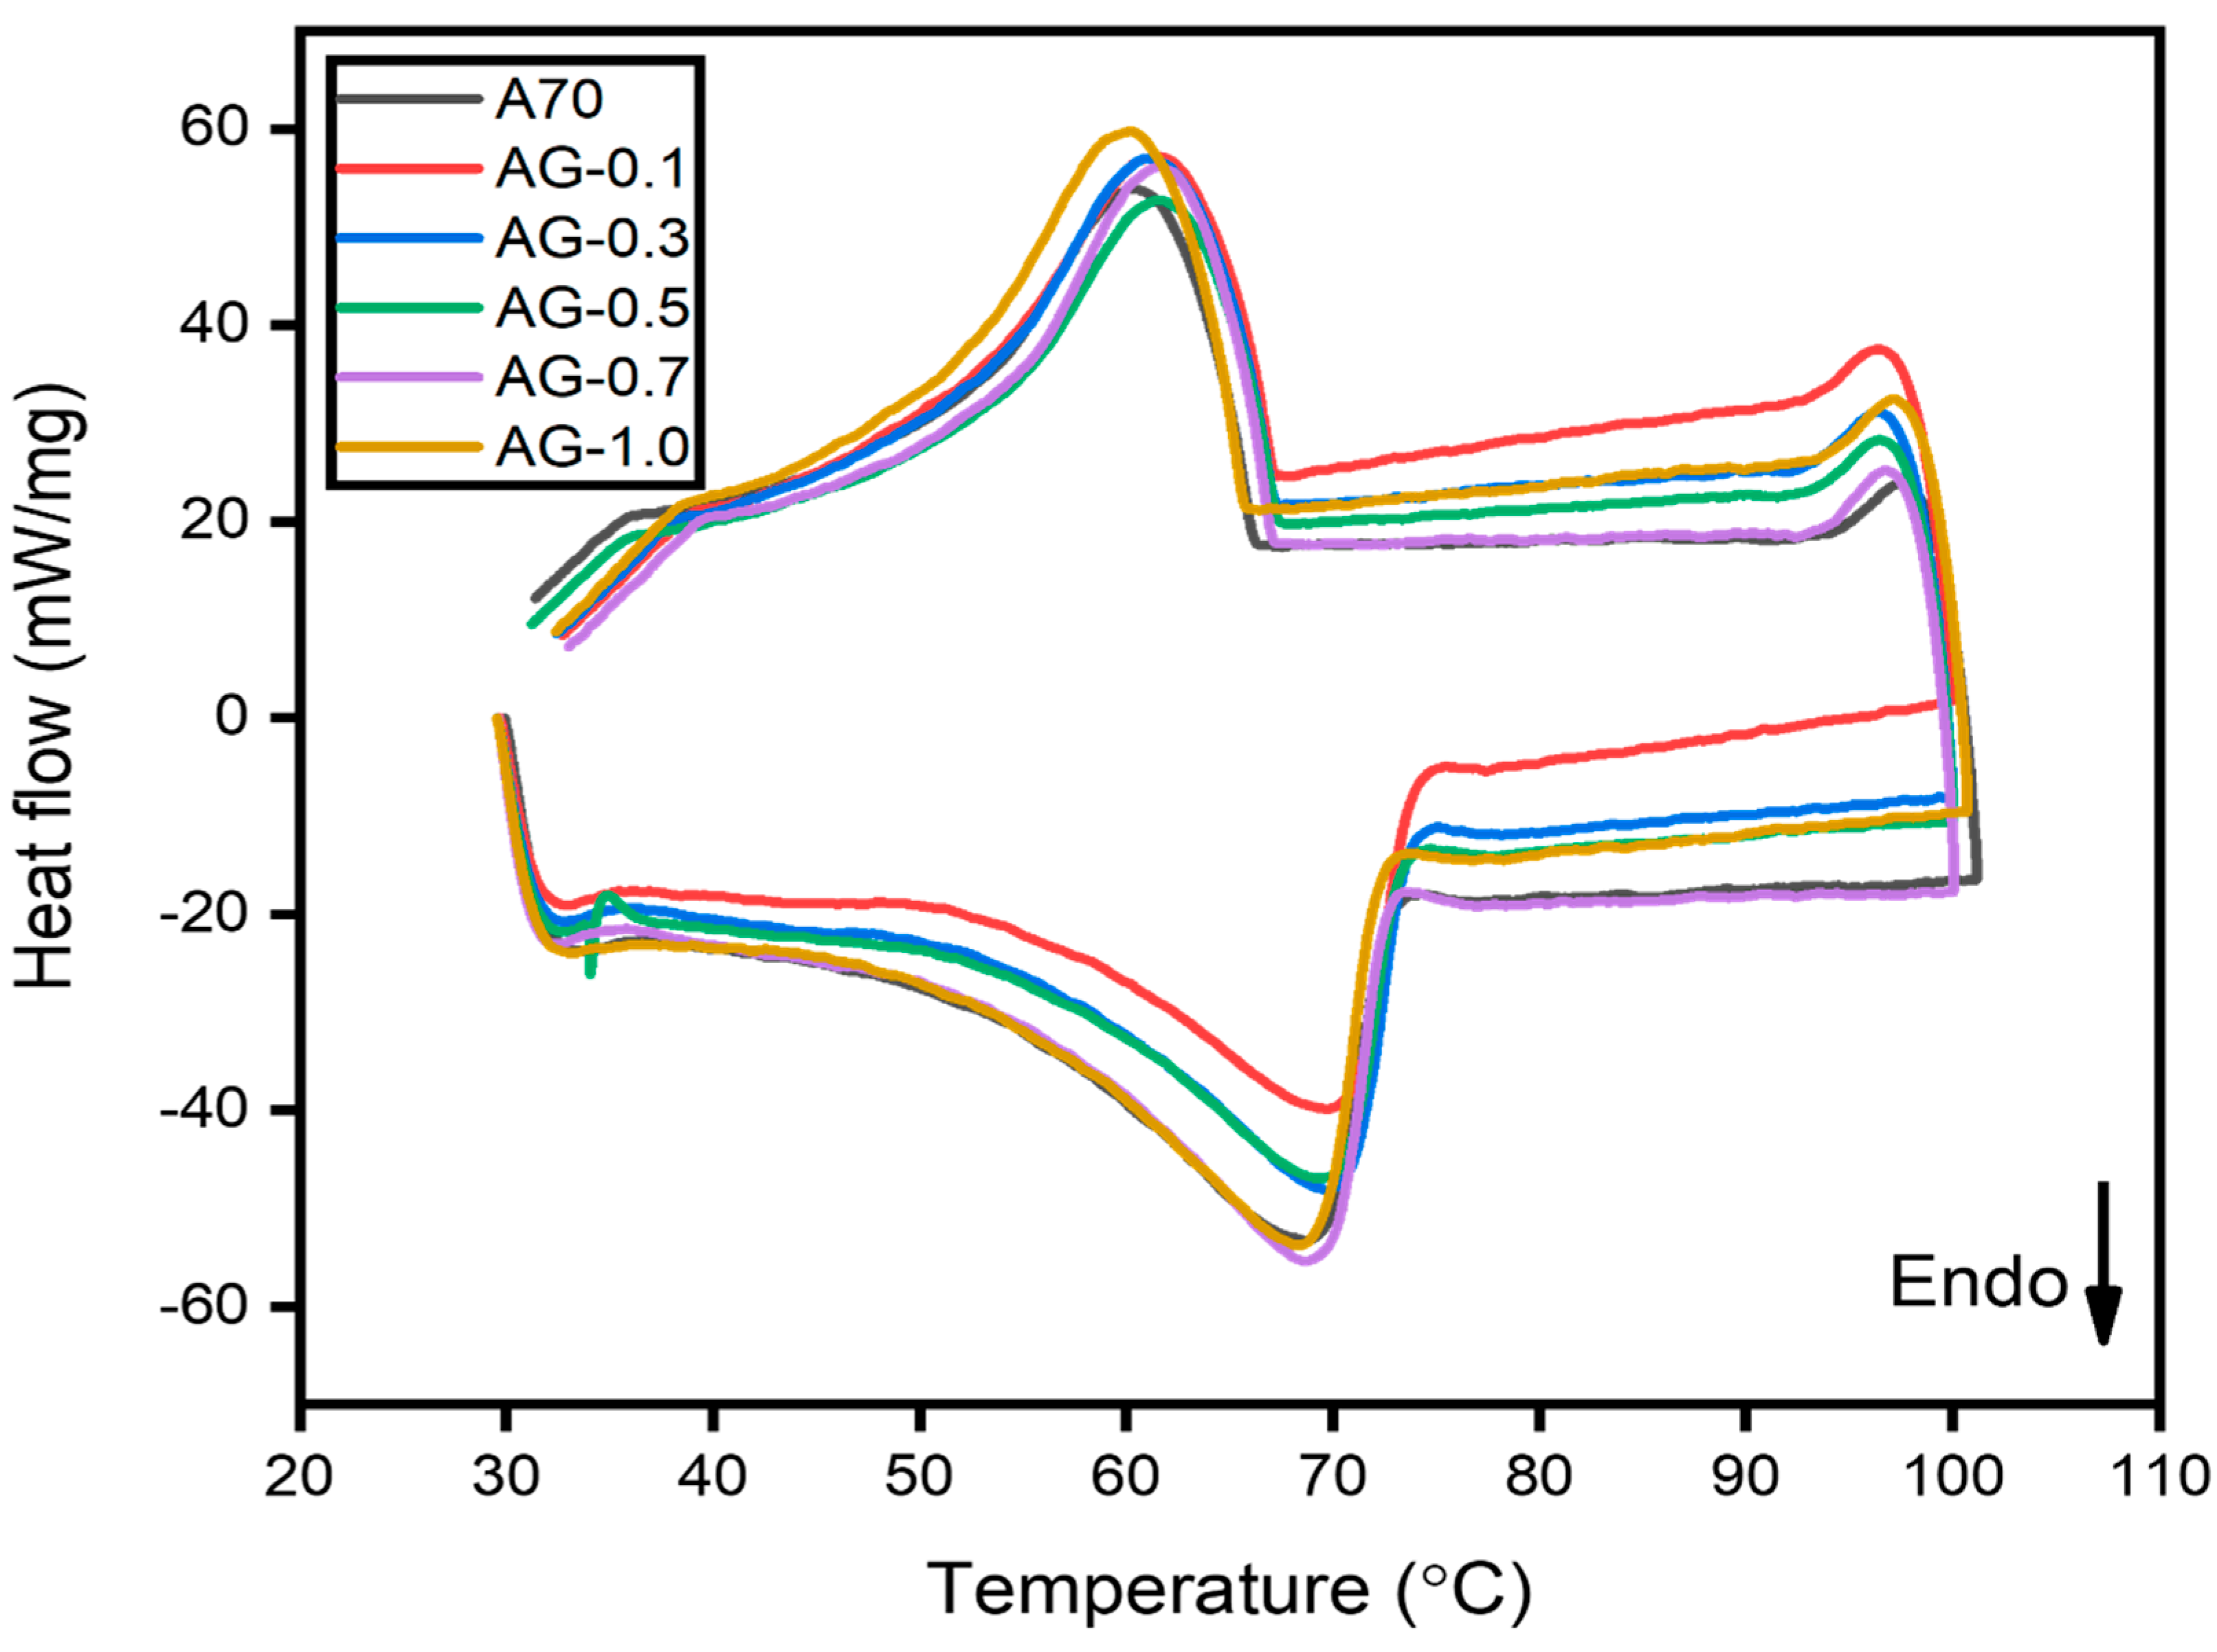
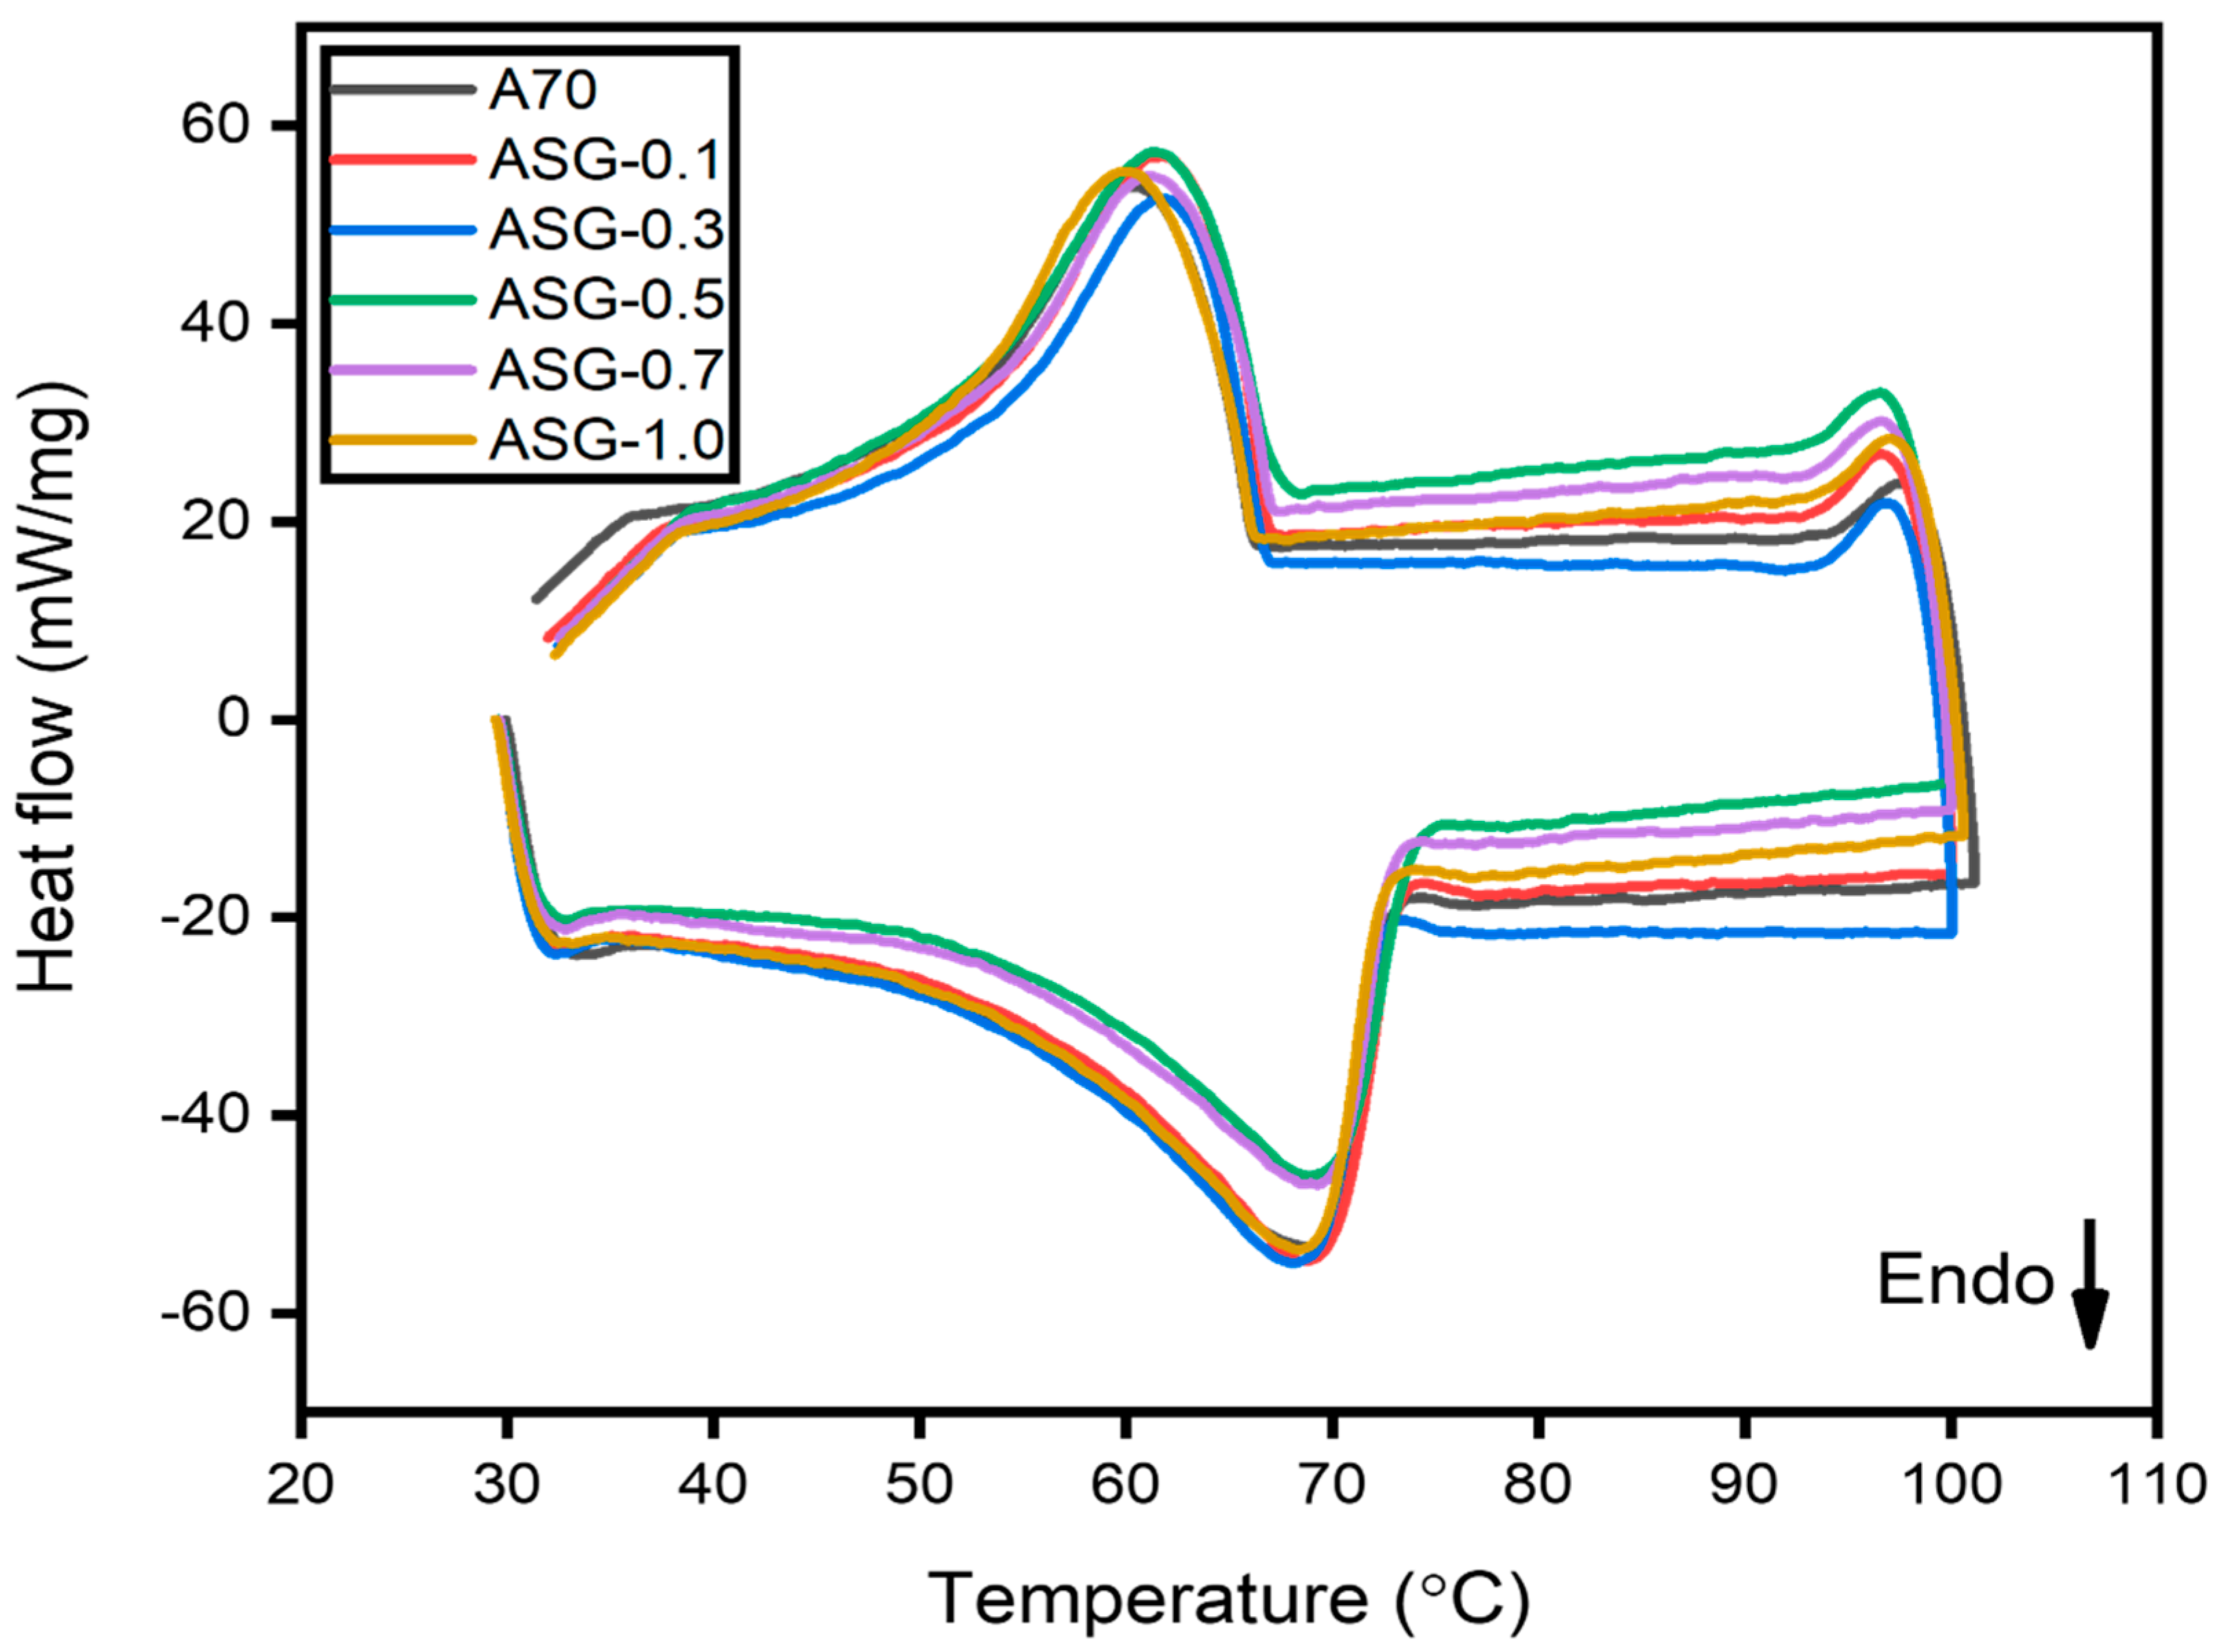
3.3. Latent Heat and Phase Change Temperature

As depicted in Figure 5, DSC analysis was employed to assess the impact of GNP particle presence on the thermophysical properties of A70 PCM—precisely, the phase transition temperature and LH. The minor left peak signifies the solid–solid phase transition in each DSC curve, while the primary peaks correspond to the solid–liquid phase change or melting [25]. The pure PCM displayed an LH capacity of 170.49 J/g and a melting temperature of 68.20 °C. Figure 5 illustrates a slight downward shift in the phase change peaks by introducing GNPs to A70. Consequently, the addition of AG-1.0 led to an 8.27 kJ/kg reduction in latent heat compared to pure A70, as shown in Table 2.
This phenomenon finds its explanation in the context of the second law of thermodynamics as expressed by the equations ( H = U + P V ,   U = T S P V ) [26]. Introducing nanoparticles with PCM leads to entropy (∆S > 0) augmentation due to the increased disorder within the mixture. Consequently, the system’s internal energy experiences an increment given that the first term (T∆S) in the equation is larger than the multiplication of pressure and ∆V. As a result, the system’s enthalpy rises following the equation ∆H = ∆U + V∆P. However, as the nanoparticle concentration increases, the second component (P∆V) in the internal energy term exceeds the magnitude of the first term (T∆S). This results in a decrease in the system’s internal energy as the fraction of nanoparticles rises. Consequently, the enthalpy of the system decreases in tandem with its internal energy. Therefore, as the number of nanomaterials in the mixture increases, there is a reduction in the LH of the samples, with GNPs exerting a more pronounced influence on LH.
Table 2 also illustrates that all composites had slightly higher melting temperatures than pure A70 PCM. However, the melting values of all composites were statistically indistinguishable from those of pure PCM. The observed behavior may be ascribed to the interaction between PCM and nanoparticles as well as the isotropic porous structure of carbon. Furthermore, this phenomenon might arise due to the substantial interplay between the fluid and the surface of the matrix, resulting in a modification of the melting temperature, and similar findings were reported by Hari Krishnan et al. [27]. Regarding ASG-1.0, it exhibited a reduction in latent heat of 11.709 kJ/kg compared to pure A70 and a 3.439 kJ/kg reduction in latent heat compared to AG-1.0, as shown in Figure 6. The presence of SDBS as a surfactant in PCM led to a more significant reduction in latent heat than AG composites, likely due to the high melting temperature of SDBS and the presence of SDBS’s unalterable solid phase. The same trend was observed in the phase change temperature of ASG composites. Therefore, it can be concluded that the addition of GNP, with the aid of SDBS as a surfactant in PCM, does not affect the melting point of the composite.

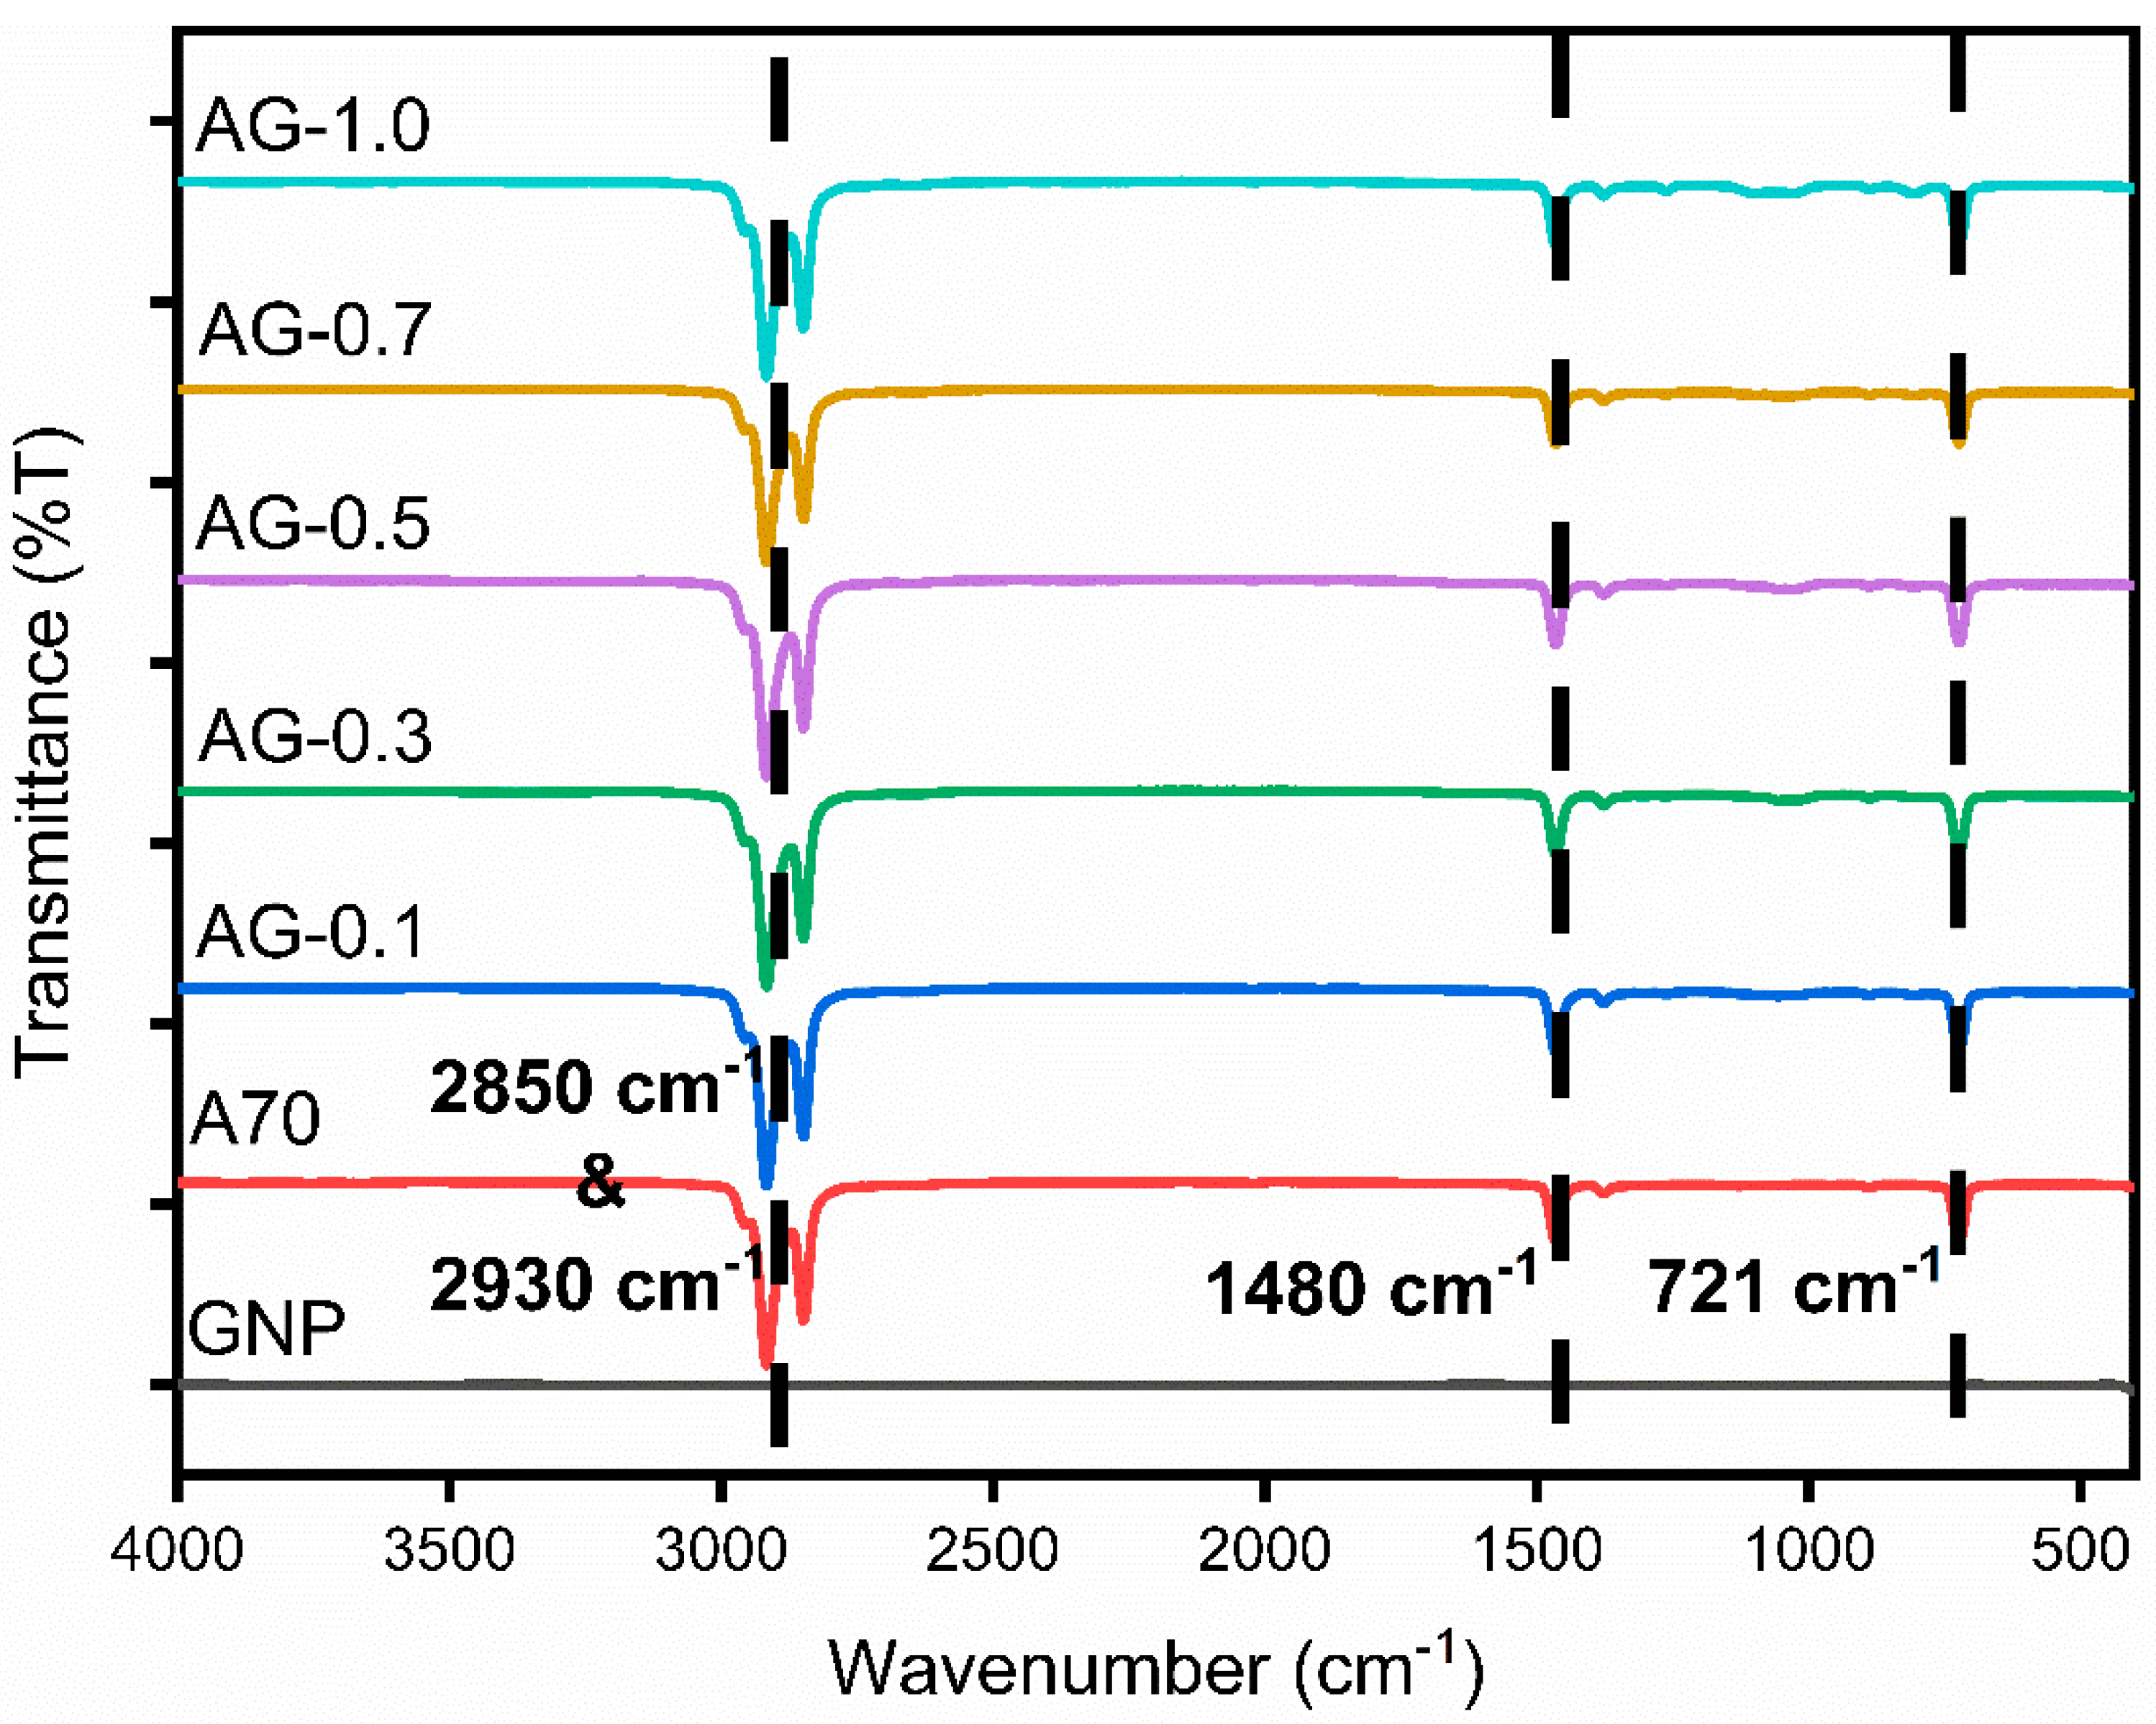
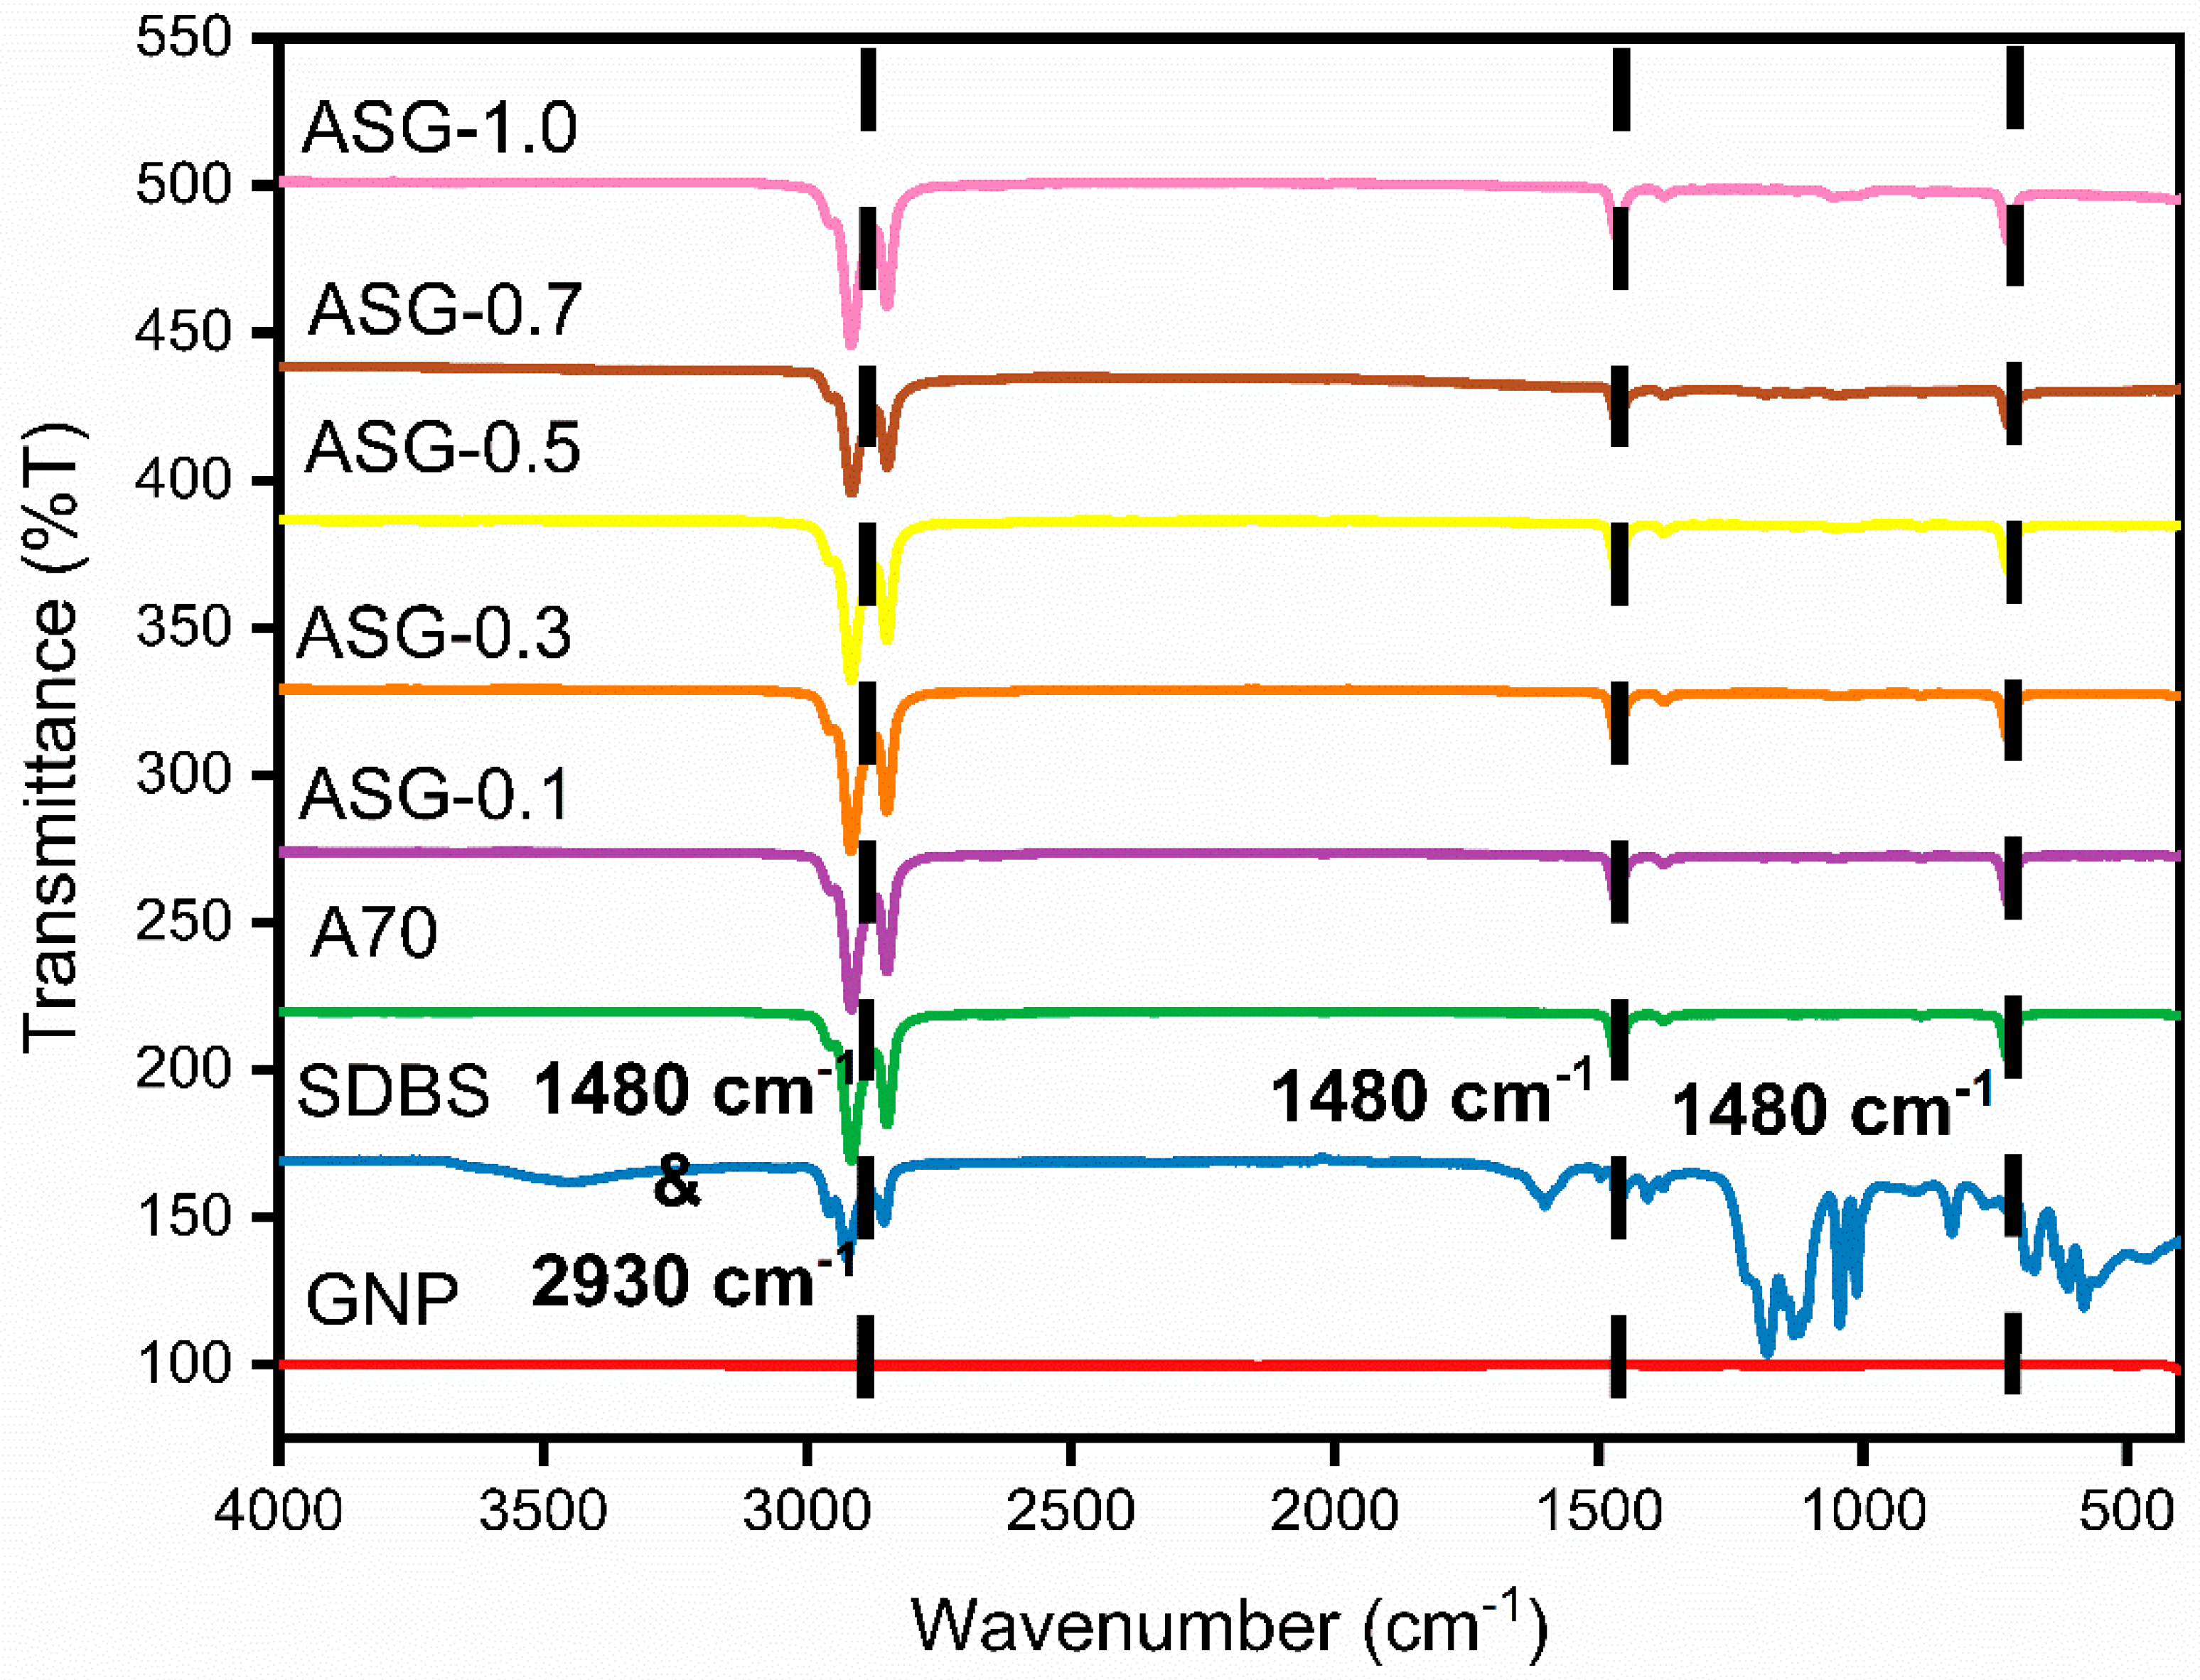
3.4. Chemical Stability

The FTIR spectrometer played a pivotal role in characterizing the composite composition of the NePCM. In Figure 7, the FTIR spectra showcase various concentrations of PLUSICE A70, GNP, and AG composites, while Figure 8 highlights the FTIR spectra of PLUSICE A70, GNP, SDBS, and ASG composites at varying concentrations. The x-axis represents wavenumbers (cm−1), denoting the samples’ functional groups. Infrared light was employed to stimulate molecular vibrations within covalent bonds, with the frequency of the selected bond being measured concurrently to identify the presence of functional groups. Absorption of electromagnetic radiation within the frequency range of 500 to 4000 cm−1 can provide insights into the presence of four distinct types of chemical bonds: namely, single-bond stretching vibrations occurring between 2500 and 4000 cm−1, triple-bond vibrations between 2000 and 2500 cm−1, double-bond vibrations between 1500 and 2000 cm−1, and a region known as the fingerprint region encompassing vibrations between 500 and 1500 cm−1. The presence of these bonds serves as an introduction of functional groups like ketones, alcohols, alkenes, and carboxylic acids—however, the region between 500 and 1500 cm−1 exhibits overlapping bands, challenging precise analysis.
Within the region context of the discussed topic, three central regions can be identified in PW. The spectral range from 719 to 725 cm−1 is correlated with the characteristic vibrations of the -CH2 moiety. Conversely, the most pronounced deformations of the -CH3 and -CH2 groups are observed within the 1350 to 1440 cm-1 spectral range. The symmetric stretching vibration of the -CH3 and -CH2 groups may be observed in the third peak, located within the spectral range of 2800 to 3000 cm−1. Analyzing the FTIR spectrum of A70, peaks at 721 cm−1 and 1480 cm−1 belong to the first and second regions, respectively, while the third region encompasses peaks at 2850 cm−1 and 2930 cm−1. AG and ASG nanocomposites do not exhibit additional peaks or shifts compared to pure A70. This indicates that the presence or absence of SDBS as a surfactant does not generate new peaks. Consequently, no chemical reactions occur during the physical mixing of nanoparticles (NPs) and SDBS with organic PCM, affirming the creation of a stable composite PCM.

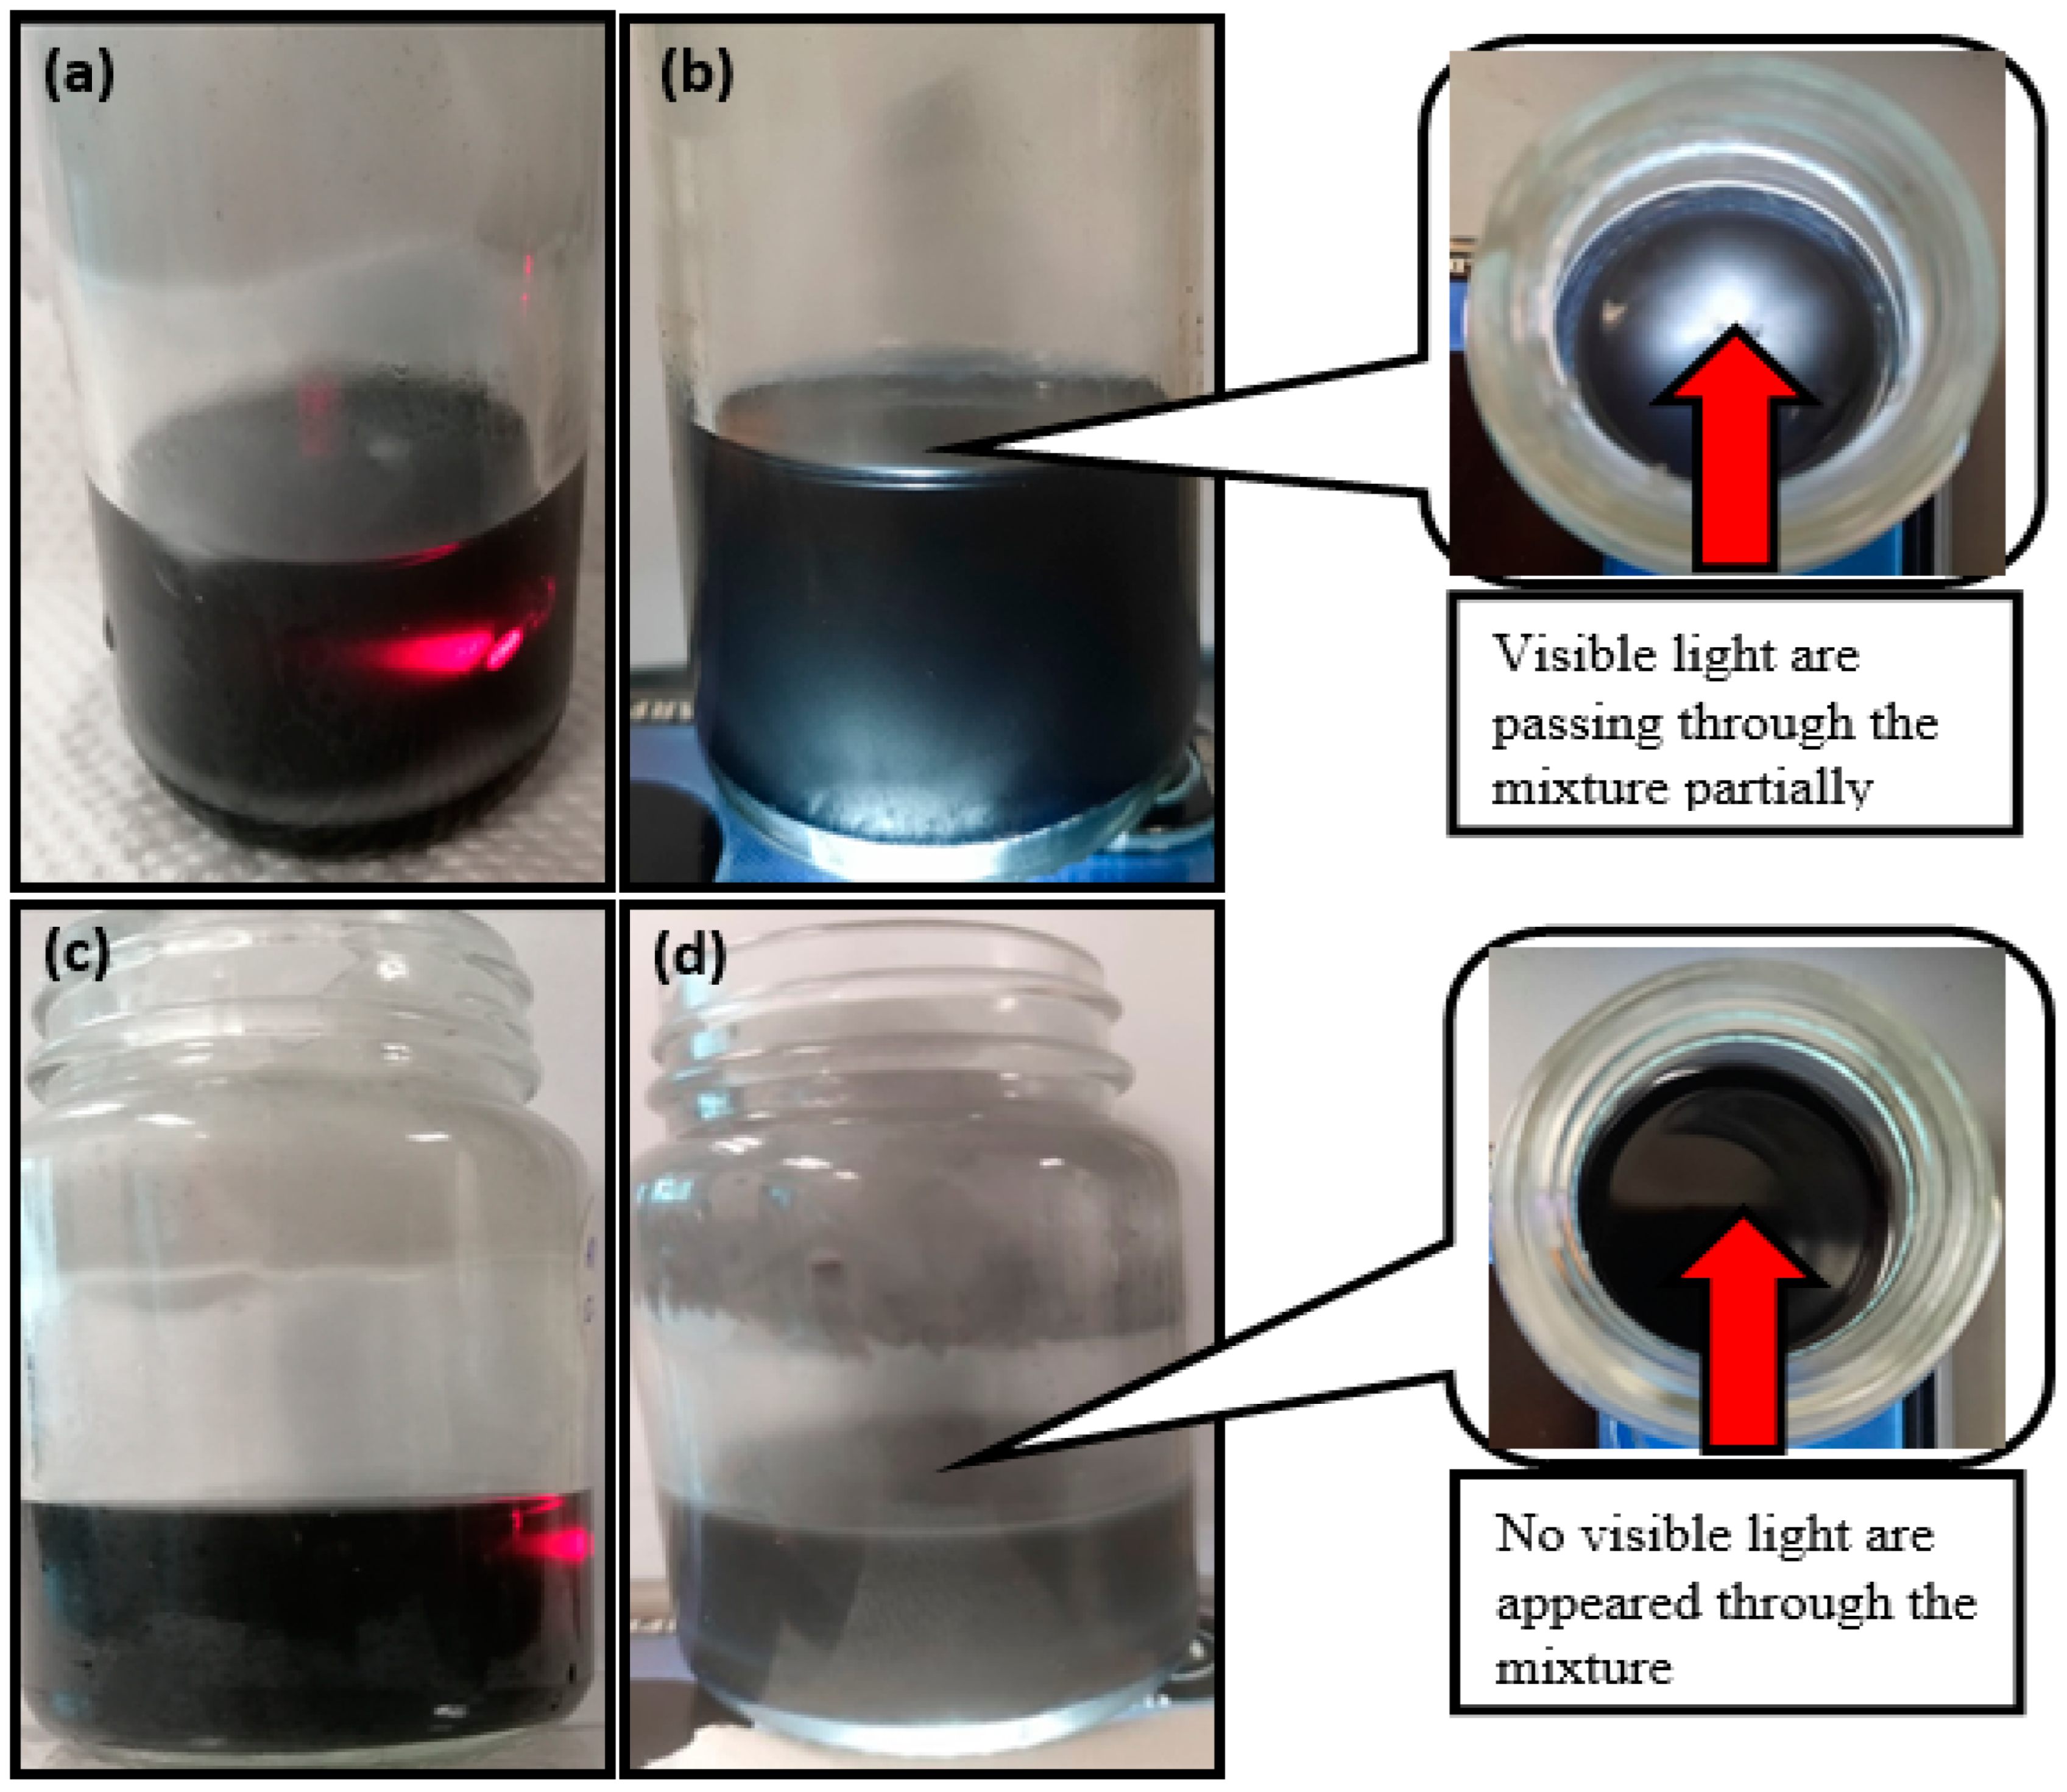
3.5. Light Transmission Capability

The transmittance of both pristine A70 and ASG nanocomposites was assessed using a UV–Vis spectrophotometer. UV–Vis spectrometer readings for GNP composites, including SDBS as a surfactant, are illustrated in Figure 9. To evaluate the results, the solar spectrum and composite sample data were compared using Gueymard’s extra-terrestrial spectrum data (Gueymard, 2004). In terms of the sun’s spectrum, the transmittance values for AG-0.1, AG-0.3, AG-0.5, AG-0.7, and AG-1.0 were found to be 36.05%, 29.54%, 26.44%, 24.33%, and 17.29%, respectively. Conversely, the transmittance values for ASG-0.1, ASG-0.3, ASG-0.5, ASG-0.7, and ASG-1.0 with respect to the sun’s spectrum were 23.45%, 18.05%, 16.98%, 11.02%, and 8.80%, respectively. Adding SDBS to PW/GNP composites resulted in a maximum reduction of 84.95% in the transmittance of the ASG-1.0 composite compared to A70 PCM. Based on the data, it was found that pure PCM exhibited the highest transmittance among all the samples studied, with a transmittance of 58.44%. Lower transmittance values indicate a higher likelihood of light absorption. Consequently, the produced composites displayed higher absorbance than A70, making them attractive for various thermal energy storage systems, especially those involving direct solar thermal applications.

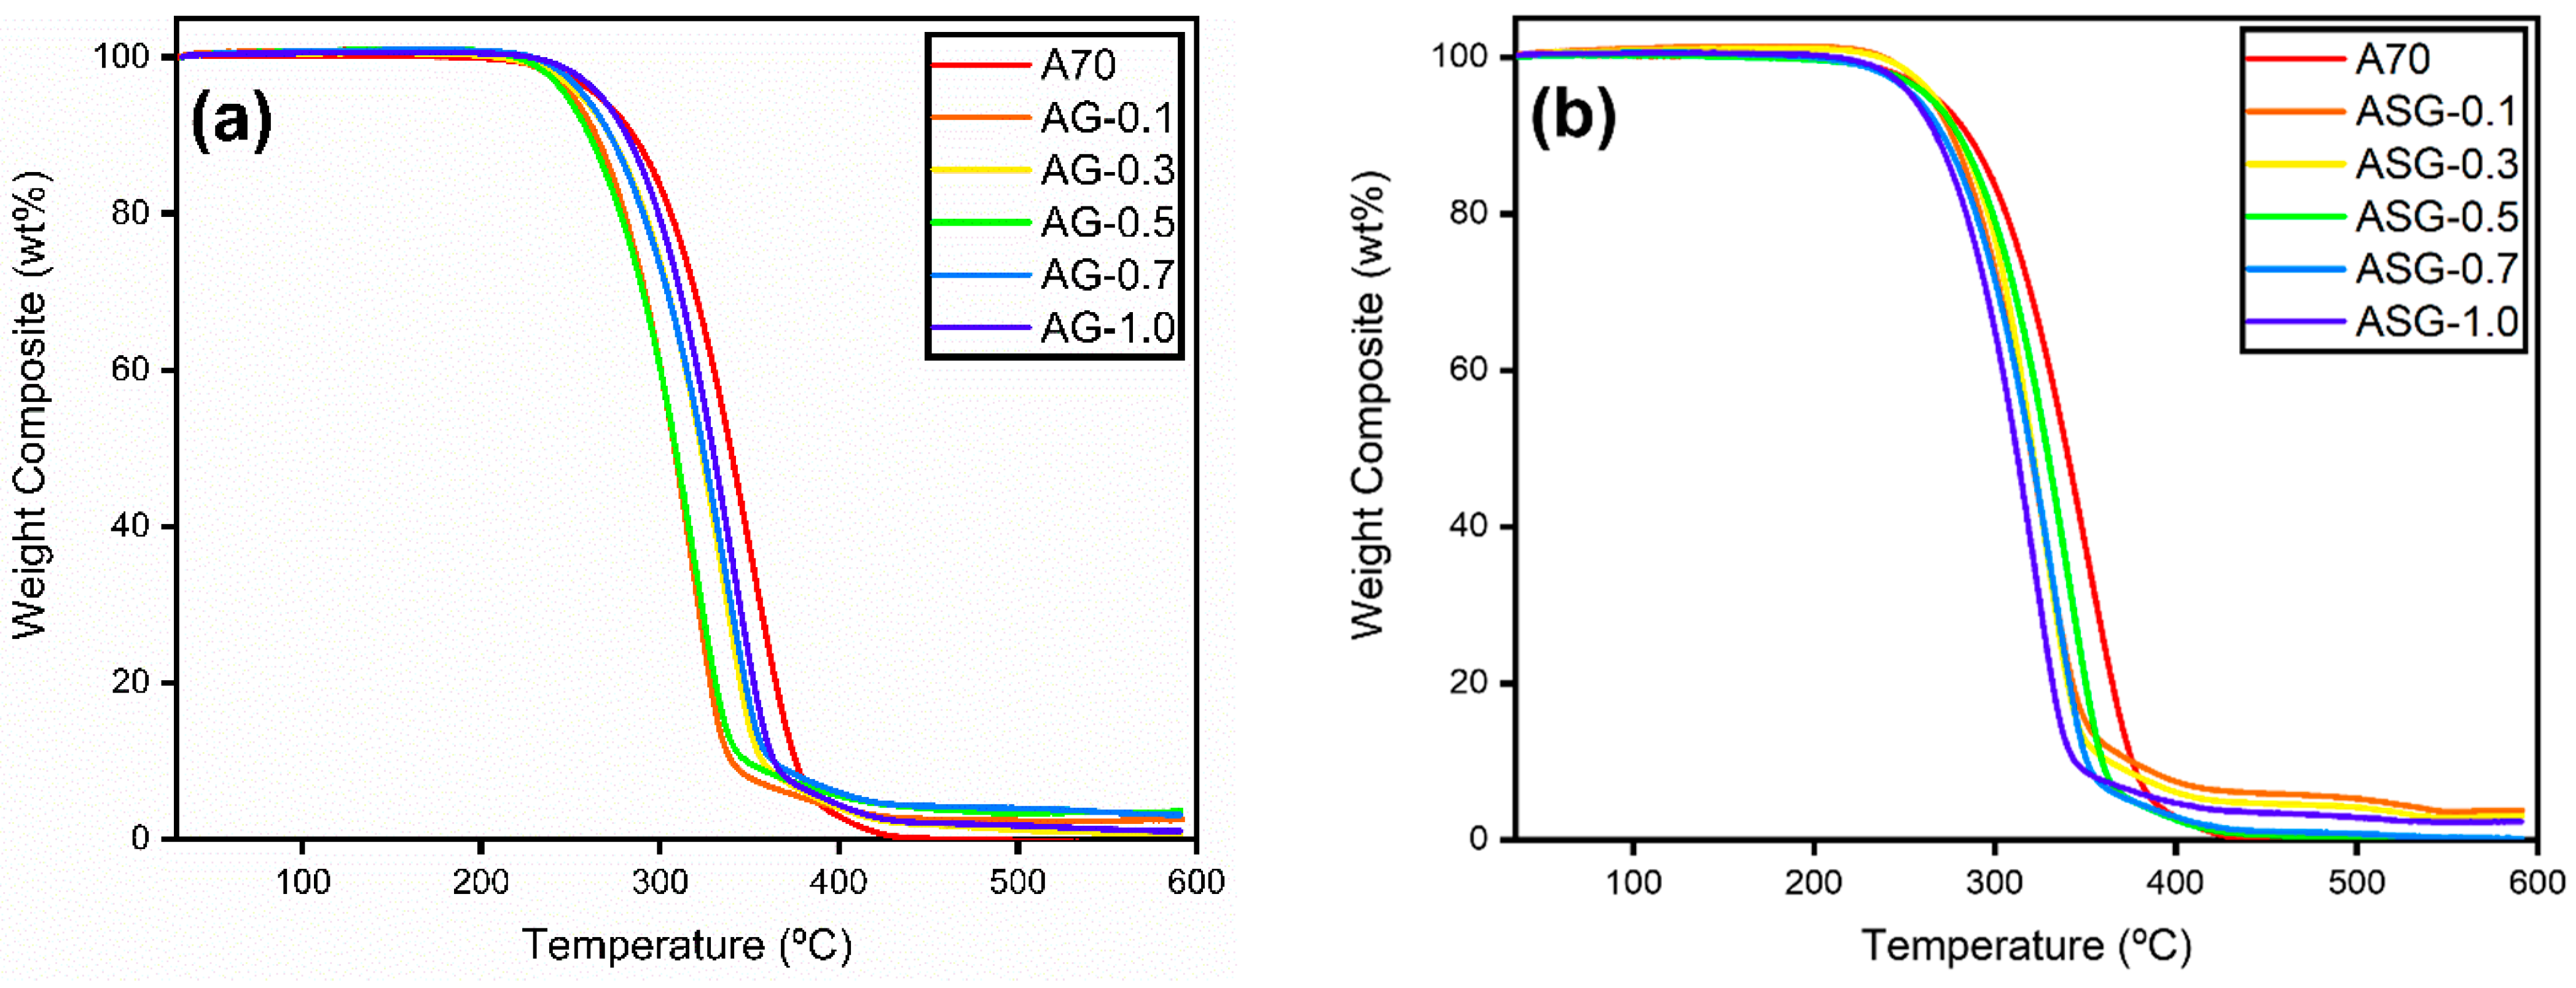
3.6. Thermal Stability

The thermal stability of the prepared samples was assessed by constructing a graph that depicts the relationship between the percentage of weight loss and temperature utilizing a TGA-4000 Perkin Elmer. Figure 10 displays the rate of weight loss due to heating for AG and ASG composites. The onset of decomposition, when 5% of the sample’s weight has been lost, was used to assess thermal stability. The stability parameters can be determined by calculating the maximum decomposition temperature based on each composite’s most significant derivative weight change and analyzing the final decomposition temperature using the remaining 5% of the sample’s weight. The temperatures at which A70, AG, and ASG composites decompose are reported in Table 3.
The results indicate that the start of degradation temperature for the ASG sample is higher than that for AG composites. As discussed in the effect of surfactant on formulated PW/SGNP, the presence of oxygen to oxygen-free vacancy is believed to enhance the thermal barrier during thermal excitation in nanoparticles, thereby increasing thermal stability [28]. While the decrease in all decomposition temperatures was acceptable since it remained above the phase transition temperature range for TES, it did lower the safe operating temperature limits for using NePCM composites. For concentrations ranging from 0.1 to 1.0 wt%, no noticeable weight loss was observed in any of the composites from 30 °C to 200 °C. Therefore, the A70/GNP nanocomposite with surfactant exhibited remarkable thermal stability below 200 °C, significantly higher than the melting point of PLUSICE A70 (70 °C).

3.7. Thermal Cycle Test NePCMs for 1000 Cycles

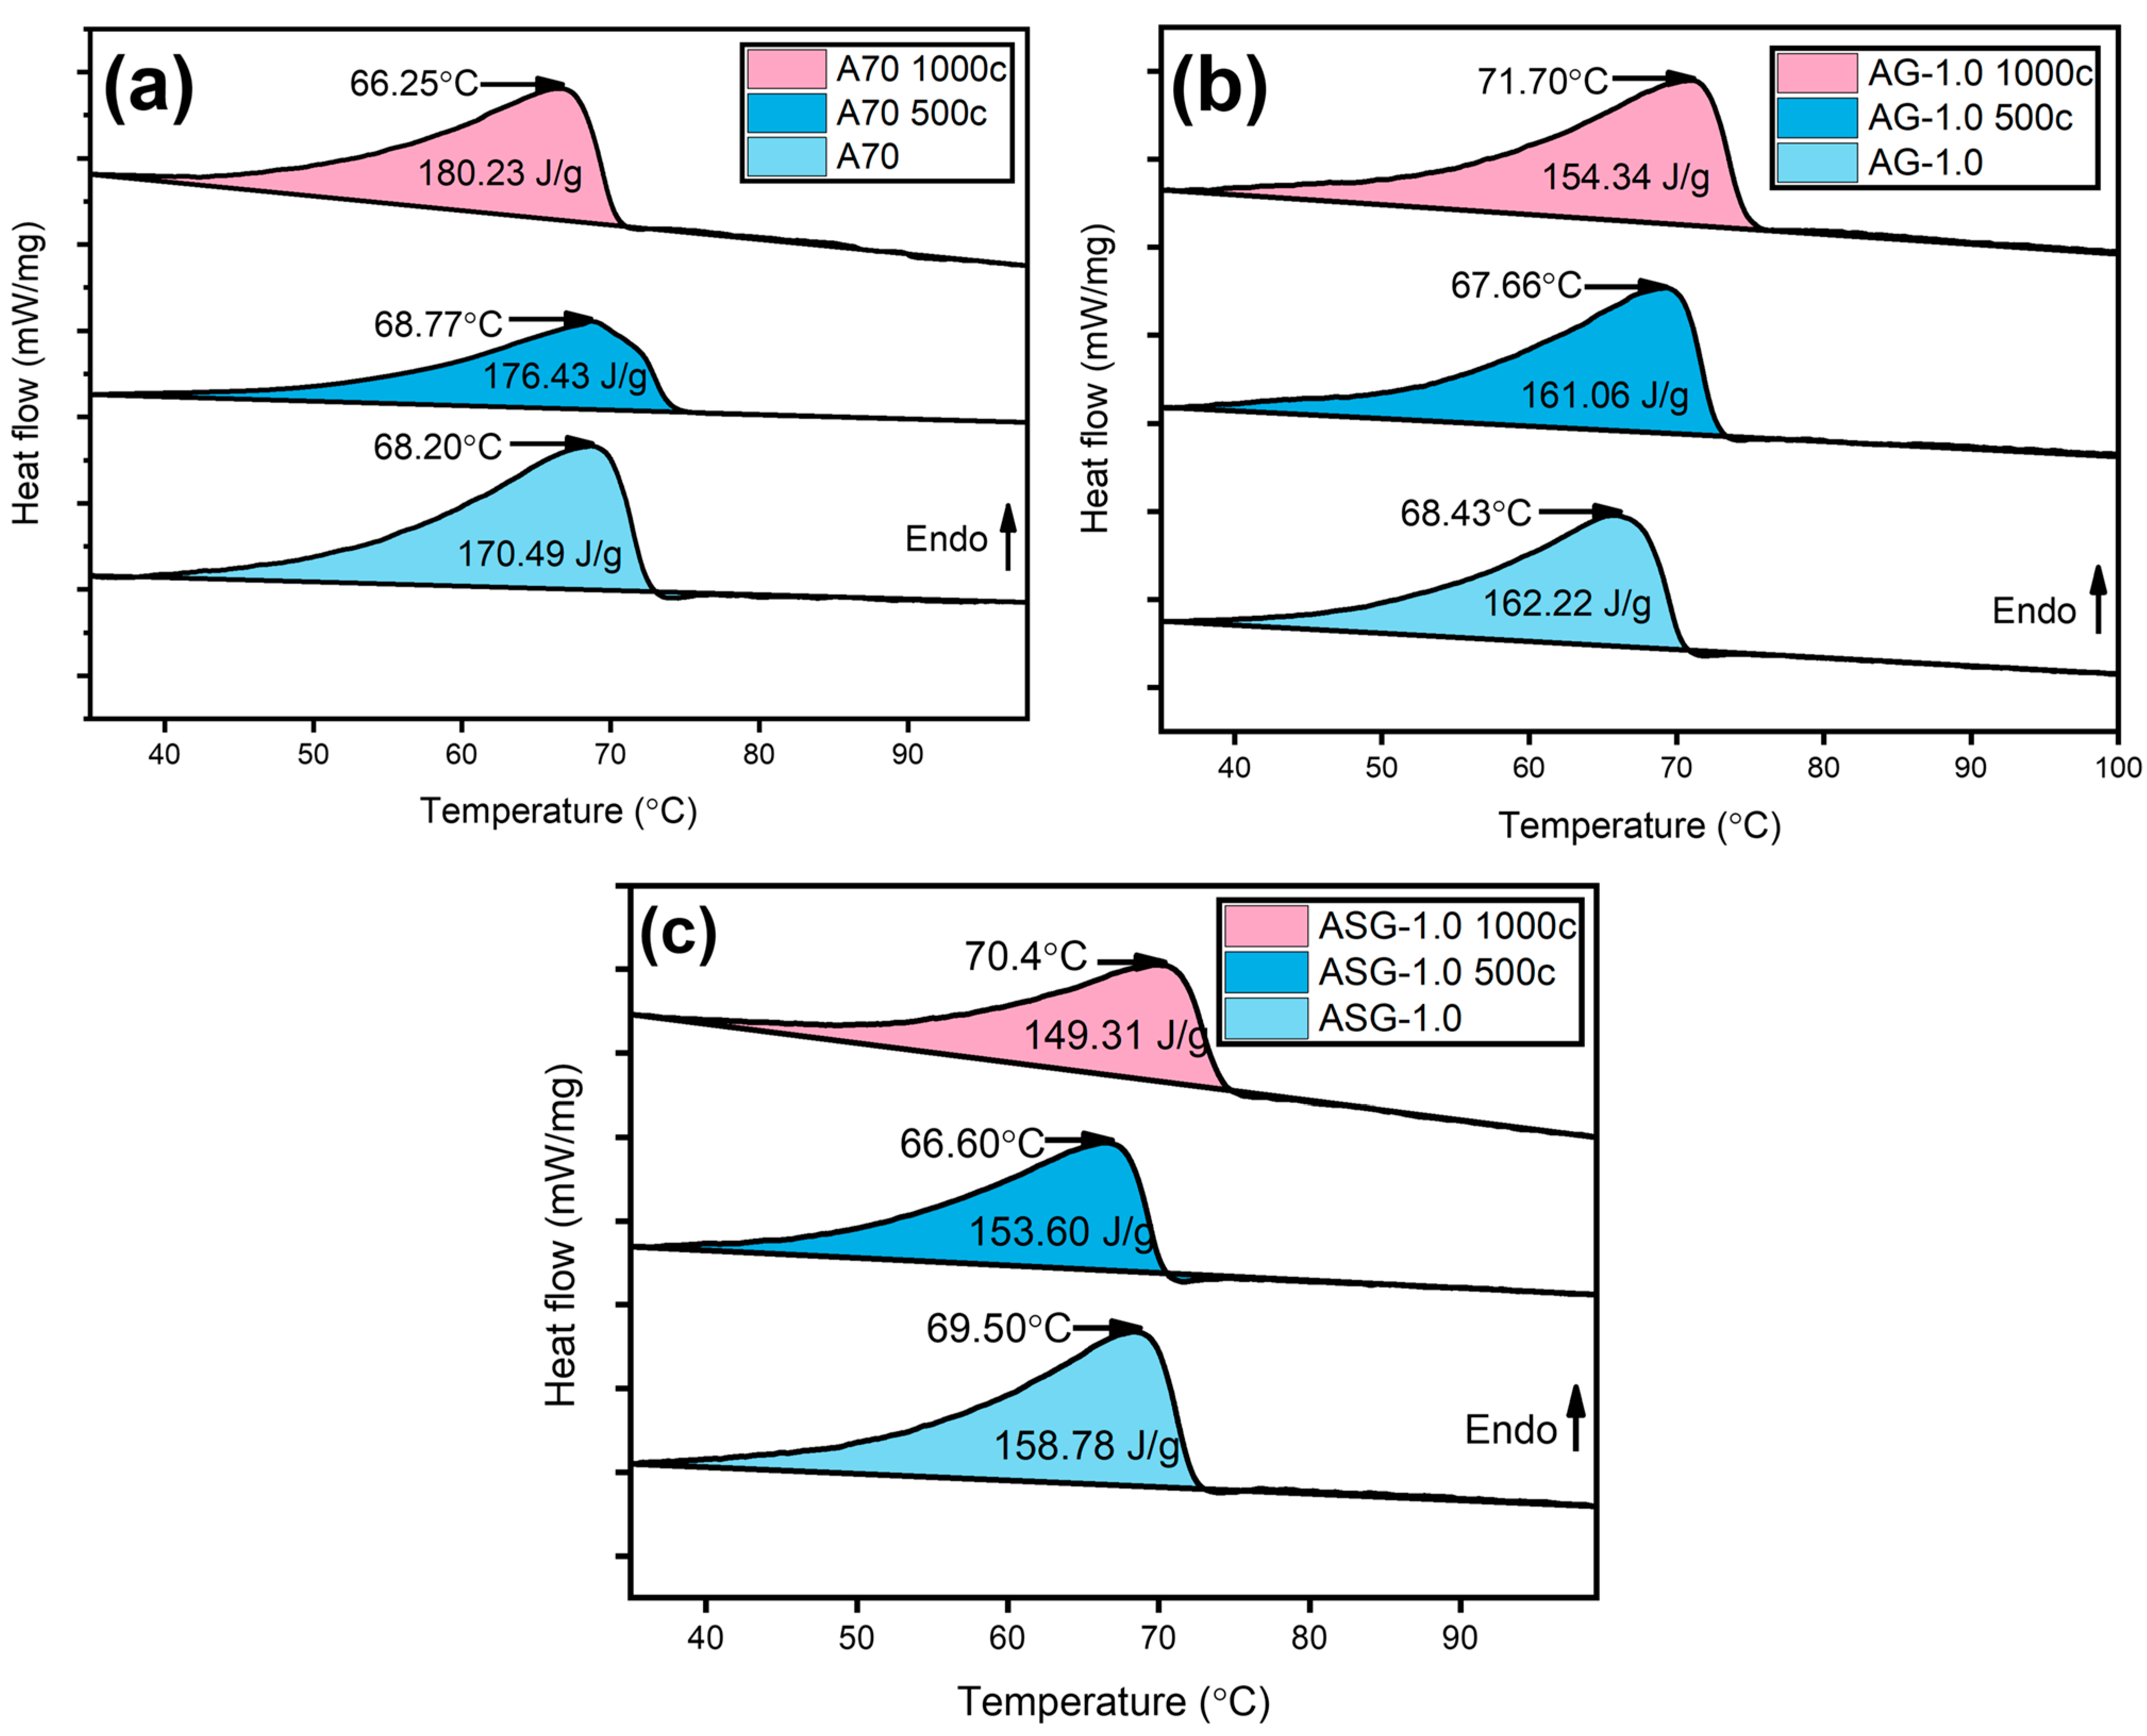
3.7.1. Latent Heat and Phase Transition Temperature of NePCMs after 500 and 1000 Cycles

Table 4 displays the latent heat values and melting temperatures of AG and ASG composites. Figure 11 illustrates a DSC graph comparing A70, AG-1.0, and ASG-1.0 nanocomposites before and after 1000 thermal cycles. Under 0 cycles, pure A70 exhibited a melting point of 68.20 °C and an LH of 170.490 kJ/kg. The existence of nanomaterials, which affects the material’s characteristics, led to slightly lower latent heat and melting temperature values in all NePCMs than pure PCM, as discussed earlier.
After undergoing 1000 thermal cycles, A70 showed an increase in LH, while all composites experienced a reduction. The rearrangement of molecules within the PCM composites during heating and cooling cycles can cause the solid–solid transition zone to disappear, increasing LH. On the composite side, the decrease in latent heat measured after 1000 heat cycles may be attributed to particle agglomeration due to repeated phase shifts. The melting point increased after undergoing a thousand cycles of heating and cooling. This could be attributed to several factors, such as nanoparticles, impurities, or the formation of C-C bonds. A70 PCM does not contain NPs, so C-C formation and PCM impurities may be responsible for the temperature increase.

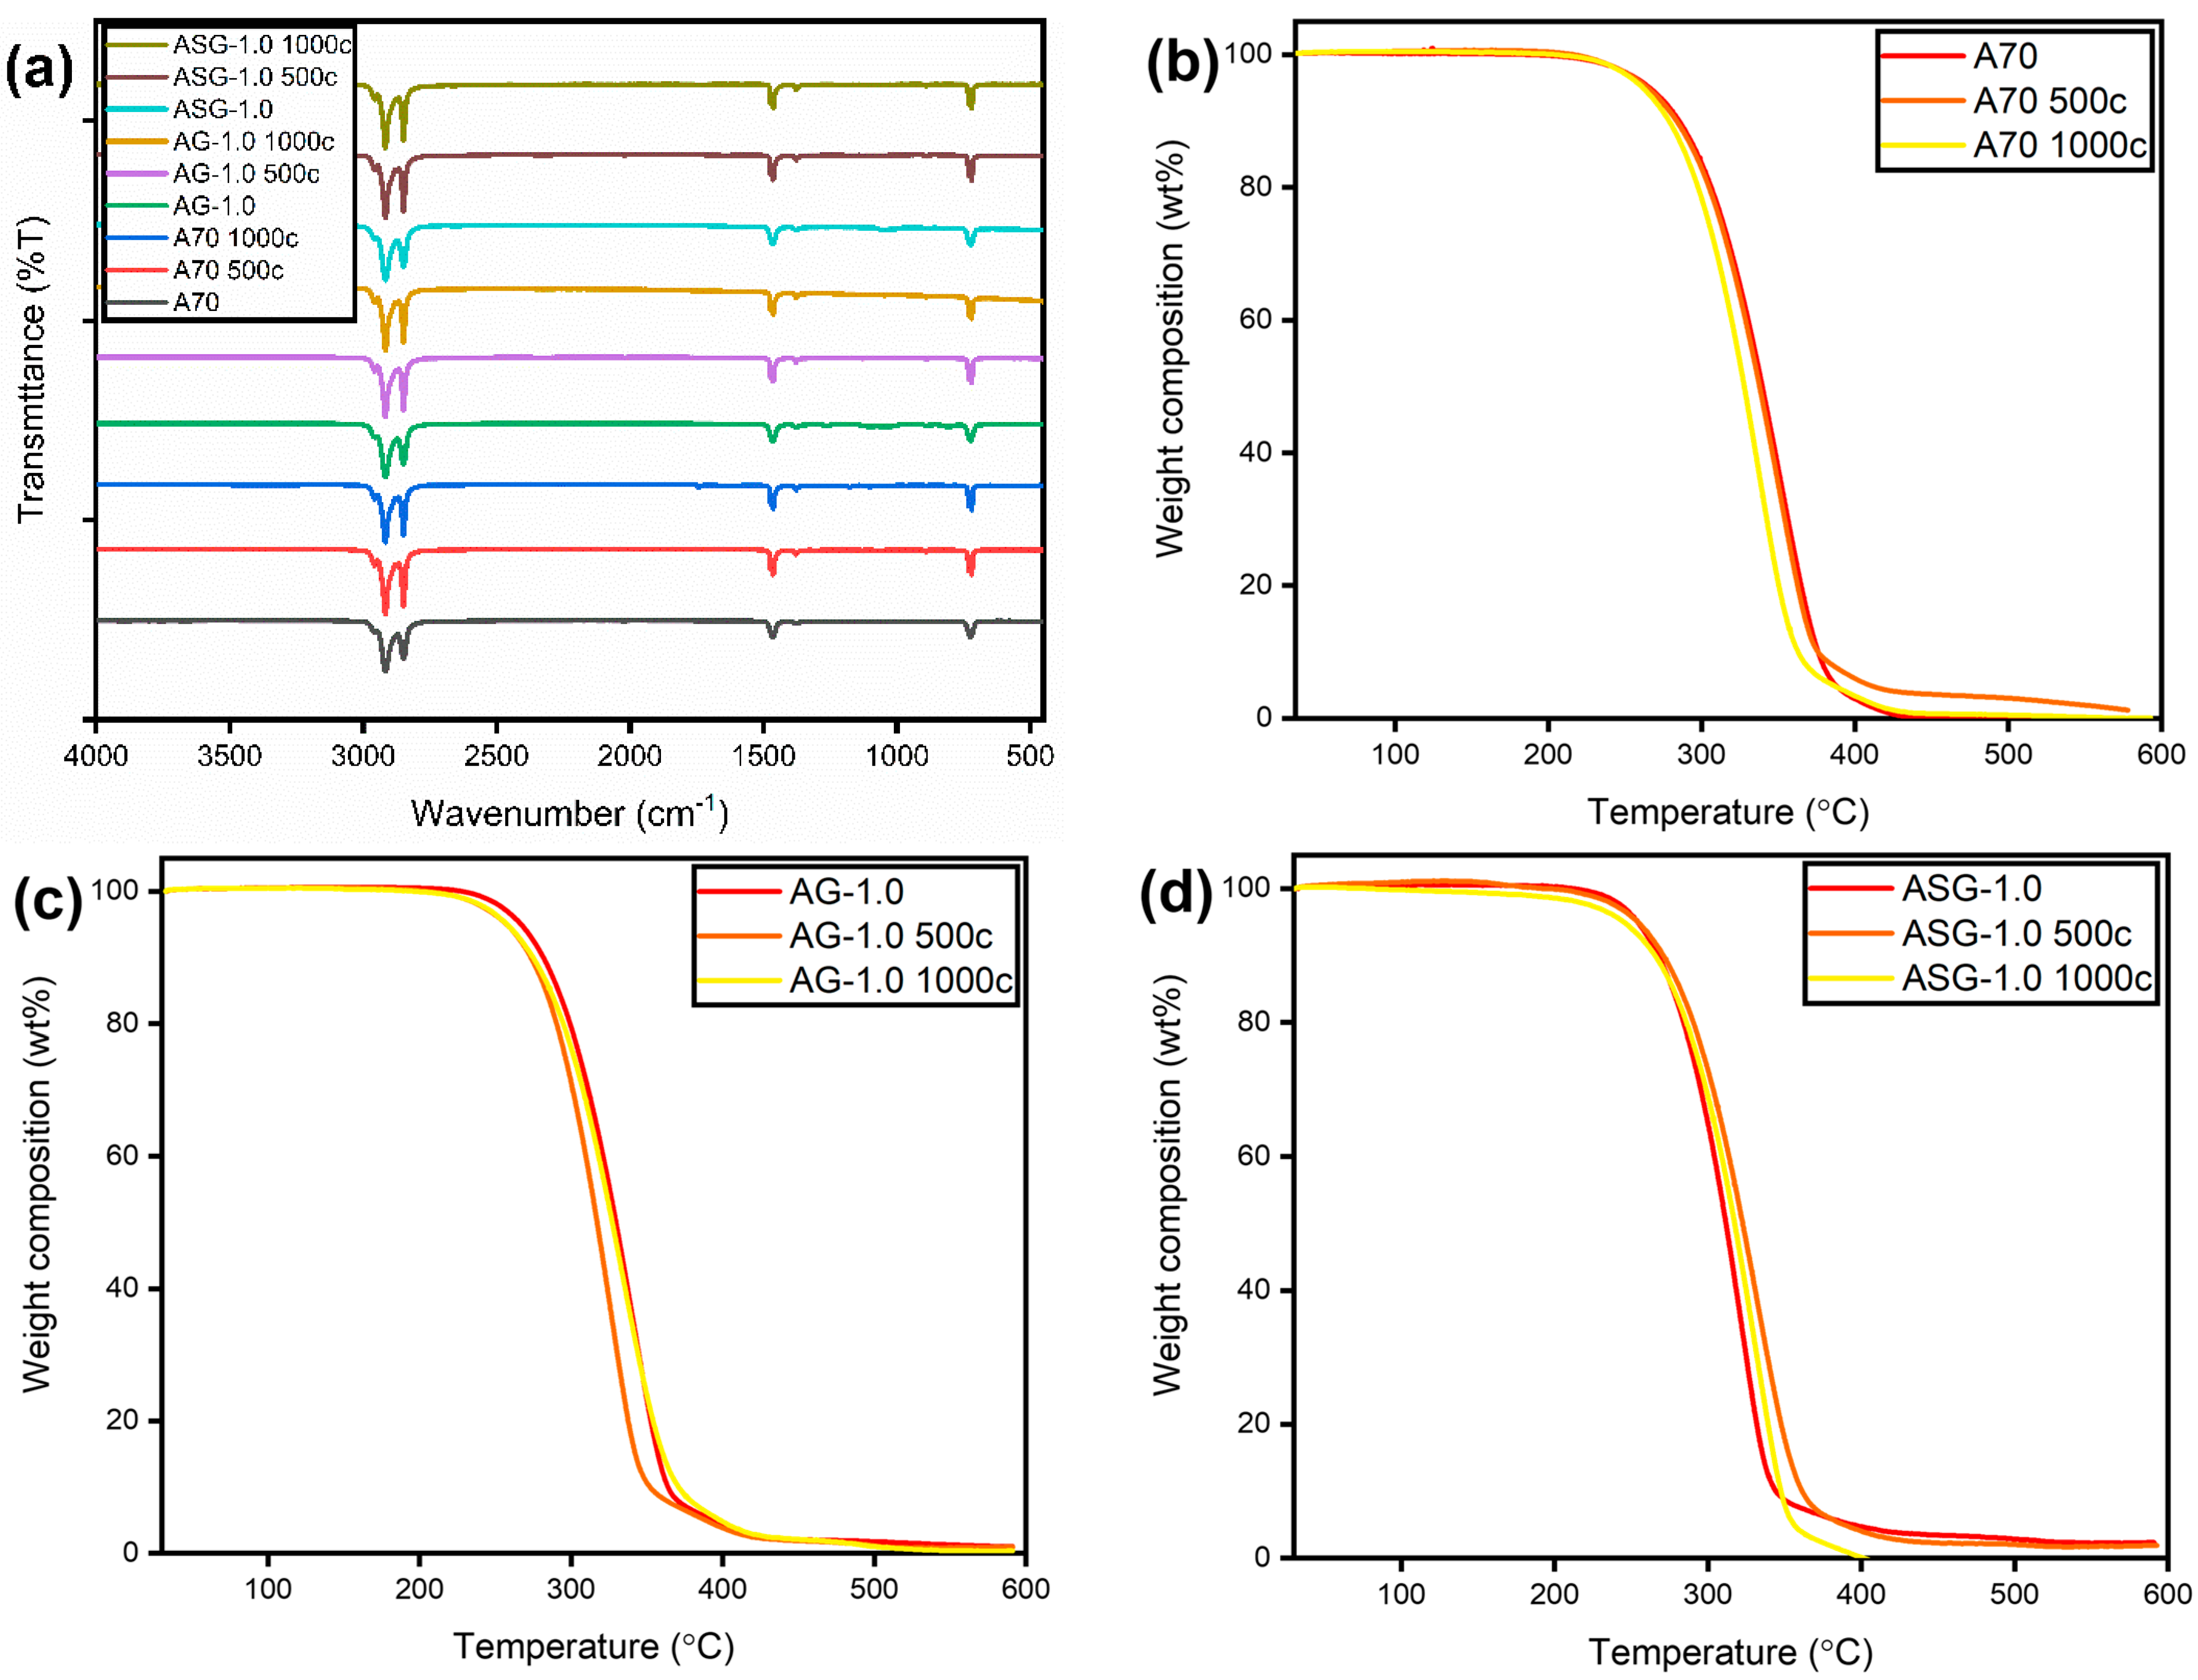
3.7.2. Chemical and Thermal Stability of PW/GNP

Figure 12a displays the FTIR spectra of pure A70 PCM and composites after 1000 heating-cooling cycles. The FTIR spectra graphs suggest that the produced composite remained chemically stable after 1000 thermal cycles, with no additional functional groups observed. Thermal decomposition data from TGA is presented in Figure 12b–d, with Table 5 containing the decomposition temperatures of the AG and ASG nanocomposites. ASG-1.0 exhibited slightly lower stability after 1000 cycles compared to pure A70. This reduction in stability may have been caused by the aggregation of nanoparticles, which could have diminished the thermal barrier effect and thermal stability. It was also observed that after 1000 thermal cycles, the produced samples remained chemically thermally stable, although the enthalpy changed significantly. The preceding discussion highlights the suitability of the formulated samples for applications involving TES.

4. Conclusions

This paper comprehensively investigates the thermophysical behavior of graphene NePCM with SDBS as a surfactant. AG and ASG composites were fabricated by incorporating GNP and surfactant-functionalized GNP (SGNP) into molten A70 PCM. Various analytical techniques are employed to investigate the properties of these composites.
FESEM images confirmed the uniform dispersion of GNP and SGNP on the surface of A70 PCM, with no aggregation observed. FT-IR spectra indicated that no discernible chemical interaction was observed between the PCM and the surfactant, verifying that the composites were physically mixed without any chemical reactions. Thermal analysis through TGA revealed improved thermal stability by adding surfactant-functionalized carbon nanoparticles with increased initial, maximal, and final degradation temperatures. These composites exhibited remarkable thermal stability below 200 °C.
Adding GNP and SGNP reduced light transmission, increasing light absorption and enhancing photothermal conversion. The thermal conductivity of the ASG samples ranged from 0.280 to 0.529 W/mK, with ASG-1.0 showing the highest enhancement at 122.26%. The LH capacity of ASG-1.0 composites was slightly reduced compared to pure A70 PCM, and the melting temperature remained relatively unchanged.
Furthermore, the composites demonstrated long-term viability after 1000 heating and cooling cycles, making them suitable for solar energy storage applications. This research holds potential for various applications, encompassing PVT systems, concentrated PVT systems, and desalination. This present research contributes to the Sustainable Development Goals (SDGs), framed by the UN, specifically to Goal 7 (affordable and clean energy) and Goal 13 (climate change) by offering a sustainable approach to energy storage and climate mitigation.
To further advance this research, practical testing of the developed composite materials under real-world conditions, such as large-scale sample preparation and applications, is recommended. Additionally, efforts to improve the conversion efficacy of electric energy into thermal energy are suggested to enhance the effectiveness of electric-to-thermal energy conversion. Overall, this study underscores the potential of high-performance carbon-based composite PCMs for renewable and sustainable energy sources.

Author Contributions

Conceptualization: M.A.F., M.S. and A.K.P.; data curation: M.A.F. and M.S.; formal analysis: M.A.F. and S.K.S.; funding acquisition: M.S.; investigation: M.A.F., A.K.P. and R.K.R.; methodology: M.A.F.; resources: M.S., A.K.P. and M.F.G.; supervision: M.S. and A.K.P.; visualization: K.K.; writing—original draft: M.A.F., S.K.S. and R.K.R.; writing—review and editing: M.S., A.K.P., K.K. and M.F.G. All authors have read and agreed to the published version of the manuscript.

Funding

This research was funded by Universiti Malaysia Pahang, grant number RDU233002.

Data Availability Statement

Data will be made available on request.

Conflicts of Interest

The authors declare no conflict of interests in term of financial or personal relationships that could have appeared to influence the work reported in this paper.

Abbreviations

PCMPhase Change Materials
NePCMNano-enhanced Phase Change Materials
SDBSSodium Dodecylbenzenesulfonate
GNPGraphene Nanoplatelets
PVTPhotovoltaic Thermal
TESThermal Energy Storage
PWParaffin Wax
LHLatent Heat
MWCNTMulti-Walled Carbon Nanotubes
CNTCarbon Nanotubes
TMEDATetramethyl Ethylene Diamine
SDSSodium Dodecyl Sulfate
1-decanol),Sodium Dodecanoate
TEMEDTriton X-100
PVPPoly Vinyl Pyrrolidone
TiO2Titanium Dioxide
CuOCopper Oxide
GOGraphene Oxide
MgOMagnesium Oxide
CSPConcentrated Solar Power
FESEMField Emission Scanning Electron Microscope
DSCDifferential Scanning Calorimeter
FTIRFourier Transform Infrared Spectrum
TGAThermogravimetric Analysis
UV-VISUltra-Violet Visible Spectrometer
A70Organic PCM
AG-0.1A70 with 0.1 wt% GNP
AG-0.3A70 with 0.3 wt% GNP
AG-0.5A70 with 0.5 wt% GNP
AG-0.7A70 with 0.7 wt% GNP
AG-1.0A70 with 1.0 wt% GNP
ASG-0.1A70 with 0.1 wt% GNP with SDBS
ASG-0.3A70 with 0.3 wt% GNP with SDBS
ASG-0.5A70 with 0.5 wt% GNP with SDBS
ASG-0.7A70 with 0.7 wt% GNP with SDBS
ASG-1.0A70 with 1.0 wt% GNP with SDBS

References

  1. Fikri, M.A.; Samykano, M.; Pandey, A.K.; Kadirgama, K.; Kumar, R.R.; Selvaraj, J.; Rahim, N.A.; Tyagi, V.V.; Sharma, K.; Saidur, R. Recent Progresses and Challenges in Cooling Techniques of Concentrated Photovoltaic Thermal System: A Review with Special Treatment on Phase Change Materials (PCMs) Based Cooling. Sol. Energy Mater. Sol. Cells 2022, 241, 111739. [Google Scholar] [CrossRef]
  2. Xiao, M.; Tang, L.; Zhang, X.; Lun, I.Y.F.; Yuan, Y. A Review on Recent Development of Cooling Technologies for Concentrated Photovoltaics (CPV) Systems. Energies 2018, 11, 3416. [Google Scholar] [CrossRef]
  3. Mohamed, S.A.; Al-Sulaiman, F.A.; Ibrahim, N.I.; Zahir, M.H.; Al-Ahmed, A.; Saidur, R.; Yılbaş, B.S.; Sahin, A.Z. A Review on Current Status and Challenges of Inorganic Phase Change Materials for Thermal Energy Storage Systems. Renew. Sustain. Energy Rev. 2017, 70, 1072–1089. [Google Scholar] [CrossRef]
  4. Lin, Y.; Zhu, C.; Alva, G.; Fang, G. Palmitic Acid/Polyvinyl Butyral/Expanded Graphite Composites as Form-Stable Phase Change Materials for Solar Thermal Energy Storage. Appl. Energy 2018, 228, 1801–1809. [Google Scholar] [CrossRef]
  5. Arndt, P.E.; Dunn, J.G.; Willix, R.L.S. Organic Compounds as Candidate Phase Change Materials in Thermal Energy Storage. Thermochim. Acta 1984, 79, 55–68. [Google Scholar] [CrossRef]
  6. Jiang, Z.; Ouyang, T.; Yang, Y.; Chen, L.; Fan, X.; Chen, Y.; Li, W.; Fei, Y. Thermal Conductivity Enhancement of Phase Change Materials with Form-Stable Carbon Bonded Carbon Fiber Network. Mater. Des. 2018, 143, 177–184. [Google Scholar] [CrossRef]
  7. Fikri, A.; Pandey, D.A.; Samykano, M.; Sharma, K.; Selvaraj, J.; Abd Rahim, N.; Saidura, R. Thermal Stability and Light Transmission Capability of Nano TIO2 Enhanced Phase Change Material as Thermal Energy Storage. IOP Conf. Ser. Mater. Sci. Eng. 2021, 1116, 12206. [Google Scholar] [CrossRef]
  8. Reji Kumar, R.; Samykano, M.; Pandey, A.K.; Kadirgama, K.; Tyagi, V.V. Phase Change Materials and Nano-Enhanced Phase Change Materials for Thermal Energy Storage in Photovoltaic Thermal Systems: A Futuristic Approach and Its Technical Challenges. Renew. Sustain. Energy Rev. 2020, 133, 110341. [Google Scholar] [CrossRef]
  9. Babapoor, A.; Karimi, G.; Sabbaghi, S. Thermal Characteristic of Nanocomposite Phase Change Materials during Solidification Process. J. Energy Storage 2016, 7, 74–81. [Google Scholar] [CrossRef]
  10. Hamilton, R.L. Thermal Conductivity of Heterogeneous Two-Component Systems. Ind. Eng. Chem. Fundam. 1962, 1, 187–191. [Google Scholar] [CrossRef]
  11. Yu, W.; Choi, S.U.S. The Role of Interfacial Layers in the Enhanced Thermal Conductivity of Nanofluids: A Renovated Hamilton-Crosser Model. J. Nanoparticle Res. 2004, 6, 355–361. [Google Scholar] [CrossRef]
  12. Tang, X.; Hammel, E.; Reiter, W. Carbon Nanotube Enhanced Thermally Conductive Phase Change Material for Heat Dissipation. In Proceedings of the 2009 15th International Workshop on Thermal Investigations of ICs and Systems, Leuven, Belgium, 7–9 October 2009; pp. 216–218. [Google Scholar]
  13. Cui, Y.; Liu, C.; Hu, S.; Yu, X. The Experimental Exploration of Carbon Nanofiber and Carbon Nanotube Additives on Thermal Behavior of Phase Change Materials. Sol. Energy Mater. Sol. Cells 2011, 95, 1208–1212. [Google Scholar] [CrossRef]
  14. Choi, D.H.; Lee, J.; Hong, H.; Kang, Y.T. Thermal Conductivity and Heat Transfer Performance Enhancement of Phase Change Materials (PCM) Containing Carbon Additives for Heat Storage Application. Int. J. Refrig. 2014, 42, 112–120. [Google Scholar] [CrossRef]
  15. Cacua, K.; Ordoñez, F.; Zapata, C.; Herrera, B.; Pabón, E.; Buitrago-Sierra, R. Surfactant Concentration and PH Effects on the Zeta Potential Values of Alumina Nanofluids to Inspect Stability. Colloids Surf. A Physicochem. Eng. Asp. 2019, 583, 123960. [Google Scholar] [CrossRef]
  16. Laghari, I.A.; Samykano, M.; Pandey, A.K.; Kadirgama, K.; Mishra, Y.N. Binary Composite (TiO2-Gr) Based Nano-Enhanced Organic Phase Change Material: Effect on Thermophysical Properties. J. Energy Storage 2022, 51, 104526. [Google Scholar] [CrossRef]
  17. Rkumar, K.; Samykano, M.; Pandey, A.K.; Kadirgama, K.; Tyagi, V. V A Comparative Study on Thermophysical Properties of Functionalized and Non-Functionalized Multi-Walled Carbon Nano Tubes ( MWCNTs ) Enhanced Salt Hydrate Phase Change Material. Sol. Energy Mater. Sol. Cells 2022, 240, 111697. [Google Scholar] [CrossRef]
  18. Zhang, S.; Wu, J.Y.; Tse, C.T.; Niu, J. Effective Dispersion of Multi-Wall Carbon Nano-Tubes in Hexadecane through Physiochemical Modification and Decrease of Supercooling. Sol. Energy Mater. Sol. Cells 2012, 96, 124–130. [Google Scholar] [CrossRef]
  19. Dsilva Winfred Rufuss, D.; Suganthi, L.; Iniyan, S.; Davies, P.A. Effects of Nanoparticle-Enhanced Phase Change Material (NPCM) on Solar Still Productivity. J. Clean. Prod. 2018, 192, 9–29. [Google Scholar] [CrossRef]
  20. Wu, X.; Wang, C.; Wang, Y.; Zhu, Y. Experimental Study of Thermo-Physical Properties and Application of Paraffin-Carbon Nanotubes Composite Phase Change Materials. Int. J. Heat Mass Transf. 2019, 140, 671–677. [Google Scholar] [CrossRef]
  21. Prado, J.I.; Lugo, L. Enhancing the Thermal Performance of a Stearate Phase Change Material with Graphene Nanoplatelets and MgO Nanoparticles. ACS Appl. Mater. Interfaces 2020, 12, 39108–39117. [Google Scholar] [CrossRef]
  22. Hassan, F.; Jamil, F.; Arshad, A.; Ali, H. Passive Cooling Analysis of an Electronic Chipset Using Nanoparticles and Metal-Foam Composite PCM: An Experimental Study. Energies 2022, 15, 8746. [Google Scholar] [CrossRef]
  23. Wu, S.; Yan, T.; Kuai, Z.; Pan, W. Thermal Conductivity Enhancement on Phase Change Materials for Thermal Energy Storage: A Review. Energy Storage Mater. 2020, 25, 251–295. [Google Scholar] [CrossRef]
  24. Navarrete, N.; Mondragón, R.; Wen, D.; Navarro, M.E.; Ding, Y.; Juliá, J.E. Thermal Energy Storage of Molten Salt –Based Nanofluid Containing Nano-Encapsulated Metal Alloy Phase Change Materials. Energy 2019, 167, 912–920. [Google Scholar] [CrossRef]
  25. Phys, J.A. Recent Advances for Phase-Transition Materials for Actuators Recent Advances for Phase-Transition Materials for Actuators. J. Appl. Phys. 2021, 128, 101101. [Google Scholar] [CrossRef]
  26. Yang, Y.; Luo, J.; Song, G.; Liu, Y.; Tang, G. The Experimental Exploration of Nano-Si3N4/Paraffin on Thermal Behavior of Phase Change Materials. Thermochim. Acta 2014, 597, 101–106. [Google Scholar] [CrossRef]
  27. Harikrishnan, S.; Imran Hussain, S.; Devaraju, A.; Sivasamy, P.; Kalaiselvam, S. Improved Performance of a Newly Prepared Nano-Enhanced Phase Change Material for Solar Energy Storage. J. Mech. Sci. Technol. 2017, 31, 4903–4910. [Google Scholar] [CrossRef]
  28. Zhou, Y.; Wang, X.; Liu, X.; Sheng, D.; Ji, F.; Dong, L. Solar Energy Materials and Solar Cells Multifunctional ZnO/Polyurethane-Based Solid-Solid Phase Change Materials with Graphene Aerogel. Sol. Energy Mater. Sol. Cells 2019, 193, 13–21. [Google Scholar] [CrossRef]
Figure 1. Surfactant additive method in NePCMs [22].
Energies 16 07668 g001
Figure 2. FESEM micrographs of (a) A70, (b) GNP, (c) AG-1.0, and (d) ASG-1.0 with 10× mag.
Energies 16 07668 g002
Figure 3. (a) Infrared rays’ and (b) visible light rays’ optical images of AG-0.1; (c) infrared rays’ and (d) visible light rays’ optical images of ASG-0.1.
Energies 16 07668 g003
Figure 4. Thermal conductivity value of nanocomposites AG and ASG with variation of nanoparticle concentration with error bar 10% from actual reading.
Energies 16 07668 g004
Figure 5. DSC results for A70 PCM and various concentrations of GNP with PCM composite.
Energies 16 07668 g005
Figure 6. DSC result of A70 PCM and various concentrations of GNP with SDBS.
Energies 16 07668 g006
Figure 7. FTIR graph of A70 PCM and composites.
Energies 16 07668 g007
Figure 8. FTIR curve of GNP, SDBS, A70, and ASG composites at various concentrations.
Energies 16 07668 g008
Figure 9. The transmittance graph of A70, (a) AG, and (b) ASG samples.
Energies 16 07668 g009
Figure 10. Step-by-step degradation curve for (a) AG and (b) ASG composites.
Energies 16 07668 g010
Figure 11. DSC graph of (a) A70, (b) AG, and (c) ASG at 0, 500, and 1000 heating-cooling cycles.
Energies 16 07668 g011
Figure 12. (a) FTIR curve of A70, AG, and ASG composites at 0, 500, and 1000 thermal cycles; (b) TGA cure of A70 at 1000 cycles; (c) TGA cure of AG-1.0 at 1000 cycles; (d) TGA cure of ASG at 1000 cycles.
Energies 16 07668 g012
Table 1. Properties of PLUSICE A70, GNP, and SDBS.
PropertiesA70 PCMGNPSDBS
Thermal conductivity (W/mK)0.2303000-
Melting temperature (°C)703652204–207
Melting enthalpy (J/g)173--
ColorWhiteDark greyWhite
Surface area (m2/g)-120–150-
Density (g/mol)-12.010.18
AppearanceWaxPowderFlake
Molecular weight (g/mol)--348.48
Size-5 µm
Purity < 100%
Table 2. Thermal properties extracted from the DSC curve for the prepared composites.
SamplesOnset Melting Temperature (°C)Offset Melting Temperature (°C) Melting Point (°C)Melting Enthalpy (J/g)Freezing Enthalpy (J/g)
A7049.873.568.20170.49162.74
AG-0.149.074.769.85169.10168.42
AG-0.350.074.368.98168.72155.31
AG-0.550.074.069.12165.77162.78
AG-0.751.173.569.08163.12160.93
AG-1.049.873.868.43162.22160.60
ASG-0.150.774.168.8168.62167.57
ASG-0.350.073.468.1165.40155.94
ASG-0.550.575.069.0162.62158.03
ASG-0.749.373.768.3160.99157.85
ASG-1.045.870.969.50158.78157.33
Table 3. Thermal stability of different wt% for AG and ASG composites.
SamplesInitial Degradation Temperature (°C)Maximal Degradation Temperature (°C)Final Degradation Temperature (°C)
0.0266.08351.26387.20
AG-0.1250.85316.75382.53
AG-0.3256.03335.52391.31
AG-0.5247.82317.11411.67
AG-0.7256.12337.52417.12
AG-1.0266.03345.91392.63
ASG-0.1262.16326.71383.61
ASG-0.3267.10329.35366.22
ASG-0.5264.86341.69372.00
ASG-0.7254.50333.60377.71
ASG-1.0254.74322.64393.11
Table 4. Latent heat and phase transition temperature of paraffin wax and composites 0, 500, and 1000 cycles.
SamplesLatent Heat (kJ/kg)Melting Point (°C)Difference in Latent Heat (kJ/kg)Difference in Melting Temperature (°C)
0 Cycle500 Cycles1000 Cycles0 Cycle500 Cycles1000 Cycles
A70170.49176.43180.2368.2068.7766.25+9.74−1.95
AG-1.0162.22161.06154.3468.4367.6671.70−7.88+3.27
ASG-1.0158.78153.60149.3169.5066.670.4−9.47+0.90
Table 5. Degradation temperatures for A70, AG, and ASG after 0, 500, and 1000 cycles.
CompositesInitial Degradation Temperature (°C)Maximal Degradation Temperature (°C)Final Degradation Temperature (°C)
A70266.08351.26387.20
A70 500c265.12350.11411.24
A70 1000c260.09337.73387.92
AG-1.0266.03345.91392.63
AG-1.0 500c259.12328.38389.83
AG-1.0 1000c260.84336.25399.61
ASG-1.0254.20323.54394.32
ASG-1.0 500c254.34332.5388.19
ASG-1.0 1000c245.02331.59356.02
Disclaimer/Publisher’s Note: The statements, opinions and data contained in all publications are solely those of the individual author(s) and contributor(s) and not of MDPI and/or the editor(s). MDPI and/or the editor(s) disclaim responsibility for any injury to people or property resulting from any ideas, methods, instructions or products referred to in the content.

