


Analysis of Using Hybrid 1 MWp PV-Farm with Energy Storage in Poland


Abstract
:1. Introduction
2. Materials and Methods
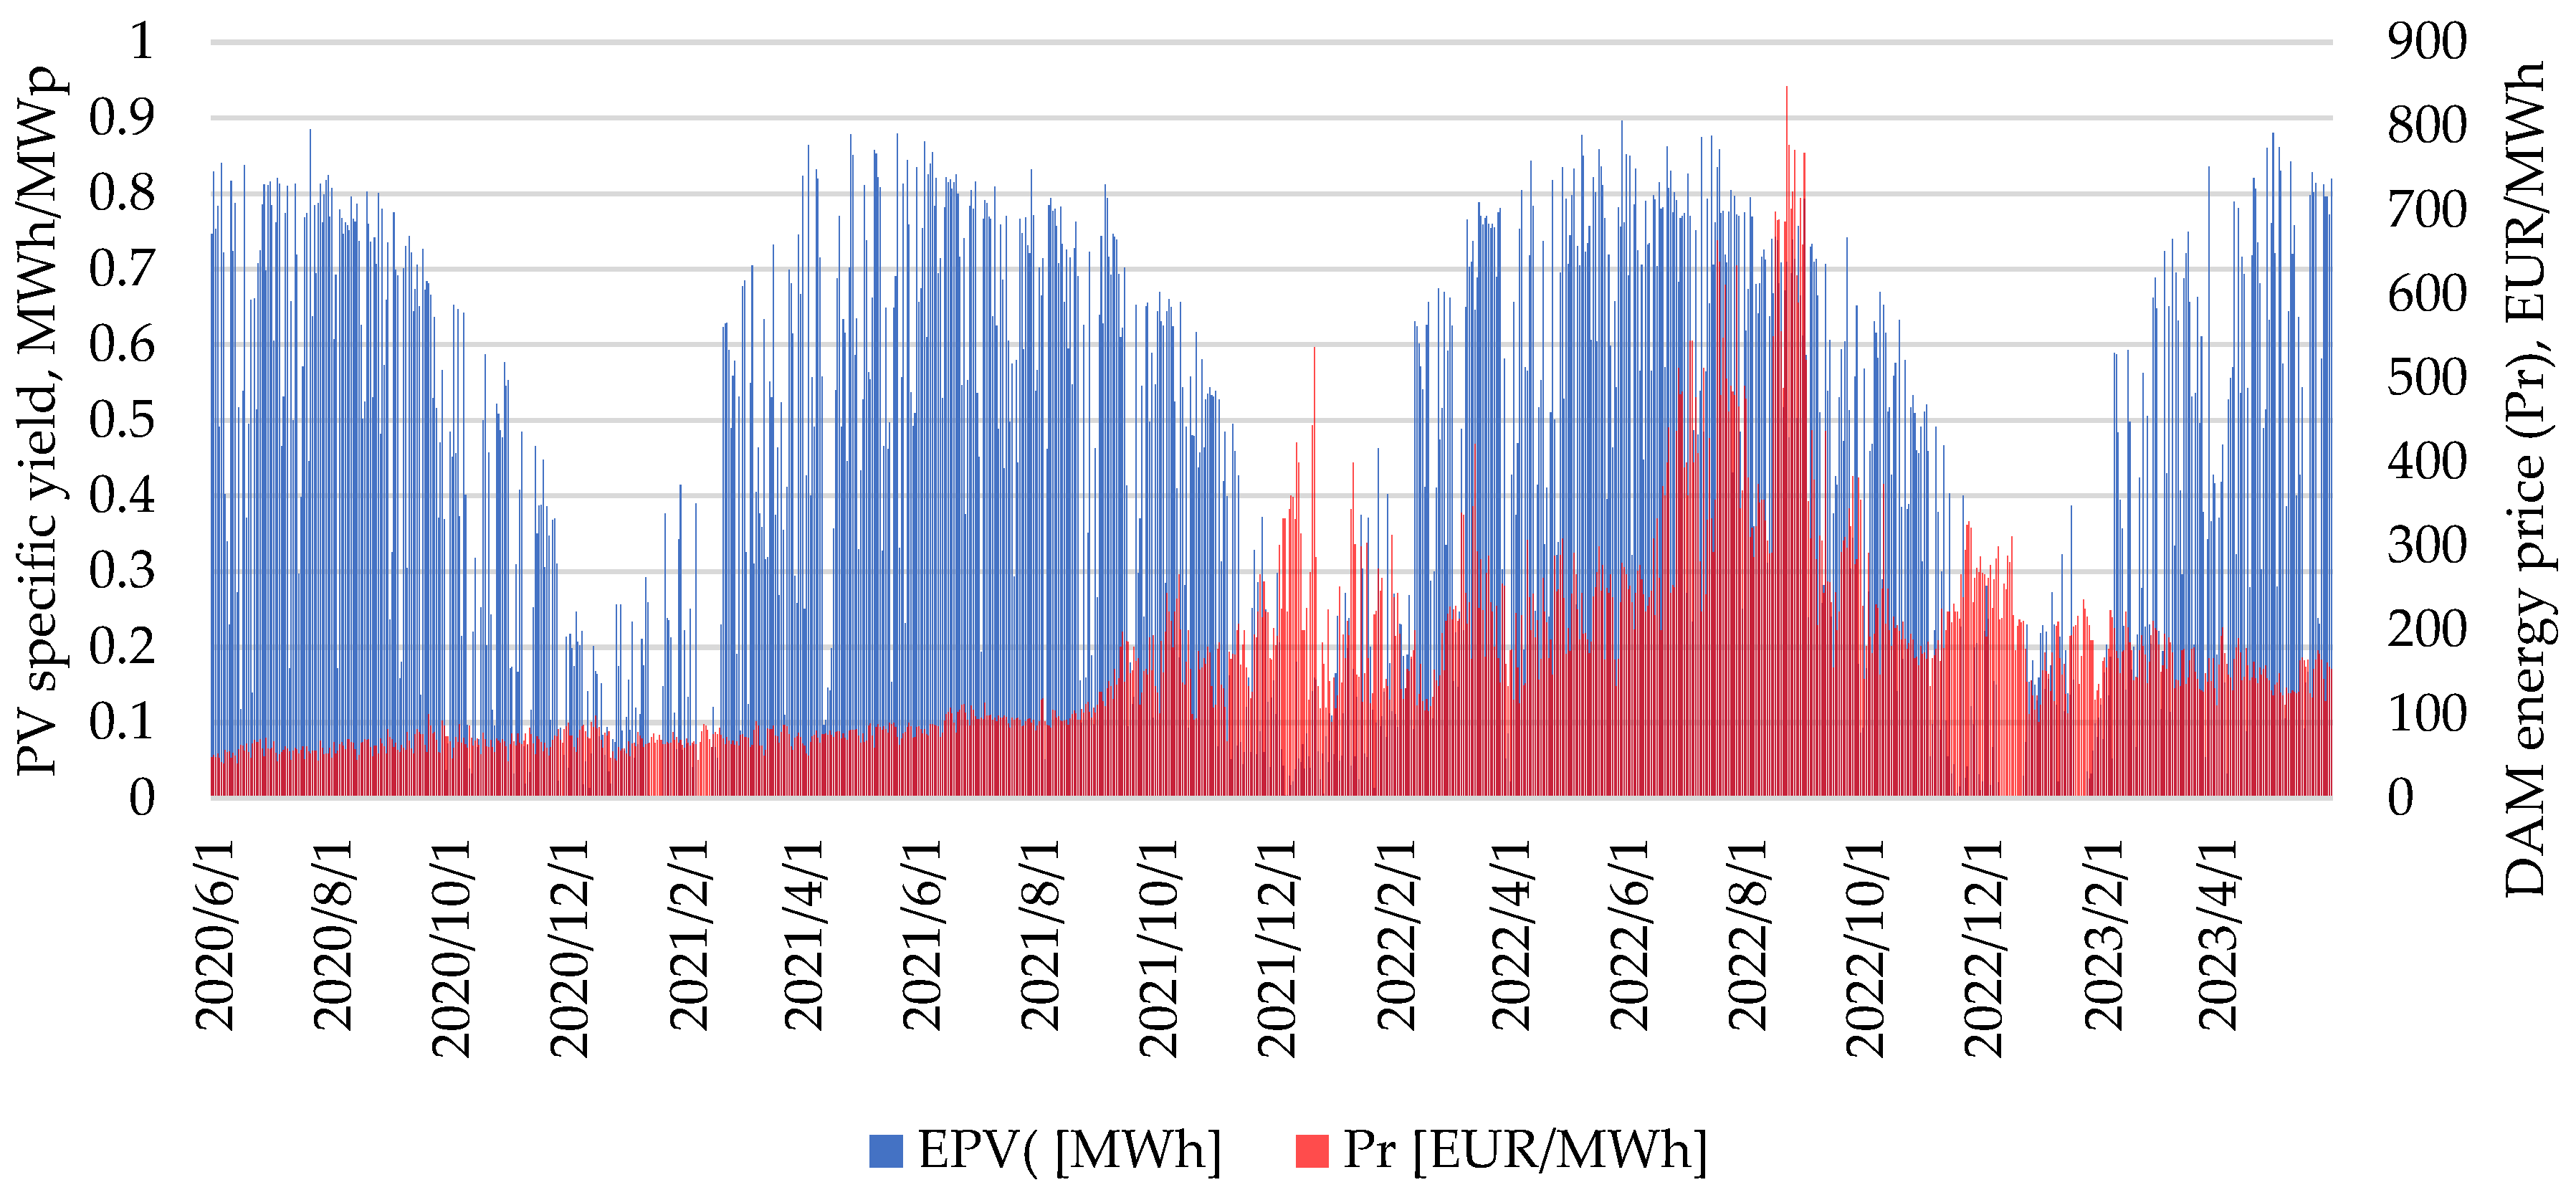
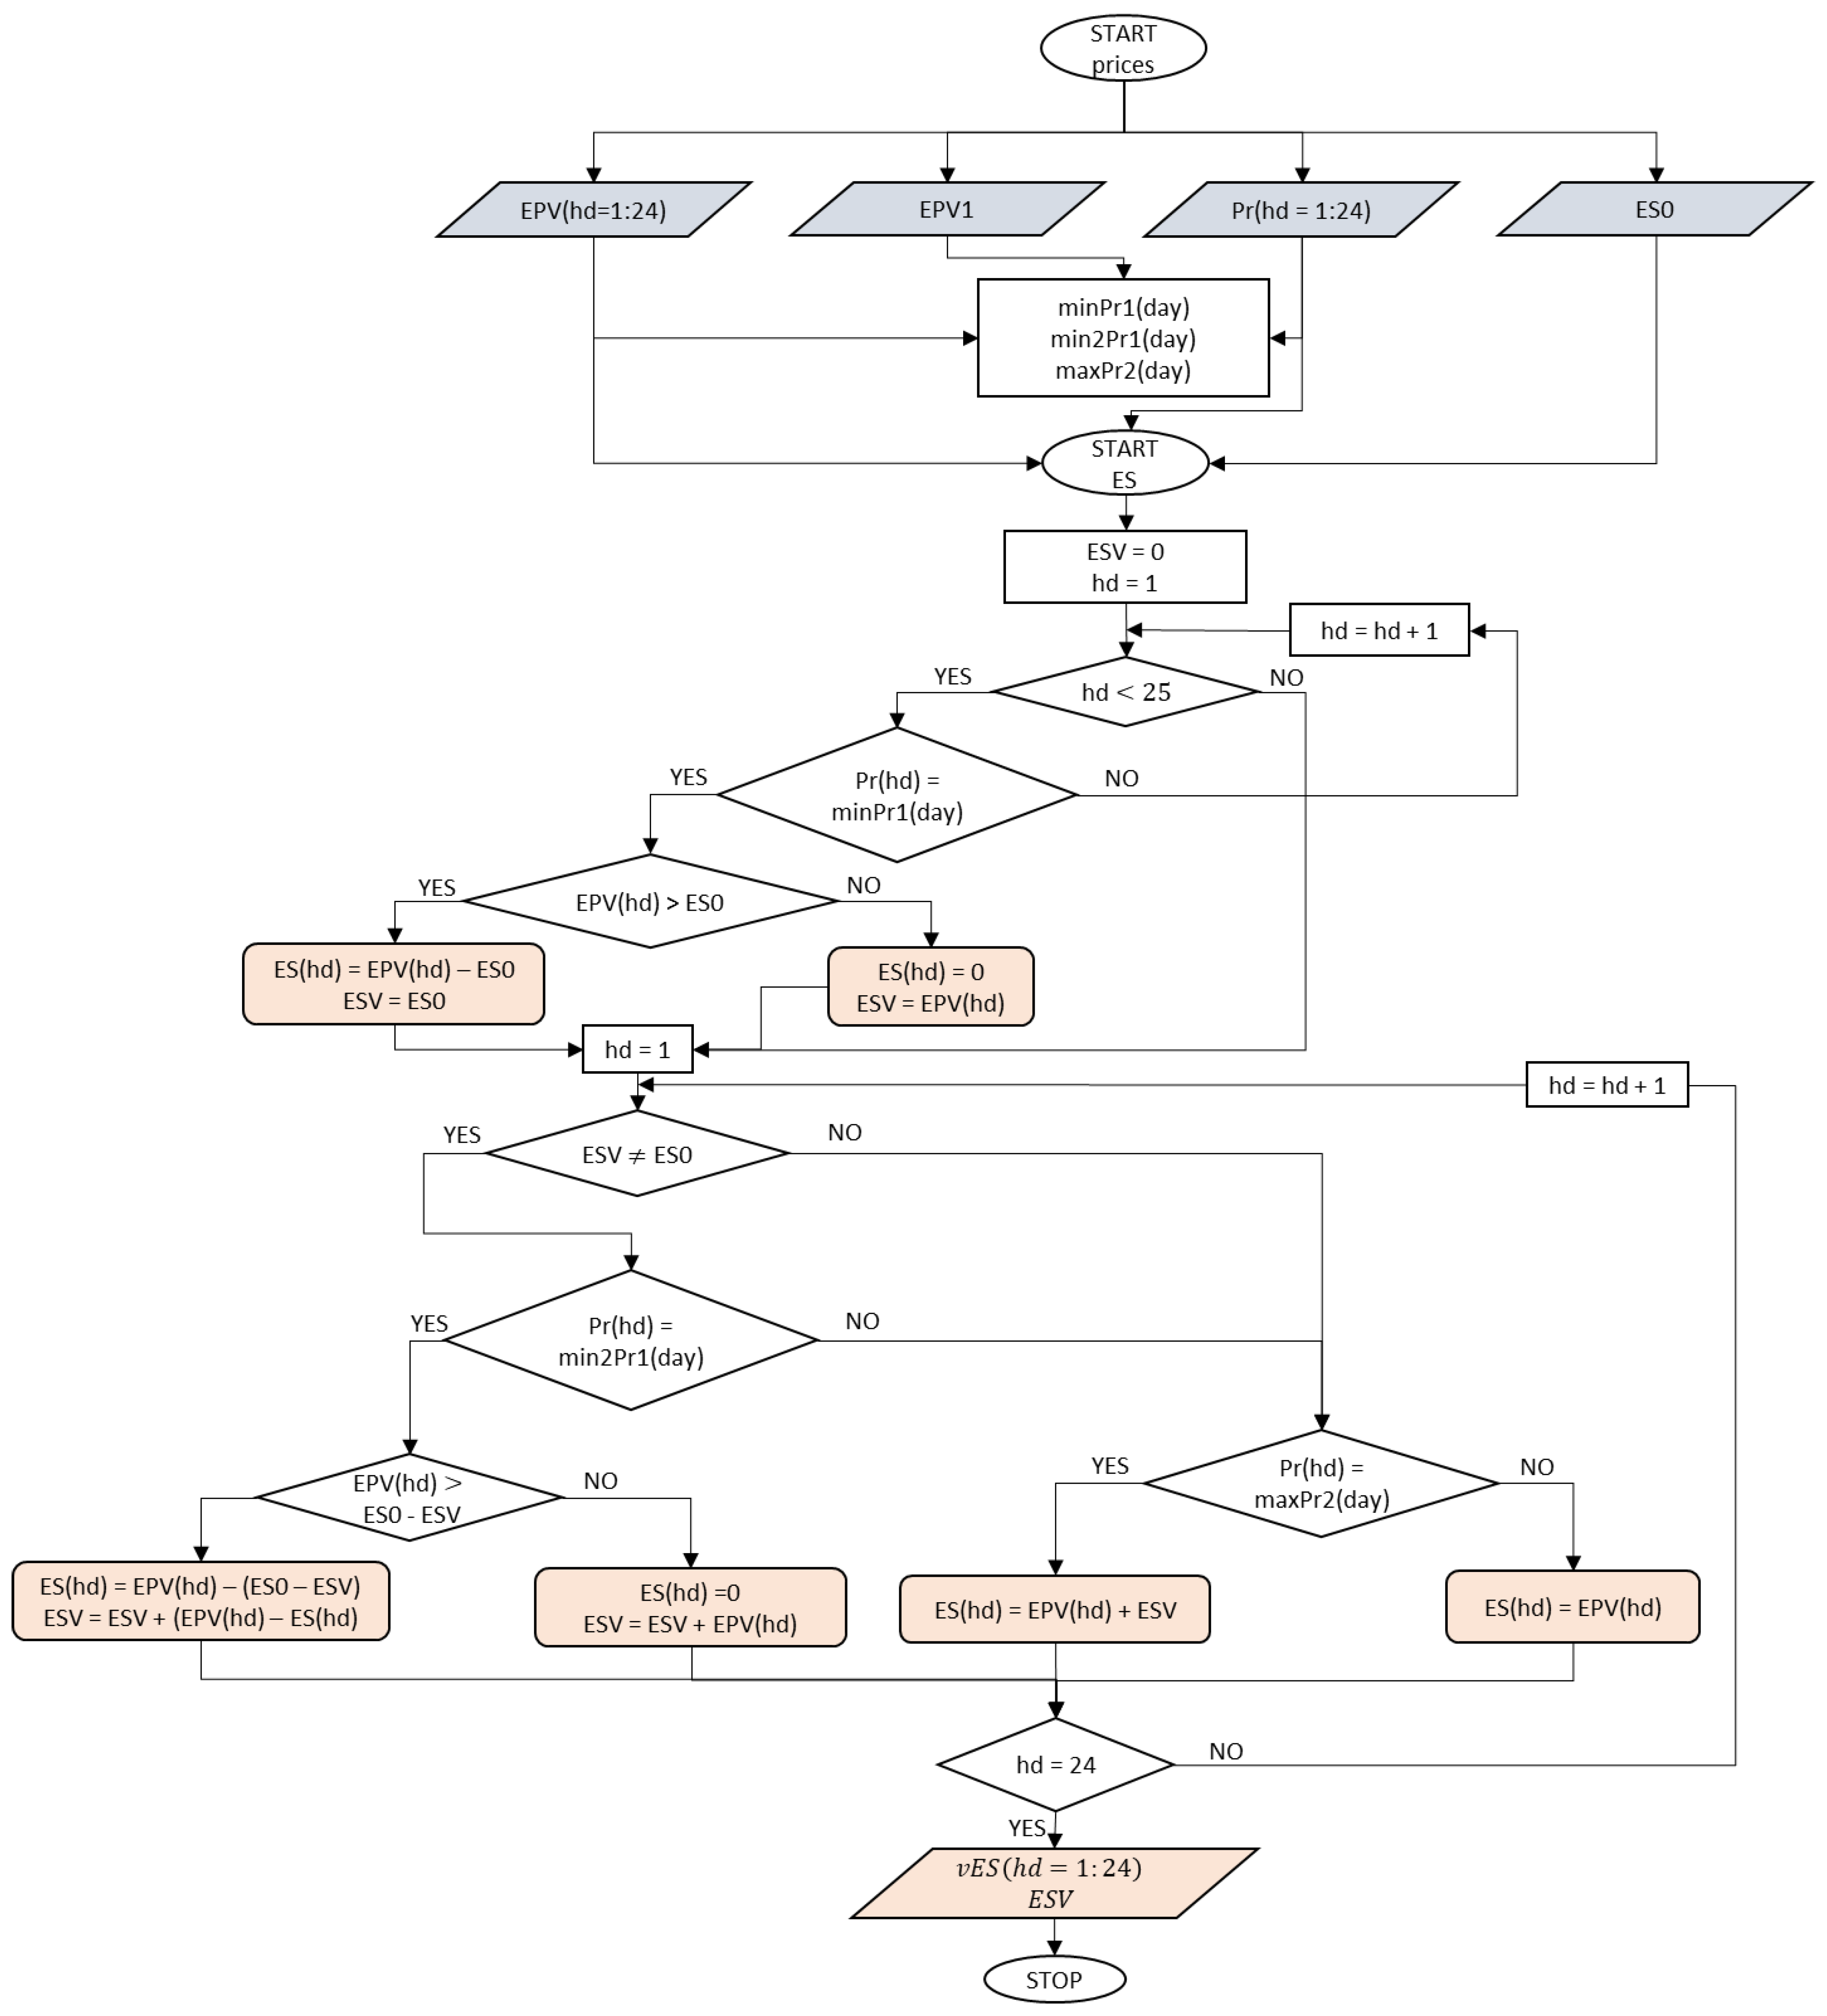
- At the first start (START price), the following values were taken: the production of electricity by the installation for each hour of the day (EPV(hd = 1:24)), the value for the condition that the energy storage can accept energy only when the production of energy by the photovoltaic installation is greater than the assumed 0.1 MW (EPV1), the price of electricity for each hour (Pr(hd = 1:24)) and the capacity of the energy storage (ES0 = 0.5 MWh).
- The lowest value of the electricity price minPr1(day) (3), the second lowest value of the electricity price min2Pr1(day) (4) and the highest value of the electricity price maxPr2(day) (6) were determined.
- At the second start (START ES), the corresponding values were assigned to the amount of energy sent to storage (ESV) and to the hour of the day (hd).
- It was checked whether the value of hd < 25. If so, the following steps were followed, and if not, it was necessary to go to step 10.
- It was checked whether (Pr(hd)) is equal to minPr1(day). If yes, proceed according to the next points, and if no, go to point 9.
- It was checked whether (EPV(hd)) is greater than ES0. If so, the following points were followed, and if not, proceed to point 8.
- The values of the variable determining the amount of electricity returned to the grid (ES(hd) = EPV(hd) − ES0) and the variable ESV (ESV = ES0) were assigned, and it was necessary to proceed to point 10.
- The values of the variable ES(hd) (ES(hd) = 0) and the variable ESV (ESV = EPV(hd)) were assigned, and it was necessary to go to point 10.
- The variable hd was assigned the value “hd + 1”.
- The variable hd was assigned the value “1”.
- It was checked whether the value of ESV is different from ES0. If it is, the following steps were followed; if not, proceed to step 16.
- It was checked whether (Pr(hd)) is equal to min2Pr1(day). If yes, proceed according to the next points, and if no, go to point 16.
- It was checked whether (EPV(hd)) is greater than ES0-ESV. If so, the following points were followed, and if not, proceed to point 15.
- Values were assigned to the variable ES(hd) (ES(hd) = EPV(hd)-(ES0-ESV)) and the variable ESV (ESV = ESV + (EPV(hd)-ES(hd)), and it was necessary to proceed to point 19.
- Values were assigned to the ES(hd) variable (ES(hd) = 0) and the ESV variable (ESV = ESV + (EPV(hd)); then, go to step 19.
- It was checked whether (Pr(hd)) is equal to maxPr2(day). If yes, then follow the next steps, and if no, then proceed to step 18.
- The value of the variable ES(hd) was assigned (ES(hd) = EPV(hd) + ESV), and it was necessary to proceed to point 19.
- The value of the variable ES(hd) was assigned (ES(hd) = EPV(hd)). Then, proceed to the next points.
- It was checked whether the value of the variable hd is equal to “24”. If so, proceed to point 21, and if not, proceed according to the following points.
- The variable hd was assigned the value “hd + 1”, the next hour of the day.
- The values of the vector vES(hd:1:24) and the variable ESV were recorded.
- The calculation was completed (for one day of calculation).
3. Results
4. Conclusions
Author Contributions
Funding
Data Availability Statement
Conflicts of Interest
Nomenclature
| DAM | Day-Ahead Market |
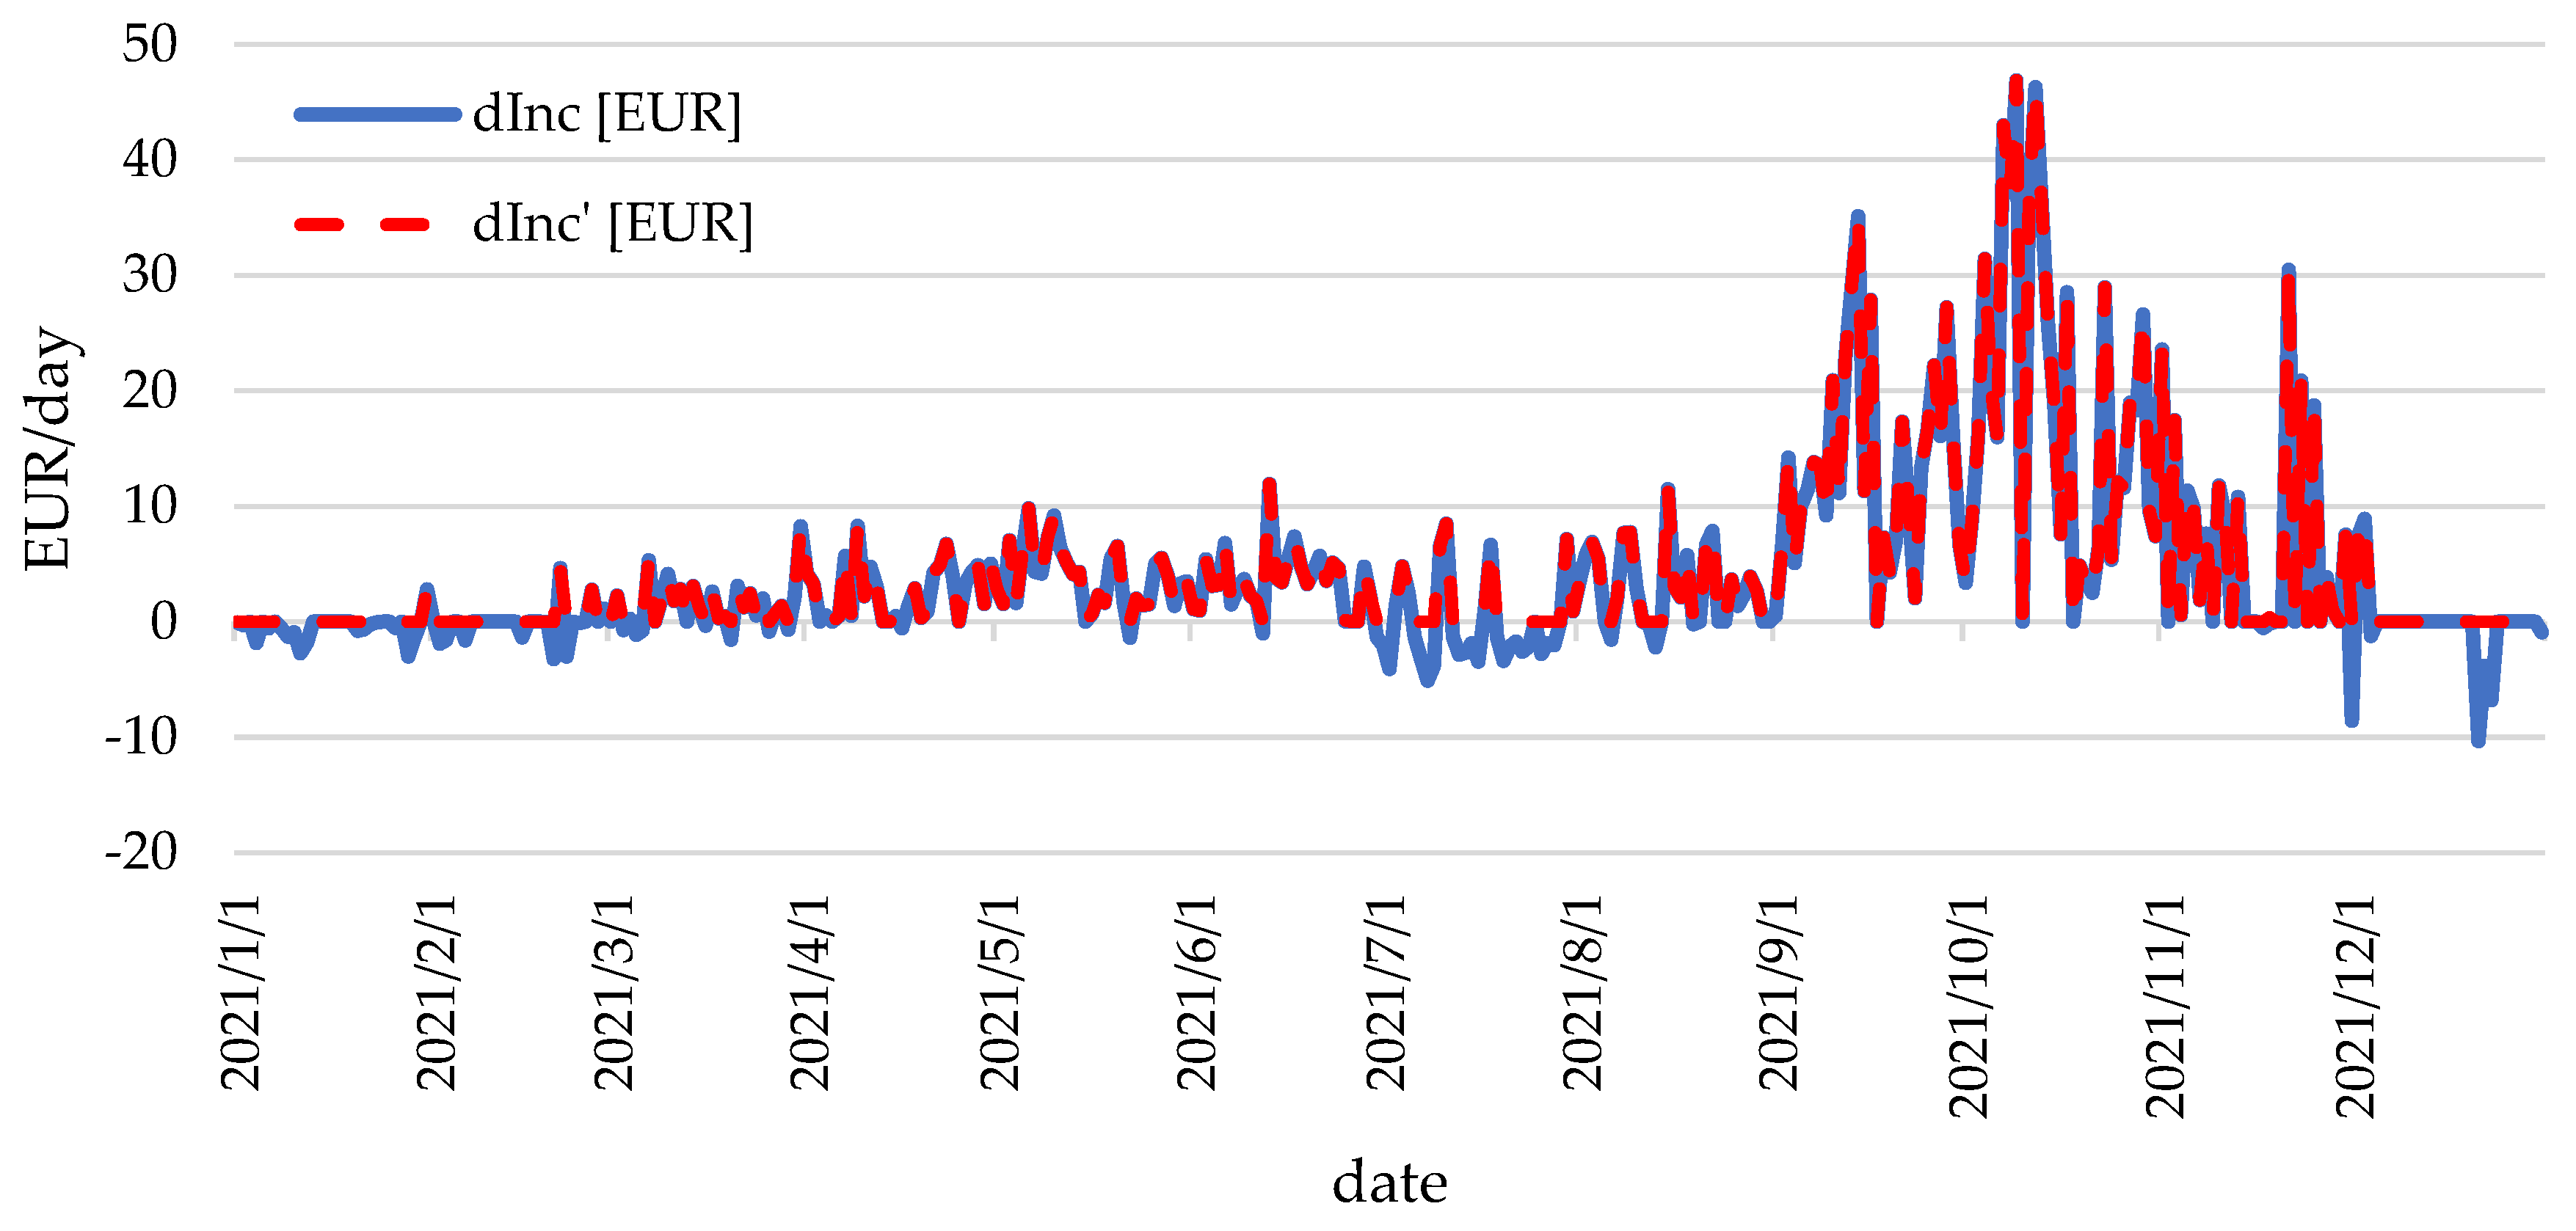
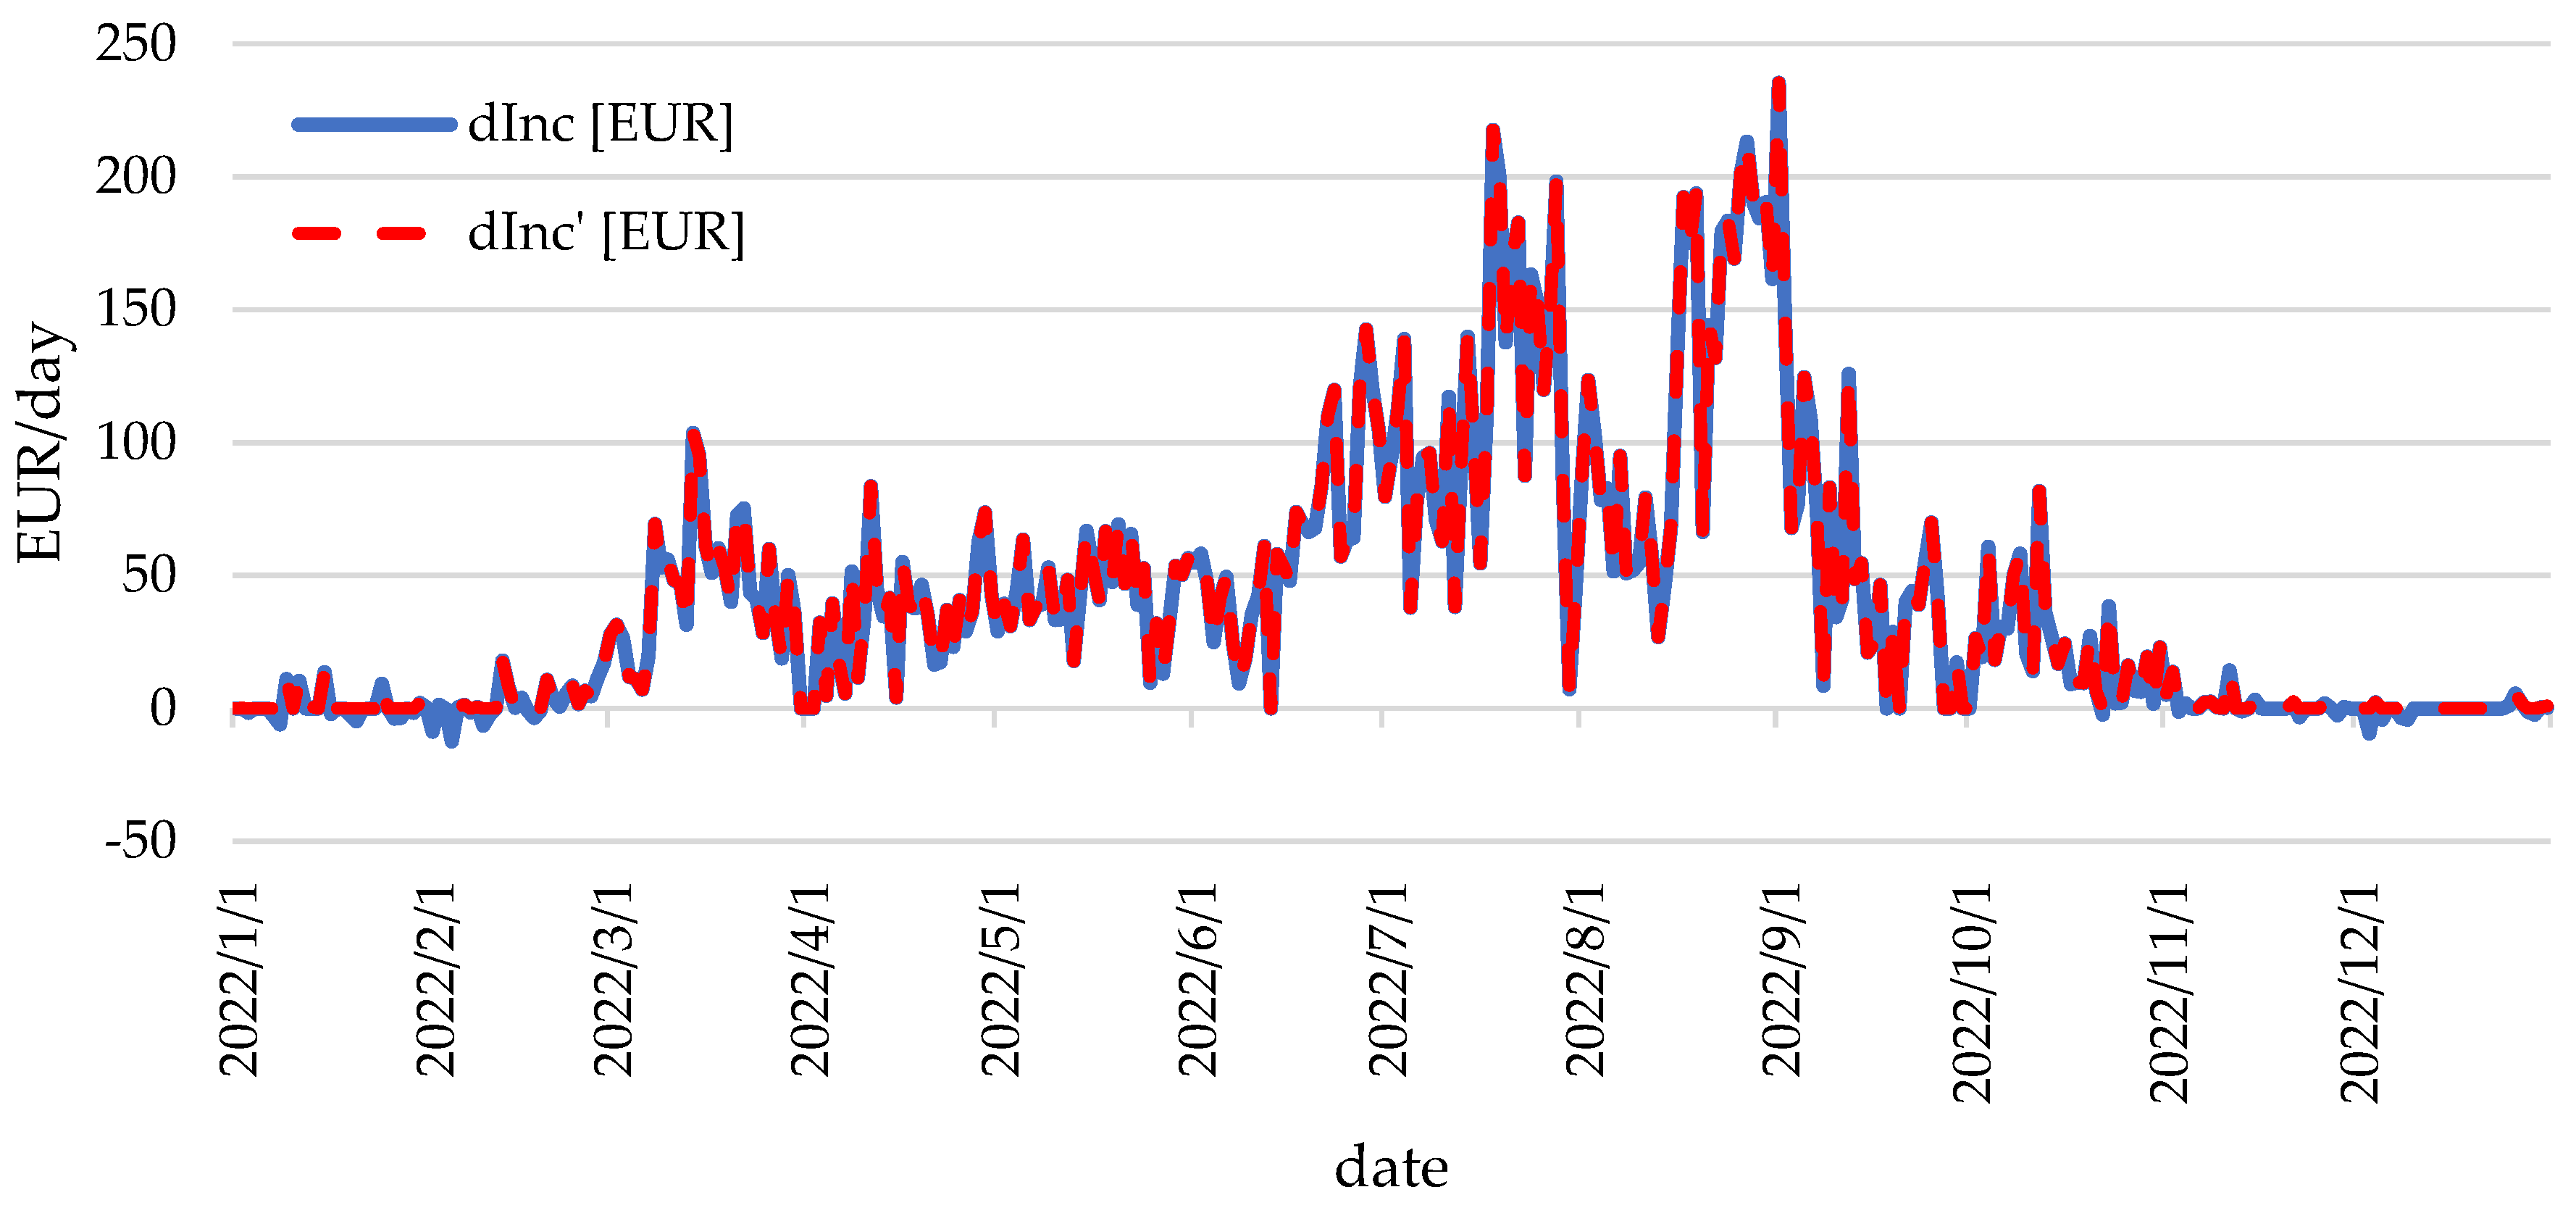
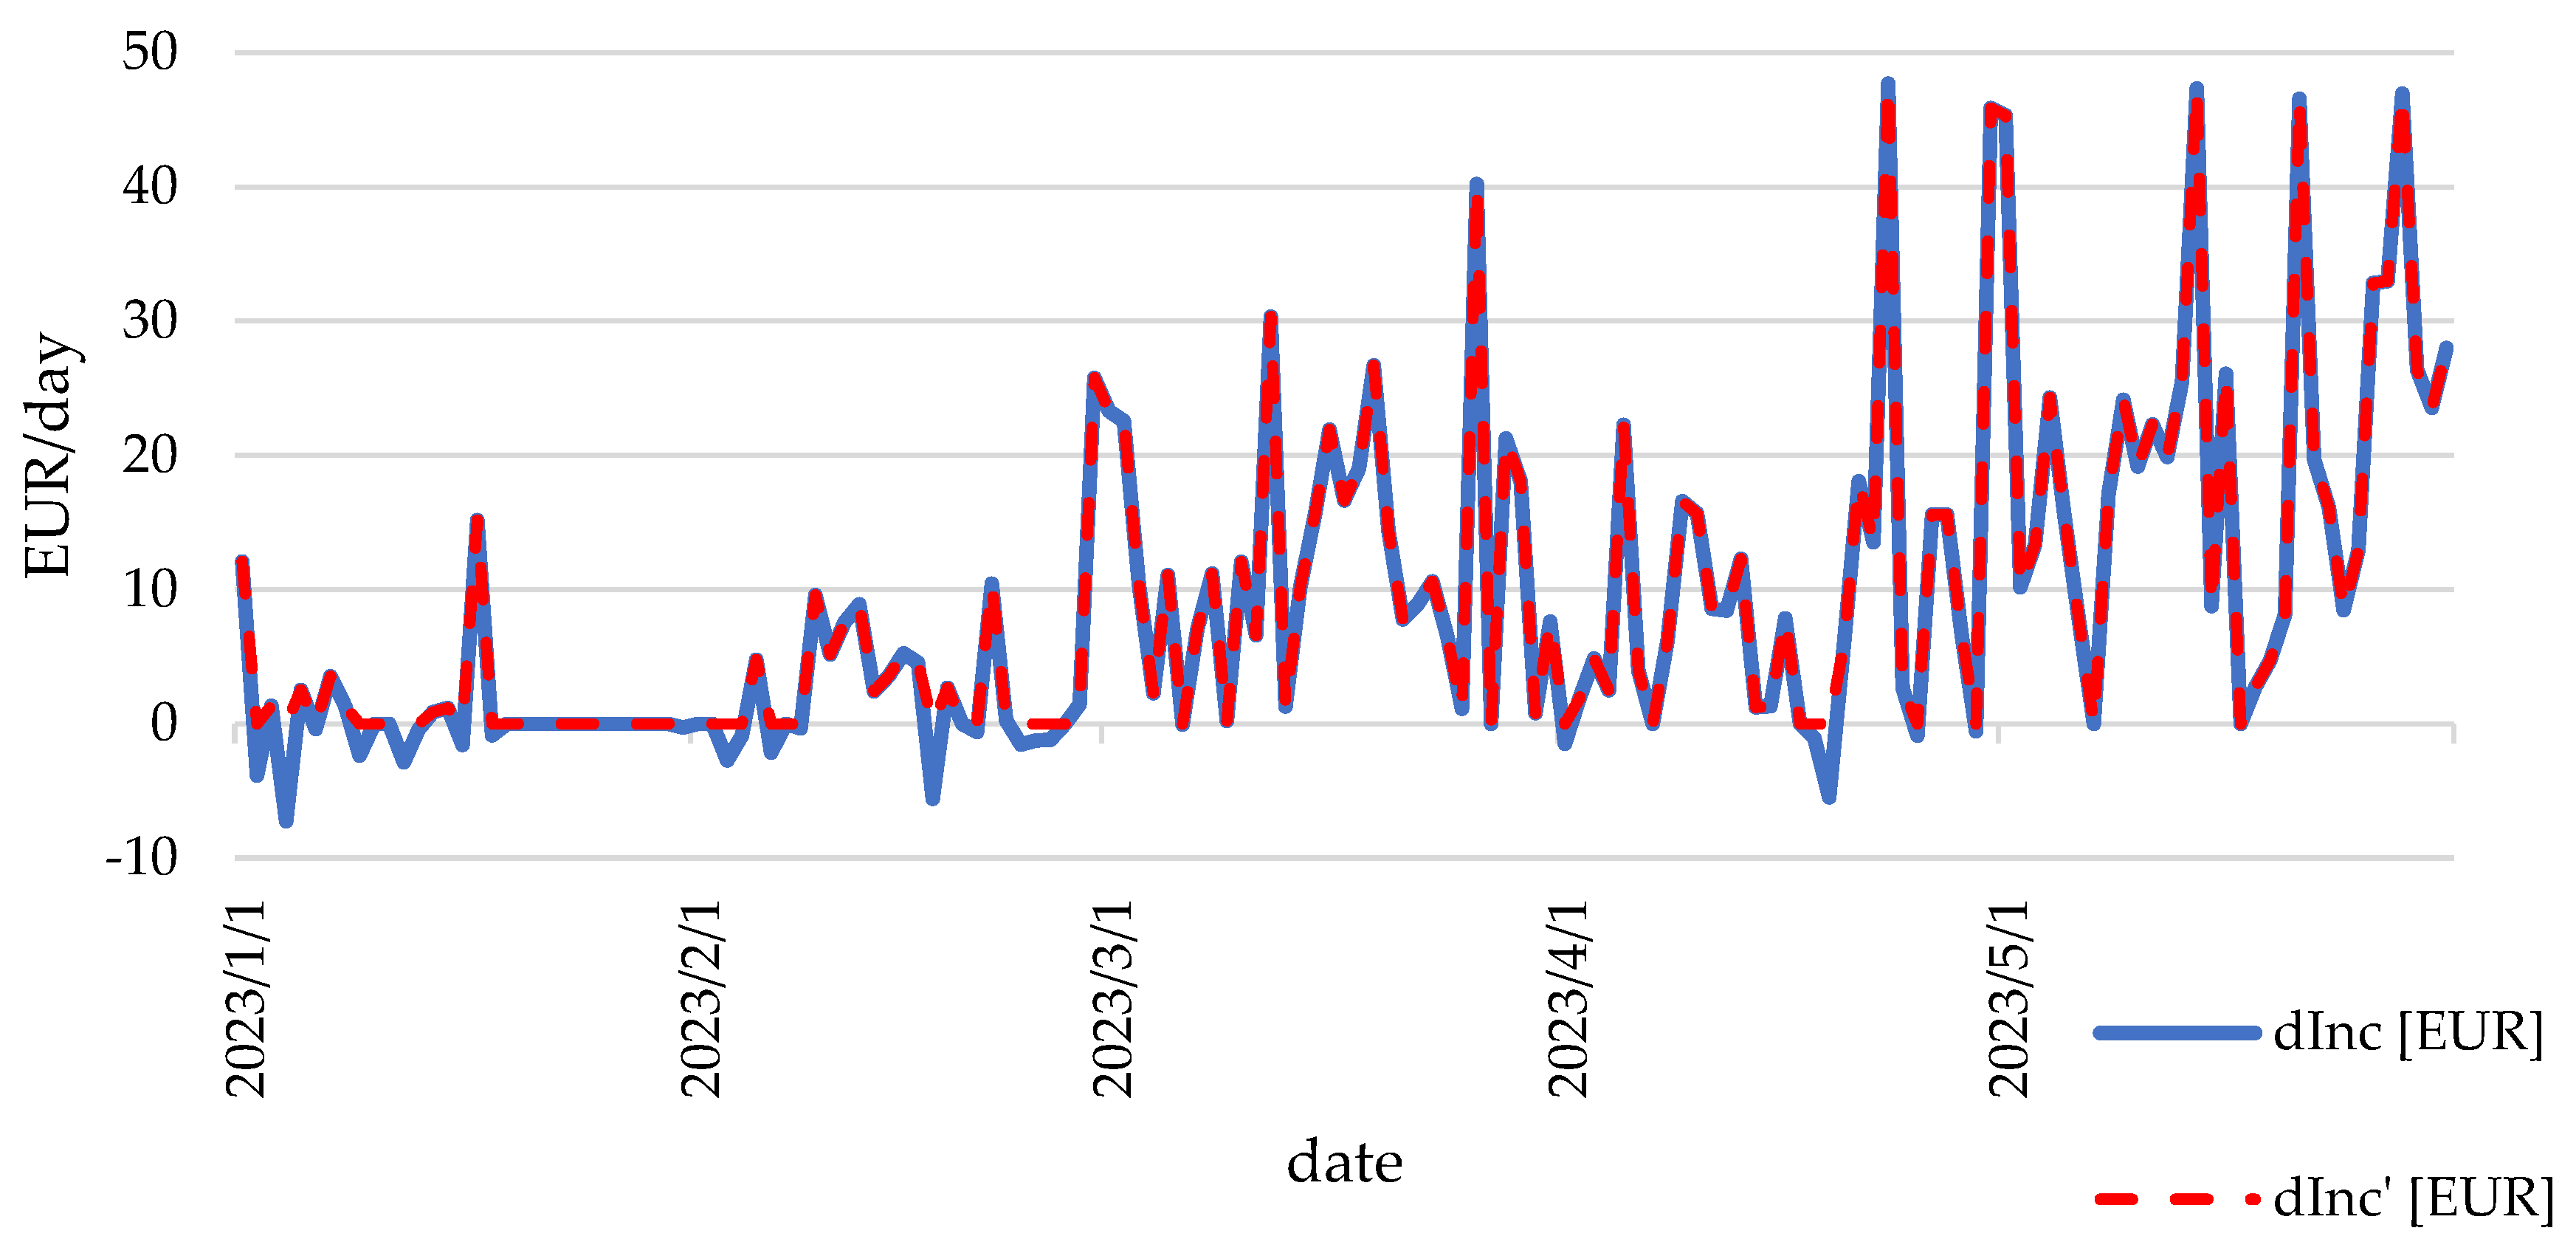
| dInc | Hourly difference due to energy storage, EUR |
| dInc’ | Hourly adjusted economic effect in the form of revenue difference, EUR |
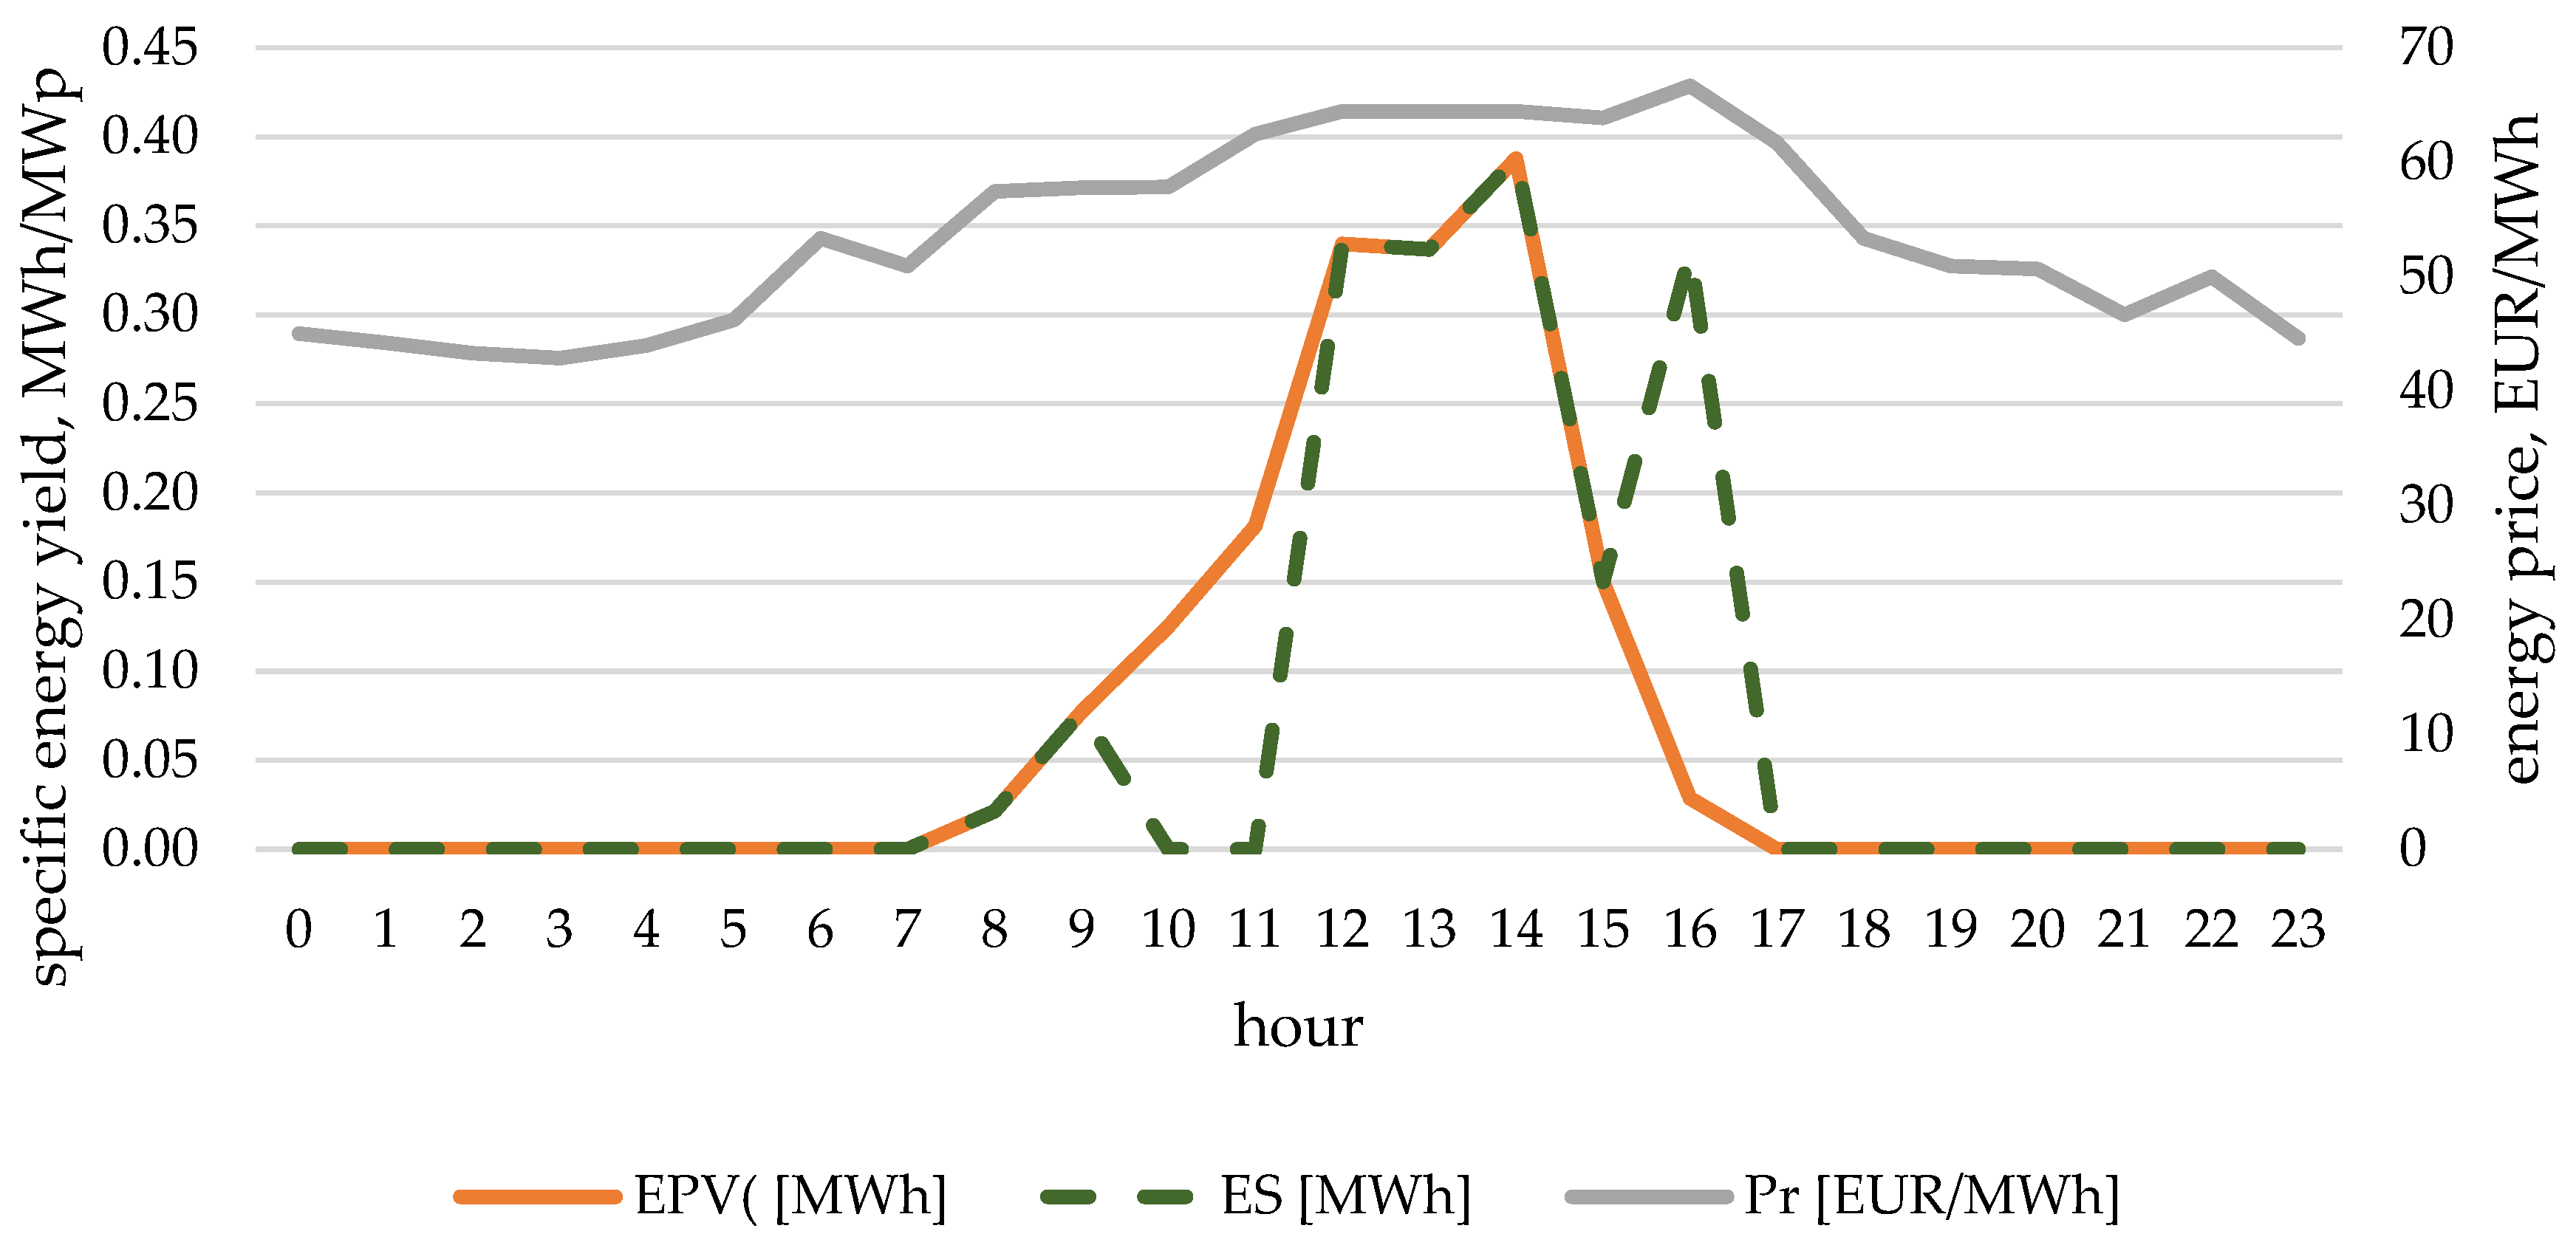
| EPV | Electricity production by an installation with a rated capacity of 1 MWp, MWh |
| EPV0 | Hourly baseline energy production by an installation with a rated capacity of 5.04 kWp, MWh |
| EPV1 | The amount of minimum electricity production at which energy storage was considered |
| ES | Energy sent to the grid: the value of energy production by the photovoltaic installation minus the value of stored energy in a given hour, or the value of energy sent from the process of discharging the energy storage, MWh |
| ES0 | Useful capacity of energy storage, MWh |
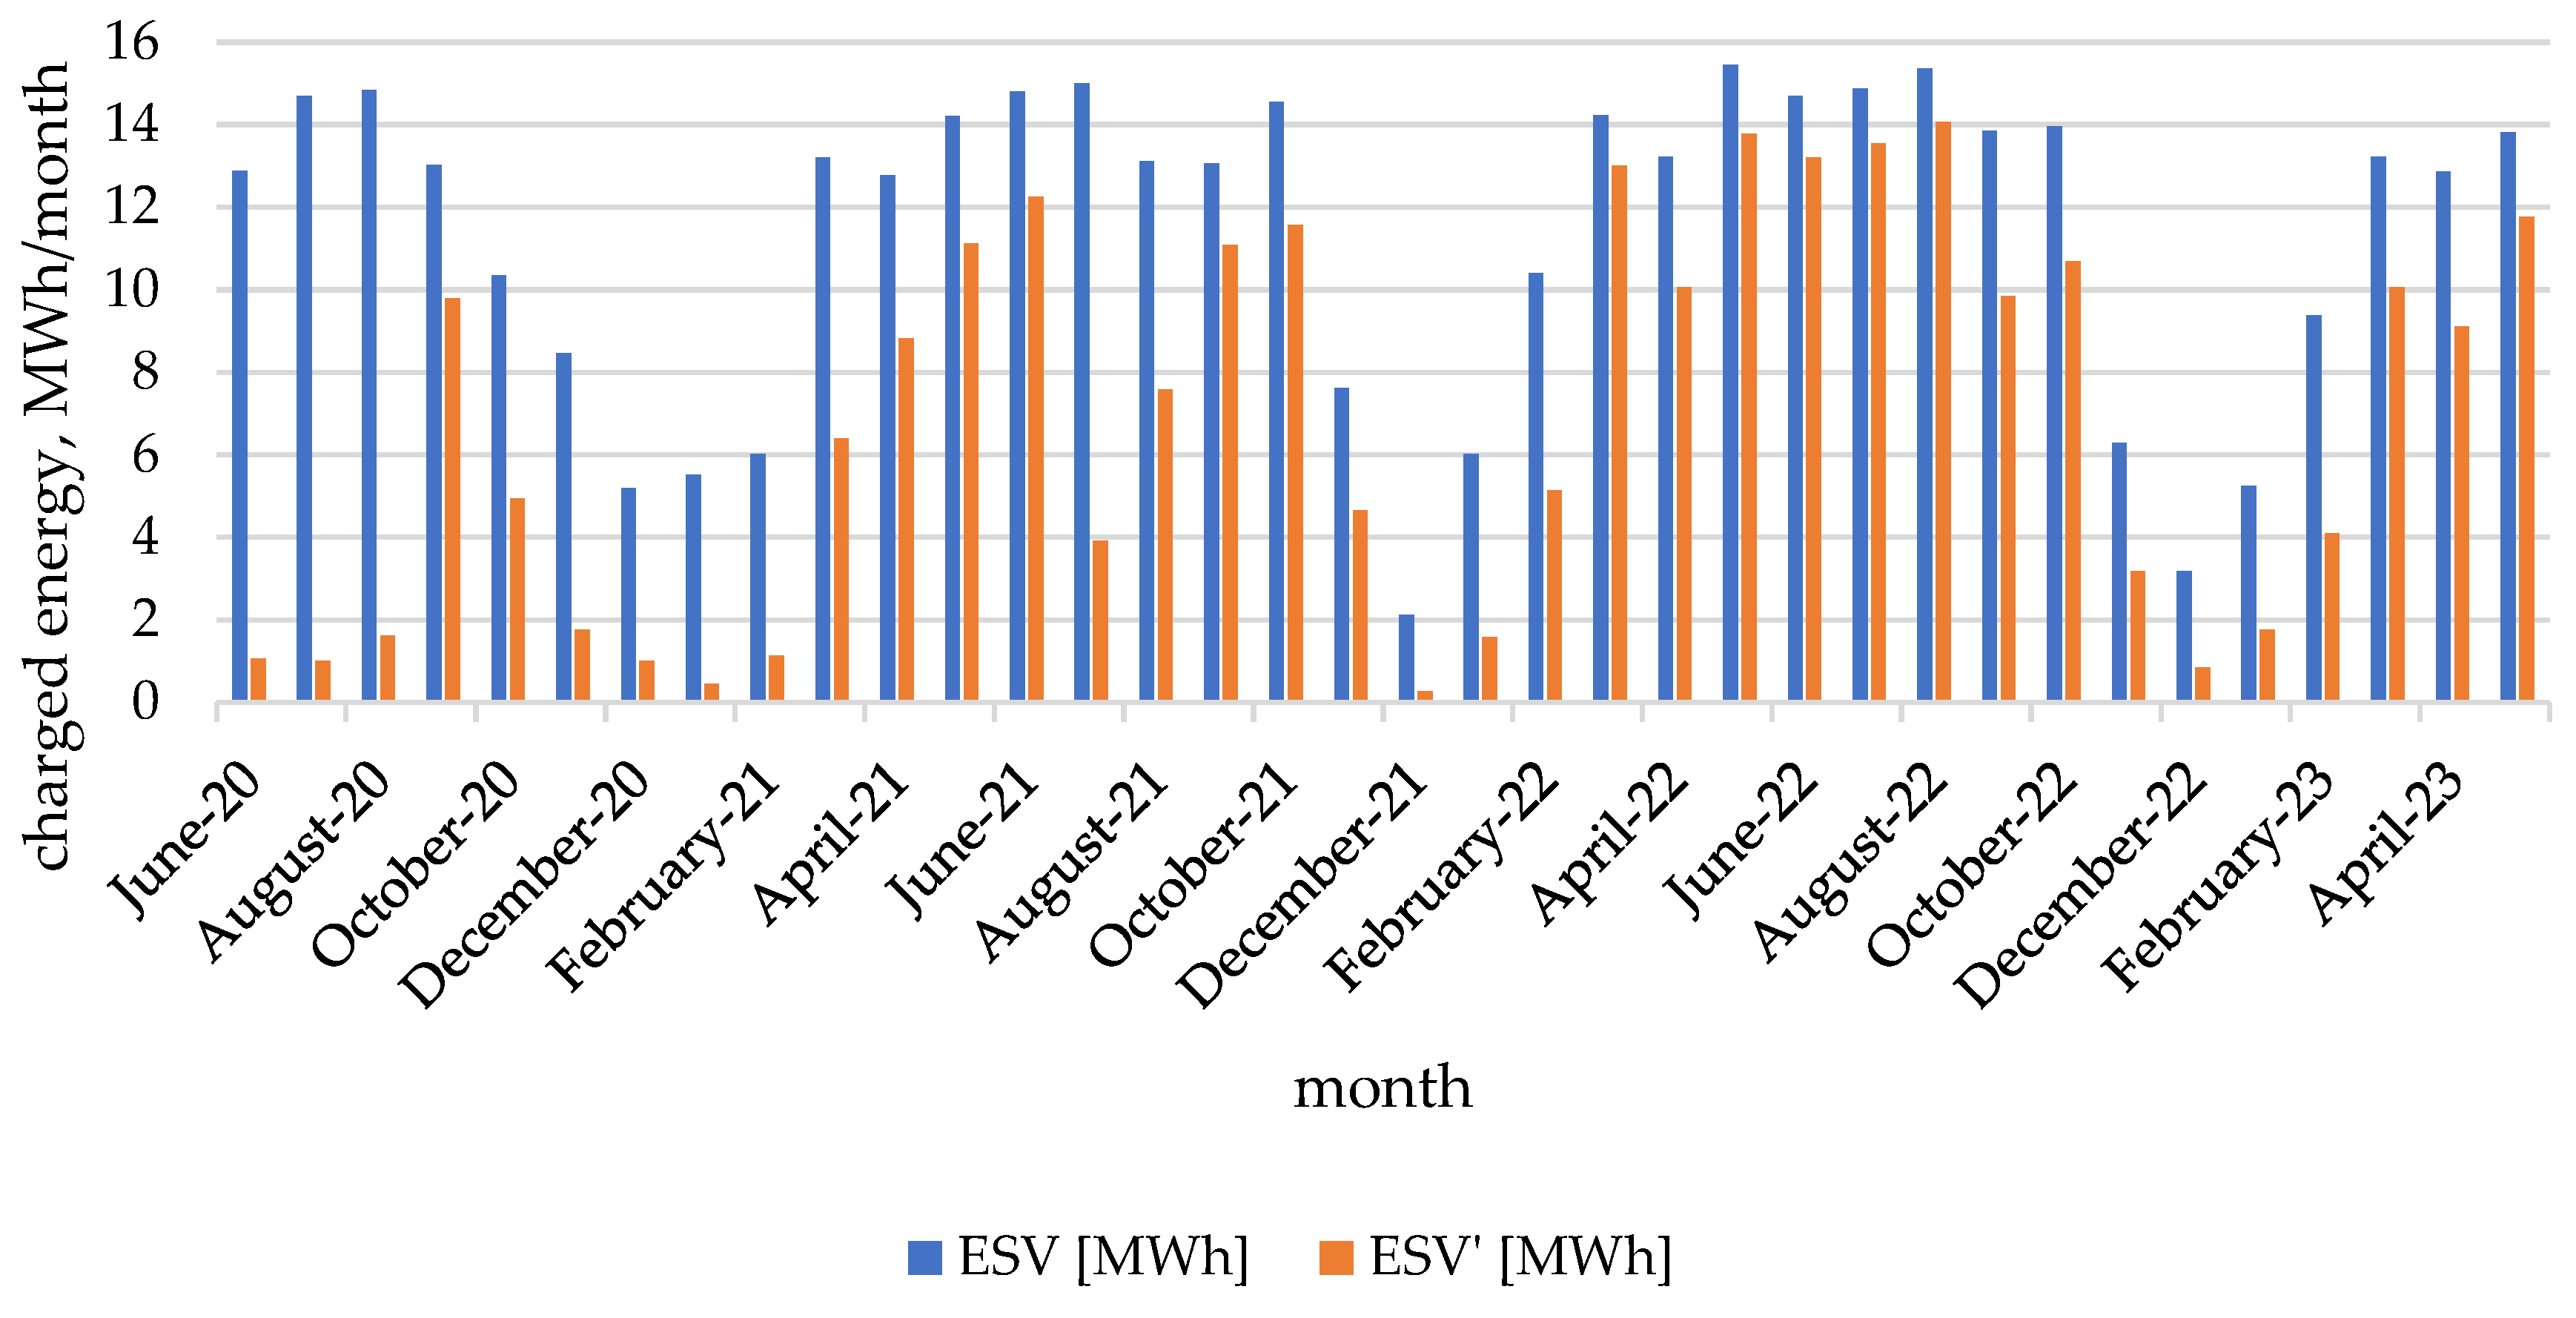
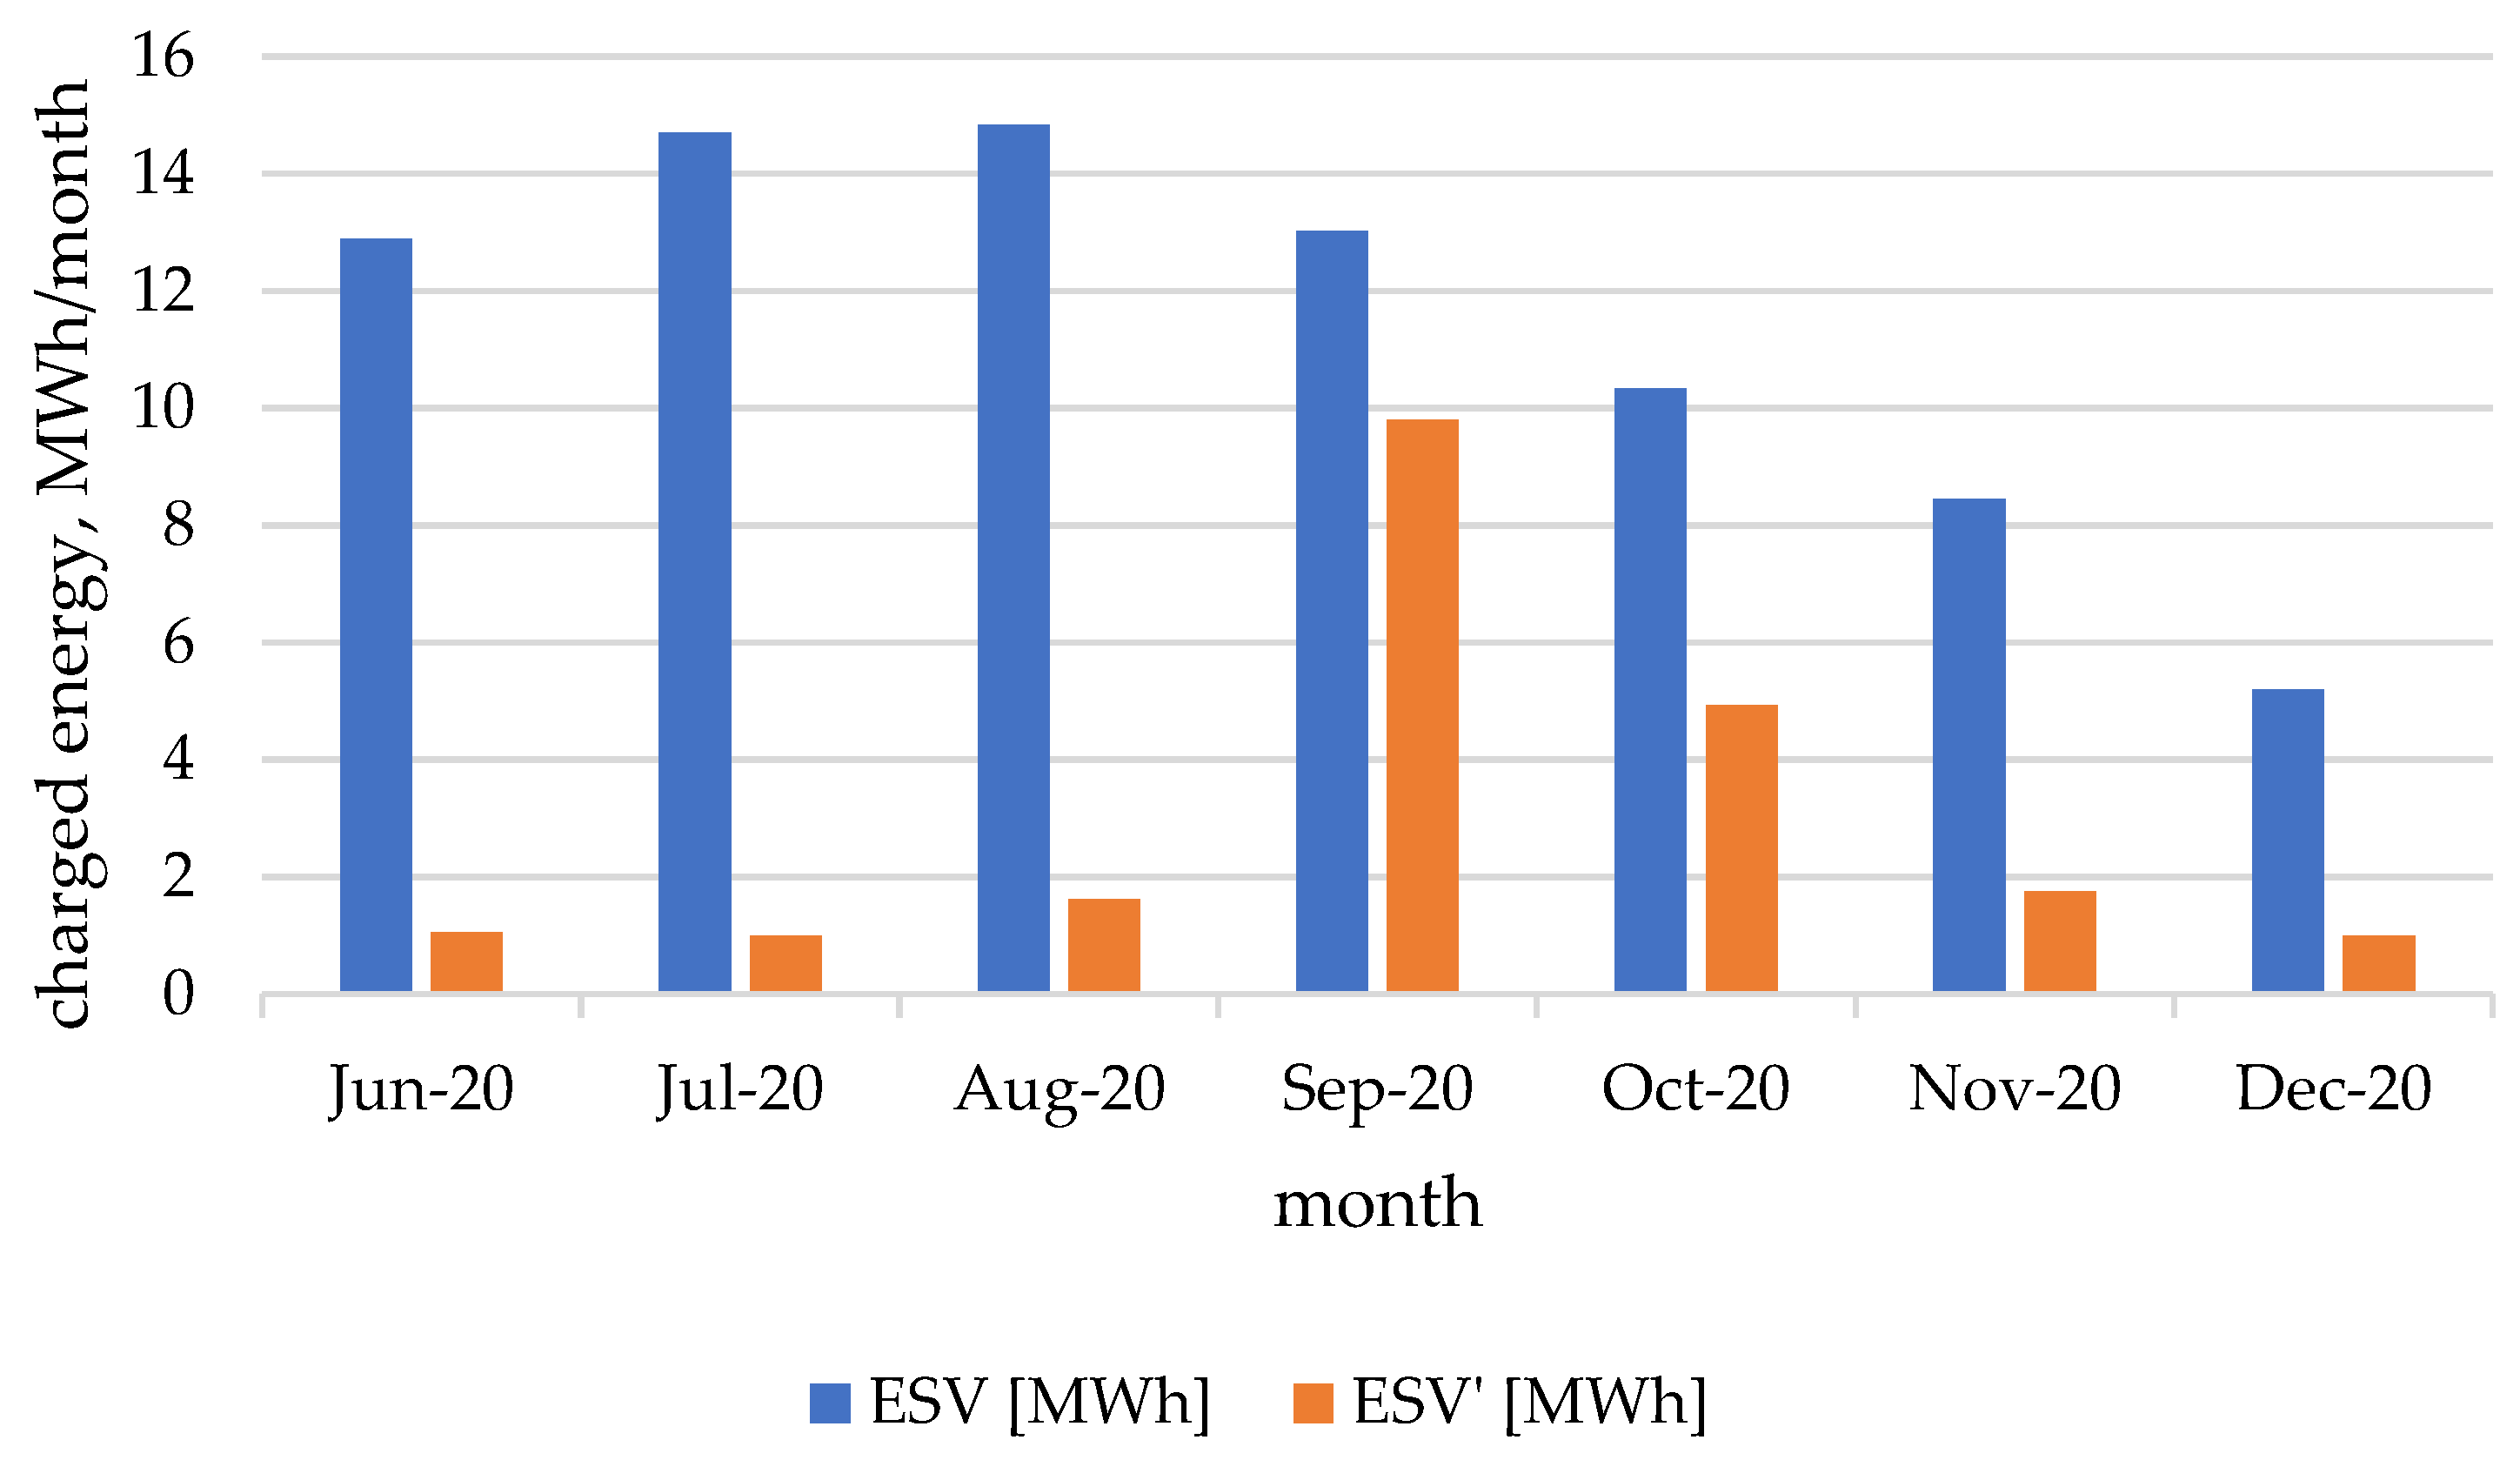
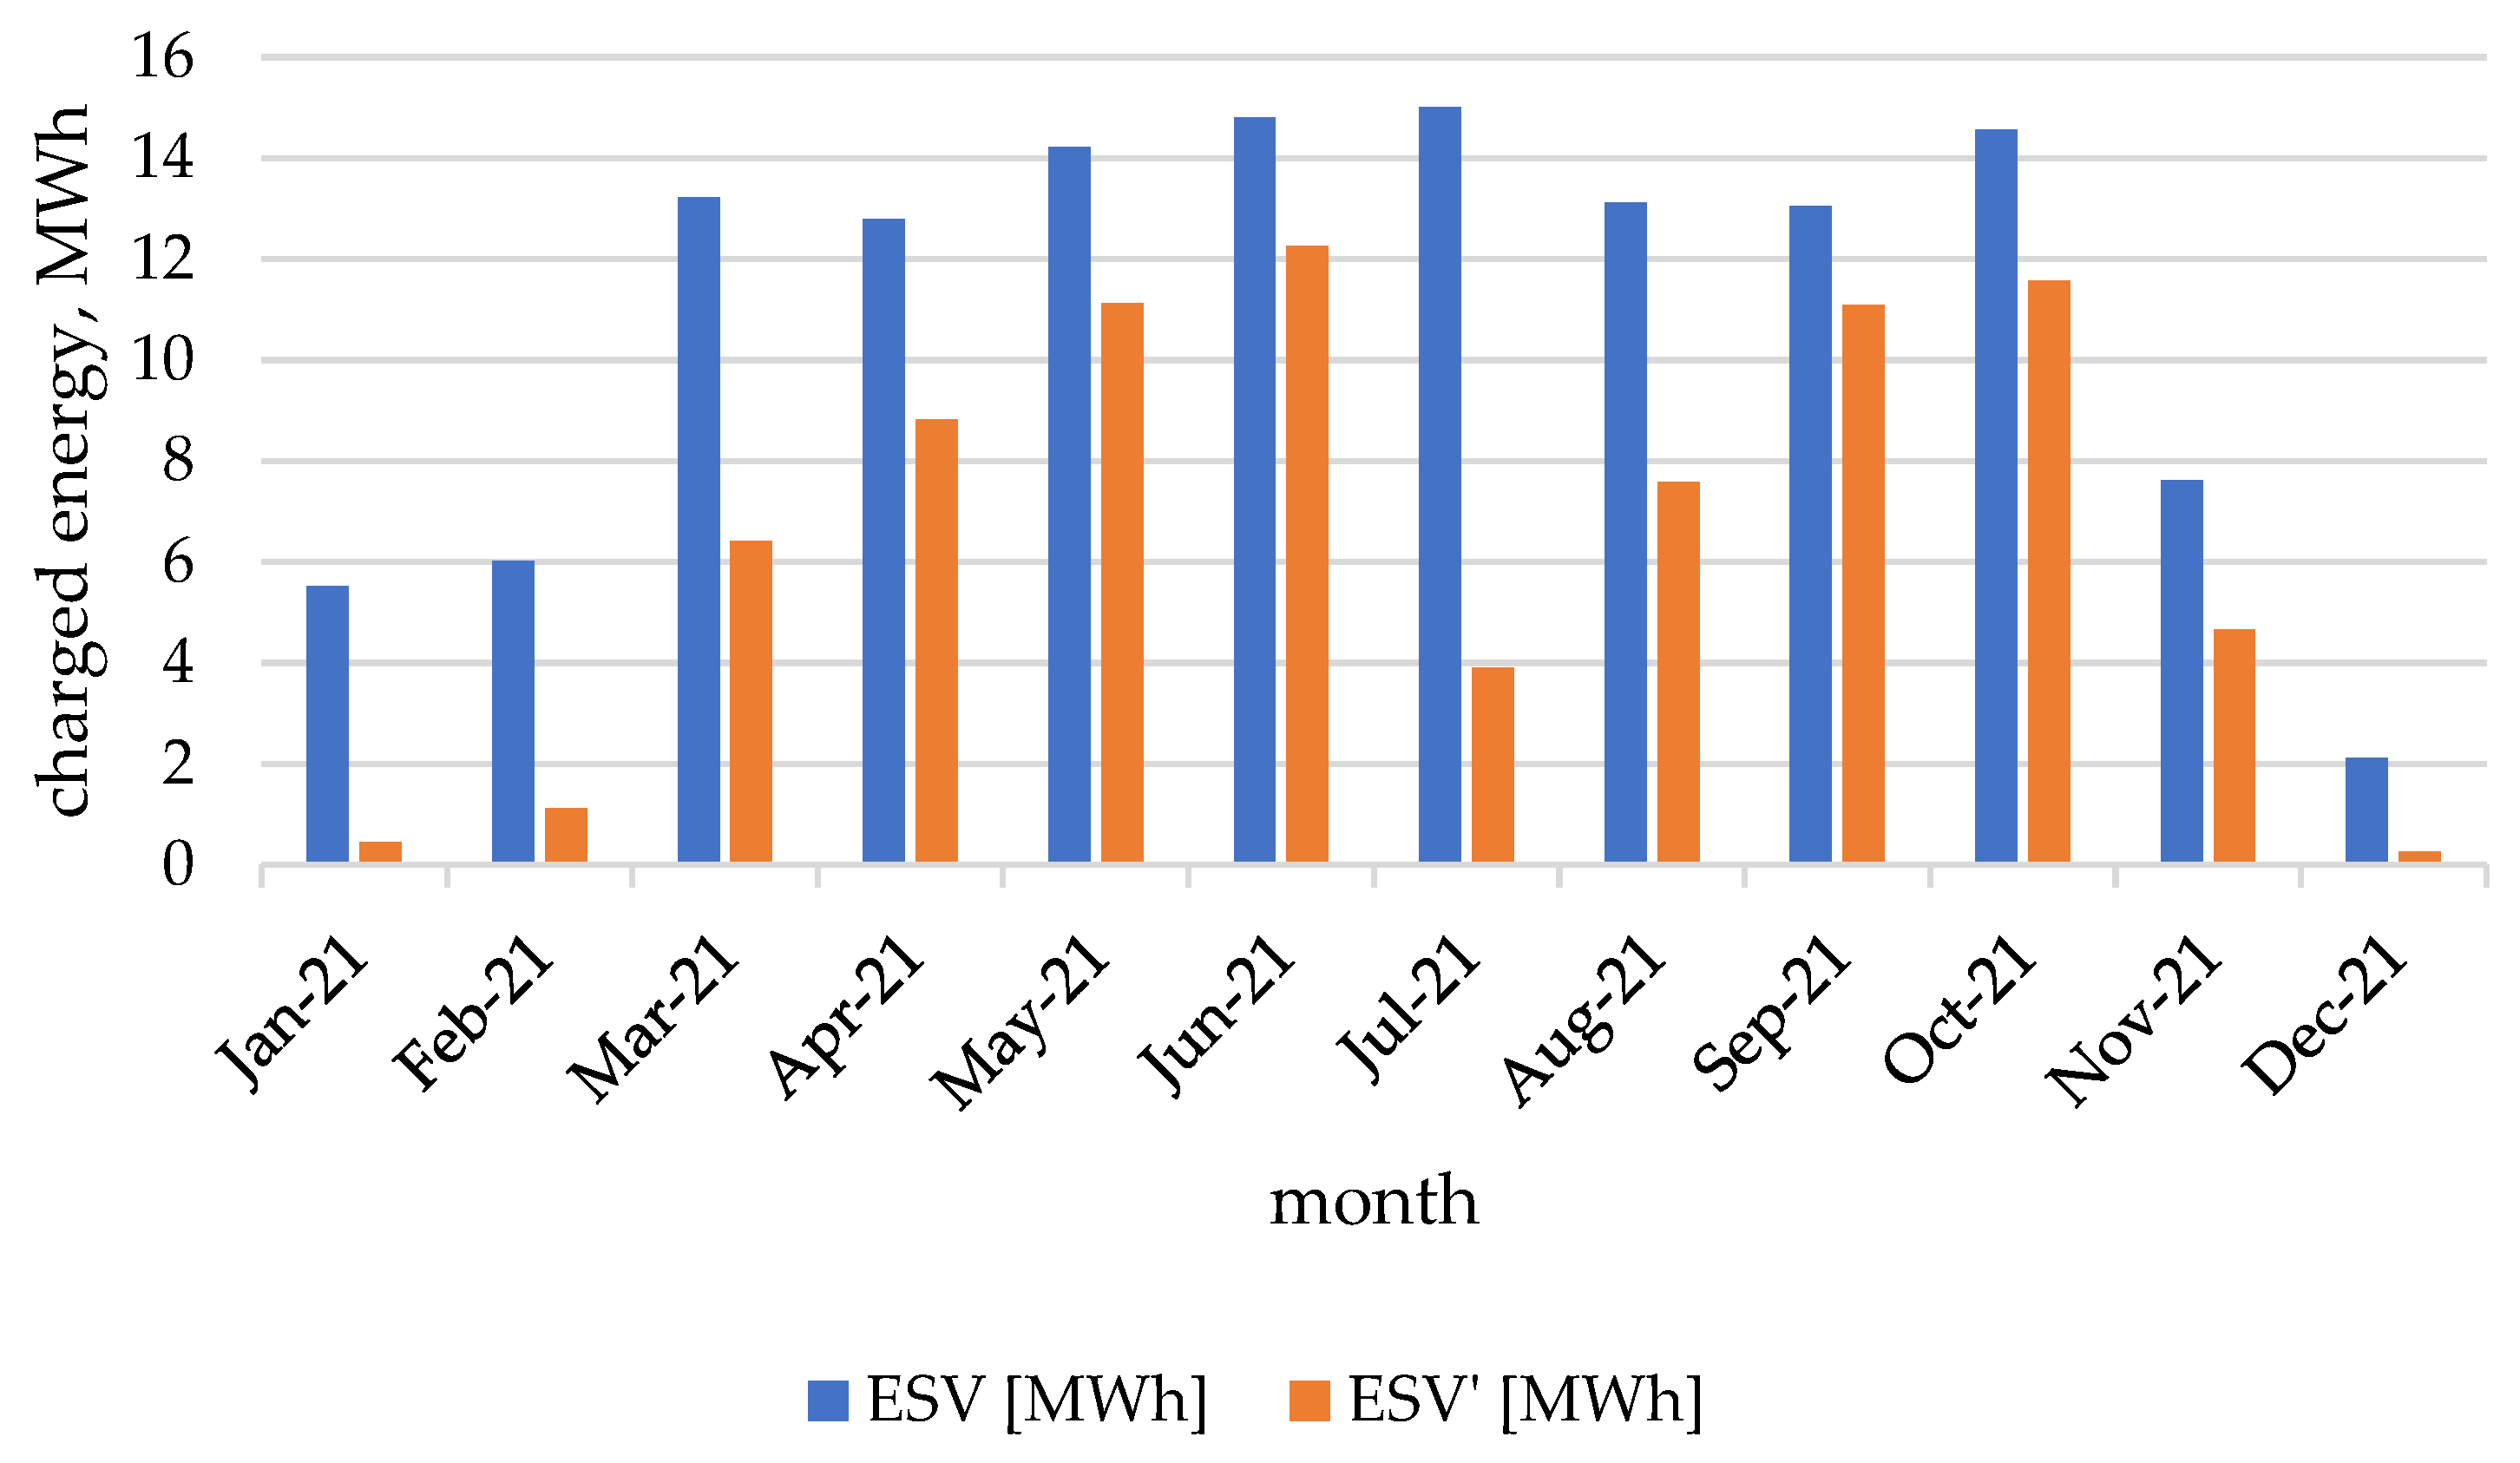
| ESV | The amount of energy transmitted to the storage in a given hour, MWh |
| hd | Hour of the day (hd ∈ 〈1, 24〉) |
| hd(min(Pr1(day)), hd(min(2Pr1(day))) | Hour of occurrence of the lowest and second lowest electricity price |
| Inc0 | Hourly monetary value of electricity produced (without energy storage), EUR |
| IncS | Hourly monetary value of electricity produced (with energy storage), EUR |
| KSE | National grid |
| max(Pr2(day)) | The highest value of electricity price of a given day under the condition of EPV1, EUR/MWh |
| max(vPr2(day)) | The maximum value from the electricity price vector, EUR/MWh |
| minPr1(day) | The minimum value of the price of electricity on a daily basis, EUR/MWh |
| min(vPr1(day)) | The minimum value from the vector of electricity prices on a daily scale, EUR/MWh |
| min2Pr1(day) | The second lowest value of electricity price on a given day under the condition of EPV1, EUR/MWh |
| min(vPr1(day)∖min(Pr1(day)) | The minimum value from the electricity price vector excluding the minimum value of the electricity price, EUR/MWh |
| NoC | Number of cycles |
| PPV | Rated power of the photovoltaic installation (PPV = 1 MWp), MWp |
| PPV0 | Rated power of the primary photovoltaic installation, MWp |
| Pr | DAM energy price, EUR/MWh |
| RES | Renewable energy source |
| TGE | Polish Power Exchange |
| vPr1 | Vector of electricity prices (the values occur only for the case of the presence of parallel PV power generation at min EPV1) |
| vPr2 | Vector of electricity prices |
| Greek symbols: | |
| Hour | |
| Number of the hour determining the beginning of the year | |
| Hour number defining the end of the year | |
References
- Rafał, K.; Grabowski, P. Magazynowanie Energii. ACADEMIA Mag. Pol. Akad. Nauk. 2023, 34–40. [Google Scholar] [CrossRef]
- Harasimczuk, M. Hybrydowy system magazynowania energii fotowoltaicznej. Pozn. Univ. Technol. Acad. J. Electr. Eng. 2016, 87, 109–118. [Google Scholar]
- Ceran, B.; Jurasz, J.; Mielcarek, A.; Campana, P.E. PV Systems Integrated with Commercial Buildings for Local and National Peak Load Shaving in Poland. J. Clean. Prod. 2021, 322, 129076. [Google Scholar] [CrossRef]
- Ceran, B.; Mielcarek, A.; Hassan, Q.; Teneta, J.; Jaszczur, M. Aging Effects on Modelling and Operation of a Photovoltaic System with Hydrogen Storage. Appl. Energy 2021, 297, 117161. [Google Scholar] [CrossRef]
- Sobczyk, W.; Sobczyk, E.J. Varying the Energy Mix in the EU-28 and in Poland as a Step towards Sustainable Development. Energies 2021, 14, 1502. [Google Scholar] [CrossRef]
- Jurasz, J.; Ciapała, B. A Solar- and Wind-Powered Charging Station for Electric Buses Based on a Backup Batteries Concept. In ICT for Electric Vehicle Integration with the Smart Grid; 2019; pp. 317–335. Available online: https://digital-library.theiet.org/content/books/10.1049/pbtr016e_ch12 (accessed on 18 July 2023).
- Kuta, M. Mobilized Thermal Energy Storage (M-TES) System Design for Cooperation with Geothermal Energy Sources. Appl. Energy 2023, 332, 120567. [Google Scholar] [CrossRef]
- Kuta, M.; Matuszewska, D.; Wójcik, T.M. The Role of Phase Change Materials for the Sustainable Energy. E3S Web Conf. 2016, 10, 00068. [Google Scholar] [CrossRef]
- Dyczko, A.; Kamiński, P.; Stecuła, K.; Prostański, D.; Kopacz, M.; Kowol, D. Thermal and Mechanical Energy Storage as a Chance for Energy Transformation in Poland. Polityka Energetyczna Energy Policy J. 2021, 24, 43–60. [Google Scholar] [CrossRef]
- Kulpa, J.; Kamiński, P.; Stecuła, K.; Prostański, D.; Matusiak, P.; Kowol, D.; Kopacz, M.; Olczak, P. Technical and Economic Aspects of Electric Energy Storage in a Mine Shaft—Budryk Case Study. Energies 2021, 14, 7337. [Google Scholar] [CrossRef]
- Zdonek, I.; Tokarski, S.; Mularczyk, A.; Turek, M. Evaluation of the Program Subsidizing Prosumer Photovoltaic Sources in Poland. Energies 2022, 15, 846. [Google Scholar] [CrossRef]
- Olczak, P.; Matuszewska, D. Energy Storage Potential Needed at the National Grid Scale (Poland) in Order to Stabilize Daily Electricity Production from Fossil Fuels and Nuclear Power. Energies 2023, 16, 6054. [Google Scholar] [CrossRef]
- Lin, Y.; Johnson, J.X.; Mathieu, J.L. Emissions Impacts of Using Energy Storage for Power System Reserves. Appl. Energy 2016, 168, 444–456. [Google Scholar] [CrossRef]
- Chwieduk, D.; Bujalski, W.; Chwieduk, B. Possibilities of Transition from Centralized Energy Systems to Distributed Energy Sources in Large Polish Cities. Energies 2020, 13, 6007. [Google Scholar] [CrossRef]
- Koval, V.; Sribna, Y.; Gaska, K. Energy Cooperation Ukraine-Poland to Strengthen Energy Security. E3S Web Conf. 2019, 132, 1009. [Google Scholar] [CrossRef]
- Koval, V.; Sribna, Y.; Mykolenko, O.; Vdovenko, N. Environmentalconcept of energy security solutions of local communities based on energy logistics. In Proceedings of the 19th International Multidisciplinary Scientific GeoConference SGEM 2019, Sofia, Bulgaria, 28 June–7 July 2019; Volume 19, pp. 283–290. [Google Scholar]
- Mikhno, I.; Redkva, O.; Udovychenko, V.; Tsimoshynska, O.; Koval, V.; Kopacz, M. Sustainable Energy Supply Management in the Mechanical-Engineering Industry. Polityka Energetyczna Energy Policy J. 2022, 25, 39–54. [Google Scholar] [CrossRef]
- Adamska, B. Magazyny Energii Niezbędnym Elementem Transformacji Energetycznej. Energetyka Rozproszona 2022, 7, 55–61. [Google Scholar] [CrossRef]
- Piwowar, A.; Dzikuć, M.; Dzikuć, M. The Potential of Wind Energy Development in Poland in the Context of Legal and Economic Changes. Acta Polytech. Hung. 2023, 20, 145–156. [Google Scholar] [CrossRef]
- Dzikuć, M.; Dzikuć, M. The Development of Photovoltaics in the Visegrad Group Countries. Hradec Econ. Days 2022. [Google Scholar] [CrossRef]
- Paska, J.; Surma, T.; Terlikowski, P.; Zagrajek, K. Electricity Generation from Renewable Energy Sources in Poland as a Part of Commitment to the Polish and EU Energy Policy. Energies 2020, 13, 4261. [Google Scholar] [CrossRef]
- Kaszyński, P.; Komorowska, A.; Zamasz, K.; Kinelski, G.; Kamiński, J. Capacity Market and (the Lack of) New Investments: Evidence from Poland. Energies 2021, 14, 7843. [Google Scholar] [CrossRef]
- Lepszy, S. Analysis of the Storage Capacity and Charging and Discharging Power in Energy Storage Systems Based on Historical Data on the Day-Ahead Energy Market in Poland. Energy 2020, 213, 118815. [Google Scholar] [CrossRef]
- Rogus, Radomir; Soltysik, Maciej; Czapaj, Rafal Application of Similarity Analysis in PV Sources Generation Forecasting for Energy Clusters. E3S Web Conf. 2019, 84, 1009. [CrossRef]
- Pieczarko, R.; Sołtysik, M. Analysis of the Impact of Wind Sources Generation on the Level of Electricity Prices on the SPOT Market. Przegląd Elektrotechniczny 2017, 93. [Google Scholar] [CrossRef]
- Kaczmarzewski, S.; Olczak, P.; Sołtysik, M. The Impact of Electricity Consumption Profile in Underground Mines to Cooperate with RES. Energies 2021, 14, 5775. [Google Scholar] [CrossRef]
- Kaczmarzewski, S.; Matuszewska, D.; Sołtysik, M. Analysis of Selected Service Industries in Terms of the Use of Photovoltaics before and during the COVID-19 Pandemic. Energies 2022, 15, 188. [Google Scholar] [CrossRef]
- Mirowski, T.; Sornek, K. Potential of Prosumer Power Engineering in Poland by Example of Micro PV Installation in Private Construction. Energy Policy J. 2015, 18, 73–84. [Google Scholar]
- Olczak, P.; Żelazna, A.; Stecuła, K.; Matuszewska, D.; Lelek, Ł. Environmental and Economic Analyses of Different Size Photovoltaic Installation in Poland. Energy Sustain. Dev. 2022, 70, 160–169. [Google Scholar] [CrossRef]
- Dzikuć, M.; Gorączkowska, J.; Piwowar, A.; Dzikuć, M.; Smoleński, R.; Kułyk, P. The Analysis of the Innovative Potential of the Energy Sector and Low-Carbon Development: A Case Study for Poland. Energy Strategy Rev. 2021, 38, 100769. [Google Scholar] [CrossRef]
- Hansen, P. Optimising Shared Renewable Energy Systems: An Institutional Approach. Energy Res. Soc. Sci. 2021, 73, 101953. [Google Scholar] [CrossRef]
- Syed, M.M.; Hansen, P.; Morrison, G.M. Performance of a Shared Solar and Battery Storage System in an Australian Apartment Building. Energy Build. 2020, 225, 110321. [Google Scholar] [CrossRef]
- Olczak, P.; Komorowska, A. An Adjustable Mounting Rack or an Additional PV Panel? Cost and Environmental Analysis of a Photovoltaic Installation on a Household: A Case Study in Poland. Sustain. Energy Technol. Assess. 2021, 47, 101496. [Google Scholar] [CrossRef]
- Olczak, P. Comparison of Modeled and Measured Photovoltaic Microinstallation Energy Productivity. Renew. Energy Focus 2022, 43, 246–254. [Google Scholar] [CrossRef]
- TGE SA Polish. Day-Ahead Market. Available online: https://tge.pl/electricity-dam (accessed on 18 July 2023).
- Benalcazar, P.; Komorowska, A.; Kamiński, J. A GIS-Based Method for Assessing the Economics of Utility-Scale Photovoltaic Systems. Appl. Energy 2024, 353, 122044. [Google Scholar] [CrossRef]
- Boduch, A.; Mik, K.; Castro, R.; Zawadzki, P. Technical and Economic Assessment of a 1 MWp Floating Photovoltaic System in Polish Conditions. Renew. Energy 2022, 196, 983–994. [Google Scholar] [CrossRef]
- Igliński, B.; Piechota, G.; Kiełkowska, U.; Kujawski, W.; Pietrzak, M.B.; Skrzatek, M. The Assessment of Solar Photovoltaic in Poland: The Photovoltaics Potential, Perspectives and Development. Clean Technol. Environ. Policy 2023, 25, 281–298. [Google Scholar] [CrossRef]
- Trela, M.; Dubel, A. Comparing the Support Systems for Renewable Energy Sources in Poland Green Certificates vs Auction Systems. Polityka Energetyczna Energy Policy J. 2017, 20, 105–116. [Google Scholar]
- Zołądek, M.; Filipowicz, M.; Sornek, K.; Figaj, R.D. Energy Performance of the Photovoltaic System in Urban Area—Case Study. In IOP Conference Series: Earth and Environmental Science; IOP Publishing: Bristol, UK, 2019; p. 012123. [Google Scholar]
- Filipowicz, M.; Musilek, P.; Gulkowski, S. Specific Yield Analysis of the Rooftop PV Systems Located in South-Eastern Poland. Energies 2022, 15, 3666. [Google Scholar] [CrossRef]
- Kreft, W.; Filipowicz, M.; Żołądek, M. Reduction of Electrical Power Loss in a Photovoltaic Chain in Conditions of Partial Shading. Optik 2020, 202, 163559. [Google Scholar] [CrossRef]
- NREL Commercial Battery Storage. Available online: https://atb.nrel.gov/electricity/2022/commercial_battery_storage#QASDZMI6 (accessed on 3 January 2023).


| Year | Income from PV Energy Production Inc0, EUR | Income from PV Energy Production and Storage IncS, EUR |
|---|---|---|
| 6/2020–5/2021 | 53,071 | 53,273 |
| 6/2021–5/2022 | 106,097 | 111,222 |
| 6/2022–5/2023 | 144,437 | 157,294 |
| Sum | 303,605 | 321,789 |
| Year | Additional Income dInc, EUR | Adjusted Economic Impact dInc’, EUR |
|---|---|---|
| 6/2020–5/2021 | 202.52 | 404.88 |
| 6/2021–5/2022 | 5124.84 | 5283.42 |
| 6/2022–5/2023 | 12,859.46 | 12,942.66 |
| Sum | 18,186.82 | 18,630.96 |
| Year | NoC |
|---|---|
| 6/2020–5/2021 | 98 |
| 6/2021–5/2022 | 189 |
| 6/2022–5/2023 | 204 |
| Sum | 491 |
Disclaimer/Publisher’s Note: The statements, opinions and data contained in all publications are solely those of the individual author(s) and contributor(s) and not of MDPI and/or the editor(s). MDPI and/or the editor(s) disclaim responsibility for any injury to people or property resulting from any ideas, methods, instructions or products referred to in the content. |
© 2023 by the authors. Licensee MDPI, Basel, Switzerland. This article is an open access article distributed under the terms and conditions of the Creative Commons Attribution (CC BY) license (https://creativecommons.org/licenses/by/4.0/).
Share and Cite
Ross, K.; Matuszewska, D.; Olczak, P. Analysis of Using Hybrid 1 MWp PV-Farm with Energy Storage in Poland. Energies 2023, 16, 7654. https://doi.org/10.3390/en16227654
Ross K, Matuszewska D, Olczak P. Analysis of Using Hybrid 1 MWp PV-Farm with Energy Storage in Poland. Energies. 2023; 16(22):7654. https://doi.org/10.3390/en16227654
Chicago/Turabian StyleRoss, Klaudia, Dominika Matuszewska, and Piotr Olczak. 2023. "Analysis of Using Hybrid 1 MWp PV-Farm with Energy Storage in Poland" Energies 16, no. 22: 7654. https://doi.org/10.3390/en16227654
APA StyleRoss, K., Matuszewska, D., & Olczak, P. (2023). Analysis of Using Hybrid 1 MWp PV-Farm with Energy Storage in Poland. Energies, 16(22), 7654. https://doi.org/10.3390/en16227654