Article

Load Capacity of Nickel–Metal Hydride Battery and Proton-Exchange-Membrane Fuel Cells in the Fuel-Cell-Hybrid-Electric-Vehicle Powertrain

Institute of Combustion Engines and Powertrains, Faculty of Civil and Transport Engineering, Poznan University of Technology, 60-965 Poznan, Poland
*
Author to whom correspondence should be addressed.
Energies 2023, 16(22), 7657; https://doi.org/10.3390/en16227657
Submission received: 19 October 2023 / Revised: 15 November 2023 / Accepted: 16 November 2023 / Published: 19 November 2023
(This article belongs to the Special Issue Battery Modelling, Applications, and Technology)

Abstract

:
This article investigates the impact of loading on the hybrid powertrain of the FCAT-30 model, equipped with a proton-exchange-membrane fuel cell (PEMFC) and a nickel–metal hydride (NiMH) battery. This study involves analyzing structural component performance based on voltage and current measurements of the fuel cell, battery, and powertrain. Tests conducted under different load conditions reveal significant differences in battery current and fuel-cell voltage, highlighting the crucial role of the battery in the powertrain. External loading induces cyclic operation of the fuel cell, generating peak power. The energy balance analysis demonstrates that, under no-load conditions, the vehicle consumes 37.3% of its energy from the fuel cell, with a total energy consumption of 3597 J. Under load, the energy from the battery is significantly utilized, resulting in a constant fuel-cell share of approximately 19%, regardless of the vehicle’s load. This study concludes that the battery predominantly drives the powertrain, with the fuel cell acting as a secondary energy source. These findings provide valuable insights into the power distribution and energy balance in the hybrid powertrain. Using a load driving profile reduced the fuel-cell-stack energy contribution by 6.85% relative to driving without an external load.

1. Introduction

With constant technological advances and growing environmental awareness, the transportation sector is constantly looking for innovative solutions that meet the growing needs of mobility and minimize the negative effects on the environment. The share of vehicles using electric propulsion is steadily increasing in the global market [1,2,3]. Fuel-cell hybrid electric vehicles (FCHEVs) are a promising alternative, combining the advantages of electric vehicles with a proton-exchange-membrane (PEM) fuel cell [2].
Reducing dependence on fossil fuels, such as oil and natural gas, has gained worldwide acceptance. As a result, the development and intensive use of renewable energy has become an inherent trend. However, most renewable energy sources are characterized by intermittent access, which requires the development of efficient energy storage and generation systems [4,5]. Today, the use of renewable energy to produce hydrogen is gaining popularity and recognition, further supporting the development of fuel-cell technology.
Hydrogen production is expected to triple by 2050, driven by its falling cost [6]. In 2021, a total of 51,437 FCHEVs were registered worldwide [7]. There were 729 hydrogen refueling stations in operation at the time [6]. The results of the analysis by Samsun et al. [8] clearly indicate a very favorable trend in the development of fuel-cell vehicles and hydrogen refueling stations in 2021. The authors in their article [9] point out that for any vehicle with a range greater than 160 km (100 miles), fuel cells are superior to batteries in terms of weight, energy efficiency, and life-cycle costs.
A comparative analysis of internal-combustion-engine vehicles (ICEVs) and FCHEVs [10] shows that emissions, maintenance, operating costs, and efficiency are much more favorable for FCHEVs.
Fuel cells, unlike many traditional energy sources, do not emit pollutants during the power generation process. The electrochemical process in fuel cells is based on a chemical reaction between hydrogen and oxygen, generating clean electricity, with the only byproduct being water. This makes fuel cells one of the greenest solutions for electricity generation [11,12,13,14]. The battery in the vehicle performs the function of managing the dynamic response of the vehicle under varying load conditions [10].
The fuel cells used in the first prototype vehicles (in 2002) achieved a volumetric power factor of 1.0 kW/dm3 with a mass power factor of 0.75 kW/kg [15]. In the FCHV model (in 2008), these ratios were 1.45 kW/dm3 and 0.9 kW/kg, respectively. The first-generation Toyota Mirai, equipped with nickel–metal hydride (NiMH) batteries, had values of 3.1 kW/dm3 and 2 kW/kg, while the new generation of the Mirai (Li-ion battery) vehicle achieves 5.4 kW/dm3 (4.4 kW/kg excluding end plates) and 5.4 kW/kg, respectively [16,17].
Honda used 103 kW fuel cells in the Clarity model, for which the volumetric and mass power factors were 3.1 kW/dm3 and 2.0 kW/kg, respectively [18,19]. The system uses a Li-ion battery with a capacity of 25.5 kWh [20]. The Hyundai Nexo uses a 95 kW cell and a 40 kWh battery [21,22]. The BMW iX5 Hydrogen is equipped with a 125 kW cell and a battery with a very small capacity of 2 kWh [23,24].
The development of Li-ion batteries can be seen in terms of changes in specific energy: from 90 Wh/kg in 1990 to more than 250 Wh/kg today [25,26,27]. Their cost has now been reduced from $1000 to about $250 per kilowatt-hour (kW/h) [25,28].
A very important aspect is the study of PEM fuel cells during different loads from the perspective of optimizing their performance under different operating conditions, which directly affects the efficiency of the entire FCHEV system [29].
Optimal operating conditions for a fuel cell are crucial for its efficient operation. In this context, maintaining an optimal temperature plays an important role. Fuel cells, especially those based on PEM and solid-oxide-fuel-cell (SOFC) technology, show their best performance in a tightly controlled temperature range. For PEM fuel cells, maintaining a temperature of 60–80 °C is crucial, while SOFCs require higher temperatures, typically above 500 °C [30,31,32,33].
In addition, it is important to maintain appropriate humidity levels. Fuel cells, especially PEMs, are sensitive to ambient humidity, and ensuring proper humidity levels helps maintain proper proton conductivity, which affects the efficiency of electrochemical processes inside the cell [34,35]. The moisture content of the input gases supplied to the anode and cathode has been shown to have a significant impact on fuel-cell performance. Yan et al. [36] showed that lowering the humidity at the cathode negatively affects the steady-state and dynamic performance of the fuel cell. In the context of humidity control, in addition to the effect of humidity on the proton conductivity of membranes, it is worth noting that large-scale commercialization of proton-exchange fuel cells requires achieving higher power and current densities. Nonetheless, at high operating current densities, liquid water accumulation can lead to flooding problems and impede gas diffusion, which accelerates cell performance degradation [37,38]. Therefore, it is important to improve water management capabilities to achieve better cell efficiency.
Controlling the cleanliness of the fuel supplied to the cell also has an important role, as impurities, such as sulfur and particulate matter, can negatively affect the performance of the electrodes, resulting in reduced cell performance [39]. Ensuring the quality and purification of the fuel is key to maintaining optimal operating conditions [40]. Nonetheless, cells show great flexibility due to their ability to use a variety of fuels, such as hydrogen, methanol, natural gas, and biogas [41,42]. Despite the significant manufacturing cost of fuel cells, the benefits of this advanced solution are significant enough to make investment in them economically viable [43,44].
This research aims to determine how the external load on a chassis dynamometer affects the control strategy of a hybrid powertrain equipped with a fuel cell (low-temperature) and a nickel–metal hydride battery. By analyzing similar values of the energy stored in the battery and fuel cell, changes in the shares of energy coming from the two drive sources are identified. Due to the availability of the test object, this article examines a vehicle using nickel-based batteries. The presented research evaluates the impact of external loading on the drivetrain of the FCAT-30 model, a hydrogen hybrid vehicle equipped with a PEM fuel cell and NiMH battery. This study aims to understand the performance of structural components under different load conditions and extends the analysis to include the energy balance. The vehicle was subjected to tests with and without external loading on a chassis dynamometer, allowing for the measurement of voltage and current of the battery, fuel cell, and drivetrain.

2. Research Methodology
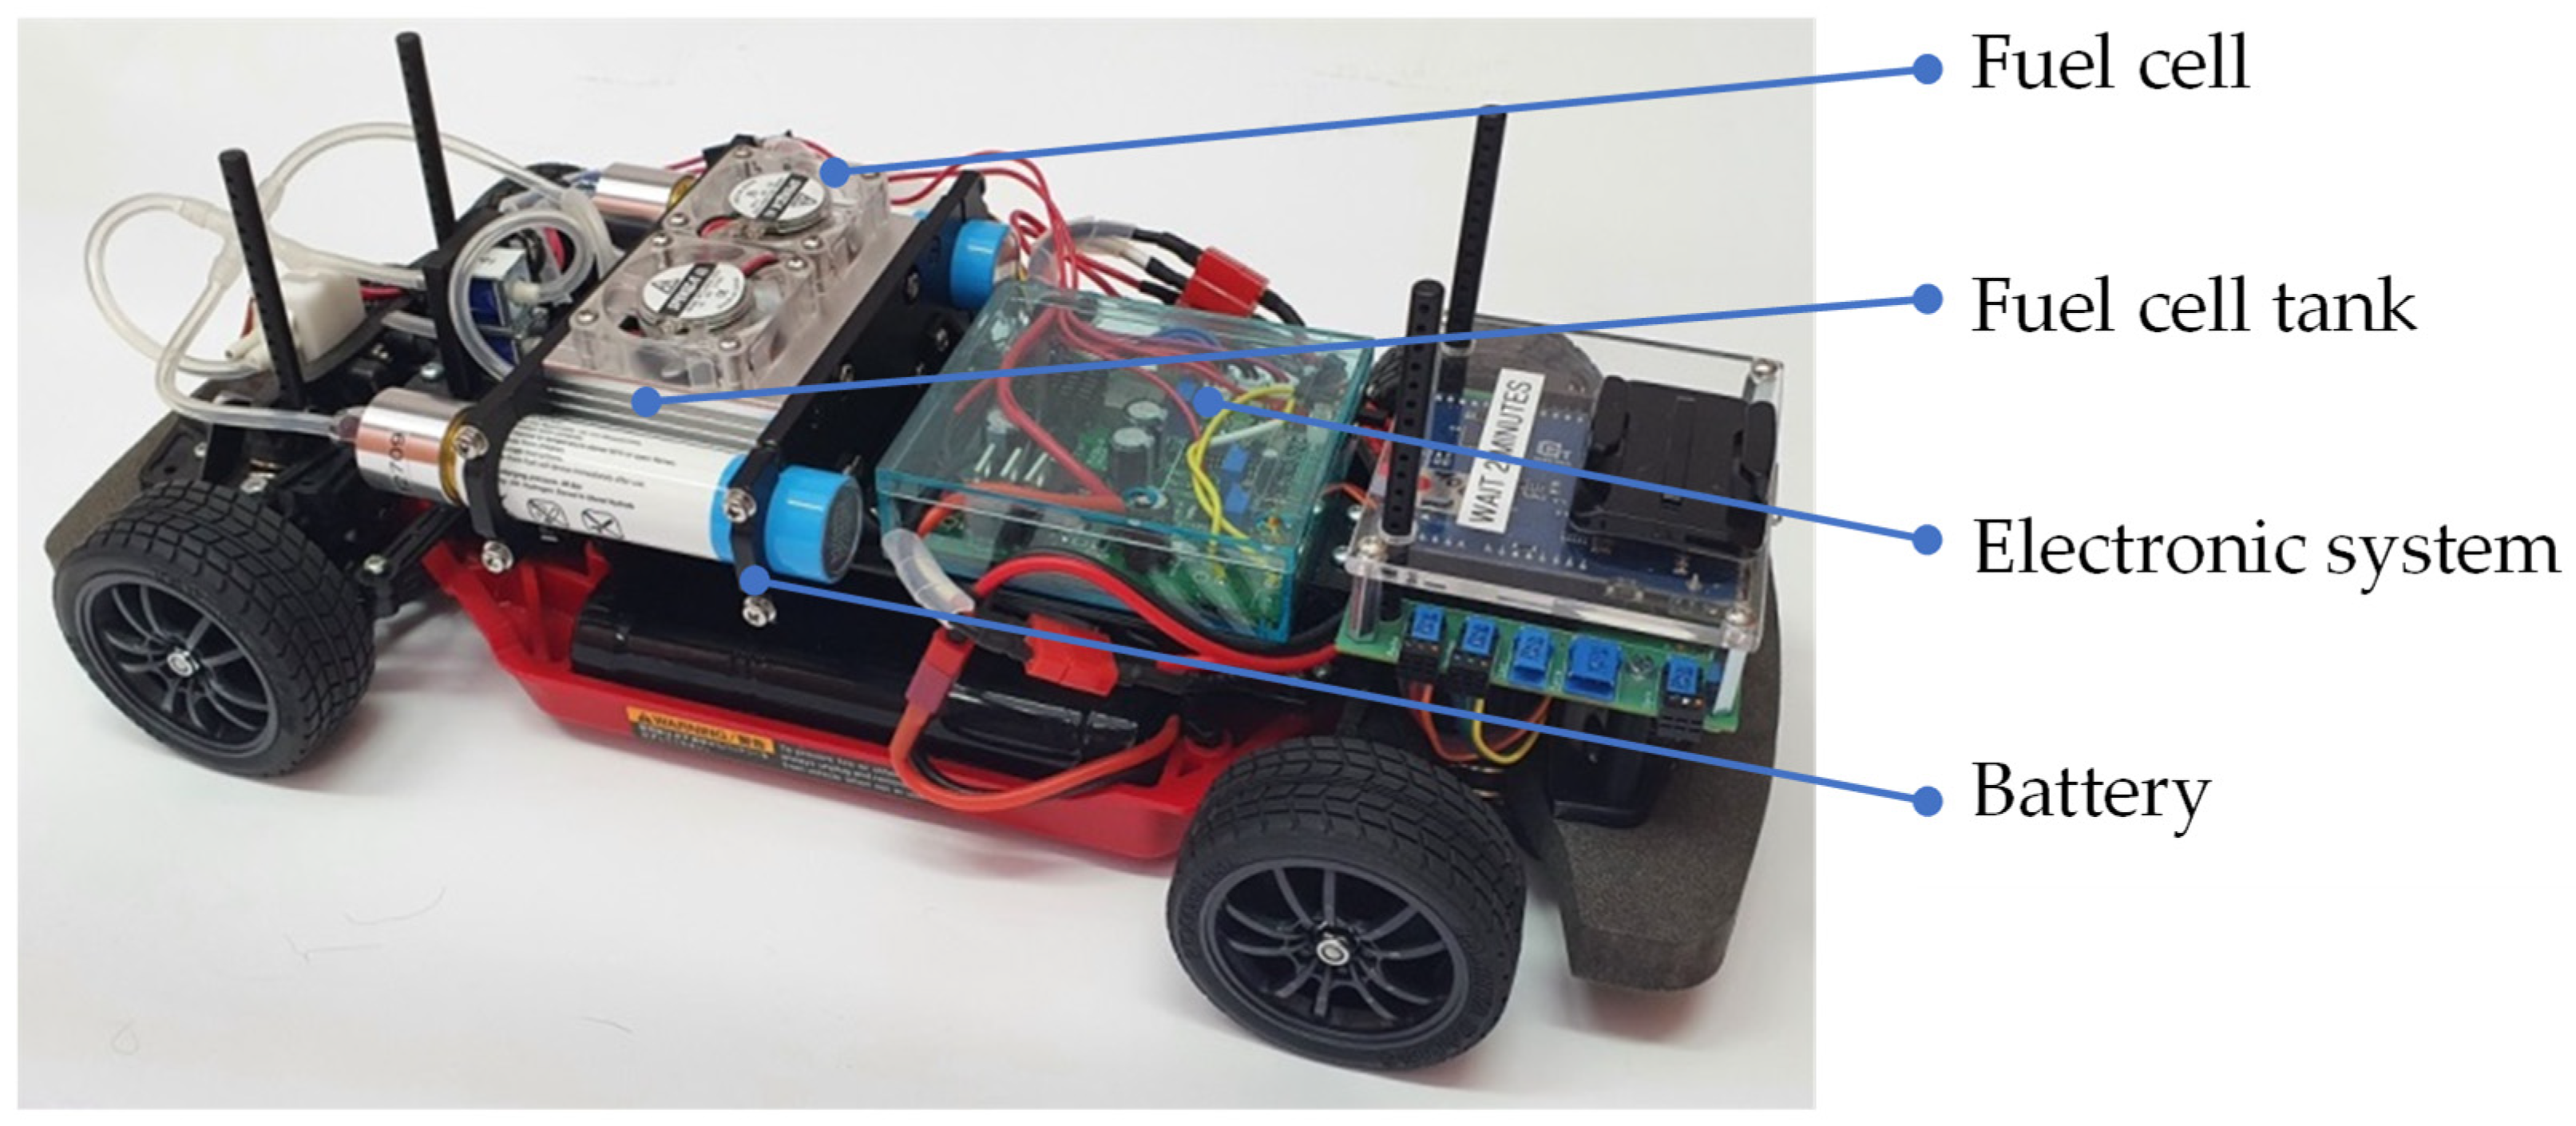
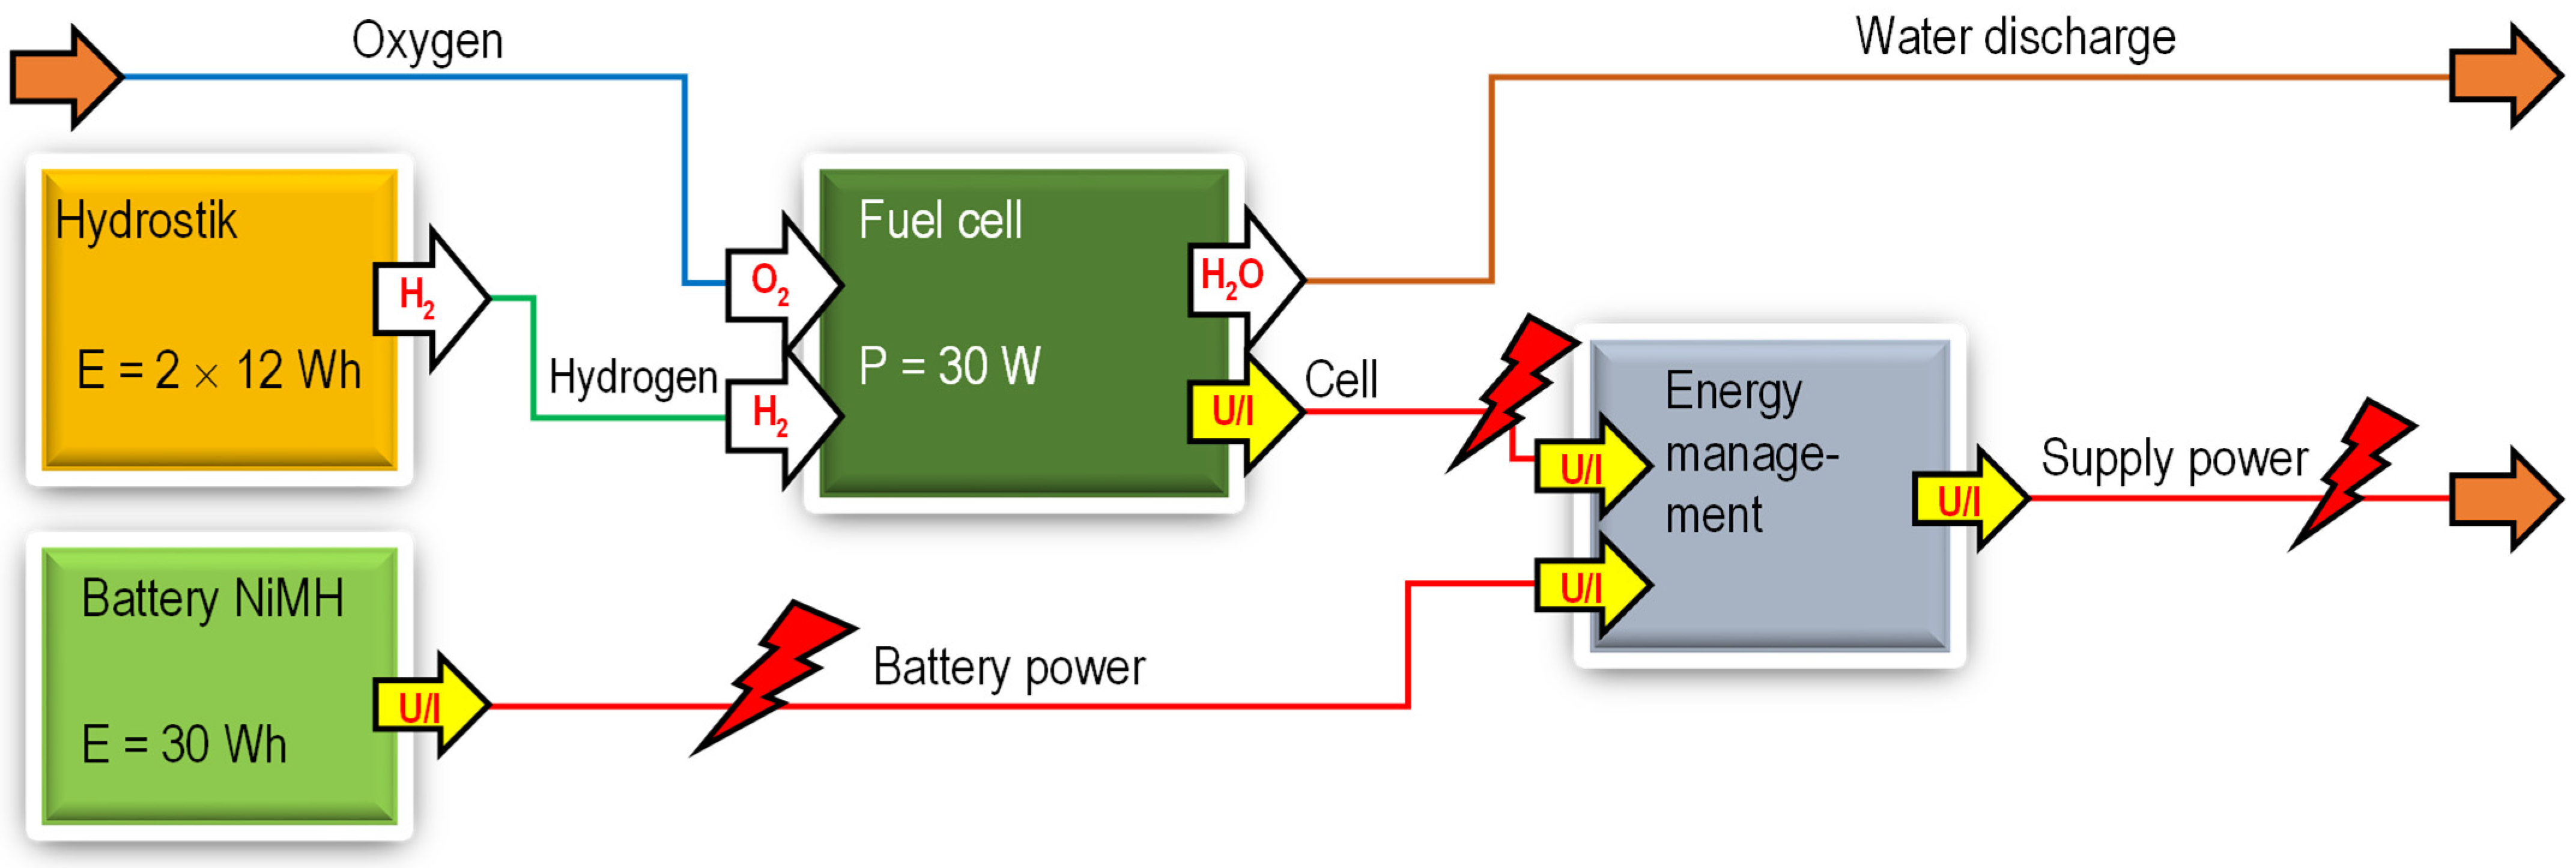
2.1. Study Object

This research was conducted using a model vehicle equipped with a hybrid drive system: a PEM-type fuel cell along with a NiMH battery (Figure 1). The remotely controlled 4 × 4 vehicle uses a low-temperature PEM-fuel-cell stack (Table 1) with two hydrogen storage tanks of 10 dm3 each, with a maximum hydrogen pressure of 30 bar. Mounted measurement systems allow real-time recording of typical vehicle movement parameters along with data acquisition of battery and fuel-cell voltage and current.
A static analysis of the energy flow (Figure 2) shows comparable values for the energy stored in the battery and hydrogen tanks, with a difference of about 20%, in favor of the NiMH battery. The battery used directly interacts with the energy management system, unlike the hydrogen energy, which is converted to electricity using a PEM fuel cell.
The detailed scheme of the system is shown in Figure 3. The vehicle was propelled by the Mabuchi RS-540SH-7520 electric motor, operating within a voltage range of 4.8–7.2 V. The motor attains its peak efficiency of 67% under the following operational parameters: P = 63.2 W, n = 19740 rpm, I = 13 A, Mo = 30.6 mNm. The metering system incorporates a fuel cell, battery, and energy flow controller from CREA Technologie. Owing to proprietary “know-how”, the complete system control details remain undisclosed. Arduino circuits were employed to manage the energy flow. The hybrid system is dependent on the chemical-energy battery, and its functionality is possible without the fuel-cell system. As depicted in Figure 3, there is the capability to recharge the electrochemical battery. Measurement data can be directly showcased in LabView or, alternatively, stored on an SD card for subsequent offline analysis on a computer.
This implies the possibility of a much higher load on the battery compared with the fuel cell. It follows that the share of the battery in variable load situations should be greater than that of the fuel cell. The energy flow diagram indicates a parallel drive system, which directly affects the voltage and current values in the results.

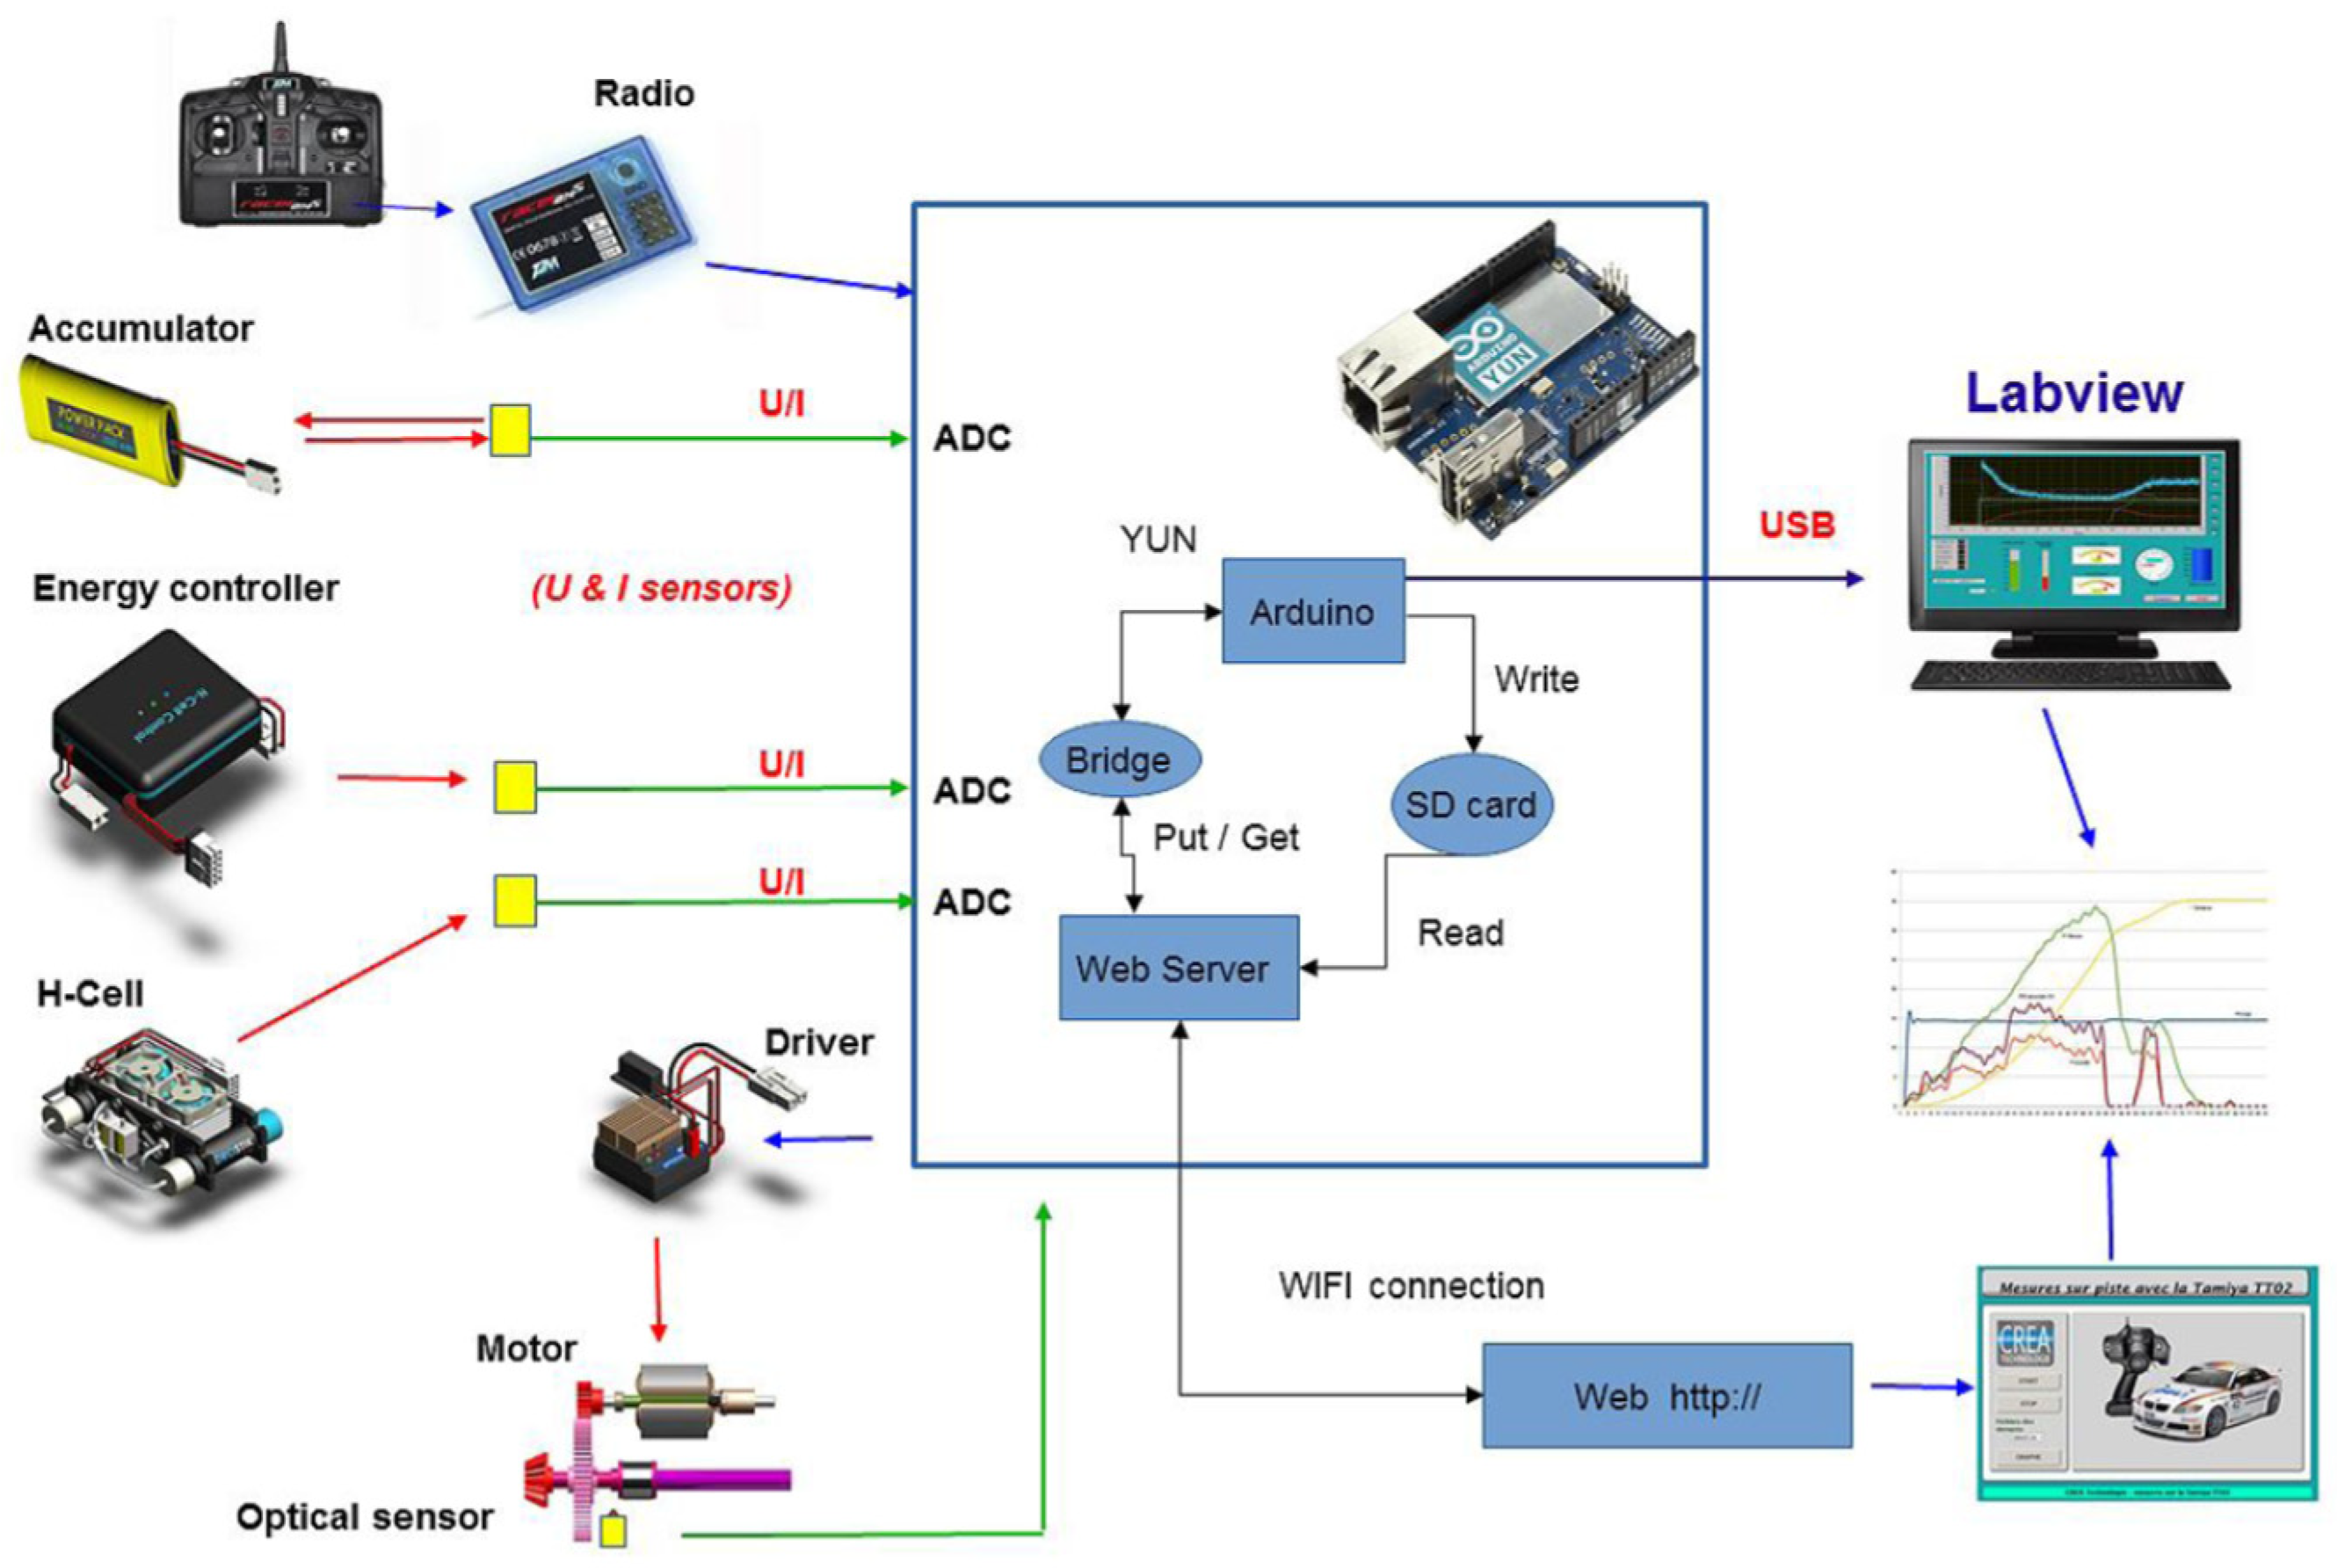
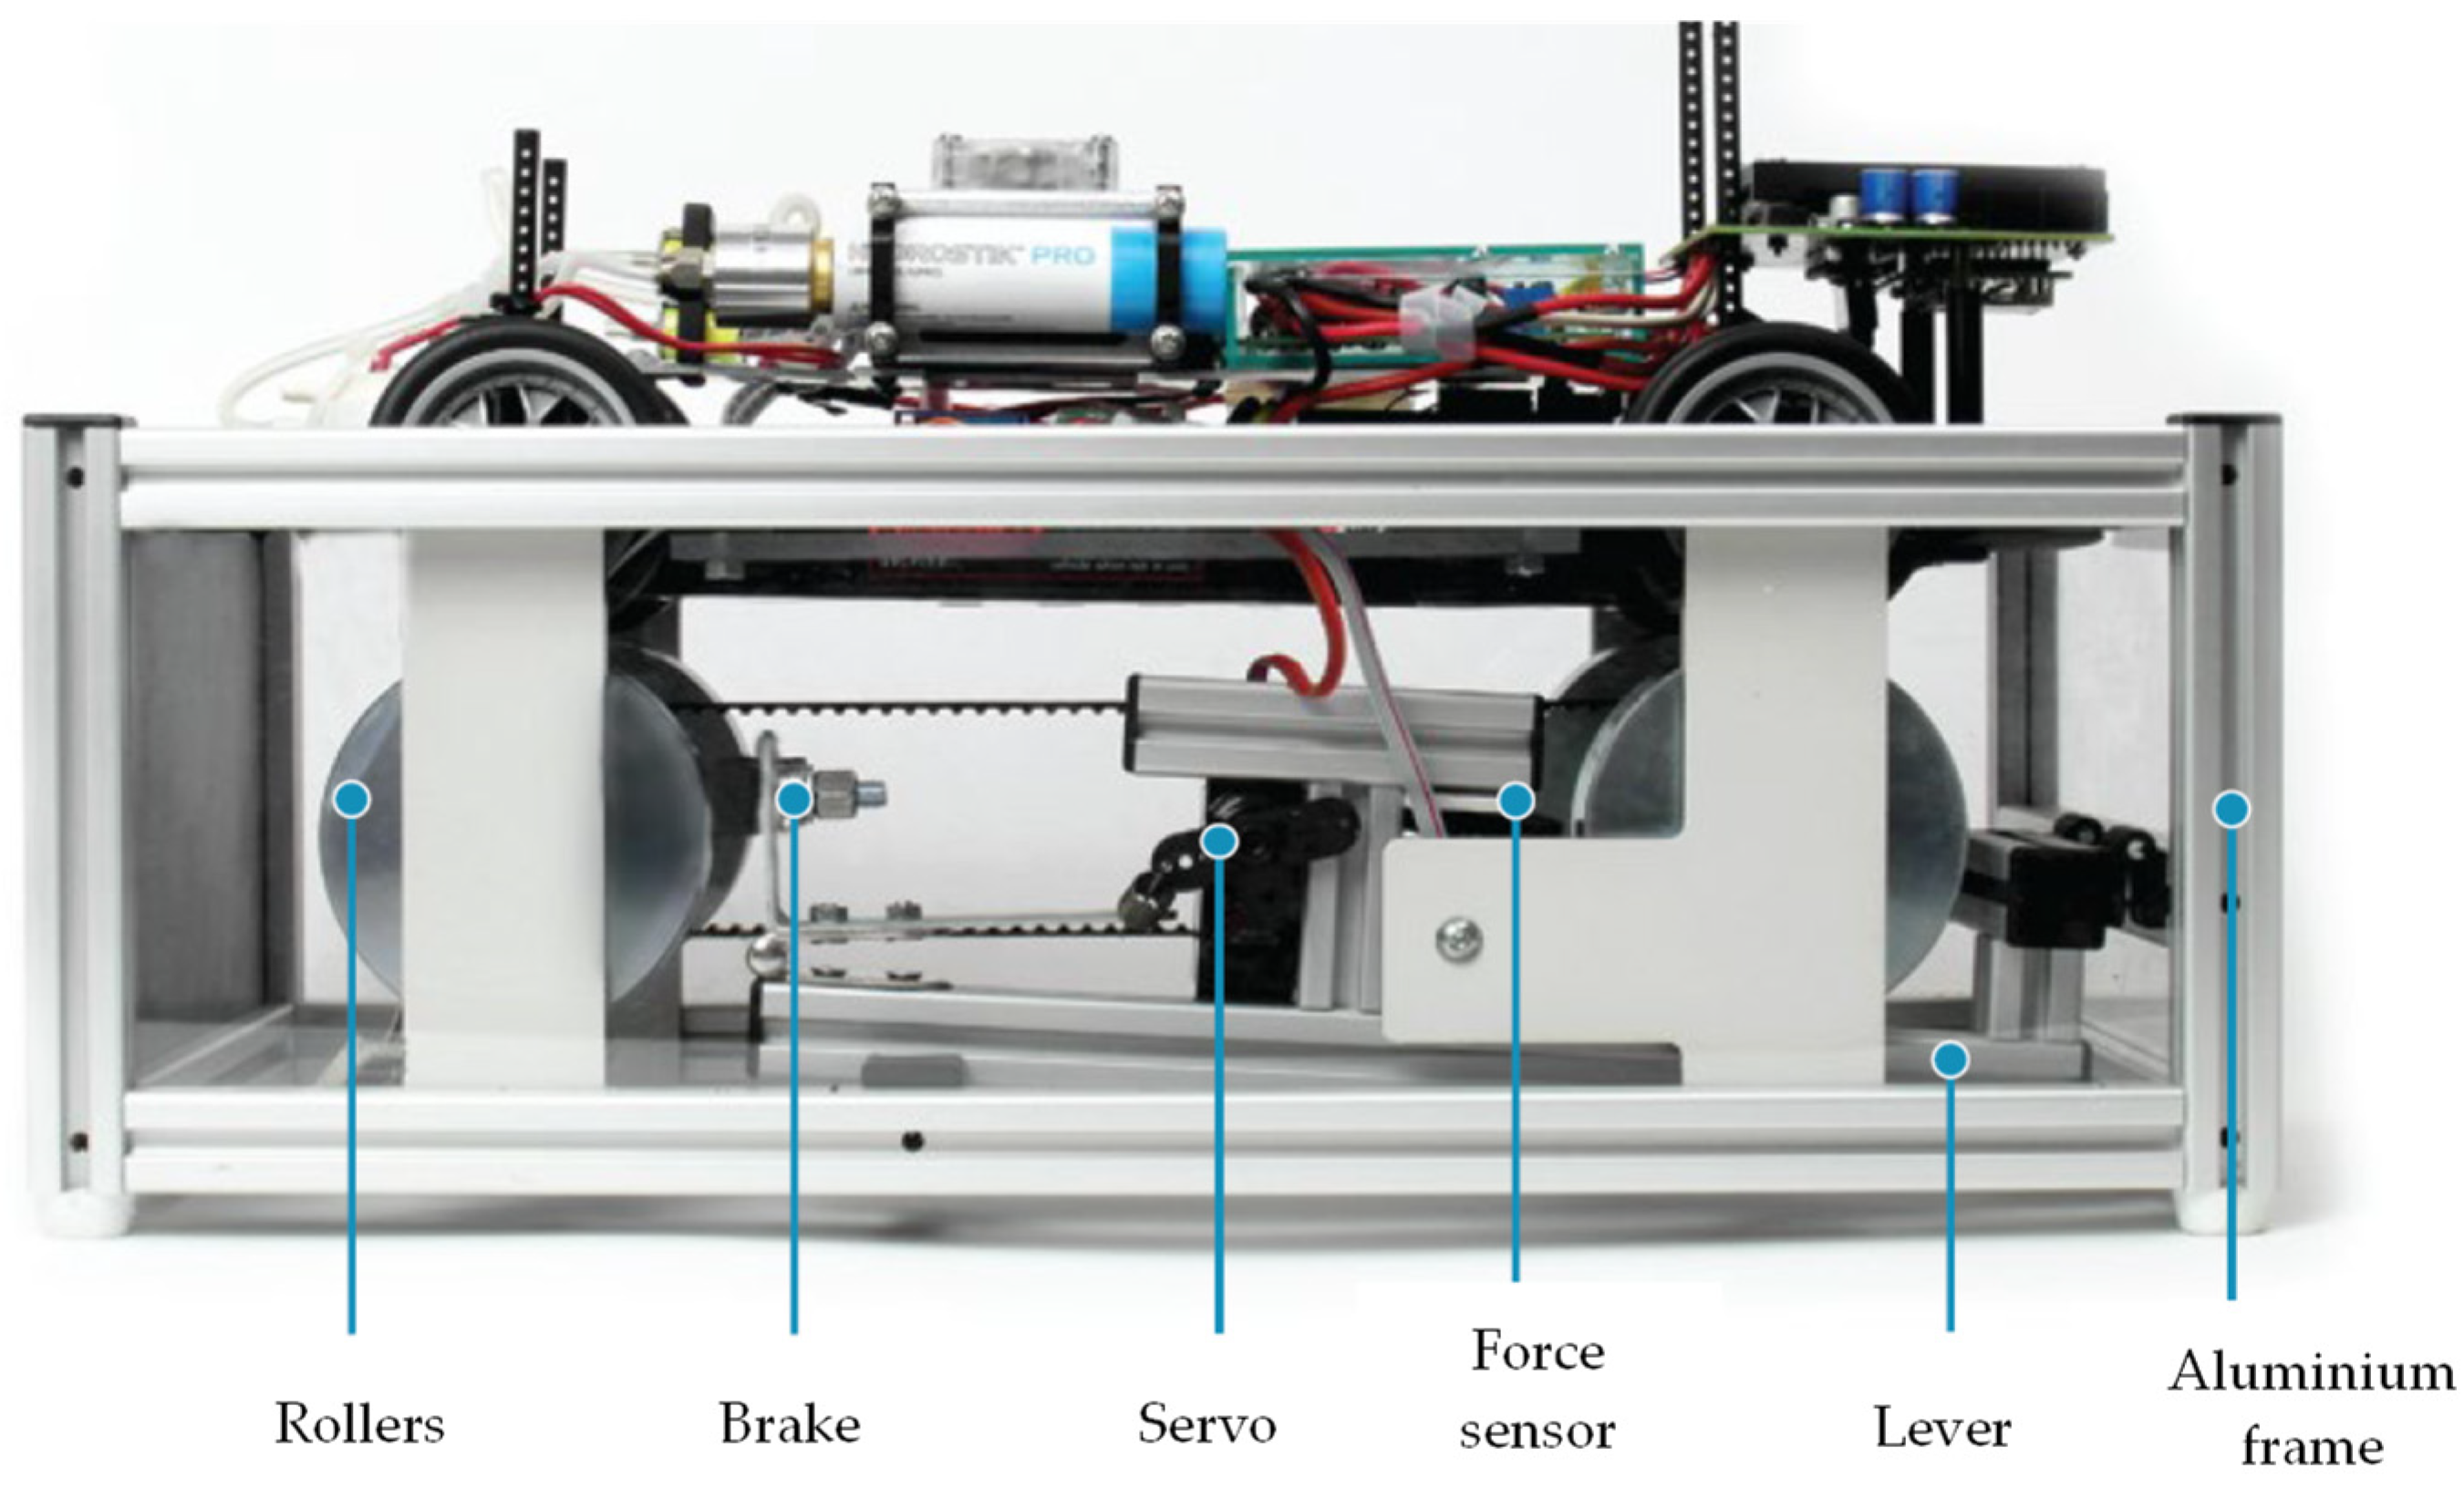
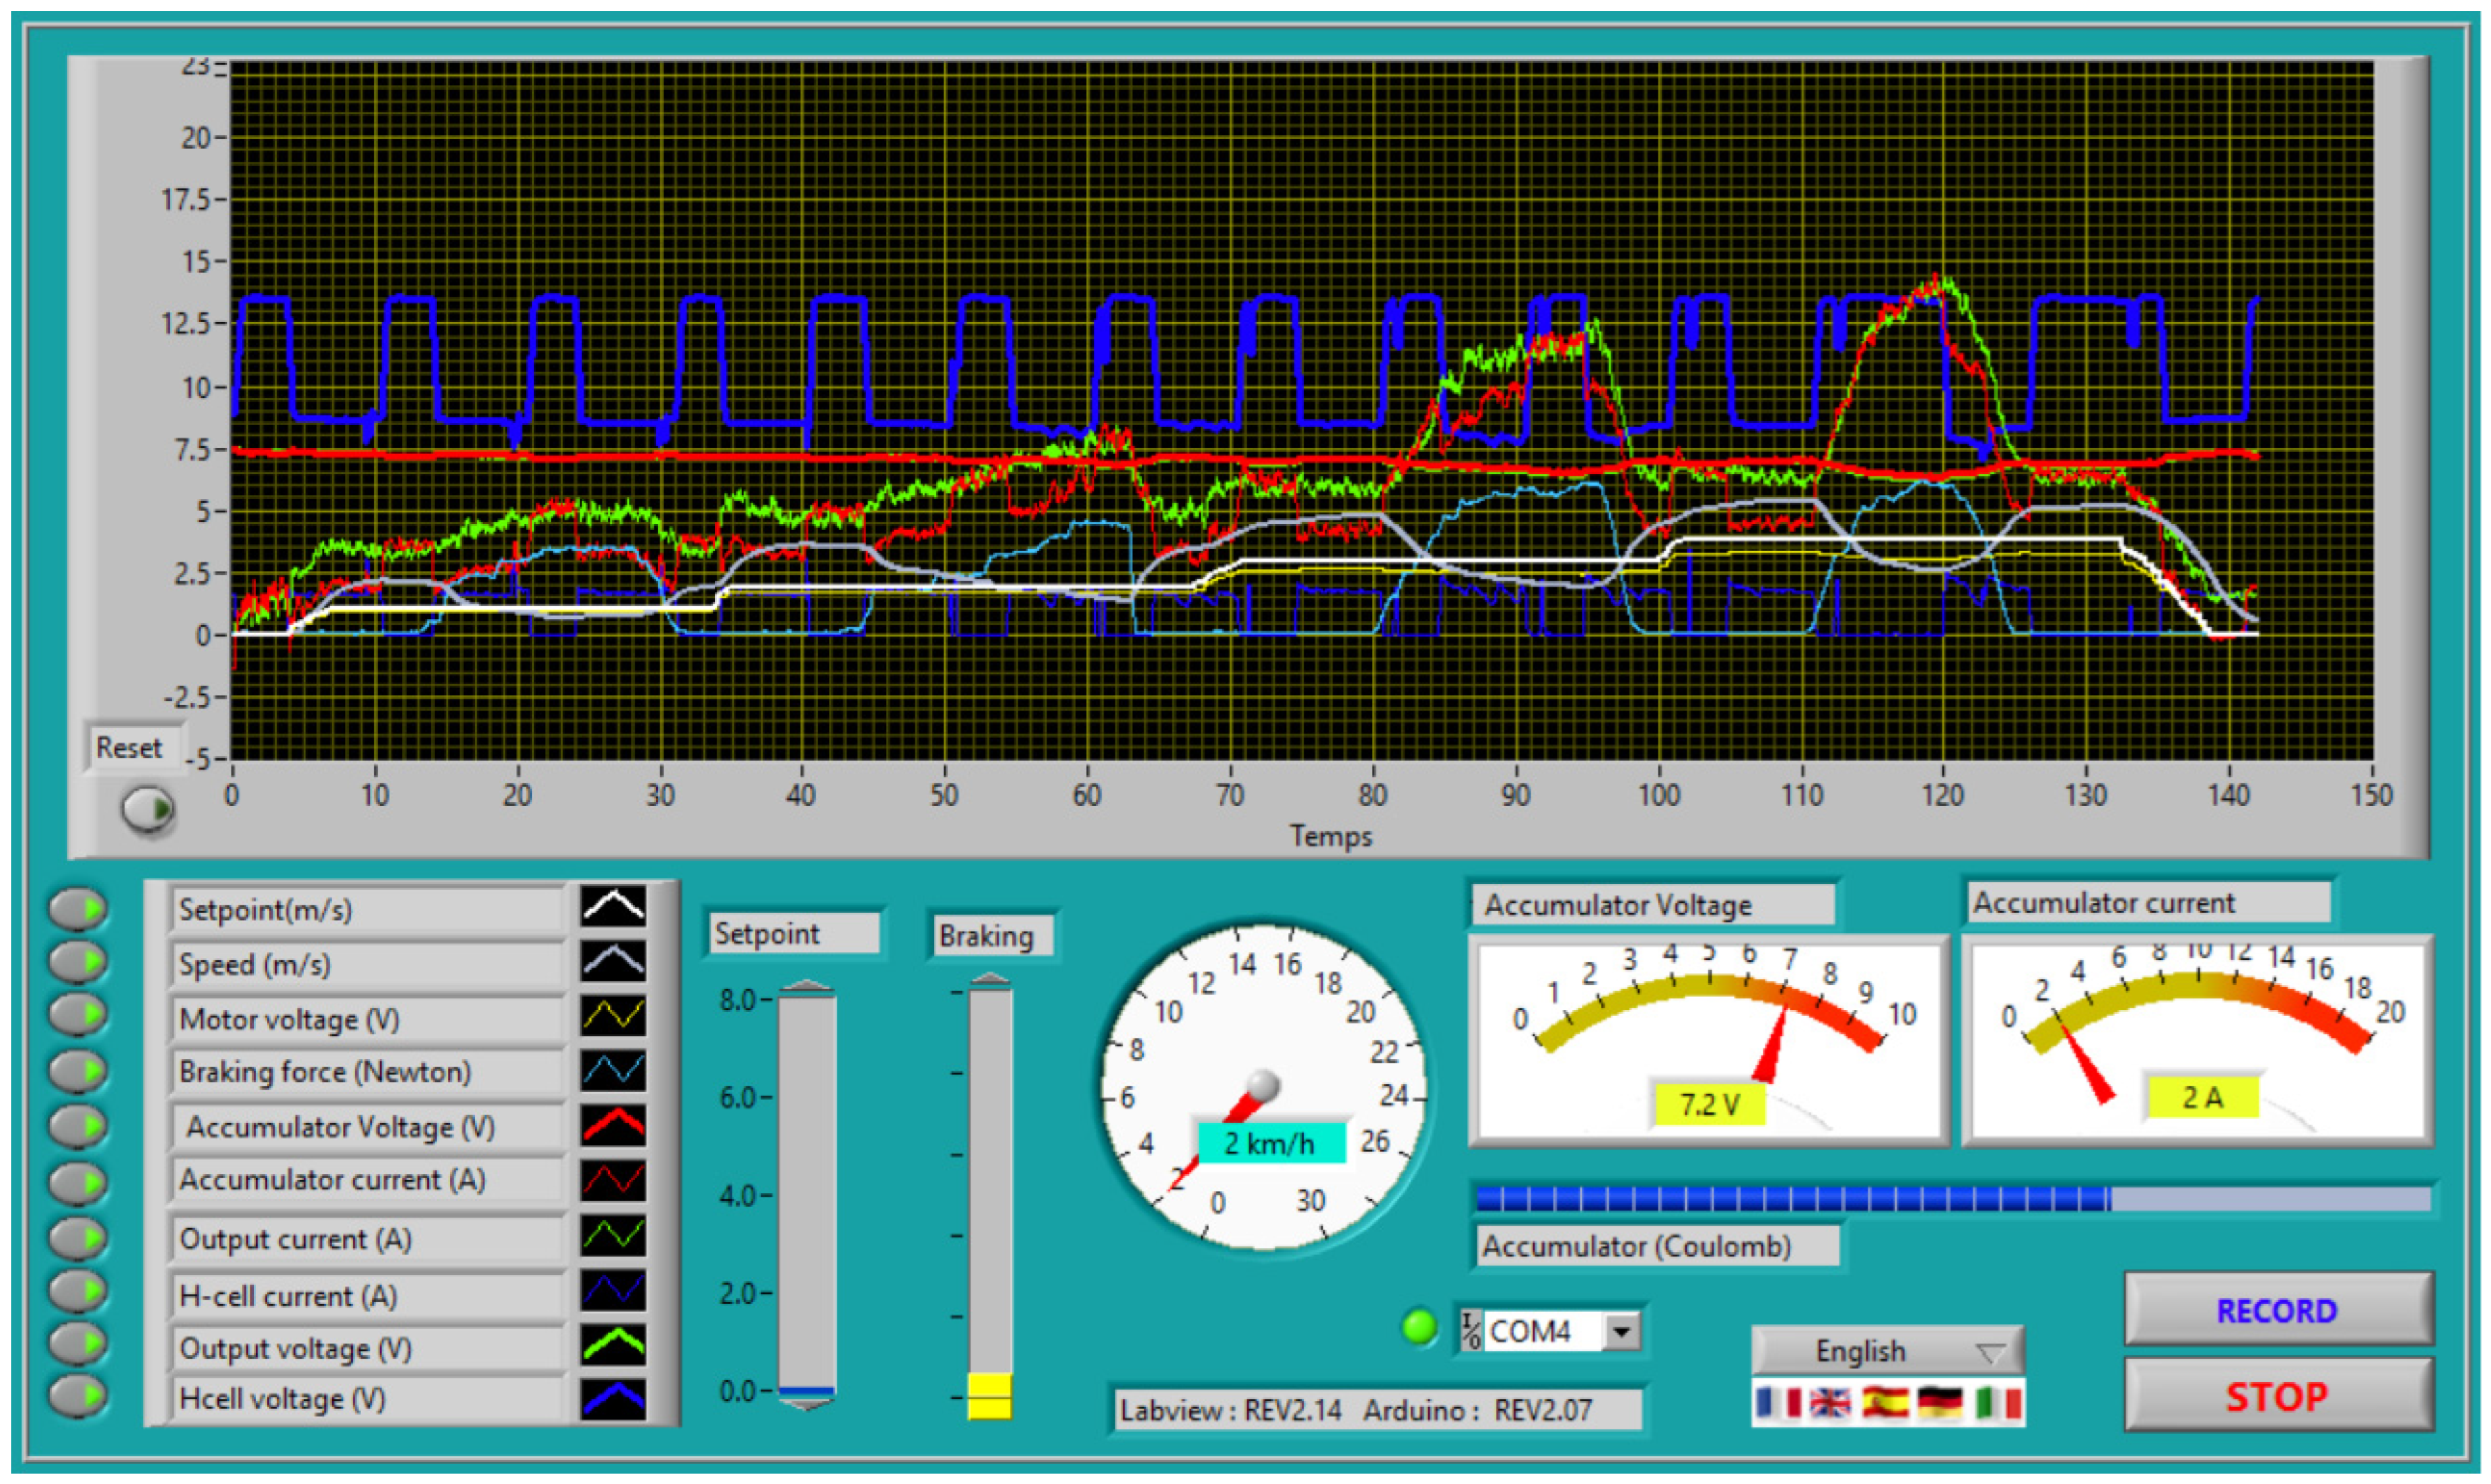
2.2. Chassis Dynamometer

Tests on the operation of the battery and fuel cell under varying load conditions were carried out on a chassis dynamometer (Figure 4). The dynamometer model used in the experiment has two axles, each equipped with two rollers. Load generation for the drivetrain is carried out through a friction brake, which acts directly on one of the rollers of the vehicle’s rear axle. To ensure an even load on all wheels, the axles are connected by a toothed belt. The load generated is transmitted as the force with which the friction lining is pressed against the roller in direct contact with the vehicle’s tire. In the context of the analysis, the load on the system is expressed in the basic SI unit of force (N). The movement of the friction lining is controlled by a servo motor, and the force is measured by an additional sensor.
Electrical parameters and some mechanical parameters are recorded using the measurement system. The measurement frequency was about 50 Hz during the acquisition of all 10 measurement data (Figure 5). The program allows recording electrical parameters while visualizing the values of excess voltage, battery current, and driving speed (set using the Setpoint function—Figure 5). The software was developed in the LabView environment using the Arduino platform. Data recording takes place on an SD card mounted in the vehicle, but the application functions wirelessly, using Bluetooth data transmission.

3. Scope of the Study

Research on the FCAT-30 vehicle’s powertrain was carried out in two variants: (a) without external loading and (b) with external loading. The load was introduced by using a chassis dynamometer. In the first variant, the rollers were not additionally braked; the load resulted solely from the moment of inertia of the system driven by the dynamometer.
Tests on the hybrid model vehicle were carried out according to the profiles shown in Figure 6. These profiles are shown as a function of percentage of elapsed time due to the different durations of the test. The no-load speed profile includes several jumps in speed on the chassis dynamometer, initially with an increasing and then decreasing trend (see Figure 6a). The profile with external load included only an incremental increase in driving speed (see Figure 6b) with a simultaneous cyclic increase in load. In both cases, the driving speed was limited to 6 m/s, and the maximum external load occurring was 6.2 N. The test durations without load and with load were 100 and 140 s, respectively. The goal was not to directly compare the two tests but only to evaluate the behavior of the drivetrain (energy flow) under these conditions. For this reason, differences in distance or test duration were ignored.

4. Hybrid Propulsion Research

The speed profiles presented earlier (Figure 6) clearly show the differences between external load and no load. Eight parameters were measured during the tests, and their course as a function of test duration is shown in Figure 7. A direct comparison of the results for the two cases analyzed (with load and without load) reveals significant differences in the values of battery current (I_BATT) and cell voltage (U_FC).
Tests of the drivetrain with no load show small changes in the battery voltage (U_BATT) in the range of 7.0 to 7.6 V, with simultaneous changes in the battery current (I_BATT) in the range of up to 5 A (see Figure 7a). Under load, the voltage change is similar, but the current change ranges from zero to almost 15 A at the highest brake load (see Figure 7b). These changes are proportional to the strength of the brake load.
At no brake load, a fuel cell operating at about 8–9 V generates about 1–1.5 A. When loaded, the voltage values of U_FC are much higher, exceeding 13 V, and the current is about 2 A at the minimum voltage value of U_FC.
In both cases, the output voltage is close to the voltage U_BATT, and the current I_OUT is related to the sum of both intensities: the battery and the cell. In the case of additional load with force F, cyclic operation of the fuel cell is observed, manifested in the absence of current (i.e., no-load operation). In this case, the resultant current intensity is close to that of the battery.
According to the analysis shown in Figure 7, noticeably higher current values are obtained from the battery than from the fuel cell. This suggests that the fuel cell is not the main source of energy for vehicle propulsion. Such operating conditions differ from standard powertrains, such as in the Toyota Mirai [15] and Hyundai Nexo models. According to the research described in [45,46], the fuel-cell energy contribution is significantly higher, which is a direct result of the high-powered cell compared with the low energy of the battery.

5. Power Share of Propulsion System Components

An analysis of the power transferred to the drivetrain, broken down into the power of the battery, the cell, and the output power of the system in no-load and external-load modes, is shown in Figure 8. The power was calculated as the product of the voltage and current on each component. Under no-load conditions (Figure 8a), the powertrain obtains a maximum of 40 watts from the battery and about 12 watts from the fuel cell. Loading the system (Figure 8b) increases the power of the battery to 90 W and the cell to a maximum of 15 W (continuous power). Finally, without load, the system obtains about 50 W of power, while during load, it obtains about 90 W.
Under no-load conditions, the power is the resultant power of the battery and the cell, with the battery contributing significantly. During load, the battery’s share also dominates. The fuel-cell share in both cases remains at about 15 W.
The fuel-cell value of 15 watts represents 50% of its claimed power. Under no-load conditions, the fuel-cell share is 12:26 W, which is less than 50%. At high vehicle speeds, the share drops to 12 W out of 50 W, or 24%. So, the fuel-cell share is not particularly high. With an external load, these values max out at a ratio of 15 W to 90 W, which is 16% (at maximum load, t = 85%). At low load (t = 5%), the values are 15 W to 28 W, respectively, which is 53%. The described method of controlling the hybrid powertrain makes it possible to protect the fuel cell from power peaks that can contribute to the degradation.
The conclusion is that the drivetrain mainly uses battery power at significant vehicle speed, with the fuel cell acting as a secondary drive source. Nevertheless, the system controller always uses both energy sources: the battery and the fuel cell.

6. Analysis of Fuel-Cell Operation

In the current chapter, operating conditions were analyzed for the fuel cell only, ignoring the other components of the drive train (Figure 9). No load (Figure 9a) results in small changes in the fuel-cell voltage. During the no-load operation of the cell, there is a noticeable drop in current between the peaks that occur, probably related to the drop in ionic conductivity. The decrease in conductivity occurs with the accumulation of water and nitrogen in the anode channels, which are removed when the anode is flushed with hydrogen. The flushing phenomenon is accompanied by the aforementioned voltage and current peaks, which occur cyclically, and loss of hydrogen [47]. The same phenomenon occurs when the vehicle’s drivetrain is externally loaded (Figure 9b). This process has also been described by other researchers [47,48].
An externally loaded fuel cell exhibits sequential operation, which is manifested by the existence of a specific operating frequency. This can be compared to a PWM signal, where most of the time is active time. This means limiting the voltage while maintaining a high value of the fuel-cell current (Figure 8b). Visible current peaks appeared only at a low F-force load during the initial phase of the test. The sudden increase in voltage at no load on the cell (I_FC) is consistent with the polarization characteristics of the PEM fuel cell. This is related to the losses occurring in the cell during operation at different load states [49].
The current–voltage characteristics of the fuel-cell stack differ in the case of no load and with external load (Figure 10). Operation of the cell without a load (Figure 10a) causes small changes in voltage and current. The points with voltage U_FC below 8.4 V refer to the purging of anode channels and activation of the fuel cell, while the rest correspond to typical operating conditions. The operating points of an externally loaded cell are shown in Figure 10b. In this case, the points above 8.4 V are characteristic of the fuel-cell activation and termination states. The applied load increases the load on the fuel cell, increasing the current. The apparent voltage step changes are due to the dynamics of the load and the adjustment of the fuel-cell operation.
Static loading of the cell would result in typical cell operating conditions and result in a current–voltage characteristic in which each load point corresponds to a single voltage value. However, the dynamic nature of the fuel-cell operation means that such static characteristics are “filled in” by dynamic changes in the operating conditions. The lack of current (Figure 10b) indicates typical no-load operation under dynamic conditions since the change in recorded voltage ranges from 9 V to about 13.5 V, which exceeds the rated voltage of the cell used.

7. Battery Operation Indicators

A partial analysis of battery operation is included in Chapter 4. The voltage–current characteristics of battery operation are shown in Figure 11. Operation without an external load on the drivetrain is characterized by slightly higher voltage values and significantly lower current values (Figure 11a) than with a load (Figure 11b). The no-load characteristic is only a part of the typical current–voltage characteristic of a battery. As a result of applying a variable external load, the drivetrain makes significant use of the energy provided by the battery, resulting in a significant increase in the operating field to a current I_BATT of just under 15 A. There are battery charging states in both tests, but they represent a negligible part of the characteristics. It should be noted that the model system tested is not equipped with braking energy recovery.

8. Indicators of Hybrid Powertrain Operation

The operating parameters of the hybrid powertrain are shown in Figure 12. Analysis of the no-load powertrain (Figure 12a) shows that the battery contributes almost 75% (maximum). However, its share is always greater than 50%. The battery share is much higher at high speed than at low speed. During the early and final stages of the drive at no speed, the battery was recharged, as indicated by the negative value of the battery share.
Battery charging conditions were not recorded under vehicle load conditions (Figure 12b). When the fuel cell is deactivated and the anode channels are purging, the battery share is about 100%. As the external load increases, the share of the cell decreases, and the share of battery power increases. As the load and speed increase (in both the initial and final phases of the test), the fuel-cell share drops below 50%. The higher the load, the higher the share of the battery. At high external load, the fuel-cell share decreases to around 30%.
An analysis of the total energy consumed is shown in Figure 13. Under no-load conditions (Figure 13a), 2254 J of energy was consumed from the battery, while only 1343 J was consumed from the fuel cell. This shows that the average proportion of energy from the fuel cell is 37%. Despite the lack of braking of the dynamometer rollers, i.e., no external load, the vehicle consumed a total of 3597 J.
Under the load conditions of the vehicle’s drivetrain (Figure 13b), the consumed energies from the battery and the cell are 5277 J and 1251 J, respectively. This means that the fuel-cell share is practically constant and does not depend on the vehicle’s load. During the load analysis, the fuel-cell share decreased significantly and is only 19%.
The study concludes that the battery predominantly drives the powertrain, with the fuel cell acting as a secondary energy source.

9. Conclusions

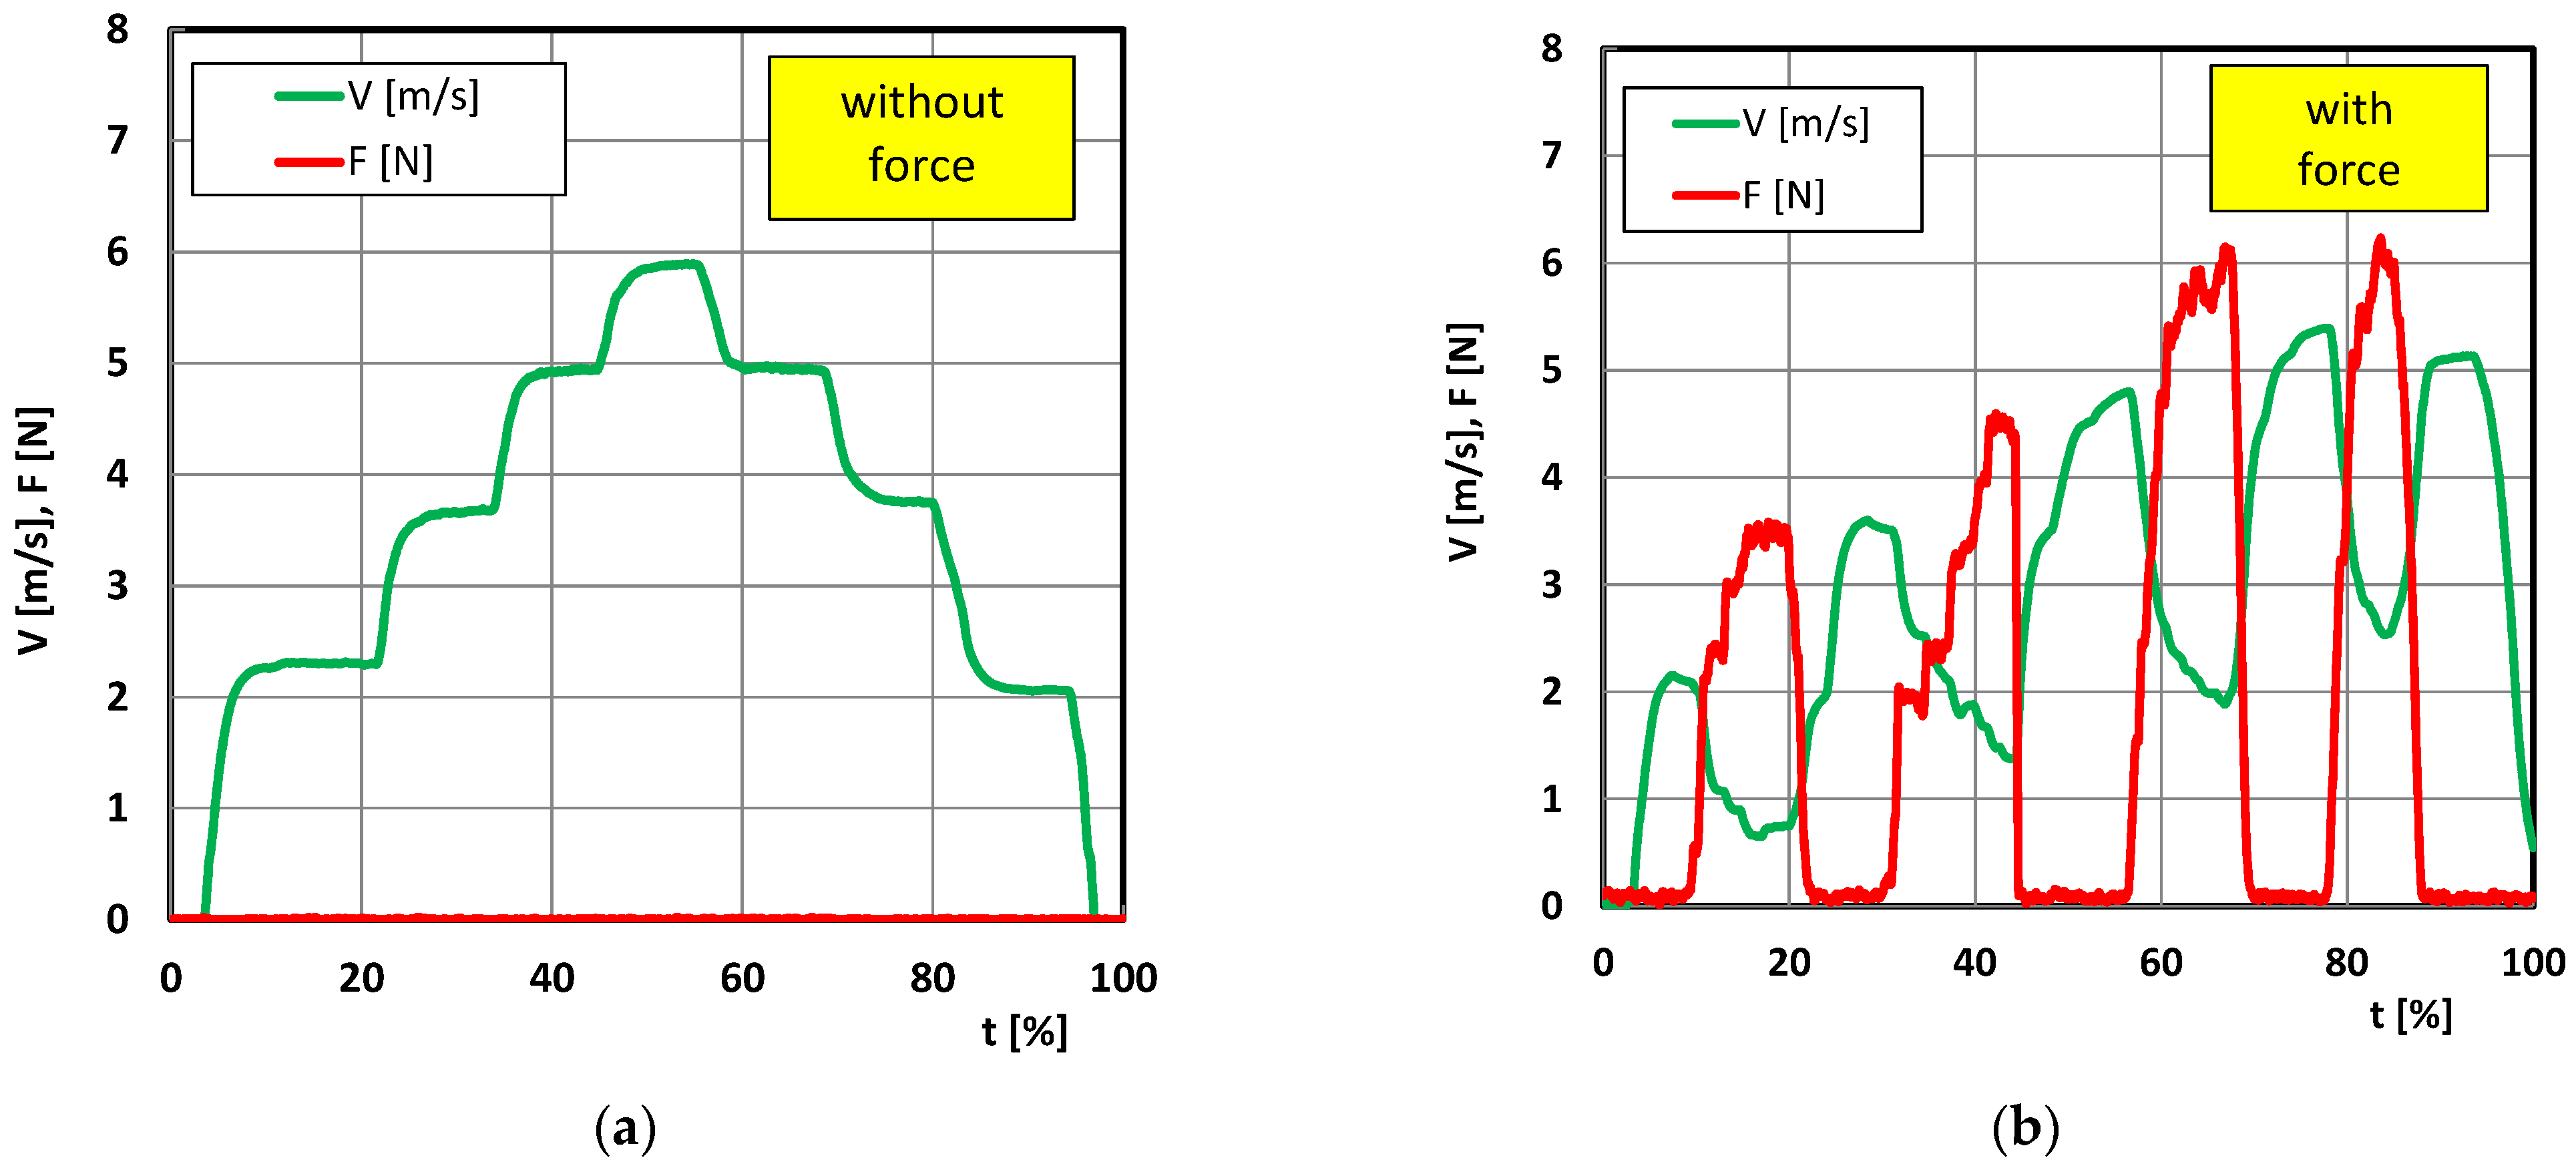
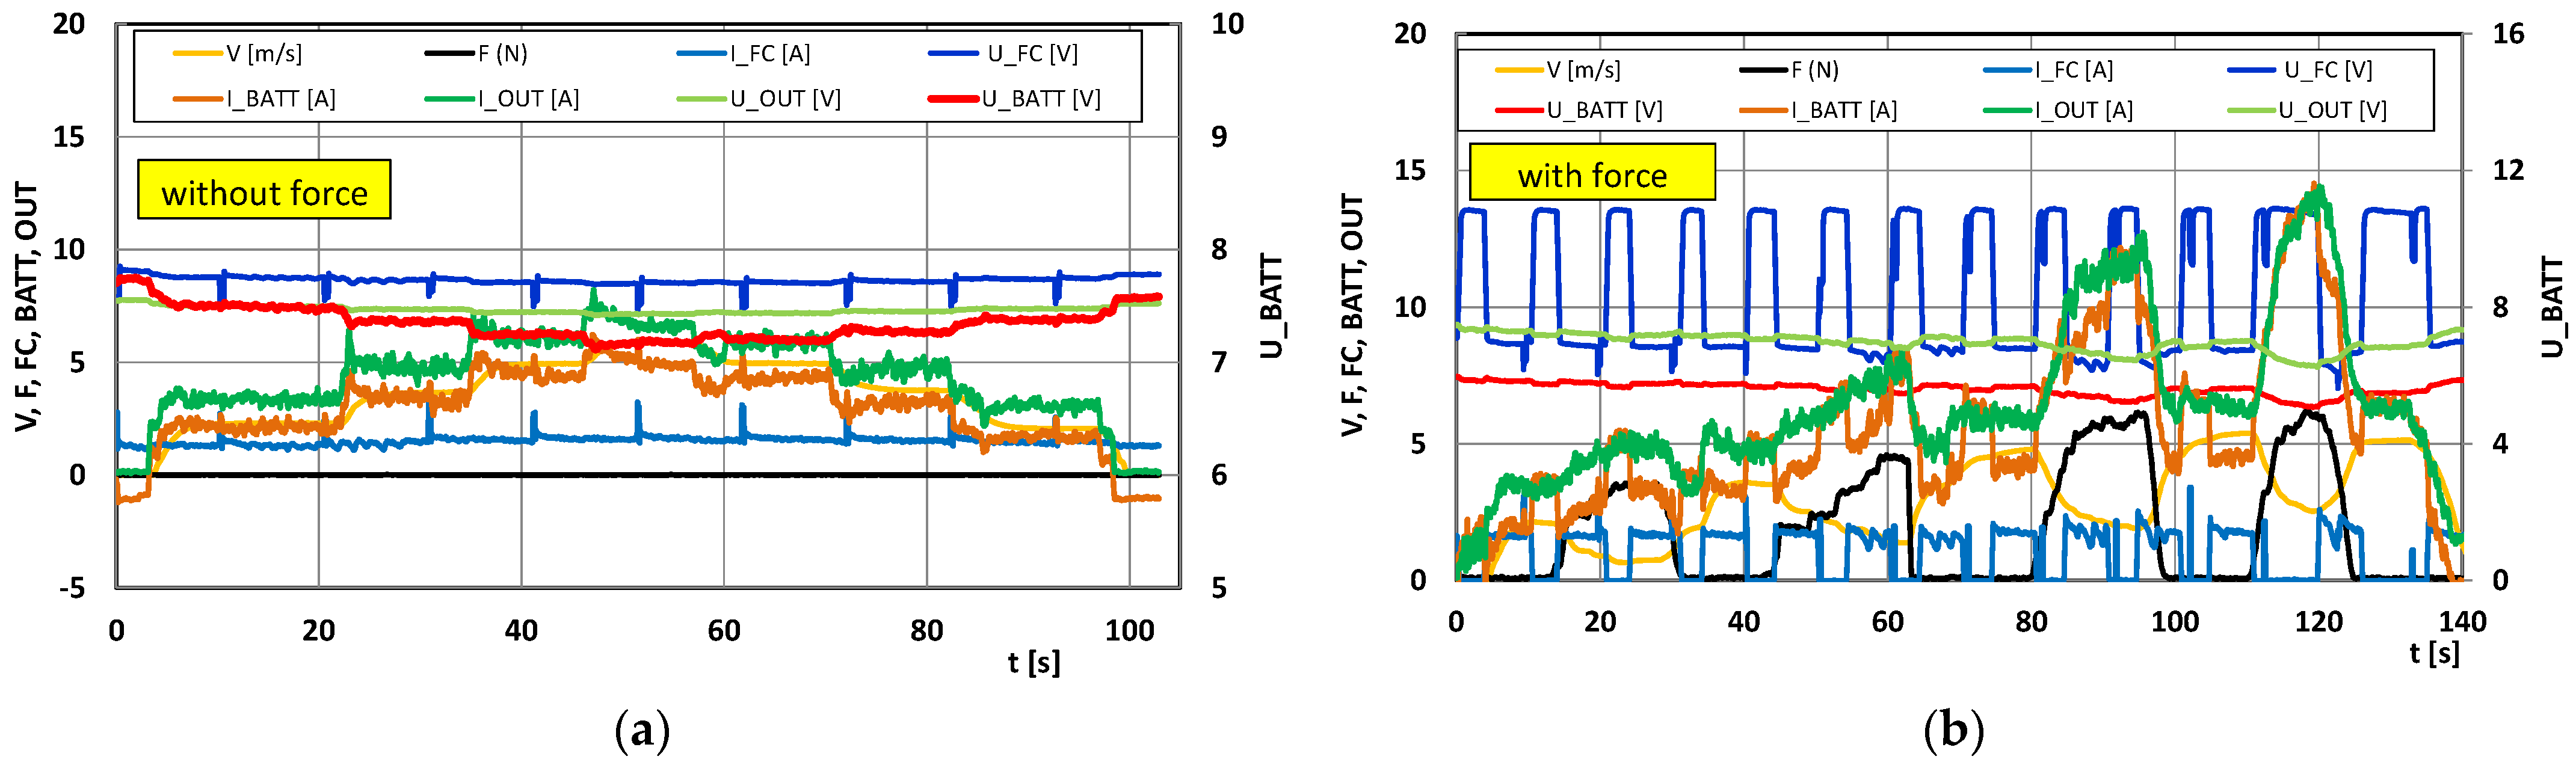
  • The experimental study presented here concerns the evaluation of the effect of the load on the drivetrain of the FCAT-30 model hybrid vehicle, equipped with a PEM fuel cell, on the performance of selected structural components. The voltage and current of the battery (BATT), fuel cell (FC), and drivetrain (OUT) were selected as the directly measured parameters analyzed. Based on the measured parameters, the performance of the components was evaluated, and the analysis was extended to include the energy balance.
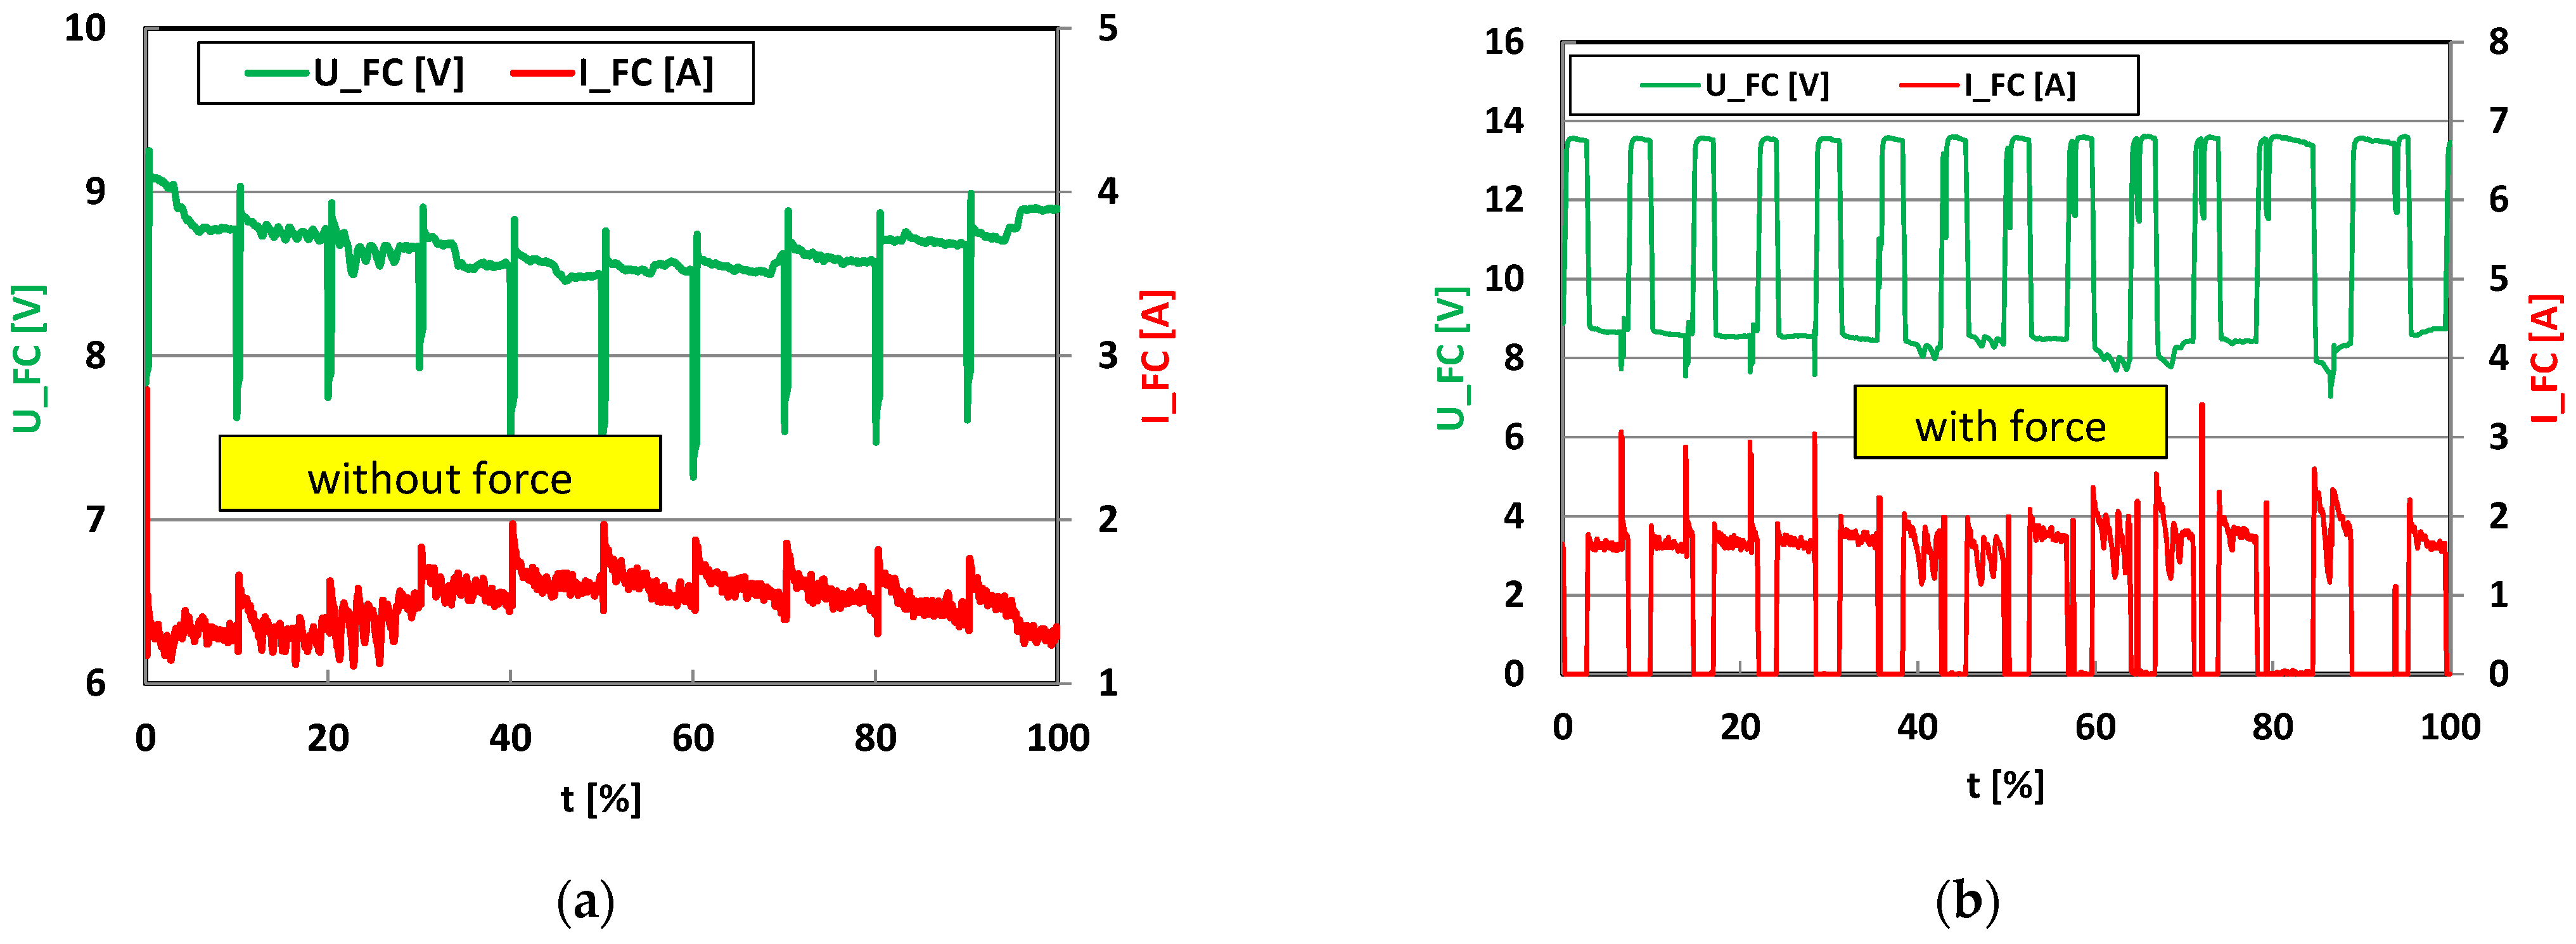
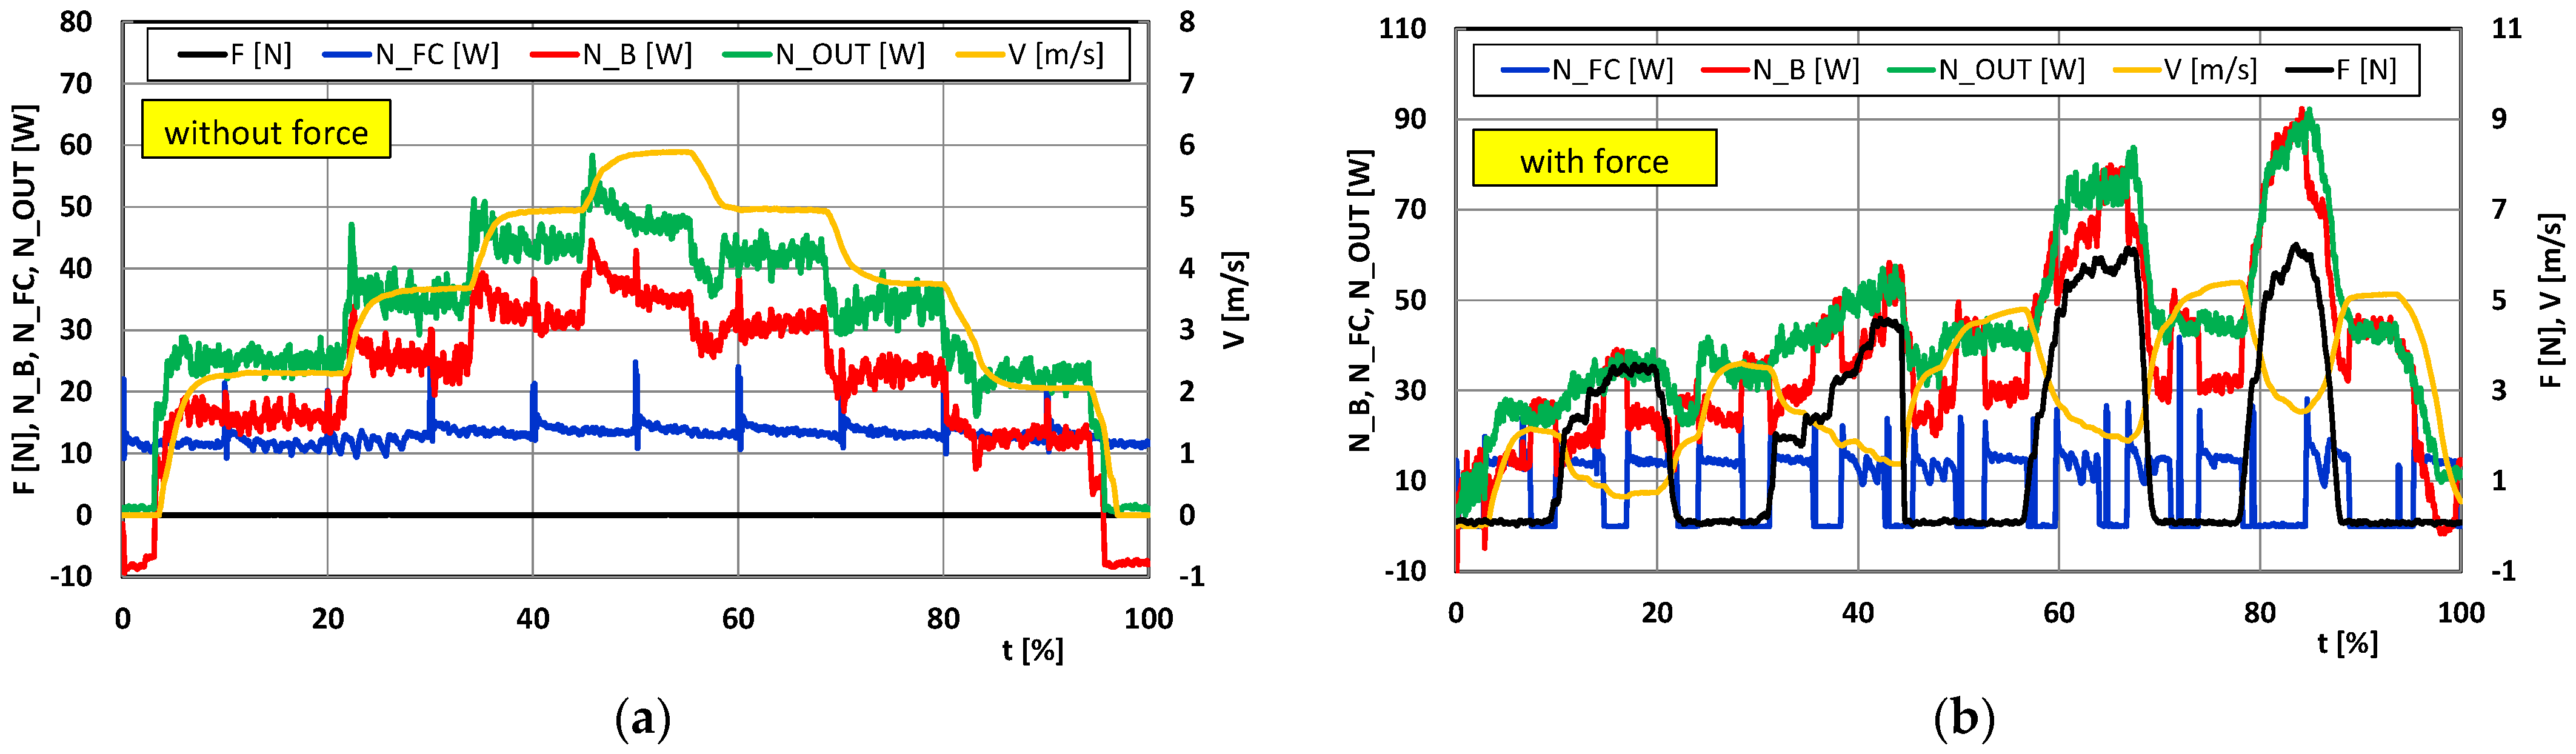
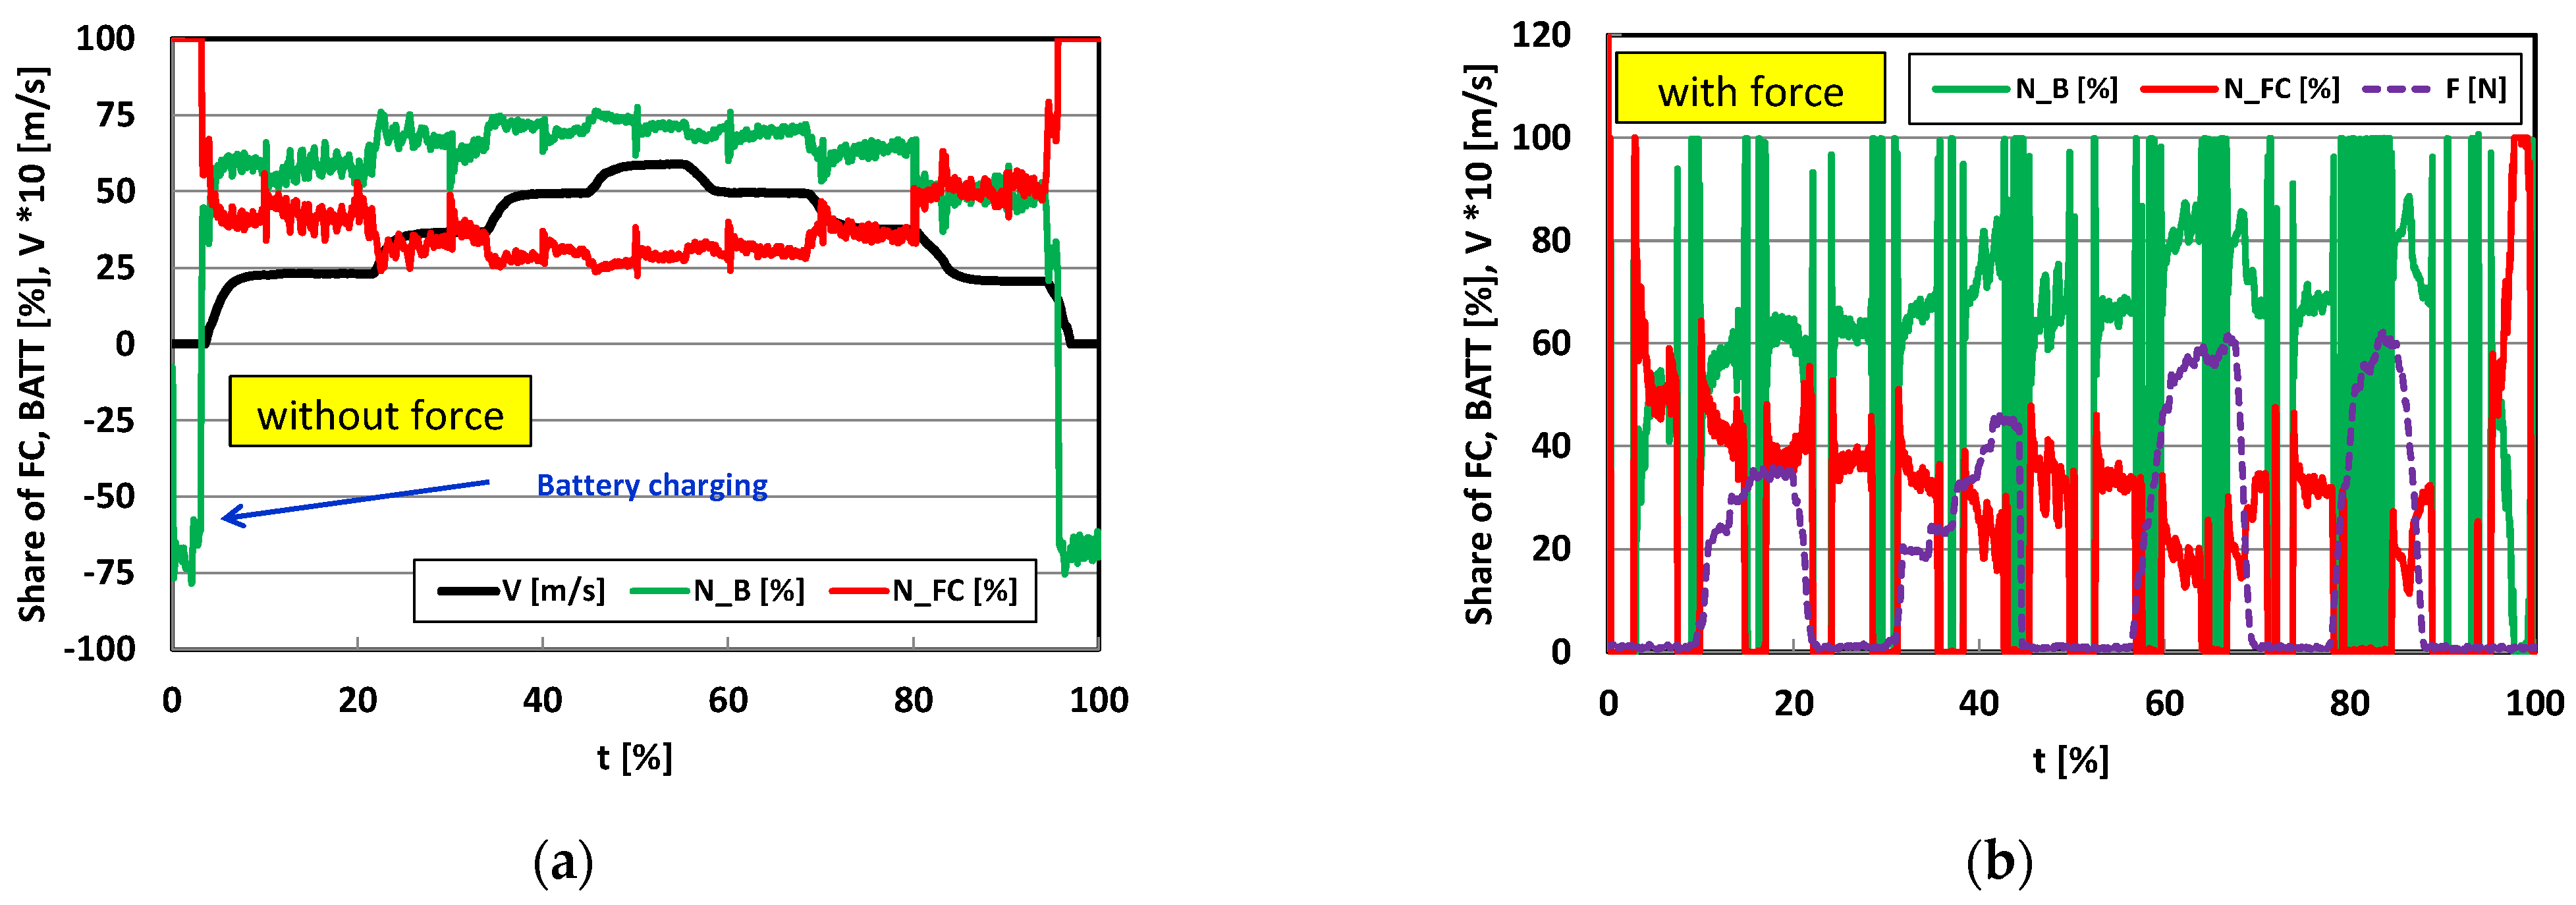
  • It was pointed out that there is a variation in power distribution with respect to the applied load. When operating the system without an external load, the cell generates an approximately constant power of about 12 W during the test, which is between 20% and 50% of the power transferred to the drive, depending on the speed of the vehicle. The use of an external dynamic load results in cyclic operation of the cell with a peak power of 15 W, where the fuel-cell-stack contribution ranges from 0% (off state) to 38%.
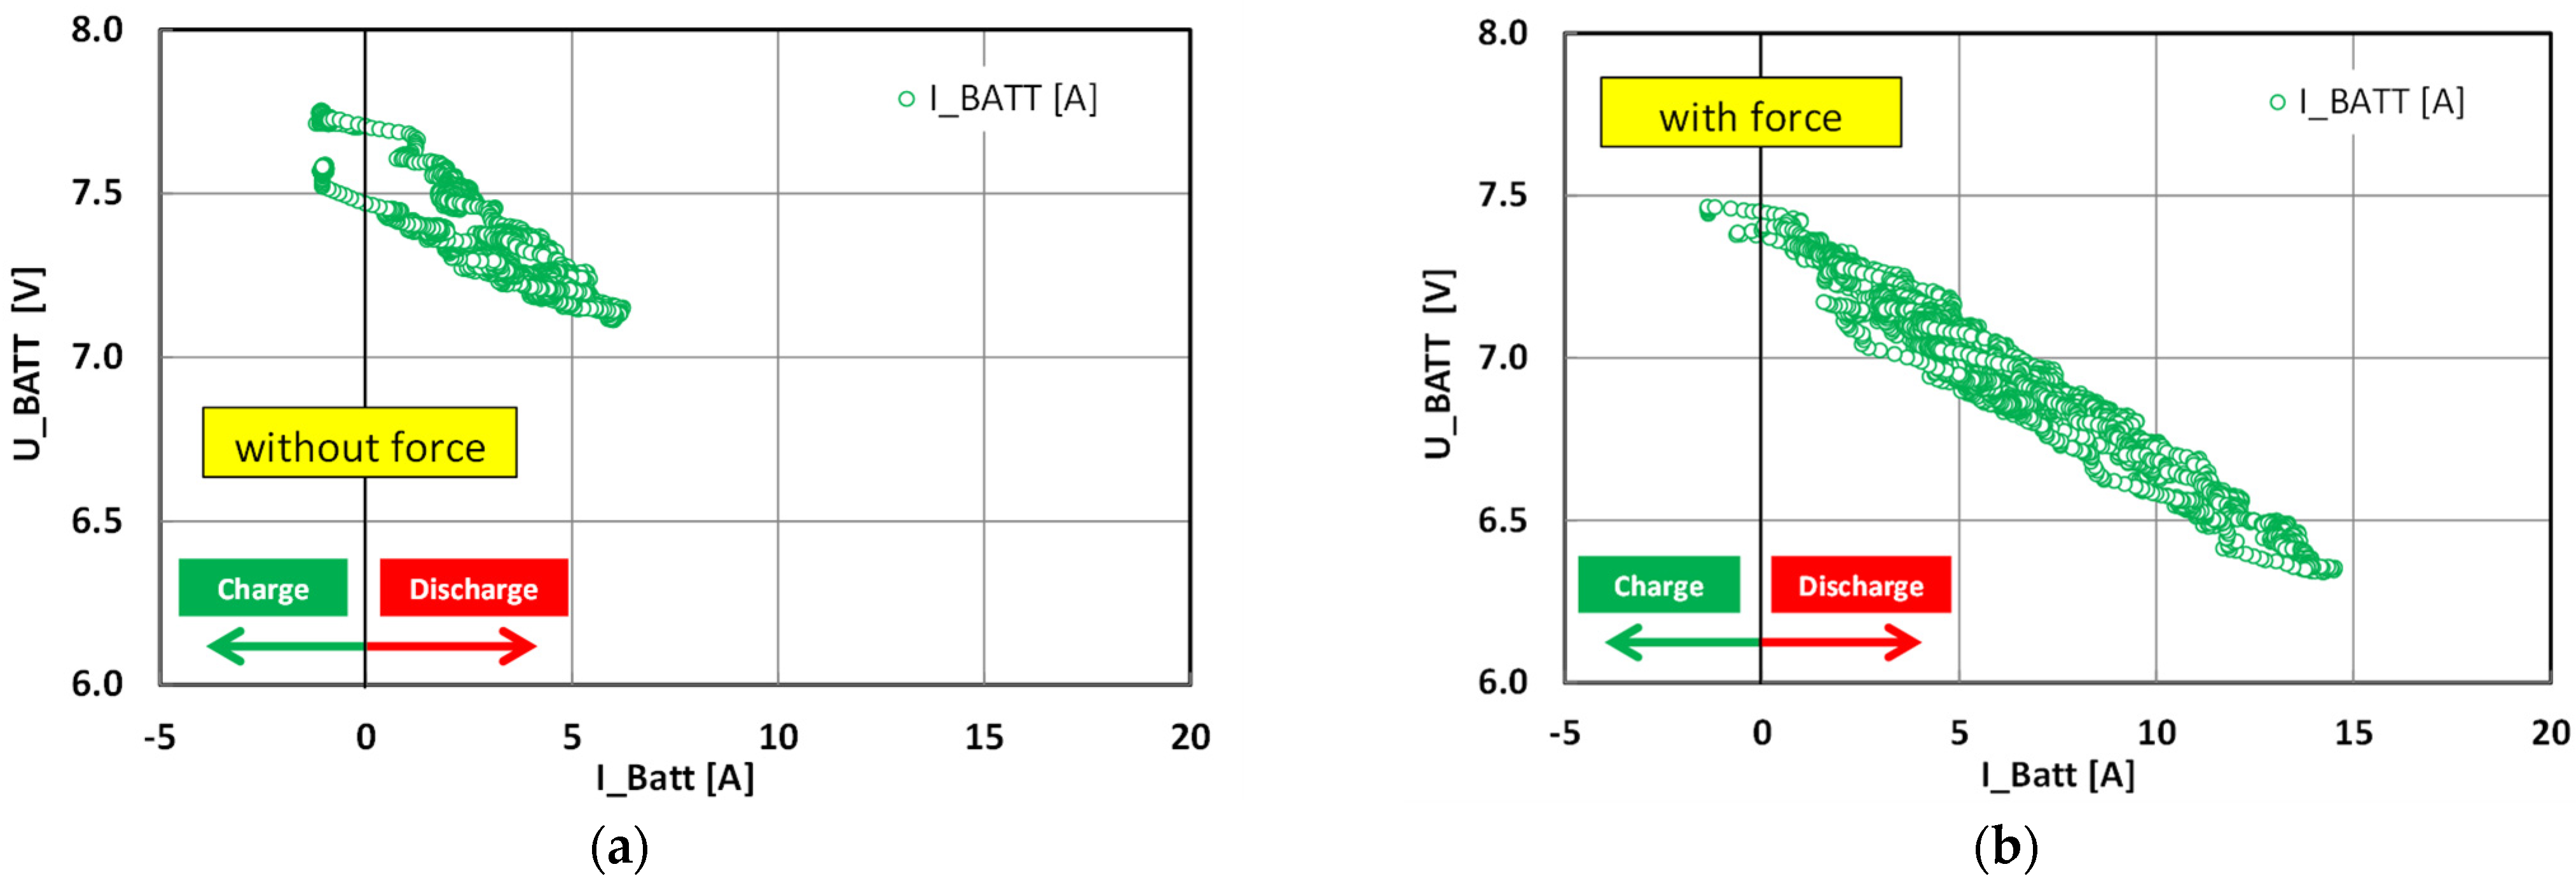
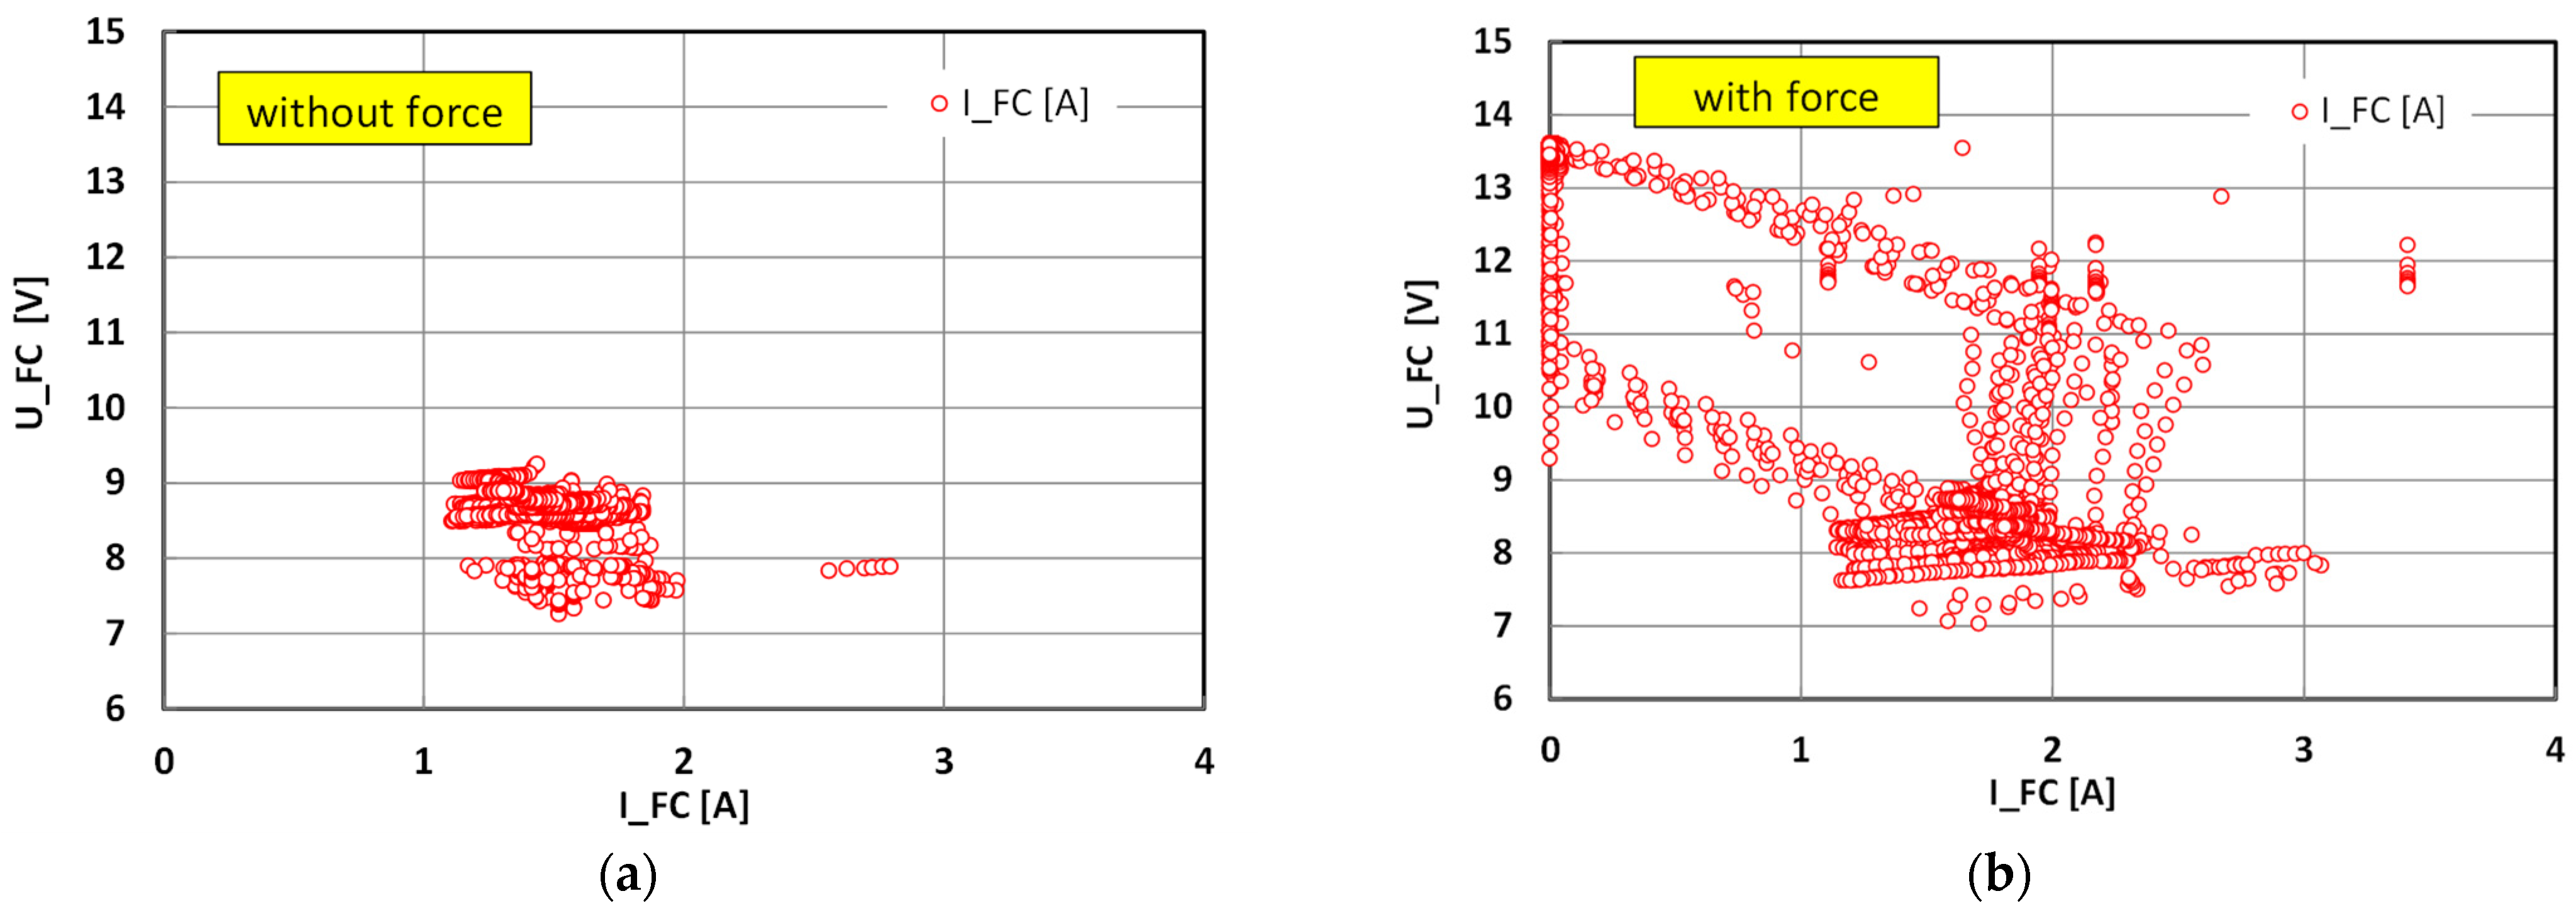
  • Regardless of the test conditions, there is a process of flushing the anode channels, manifested by momentary jumps in cell voltage and current. For dynamic load conditions of current decay (deactivation of cell operation), clear jumps in cell-stack voltage from 8.5 V to 13.7 V were recorded. The no-load fuel-cell-stack operation area was indicated as a voltage below 8.4 V for no-load operation and above 8.4 V for the dynamic-external-load test. The results of the analysis of the energy flow within the NiMH battery indicate a small share of charging from the fuel cell with current in the 0–2 A range. The external-load test significantly increases the power demand, which puts a significant strain on the battery, which is the main energy source.
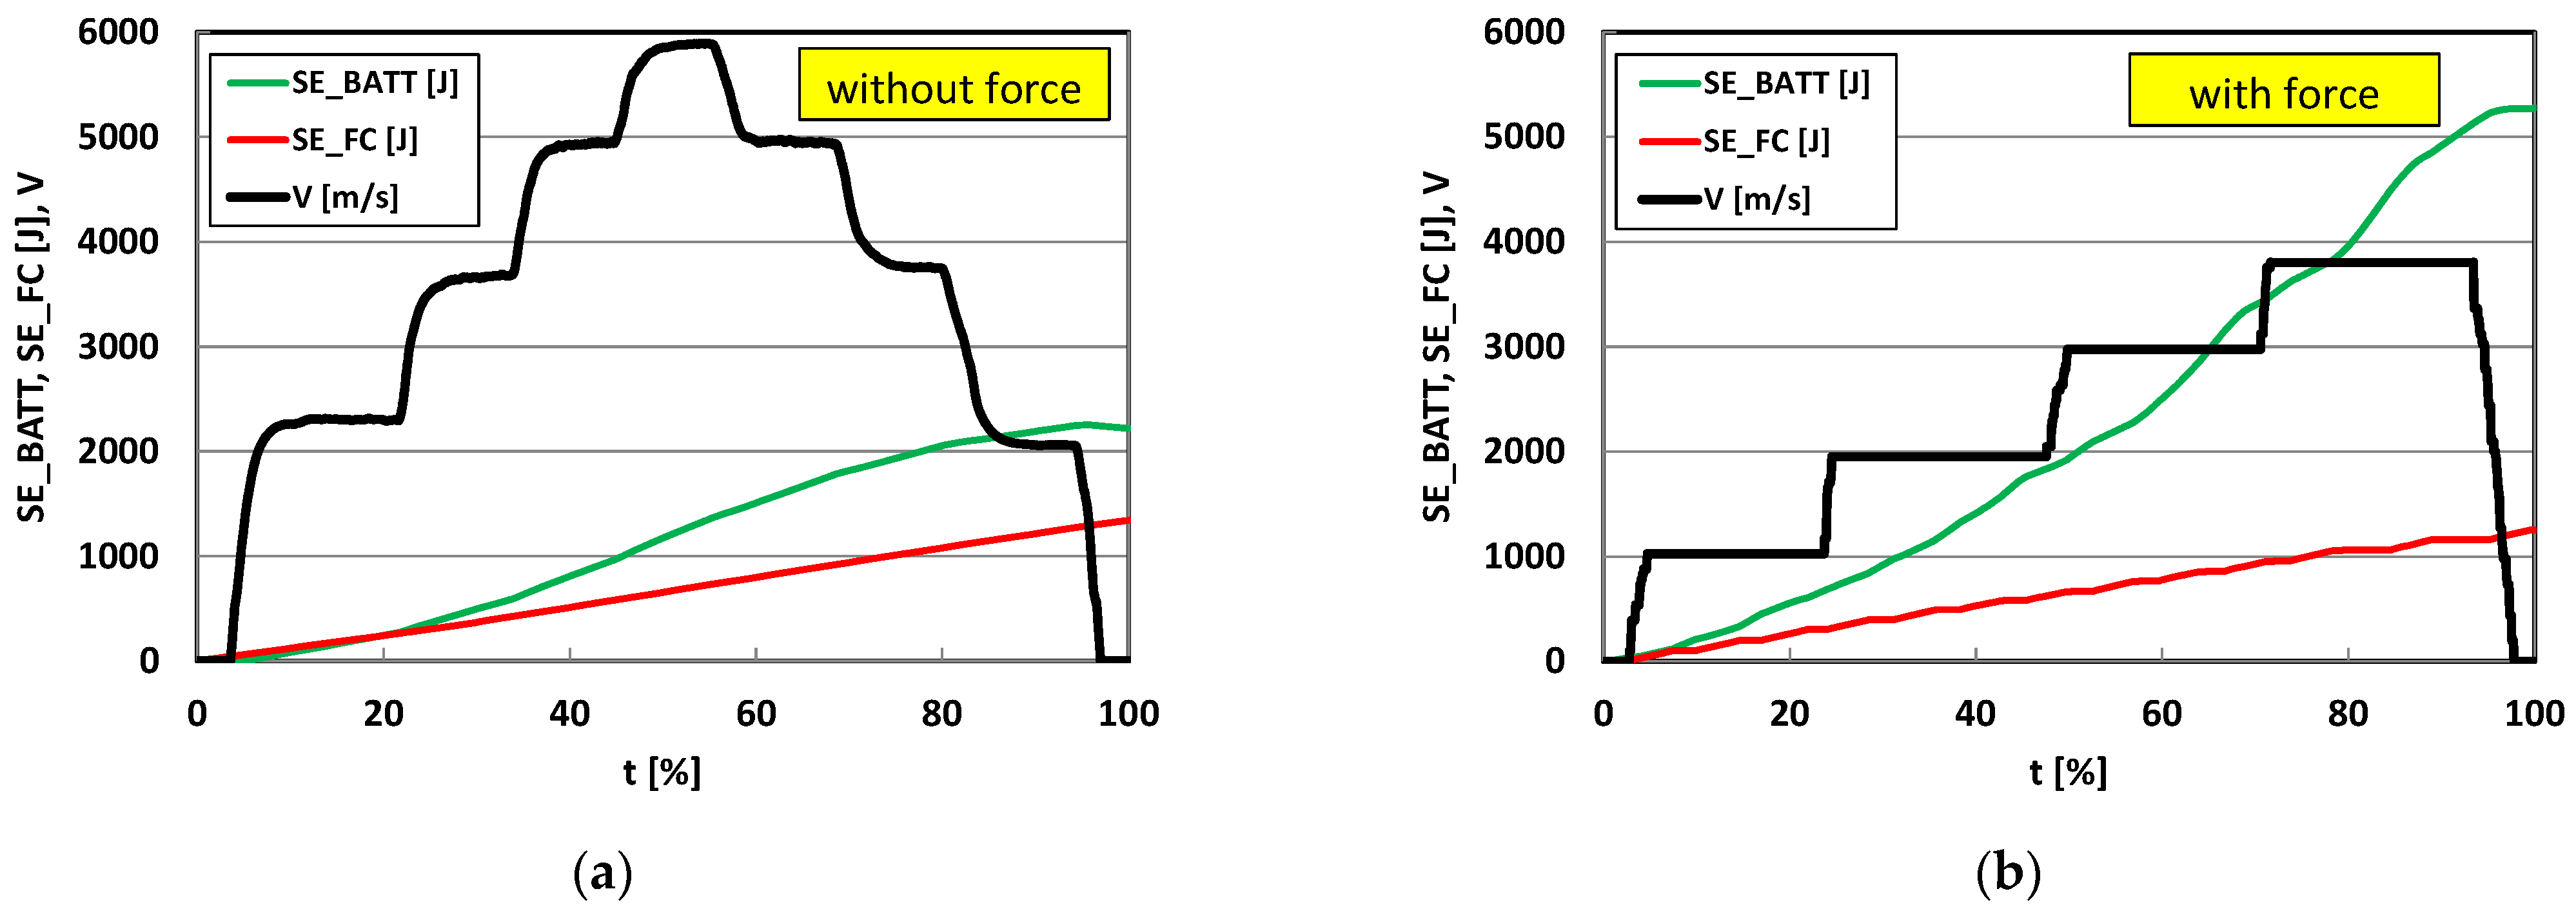
  • Analysis of the energy balance shows that there are no situations where the drivetrain uses only the fuel cell, except at the beginning and end of the test, where the wheel speed is 0 m/s. For the no-load test, the drivetrain consumed 3597 J, of which 37.3% was energy from the fuel cell. For the external-load test, the vehicle consumed 6528 J, of which the energy of the cell accounted for 19.2%. It was noted that there was no significant effect in the way the drivetrain was loaded on the amount of energy produced by the fuel cell. In the overall balance, the difference between the test with and without load was 6.85%.

Author Contributions

Conceptualization, I.P., F.S. and K.S.; methodology, I.P., F.S. and K.S.; software, I.P. and F.S.; validation, I.P., F.S. and K.S.; formal analysis, F.S. and K.S.; investigation, I.P., F.S. and K.S.; resources, I.P., F.S. and K.S.; data curation, I.P. and F.S.; writing—original draft preparation, I.P., F.S. and K.S.; writing—review and editing, I.P., F.S. and K.S.; visualization, I.P., F.S. and K.S.; supervision, I.P., F.S. and K.S.; project administration, I.P., F.S. and K.S.; funding acquisition, I.P., F.S. and K.S. All authors have read and agreed to the published version of the manuscript.

Funding

This research received no external funding.

Institutional Review Board Statement

Not applicable.

Informed Consent Statement

Not applicable.

Data Availability Statement

The data presented in this study are available on request from the corresponding author.

Conflicts of Interest

The authors declare no conflict of interest.

References

  1. Szumska, E.; Jurecki, R. Technological developments in vehicles with electric drive. Combust. Engines 2023, 194, 38–47. [Google Scholar] [CrossRef]
  2. Luo, Y.; Wu, Y.; Li, B.; Qu, J.; Feng, S.; Chu, P.K. Optimization and cutting-edge design of fuel-cell hybrid electric vehicles. Int. J. Energy Res. 2021, 45, 18392–18423. [Google Scholar] [CrossRef]
  3. Liu, Z.; Wu, Y.; Feng, J. Competition between battery switching and charging in electric vehicle: Considering anticipated regret. Environ. Dev. Sustain. 2023, 1–22. [Google Scholar] [CrossRef]
  4. Sun, C.; Negro, E.; Vezzù, K.; Pagot, G.; Cavinato, G.; Nale, A.; Herve Bang, Y.; Di Noto, V. Hybrid inorganic-organic proton-conducting membranes based on SPEEK doped with WO3 nanoparticles for application in vanadium redox flow batteries. Electrochim. Acta 2019, 309, 311–325. [Google Scholar] [CrossRef]
  5. Hussein, M.M.; Mohamed, T.H.; Mahmoud, M.M.; Aljohania, M.; Mosaad, M.I.; Hassan, A.M. Regulation of multi-area power system load frequency in presence of V2G scheme. PLoS ONE 2023, 18, e0291463. [Google Scholar] [CrossRef] [PubMed]
  6. Matla, J.; Kaźmierczak, A.; Haller, P.; Trocki, M. Hydrogen as a fuel for spark ignition combustion engines–state of knowledge and concept. Combust. Engines 2023. [Google Scholar] [CrossRef]
  7. Global Hydrogen Review 2021, IEA. Available online: https://www.iea.org/reports/global-hydrogen-review-2021 (accessed on 17 September 2023).
  8. Samsun, R.; Rex, M.; Antoni, L.; Stolten, D. Deployment of fuel cell vehicles and hydrogen refueling station infrastructure: A global overview and perspectives. Energies 2022, 15, 4975. [Google Scholar] [CrossRef]
  9. Thomas, C. Fuel cell and battery electric vehicles compared. Int. J. Hydrogen Energy 2009, 34, 6005–6020. [Google Scholar] [CrossRef]
  10. Li, Z.P.; Liu, B.H.; Arai, K.; Suda, S. A Fuel cell development for using borohydrides as the fuel. J. Electrochem. Soc. 2003, 150, A868. [Google Scholar] [CrossRef]
  11. Lewis, A.C. Optimising air quality co-benefits in a hydrogen economy: A case for hydrogen-specific standards for NOx emissions. Environ. Sci. Atmos. 2021, 1, 201–207. [Google Scholar] [CrossRef]
  12. Dincer, I. Environmental and sustainability aspects of hydrogen and fuel cell systems. Int. J. Energy Res. 2006, 31, 29–55. [Google Scholar] [CrossRef]
  13. Stambouli, A.B. Fuel cells: The expectations for an environmental-friendly and sustainable source of energy. Renew. Sustain. Energy Rev. 2011, 15, 4507–4520. [Google Scholar] [CrossRef]
  14. Van Mierlo, J.; Maggetto, G.; Lataire, P. Which energy source for road transport in the future? A comparison of battery, hybrid and fuel cell vehicles. Energy Convers. Manag. 2006, 47, 2748–2760. [Google Scholar] [CrossRef]
  15. Konno, N.; Mizuno, S.; Nakaji, H.; Ishikawa, Y. Development of compact and high-performance fuel cell stack. SAE Int. J. Alt. Power 2015, 4, 123–129. [Google Scholar] [CrossRef]
  16. Yoshizumi, T.; Kubo, H.; Okumura, M. Development of high-performance FC stack for the new MIRAI. In SAE Technical; SAE International: Warrendale, PA, USA, 2021. [Google Scholar] [CrossRef]
  17. Nonobe, Y. Development of the fuel cell vehicle Mirai. IEEJ Trans. Electr. Electron. Eng. 2017, 12, 5–9. [Google Scholar] [CrossRef]
  18. Kimura, K.; Kawasaki, T.; Ohmura, T.; Atsumi, Y.; Shimizu, K. Development of New Fuel Cell Vehicle Clarity Fuel Cell. Honda R&D Technical Review. April 2016. Available online: http://www.uninsim.com/data/ueditor/php/upload/file/20191118/1574059716840217.pdf (accessed on 17 September 2023).
  19. Matsunaga, M.; Fukushima, T.; Ojima, K. Powertrain system of Honda FCX Clarity fuel cell vehicle. World Electr. Veh. J. 2009, 3, 820–829. [Google Scholar] [CrossRef]
  20. Robledo, C.B.; Oldenbroek, V.; Abbruzzese, F.; van Wijk, A.J.M. Integrating a hydrogen fuel cell electric vehicle with vehicle-to-grid technology, photovoltaic power and a residential building. Appl. Energy 2018, 215, 615–629. [Google Scholar] [CrossRef]
  21. 2023 Hyundai NEXO Fuel Cell|Specs. Available online: https://www.hyundaiusa.com/us/en/vehicles/nexo (accessed on 30 August 2023).
  22. Gómez, J.A.; Santos, D.M.F. The status of on-board hydrogen storage in fuel cell electric vehicles. Designs 2023, 7, 97. [Google Scholar] [CrossRef]
  23. Rubio, O. BMW i Hydrogen NEXT está en Fase de Pruebas en Carreteras de Europa. Available online: https://greenracingnews.com/es/bmw-i-hydrogen-next-esta-en-fase-de-pruebas-en-carreteras-de-europa/ (accessed on 30 August 2023).
  24. 2023 BMW IX5 Hydrogen First Drive Review: More than Just a Science Project. Available online: https://www.cnet.com/roadshow/news/2023-bmw-ix5-hydrogen-first-drive-review/ (accessed on 30 April 2023).
  25. Hocking, M.; Kan, J.; Young, P.; Terry, C.; Begleiter, D. Welcome to the Lithium-Ion Age. Deutsche Bank Markets Research. 2016. Available online: http://www.belmontresources.com/LithiumReport.pdf (accessed on 30 August 2023).
  26. Placke, T.; Kloepsch, R.; Dühnen, S.; Winter, M. Lithium ion, lithium metal, and alternative rechargeable battery technologies: The odyssey for high energy density. J. Solid State Electrochem. 2017, 21, 1939–1964. [Google Scholar] [CrossRef]
  27. Zhang, J.; Wang, C.; Zhang, A. Experimental study on temperature and performance of an open-cathode PEMFC stack under thermal radiation environment. Appl. Energy 2022, 311, 118646. [Google Scholar] [CrossRef]
  28. Curry, C. Lithium-Ion Battery Costs: Squeezed Margins and New Business Models. Bloomberg New Energy Finance. Available online: https://about.bnef.com/blog/lithium-ion-battery-costs-squeezed-margins-newbusiness-models/ (accessed on 14 July 2023).
  29. Wang, T.; Li, Q.; Wang, X.; Qiu, Y.; Liu, M.; Meng, X.; Li, J.; Chen, W. An optimized energy management strategy for fuel cell hybrid power system based on maximum efficiency range identification. J. Power Sources 2020, 445, 227333. [Google Scholar] [CrossRef]
  30. Arsalis, A. A comprehensive review of fuel cell-based micro-combined-heat-and-power systems. Renew. Sustain. Energy Rev. 2019, 105, 391–414. [Google Scholar] [CrossRef]
  31. Giddey, S.; Badwal, S.; Kulkarni, A.; Munnings, C. A comprehensive review of direct carbon fuel cell technology. Prog. Energy Combust. 2012, 38, 360–399. [Google Scholar] [CrossRef]
  32. Olabi, A.; Wilberforce, T.; Sayed, E.T.; Elsaid, K.; Abdelkareem, M.A. Prospects of fuel cell combined heat and power systems. Energies 2020, 13, 4104. [Google Scholar] [CrossRef]
  33. Song, Z.; Pan, Y.; Chen, H.; Zhang, T. Effects of temperature on the performance of fuel cell hybrid electric vehicles: A review. Appl. Energy 2021, 302, 117572. [Google Scholar] [CrossRef]
  34. Ogungbemi, E.; Wilberforce, T.; Ijaodola, O.; Thompson, J.; Olabi, A.G. Review of operating condition, design parameters and material properties for proton exchange membrane fuel cells. Int. J. Energy Res. 2020, 45, 1227–1245. [Google Scholar] [CrossRef]
  35. Ji, M.; Wei, Z. A review of water management in polymer electrolyte membrane fuel cells. Energies 2009, 2, 1057–1106. [Google Scholar] [CrossRef]
  36. Yan, Q.; Toghiani, H.; Causey, H. Steady state and dynamic performance of proton exchange membrane fuel cells (PEMFCs) under various operating conditions and load changes. J. Power Sources 2006, 161, 492–502. [Google Scholar] [CrossRef]
  37. Yan, S.; Yang, M.; Sun, C.; Xu, S. Liquid water characteristics in the compressed gradient porosity gas diffusion layer of proton exchange membrane fuel cells using the Lattice Boltzmann Method. Energies 2023, 16, 6010. [Google Scholar] [CrossRef]
  38. Yu, H.; Chen, D.; Ni, X.; Qing, P.; Yan, C.; Wei, W.; Ma, J.; Ji, X.; Chen, Y.; Chen, L. Reversible adsorption with oriented arrangement of a zwitterionic additive stabilizes electrodes for ultralong-life Zn-ion batteries. Energy Environ. Sci. 2023, 16, 2684–2695. [Google Scholar] [CrossRef]
  39. Cheng, X.; Shi, Z.; Glass, N.; Zhang, L.; Zhang, J.; Song, D.; Liu, Z.S.; Wang, H.; Shen, J. A review of PEM hydrogen fuel cell contamination: Impacts, mechanisms, and mitigation. J. Power Sources 2007, 165, 739–756. [Google Scholar] [CrossRef]
  40. Rosli, R.; Sulong, A.; Daud, W.; Zulkifley, M.; Husaini, T.; Rosli, M.; Majlan, E.; Haque, M. A review of high-temperature proton exchange membrane fuel cell (HT-PEMFC) system. Int. J. Hydrogen Energy 2017, 42, 9293–9314. [Google Scholar] [CrossRef]
  41. Cropper, M.A.; Geiger, S.; Jollie, D.M. Fuel cells: A survey of current developments. J. Power Sources 2004, 131, 57–61. [Google Scholar] [CrossRef]
  42. Binti Awang Mat, Z.; Madya Kar, Y.B.; Hasmady Bin Abu Hassan, S.; Azrina Binti Talik, N. Proton exchange membrane (PEM) and solid oxide (SOFC) fuel cell based vehicles—A review. In Proceedings of the 2017 2nd IEEE International Conference on Intelligent Transportation Engineering (ICITE), Singapore, 1–3 September 2017. [Google Scholar] [CrossRef]
  43. Bar-On, I.; Kirchain, R.; Roth, R. Technical cost analysis for PEM fuel cells. J. Power Sources 2002, 109, 71–75. [Google Scholar] [CrossRef]
  44. Thompson, S.T.; James, B.D.; Huya-Kouadio, J.M.; Houchins, C.; DeSantis, D.A.; Ahluwalia, R.; Wilson, A.R.; Kleen, G.; Papageorgopoulos, D. Direct hydrogen fuel cell electric vehicle cost analysis: System and high-volume manufacturing description, validation, and outlook. J. Power Sources 2018, 399, 304–313. [Google Scholar] [CrossRef]
  45. Pielecha, I.; Szałek, A.; Tchorek, G. Two generations of hydrogen powertrain—An analysis of the operational indicators in real driving conditions (RDC). Energies 2022, 15, 4734. [Google Scholar] [CrossRef]
  46. Pielecha, I.; Szwajca, F. Cooperation of a PEM fuel cell and a NiMH battery at various states of its charge in a FCHEV drive. Eksploat. Niezawodn. 2021, 23, 468–475. [Google Scholar] [CrossRef]
  47. Liu, Z.; Chen, J.; Liu, H.; Yan, C.; Hou, Y.; He, Q.; Zhang, J.; Hissel, D. Anode purge management for hydrogen utilization and stack durability improvement of PEM fuel cell systems. Appl. Energy 2020, 275, 115110. [Google Scholar] [CrossRef]
  48. Eom, T.-H.; Kang, J.-W.; Kim, J.; Shin, M.-H.; Lee, J.-H.; Won, C.-Y. Improved voltage drop compensation method for hybrid fuel cell battery system. Electronics 2018, 7, 331. [Google Scholar] [CrossRef]
  49. Karami, N.; Outbib, R.; Moubayed, N. Fuel flow control of a PEM fuel cell with MPPT. In Proceedings of the 2012 IEEE International Symposium on Intelligent Control, Dubrovnik, Croatia, 3–5 October 2012; pp. 289–294. [Google Scholar] [CrossRef]
Figure 1. FCAT30 hydrogen model of hybrid powertrain with NiMH battery (photo owner).
Energies 16 07657 g001
Figure 2. Diagram of energy flow in a hybrid drive system.
Energies 16 07657 g002
Figure 3. A view of the components of the hybrid propulsion system, including the data acquisition and visualization system.
Energies 16 07657 g003
Figure 4. View of the chassis dynamometer with its most important components.
Energies 16 07657 g004
Figure 5. View of the chassis dynamometer software screen.
Energies 16 07657 g005
Figure 6. Vehicle speed profiles on the chassis dynamometer: (a) without load and (b) with load.
Energies 16 07657 g006
Figure 7. Test results of measured quantities during hybrid drive tests: (a) without load and (b) with load.
Energies 16 07657 g007
Figure 8. Magnitudes of cell and battery power during speed profile analysis: (a) without load and (b) with load.
Energies 16 07657 g008
Figure 9. Changes in voltage and current of the cell under operating conditions: (a) without load and (b) with load.
Energies 16 07657 g009
Figure 10. Voltage–current characteristics of the fuel cell: (a) without load and (b) with load.
Energies 16 07657 g010
Figure 11. Voltage–current characteristics of the battery: (a) without load and (b) with load.
Energies 16 07657 g011
Figure 12. Power shares of hybrid drive system components under operating conditions: (a) without load and (b) with load.
Energies 16 07657 g012
Figure 13. Changes in energy of the battery and fuel cell under operating conditions: (a) without load and (b) with load.
Energies 16 07657 g013
Table 1. Vehicle model technical parameters.
ParameterUnitValue
Fuel cell
Fuel-cell typePEM
Number of cells14
PowerW30
Hydrogen pressureMPa0.045–0.055
Cell-stack massg280
H2 flow at maximum Nedm3/min0.42
System efficiency%40 (at max power)
Battery
TypeNiMH
Max output voltageV7.2
Electric capacitymAh4200
Hydrogen storage
Tank capacityNdm32 × 10
Purity%≥99.995
Form of storageAB5—metal hydrides
Tank pressureMPa3.0
Tank dimensionsmm × mmϕ22 × 88
Disclaimer/Publisher’s Note: The statements, opinions and data contained in all publications are solely those of the individual author(s) and contributor(s) and not of MDPI and/or the editor(s). MDPI and/or the editor(s) disclaim responsibility for any injury to people or property resulting from any ideas, methods, instructions or products referred to in the content.

