Abstract
A Hybrid Energy Storage System (HESS) uses DC-DC converters to couple its energy sources. However, this device represents a “dead weight” in the system and must be reduced to a minimum in order to maximize the HESS’ performance. This work proposes a new coupling architecture to reduce the converter’s volume and mass. Not yet addressed in the literature, this architecture is based on a series coupling of the sources. In this case, a DC-DC converter is used to control the current difference between the two sources. If this difference is zero, so is the power processed by the converter. By reducing the power processed by the converter, its mass and volume can be reduced. Simulation and experimental tests were carried out to validate the architecture concept. For the latter, power supplies were used to emulate the batteries and the load, and a 2 kg, 3.3 kW evaluation board served as the DC-DC converter. The results show that, compared to a conventional solution that is usually adopted in the literature, with the series architecture, it is possible to reduce the converter sizing power by almost 3.7.
1. Introduction
Currently, the majority of batteries used in electric vehicles (EVs) are of the energy type (EB) [1]. They have a high energy density (ED) but a low power density (PD). This type of energy source is perfectly suited to ensure long range for EVs that carry a heavy battery. The high on-board battery mass compensates the low PD. This results in EVs capable of withstanding high-power dynamics (high speeds and acceleration). This solution meets the requirements of high-end EVs. However, regarding the development of environmentally friendly individual transport solutions, other options need to be studied [2]. To expand the fleet of EVs, the development of lighter vehicles must be considered [3,4]. These vehicles are powered by smaller batteries with shorter range. Thus, this type of EV consumes fewer resources and less energy.
Unfortunately, the ED-PD levels of EBs lead to a sharp power degradation of these EVs. To avoid this problem, a Hybrid Energy Storage System (HESS) can be an interesting solution. It consists of combining a high ED source with a high PD source. The most widely studied HESS couplings use supercapacitors (SCs), which have a very high PD and use lithium-ion (Li-ion) batteries of the energy type [5,6]. However, new Li-ion batteries with very high discharge and recharge PDs have appeared in the last years [7]. These power batteries (PB) can almost compete with SCs in terms of PD [8], but they present higher levels of ED. So, in an EB–PB combination, both sources can contribute to power and energy, with compatible voltage ranges. This type of pairing is also called a Dual Battery Storage System (DBSS).
Numerous studies have been carried out focusing on the combination of two batteries [9,10,11,12]. A HESS composed of a lead–acid (LA) battery as the energy source and a Li-ion battery as the power source was proposed [9] to power a light EV. The aim was to reduce the cost compared with a solution, based only on a Li-ion EB, and to also improve the performance compared with a single LA battery solution. The results show that, compared to an LA battery, the proposed HESS improves the range by 17% and the efficiency by 23% during continuous low-speed driving. In another study [10], a DBSS combining a Li-ion battery and a lithium–silicon (Li-Si) battery, in a simulation environment, has been proposed for an EV with a range of 600 km. Li-Si cells are an emerging technology that offers higher ED than Li-ion cells, with up to a 16% improvement for the same mass [11]. However, they are not suitable for delivering power in fast transient pulses. Thus, a Li-ion battery was used as a power source and a Li Si as an energy source for range extension, providing the required average power. It was concluded that the combination of the two batteries results in storage systems lighter than those using Li-ion batteries alone. Finally, in [12], the hybridization of an LA battery and a Li-ion battery was compared to the individual use of each battery in a hybrid vehicle. The results show that the use of a DBSS can lead to energy savings of up to 68.6% in the LA battery and up to 29.5% in the Li-ion battery, thereby prolonging the range of the vehicle.
In a HESS, one or more DC-DC converters are used to manage the energies of the storage units [13,14,15]. The way they are connected to each other is called coupling architecture. The converters are used to control the distribution of the power supplied by each source, to ensure that they do not exceed their power limits and that they discharge appropriately. In fact, since the PB is the least energetic source, it discharges more quickly. However, it must also have the energy required to provide the necessary power to the HESS throughout the EV journey. This means that the batteries states of charge (SOCs) must evolve together.
The characteristics of a HESS are defined according to the densities of the energy accumulators. Essentially, a HESS is the combination of different energy and power densities to obtain a final value adapted to the requirements. A Ragone diagram is used to compare different storage technologies. Choosing a high ED Li-ion battery and a high PD Li-ion battery, the resulting HESS is given by the red line in Figure 1. This characteristic is a function of the source ratio to the complete system. As an example, if the proportion of EB in the system is greater than that of PB, the HESS characteristics will be further to the right in the diagram.
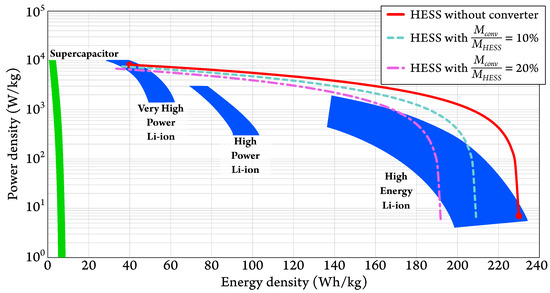
Figure 1.
Influence of the converter mass in a HESS.
It can be seen that with this combination, it is possible to obtain a storage system with higher density values than the current technologies can provide. However, the mass of the power electronics degrades the performance of the system, as it is a “dead weight” from an energy point of view. Its mass is referred as in Figure 1, and the total mass of the HESS is . It can be seen that as increases, the trajectory of the red line degrades (light blue and pink lines). In this case, the use of a HESS is of no interest, as its performance is close to that which can be obtained with existing solutions. Consequently, a HESS is only of interest with a light converter. Therefore, reducing the converter’s mass is essential to guarantee the high performance levels of the HESS.
Several approaches are possible for reducing the power electronics of a HESS. In this work, an original coupling architecture is proposed. It applies the concept of partial power processing (PPP), where only part of the power is processed by the converter. Most of the energy flows directly from the input to the output without being converted, with unit efficiency [16]. This enables the minimization of the converter sizing power, and therefore, its mass and its volume. In the architecture presented here, the processed partial power is controlled by making the converter work on part of the flowing current. This is made possible by connecting the HESS sources in series.
In Section 2, classical coupling architectures are presented, along with rules that can be applied to reduce the size of a converter. The cascade-type architecture proposed in [17] and modified in [18] is also described and analyzed. In Section 3, the concept of a new series architecture is proposed. Section 4 presents the elements for power sizing the series architecture converter. Simulation-based designing is presented in Section 5, along with an experimental validation of the solution operation on a test bench and a discussion about the obtained results.
2. Coupling Architectures for DC-DC Converter Downsizing
Five rules can be applied to reduce the size and volume of a HESS coupling converter:
- Limit the number of converters;
- Limit the power processed by the converter(s);
- Limit the design power (Volt–Ampere rating of the components);
- Limit functionalities (voltage and/or current reversibility, etc.);
- Increase switching frequency to reduce the size of the passive components.
Certain coupling architectures (Figure 2), referred to here as classical architectures, are widely developed in the literature [19,20]. According to the first rule for converter reduction, the best solutions are the direct connection (Figure 2a) and the cascade architecture with only a 1 DC-DC converter (Figure 2b). However, the absence of a converter in the former prevents any power or energy control. The second solution is therefore a good compromise, if the voltage of source 2 is compatible with the DC bus voltage [21].
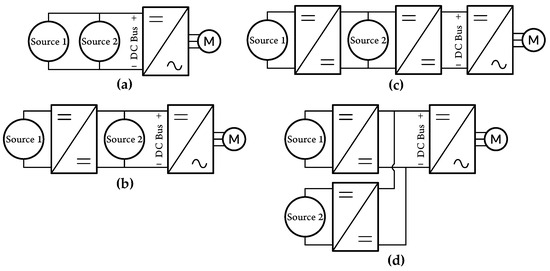
Figure 2.
Classical HESS coupling architectures: (a) direct connection, (b) cascade with a 1 DC-DC converter, (c) cascade with a 2 DC-DC converters, and (d) parallel.
Inspired by the cascade architecture with a 1 DC-DC converter, a variant based on a controlled current source (CCS) converter was proposed in [17] and is shown in Figure 3. The main advantage of this architecture is that the output of the DC-DC converter is not connected directly to the DC bus but between the two batteries. As a result, the power processed by the converter does not depend on the total voltage but on the voltage difference between the two batteries. This limits the converter sizing power, and therefore, its mass and its volume. The disadvantage of this solution is that the output converter, which in this case is a rectifier, is bidirectional in current and reversible in voltage. As a result, switching is problematic due to the leakage inductance of the converter transformer and the use of the bidirectional current and voltage switches. This complicates the control of the semiconductors and reduces the converter efficiency (limited to 85%). Despite this, the global equivalent efficiency, i.e., the ratio between the power requested by the EV and that which is supplied to it, is very good, at around 98%. This notion of global equivalent efficiency is explained in greater detail at the end of the article.
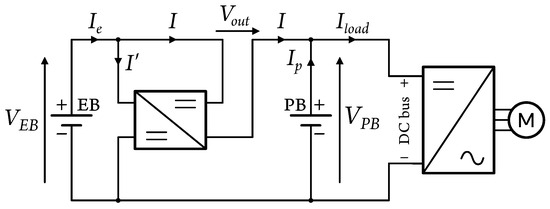
Figure 3.
Controlled current source (CCS) cascade architecture, as proposed in [17].
In [18], a modification applied to the rectifier was proposed, making it only bidirectional in current and not reversible in voltage. This reduces the size of the converter, since there are fewer transistors. In addition, the control of the rectifier is simplified and the efficiency of the converter is increased. A comparison was made, and it was shown that a CCS cascade architecture converter can be more than twice lighter and almost five times smaller than a conventional solution using a single converter with interleaved cells.
3. Series Architecture
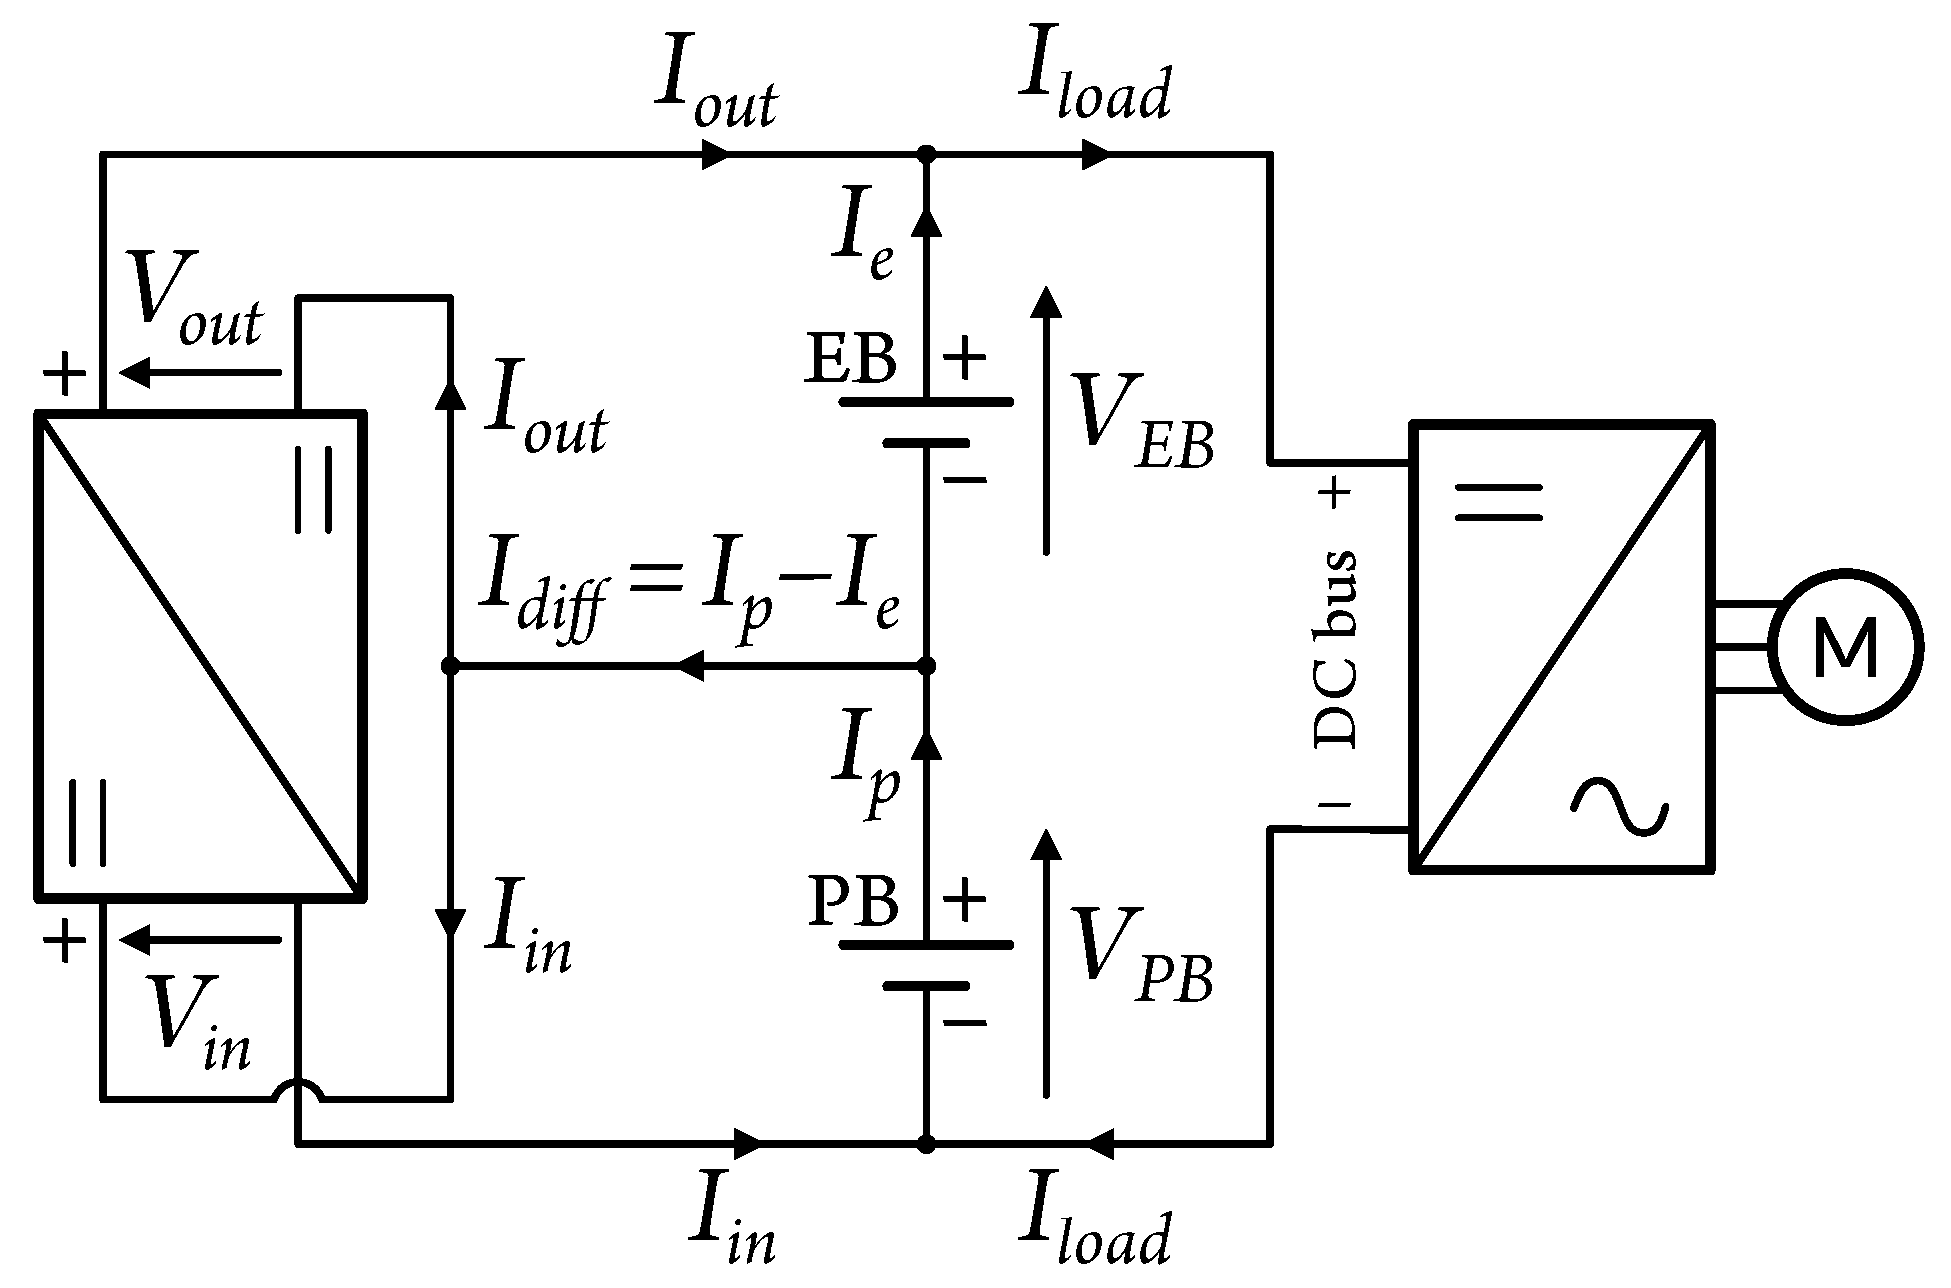
Inspired by the principle of arranging sources to limit the converter voltage, the concept of a new architecture is proposed in this article. This is the series architecture considered as a “dual” solution to the CCS cascade architecture. In this case, the two sources are connected in series. Therefore, it is the current difference between them that is applied to the converter and shapes the converter’s processed power.
The schematic diagram of the series architecture is shown in Figure 4. In this solution, the power is “naturally” distributed between the batteries via the distribution of their voltages, with their sum being equal to the DC bus voltage and their current being the same without the action of the converter. The power supplied to the EV is equal to the sum of the power supplied by the batteries. The battery with the highest voltage corresponds to the one supporting the highest power. Therefore, the DC-DC converter job is to balance the batteries SOCs while preserving their current limits.

Figure 4.
Series architecture.
When the EV is in use, the converter presents three operating modes linked to the vehicle’s constraints: strong acceleration, strong braking, and normal driving (constant speed and low acceleration or braking) in driving mode. Recharging the batteries produces the same modes, but this stationary use phase is not covered in this article.
In the first two cases, the batteries supply the maximum power required by the load. The DC-DC converter must therefore ensure that the batteries deliver the required power within their limits. To minimize the power processed by the converter during these phases, the batteries are sized to have equivalent admissible currents. If the admissible currents are different, the converter must compensate this difference (Figure 5 and Figure 6). If the three current limits are equal, the converter must be disabled so that the battery limits are not exceeded (Figure 7).

Figure 5.
Series architecture with .
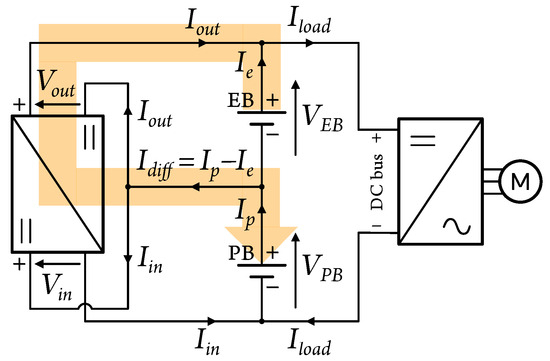
Figure 6.
Series architecture with .
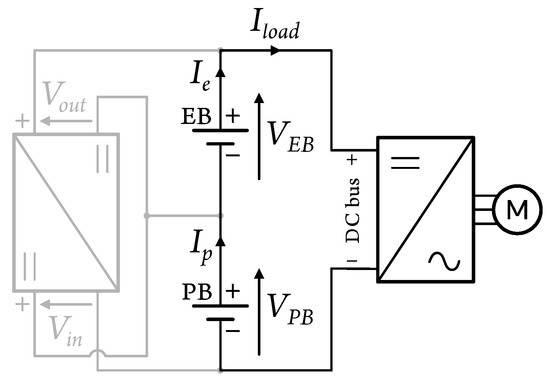
Figure 7.
Series architecture with .
In normal driving conditions, the batteries are below their limits. The converter can therefore manage the power flow between the batteries so that their SOCs are controlled, ensuring that they have energy available throughout the EV use.
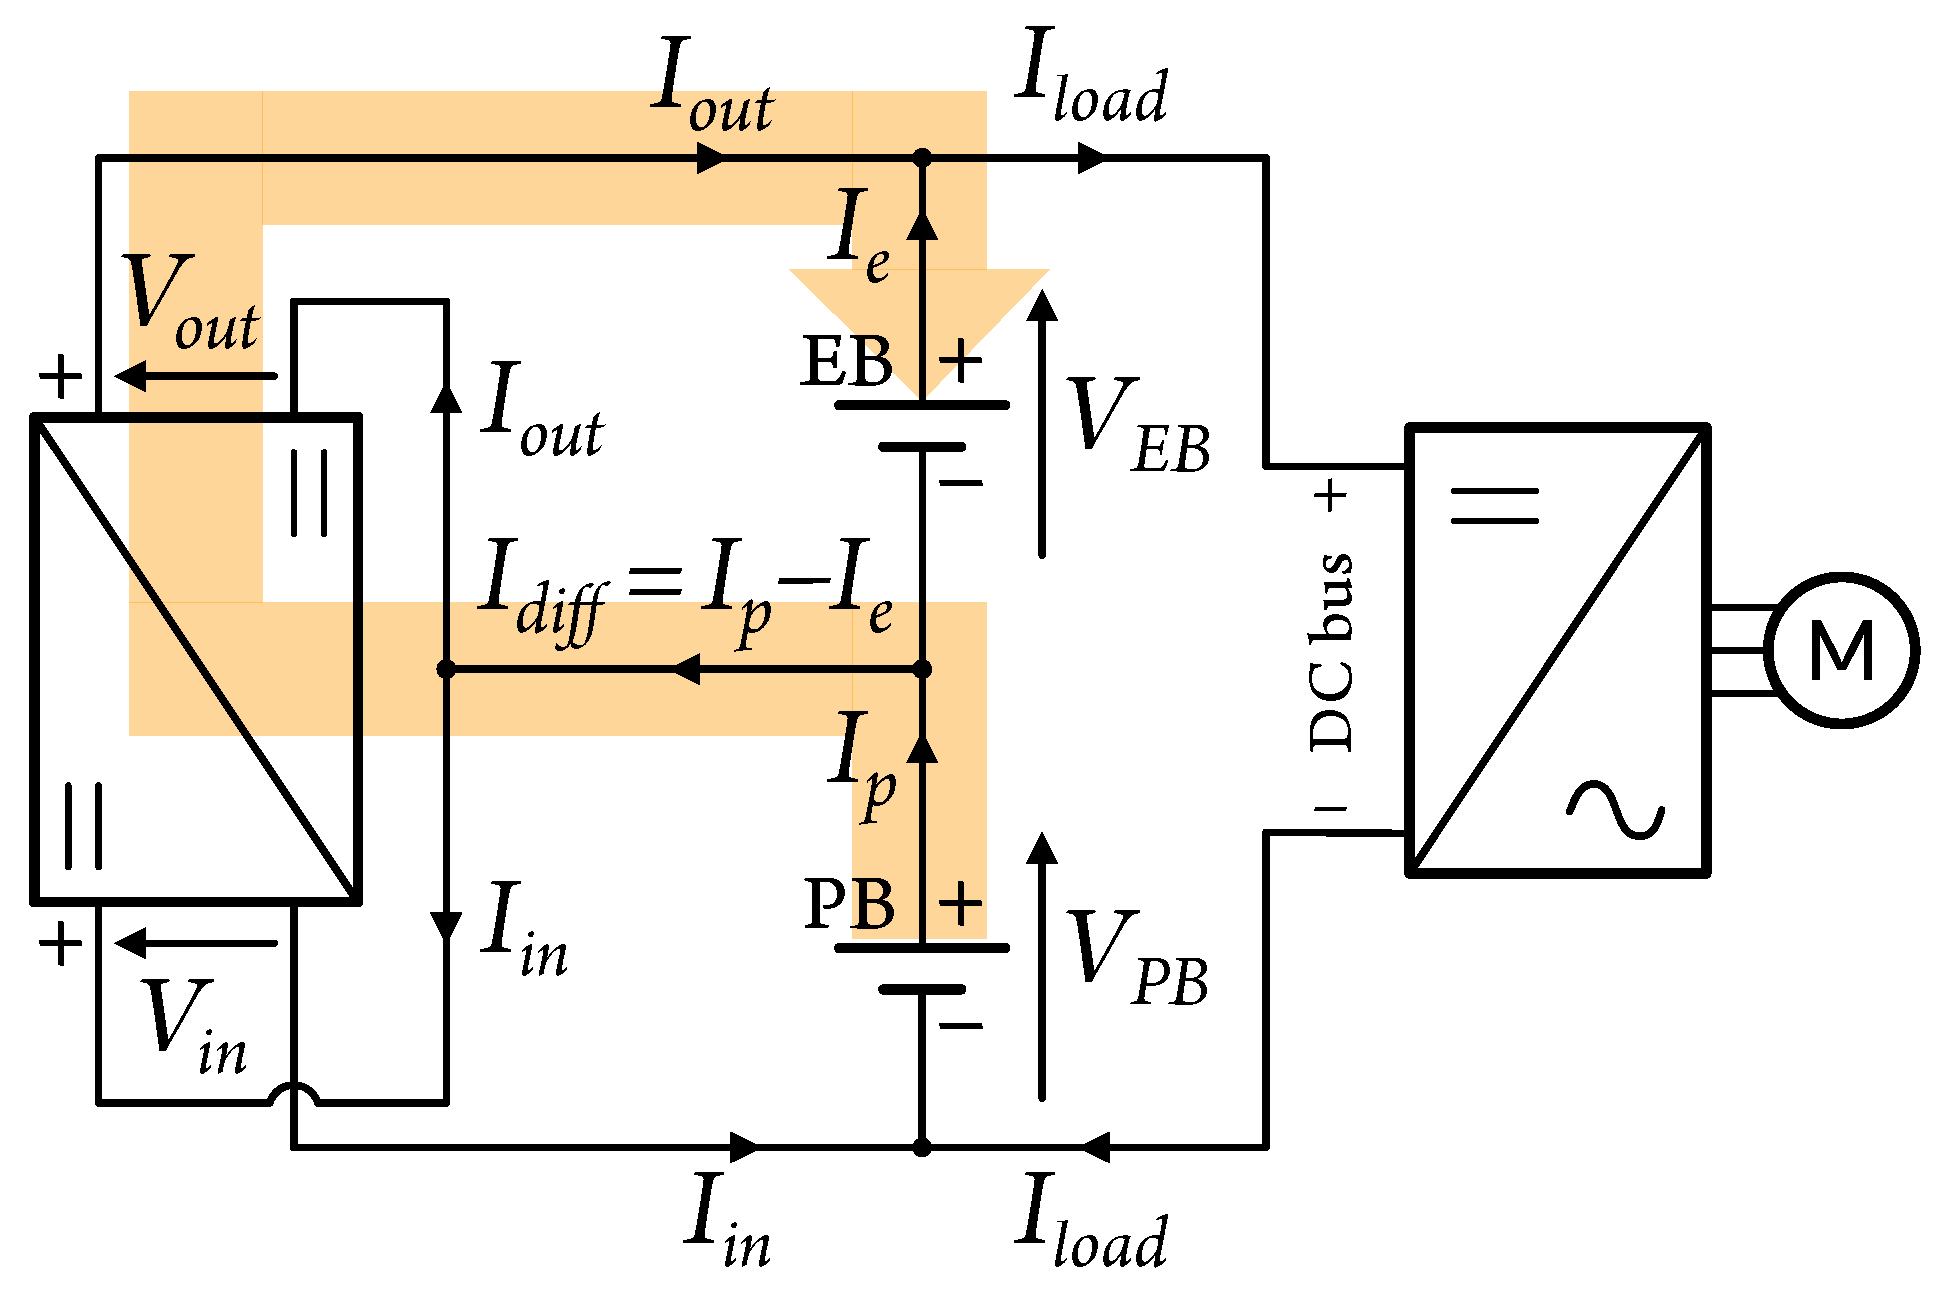
Figure 5 shows the operating mode in which the converter transfers positive power from to . When used in the discharge phase (EV acceleration), the power supplied by the PB increases, being made up of its contribution to the load plus a portion destined for the EB. This means that the power processed by the EB decreases and it discharges less quickly. At the same time, the power processed by the PB increases, accelerating its discharge. In the recharging phase (EV braking), this mode of operation speeds up the recharging of the EB and slows down that of the PB.
In the case shown in Figure 6, the converter transfers negative power from to . In this mode, part of the power supplied by the EB goes to the PB. So, during discharge, the EB discharges faster, while the PB discharges more slowly. During recharging, the EB recharges slower and the PB faster.
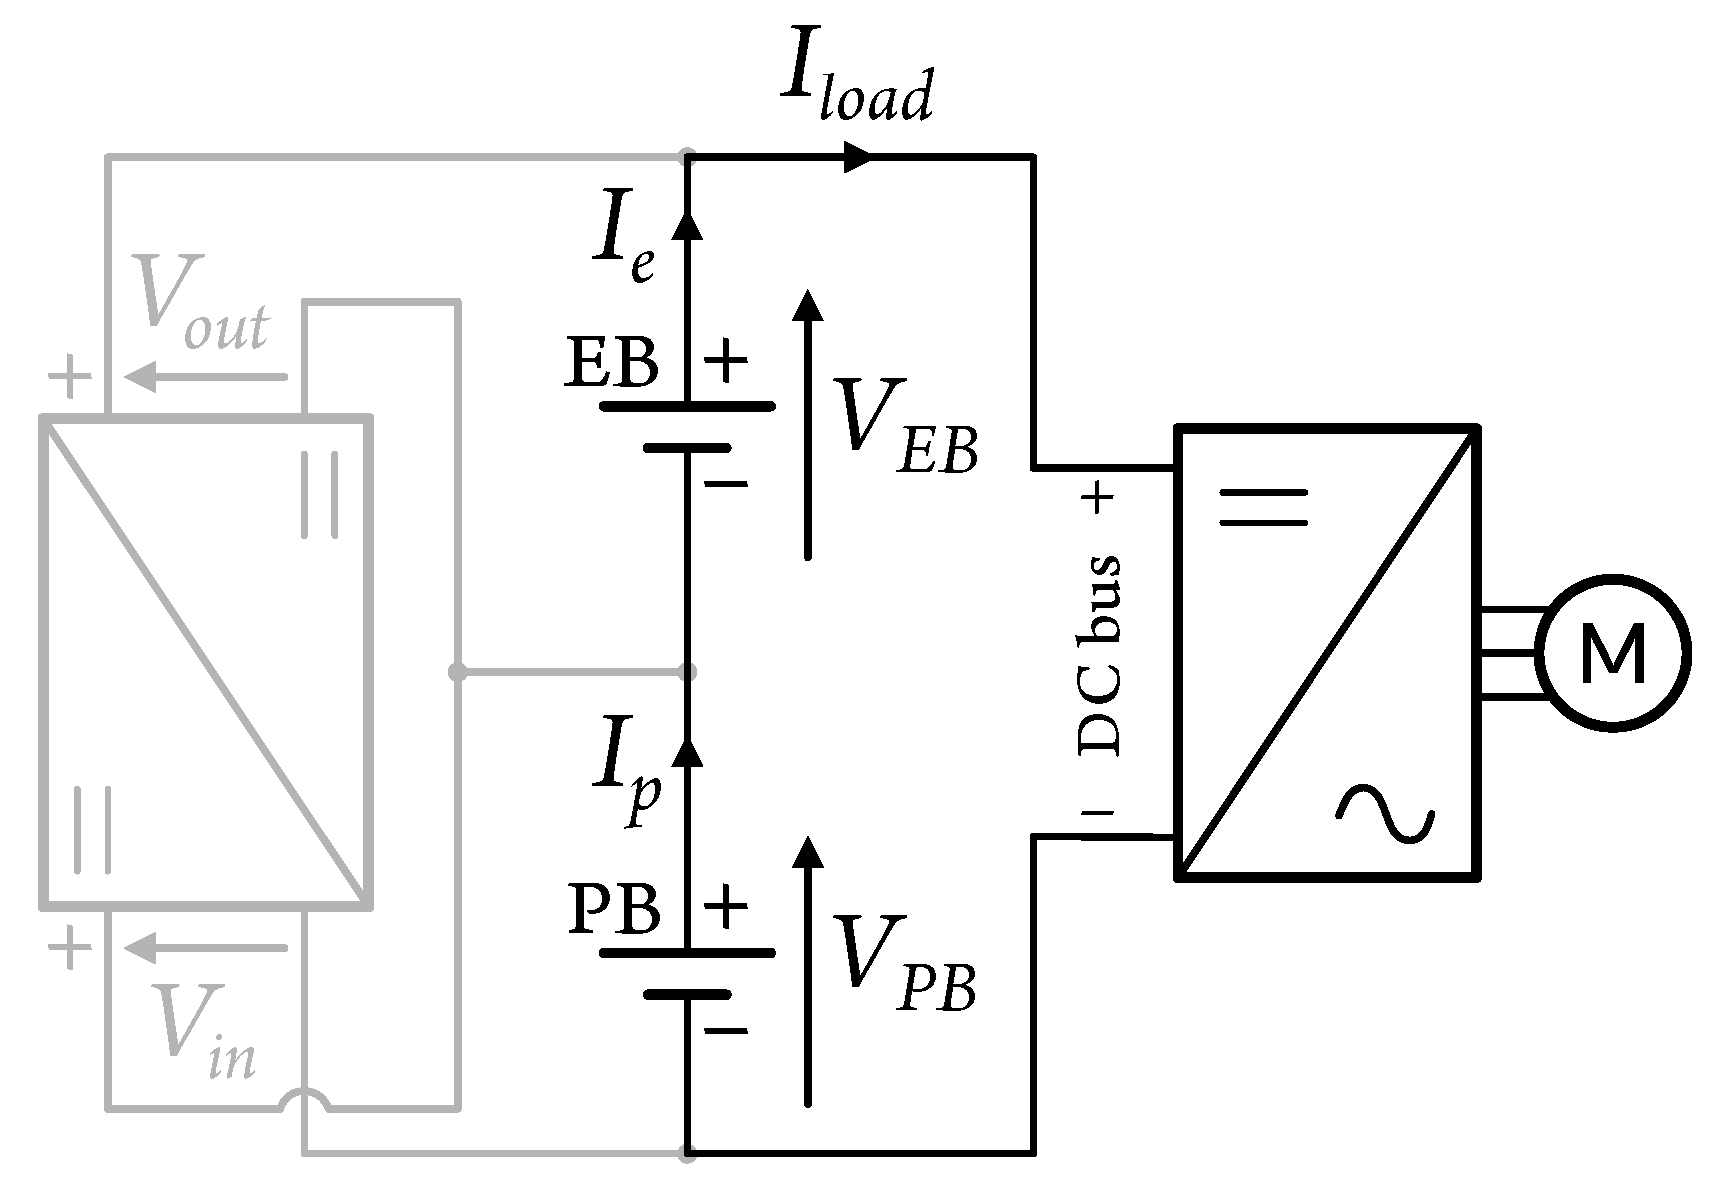
According to the notation in Figure 4, the power processed by the converter () is given by Equation (1), and that of the batteries, and , by Equations (2) and (3), respectively. The load power () is therefore equal to the sum of the battery powers and does not depend on the converter power (4).
Equations (2) and (3) are combined in (5) to determine the power processed by the converter, which can be written as a function of the power supplied by the EB (6) or by the PB (7). It is therefore given by the voltage difference between the sources, the load voltage, and the power supplied by one of the batteries.
The described expressions of lead to the instantaneous value of the converter processed power. To validate the interest of the series architecture, it is necessary to determine the sizing power of the converter.
4. DC-DC Converter Sizing Power
Before sizing the DC-DC converter power, it is necessary to size the other elements of the HESS, i.e., the batteries that will power the EV. They are obtained from a driving cycle, the mechanical model of the vehicle, and the characteristics of the storage cells. The recovery of braking energy also influences the batteries sizing and, even using the same cells, leads to different mass values, as will be shown next. The converter sizing power is then obtained by simulating driving cycles with the predesigned batteries characteristics. This approach, however, requires the implementation of energy management strategies adapted to the architecture.
To demonstrate the benefits of a reduced-range EV, a desired range of 150 km is defined. As a mechanical EV model, the Bluesystems Bluecar is considered, with a total loaded mass of 1400 kg. It is a light EV, whose model characteristics are presented in [22].
A driving cycle based on measurements under real-life conditions is preferable for sizing purposes. This is why the Artemis cycle [23] is used, comprising its urban and rural road parts (Figure 8). The target range of 150 km is achieved by repeating the Artemis cycle seven times. Therefore, the energy required to complete this cycle is 16.7 kWh, with a maximum power of 44.3 kW and a minimum power of −50 kW, as shown in [18]. The DC bus voltage is assumed to be 400 V.
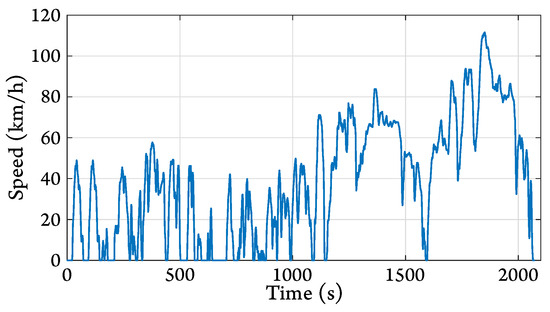
Figure 8.
Employed Artemis cycle.
As energy sources, two cells are considered in this article: an EB Panasonic Li-ion NCR20700B [24] and a PB A123 Li-ion AHR32113M1 [25]. The cells electrical characteristics, such as voltage, capacity, energy density, and power density, are presented in [26], along with the battery sizing method.
Two pair examples are considered (Table 1 and Table 2), both based on combinations of Panasonic for EB and A123 for PB. The first pair meets the specifications, being capable of recovering all braking energy. Its electrical characteristics are shown in Table 1. The second pair has limited electrical braking power. This reduces the total mass of the batteries, but also implies a reduction in the energy boarded by the PB (3.4% of the pair energy, compared with 17.9% for the first pair). The electrical characteristics of this pair are shown in Table 2.

Table 1.
Panasonic–A123 couple.
Table 2.
Panasonic–A123 couple with reduced braking power.
Once the batteries have been sized, an energy management strategy adapted to the series architecture must be established so that the driving cycle simulation can be carried out. In this article, the strategy presented in [27] is used. The connection of the batteries in the series architecture allows for a “natural” distribution of power via the distribution of the batteries’ voltages. Hence, the management strategy considered is defined by the need for energy balance and the limitation of power and SOC. The aim of energy balancing is to discharge the two batteries in a globally proportional manner. The final SOC is set at 20%. This is also the minimum SOC that the batteries must not exceed during EV operation. Balancing is carried out continuously and determines the converter operating mode (Figure 5 and Figure 6). The batteries are sized to have equivalent current limits. In moments of high-power transients, the converter can be disabled (Figure 7) to ensure that the limits of the batteries are respected. However, there are cases where the discharge or the recharge current limits are not equivalent. In such cases, the converter must compensate this difference.
5. Validation of the Series Architecture
In order to validate the series architecture concept, simulation and experimental tests were carried out and are presented in the following subsections. To complete this validation, a comparison is made later between the series architecture and the classic cascade with the 1 DC-DC converter architecture.
5.1. Simulation Results
In this subsection, MATLAB® simulations are used to analyze the evolution of the power processed by the converter and to obtain its sizing power. The latter is given by the product of the maximum current of the converter processes and the maximum voltage applied to it during the operating cycle. A total of four cases are considered. In the first two, the battery pairs (Table 1 and Table 2) are considered as perfect sources. In the last two, the cells’ internal resistances are included in the simulations. This way, sizing powers closer to those of a real system can be obtained. In all four cases, the converter is considered as an ideal, lossless device, processing a certain power value determined by the management strategy. Since the power processed by the converter corresponds to a small portion of the power processed by the batteries, the overall efficiency of the system is very high. Therefore, the converter’s losses can be neglected. The presented simulations also make it possible to validate the series architecture concept.
5.1.1. Pair with 100 % Regenerative Breaking
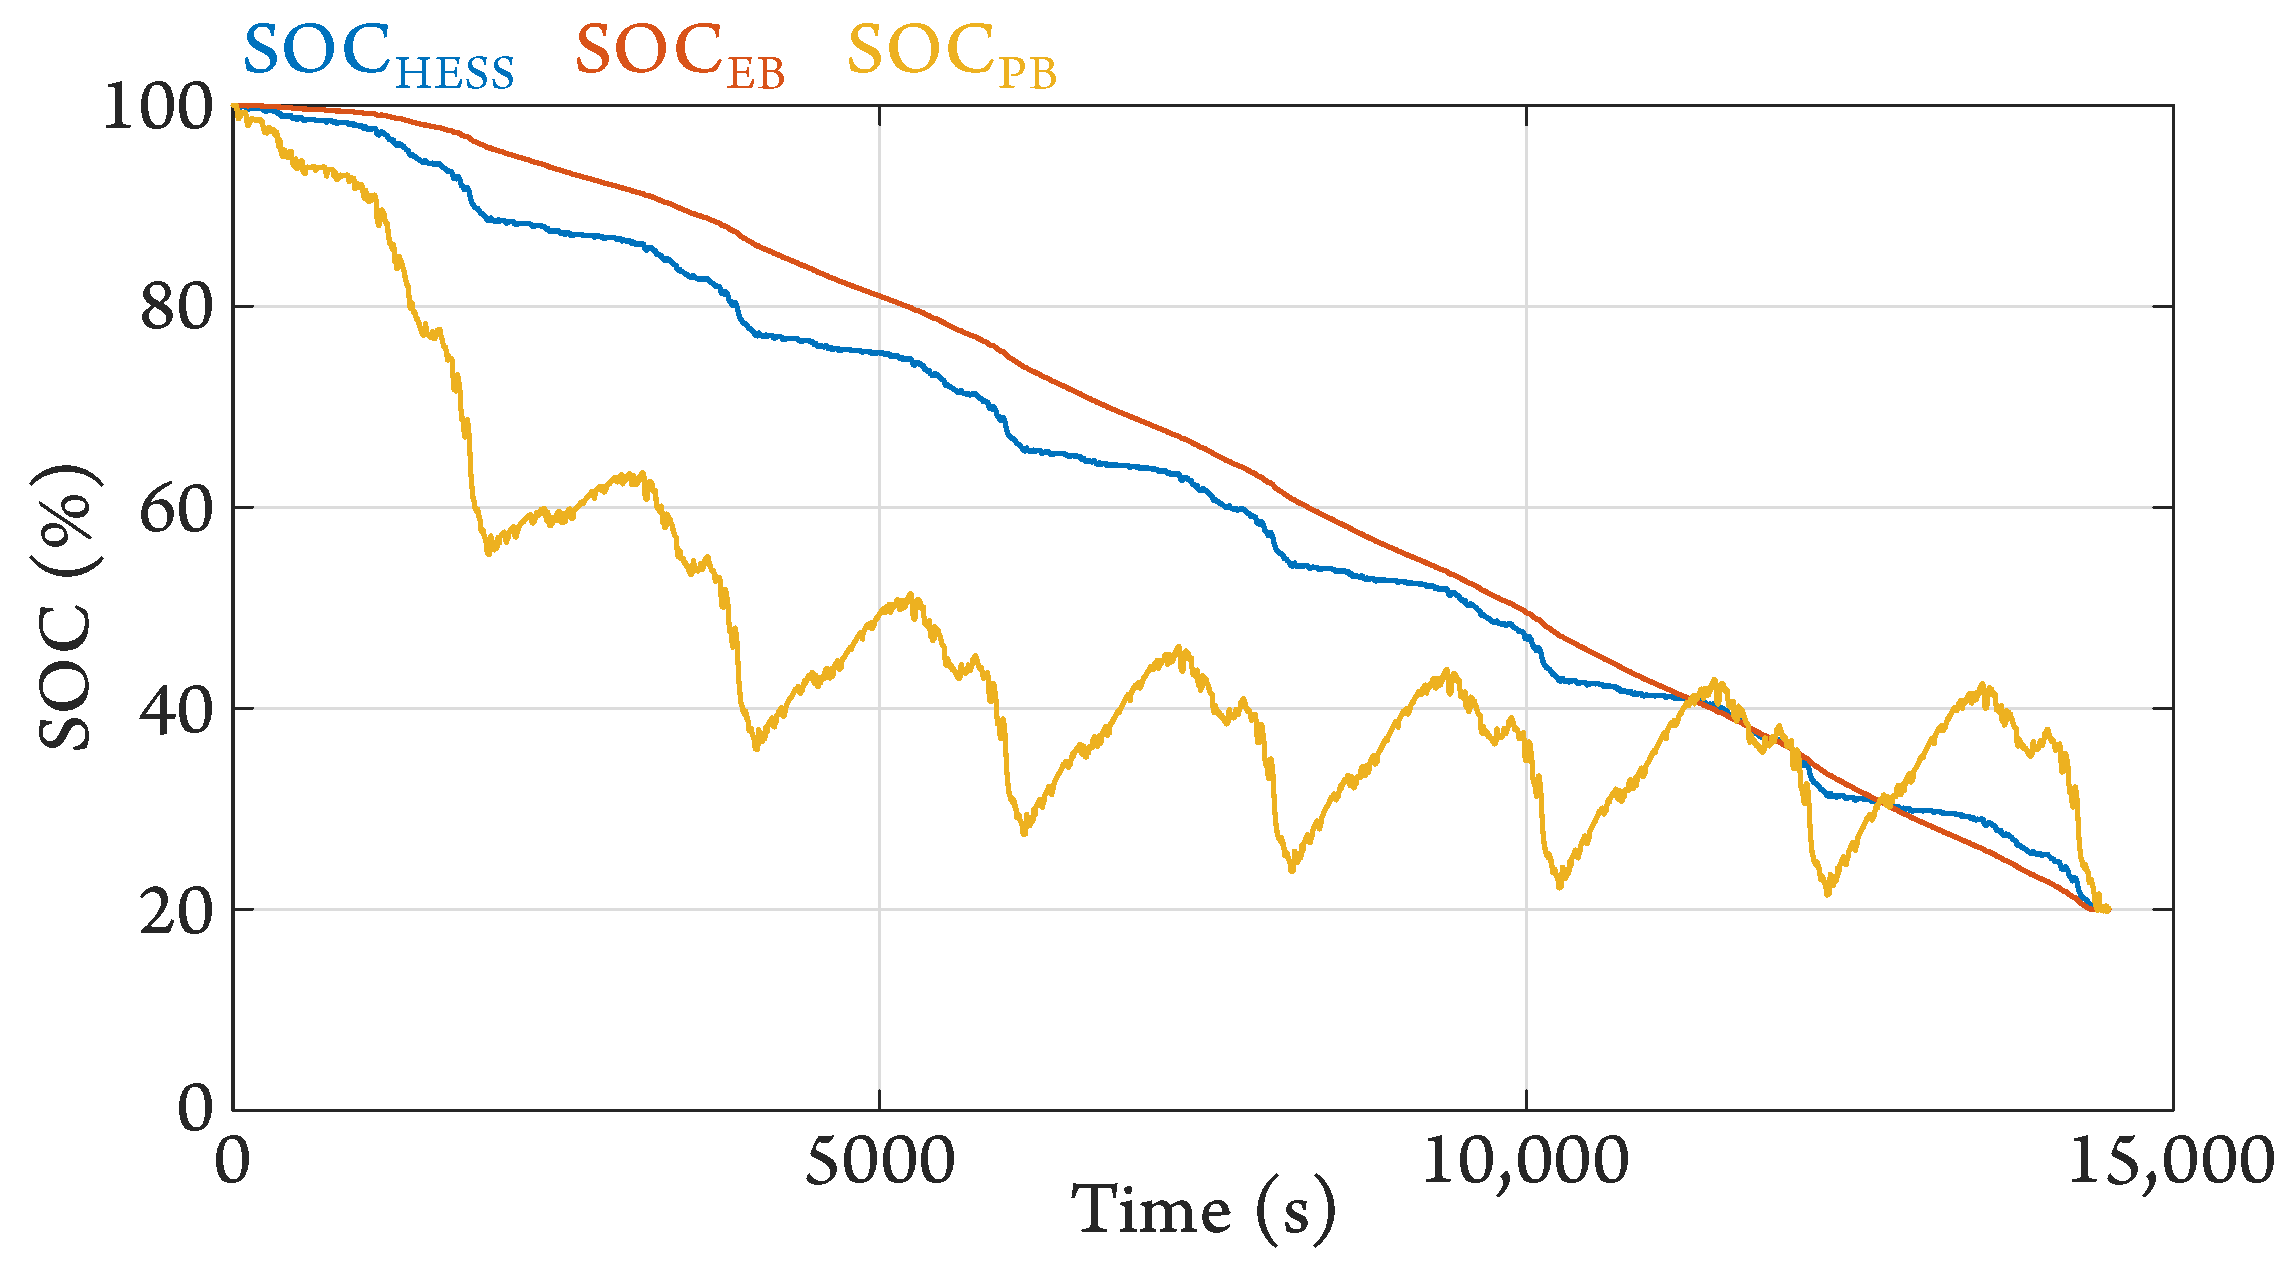
For this first pair (Table 1), Figure 9 shows the evolution of the SOCs. It can be seen that the strategy is well implemented, with the SOCs always being above 20% during EV operation and reaching this same value at the end of the cycle.
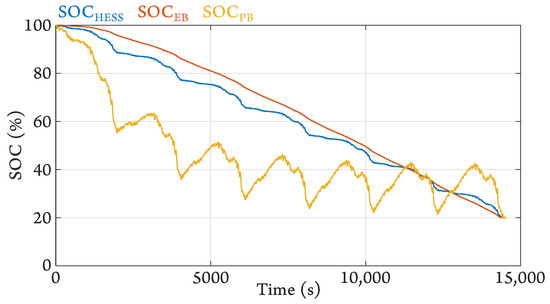
Figure 9.
SOC evolution of the Panasonic–A123 pair.
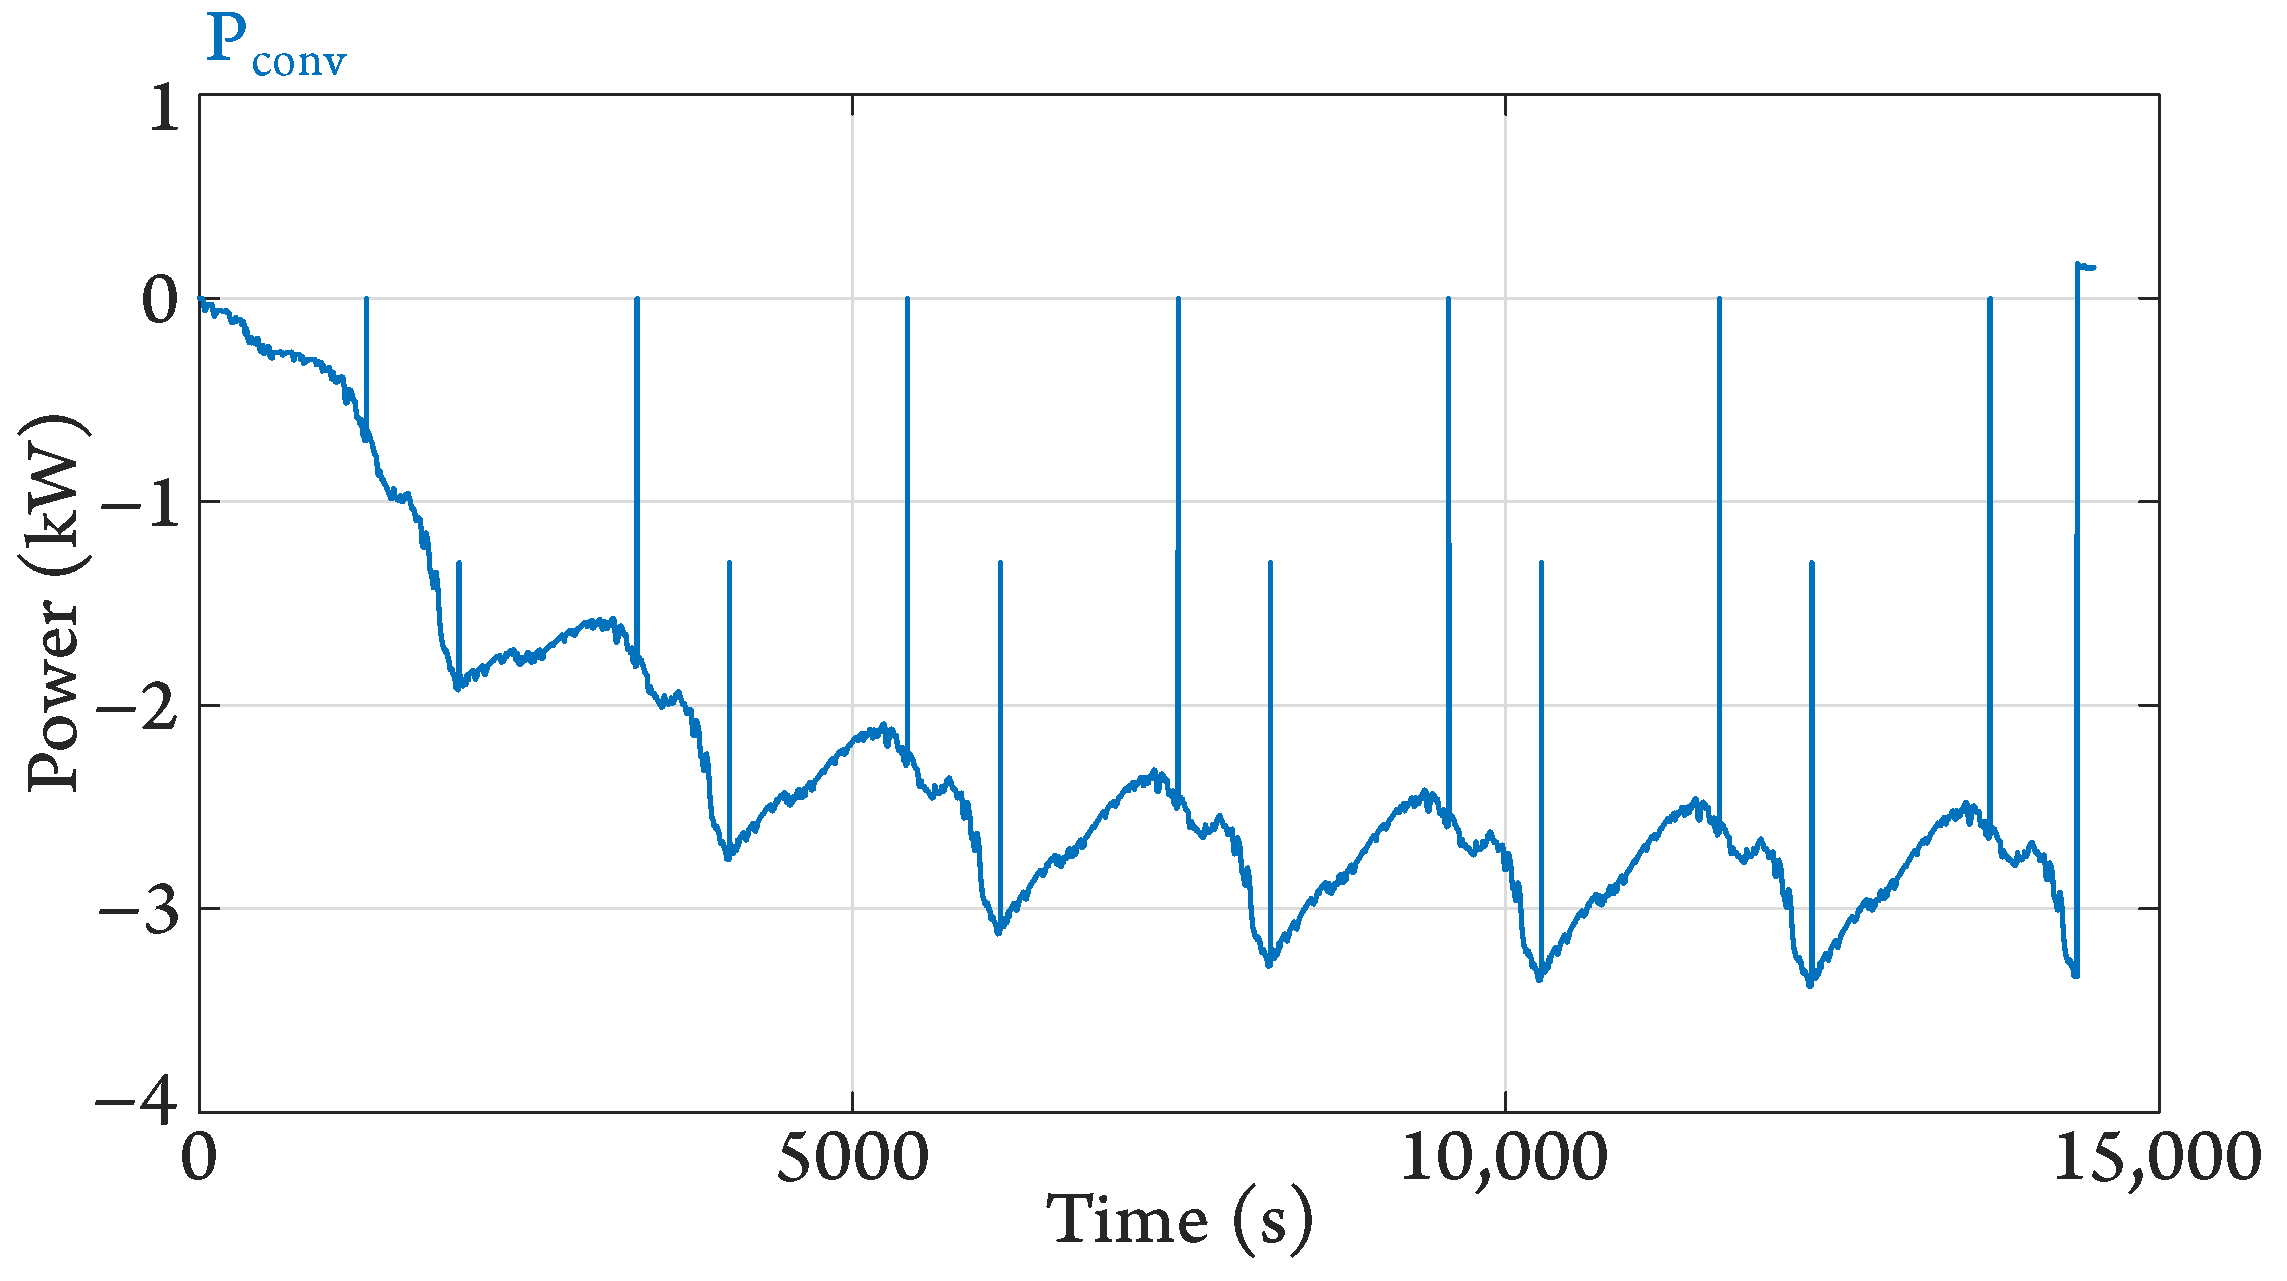
The evolution of the converter power is shown in Figure 10. Most of the time, the converter performs energy balancing. At moments when braking is more intense, peaks at 0 W and −1.3 kW appear, to ensure that the limits of the batteries are respected and to compensate for the current difference between them. This operating mode results in a converter sizing power of 3.38 kVA.
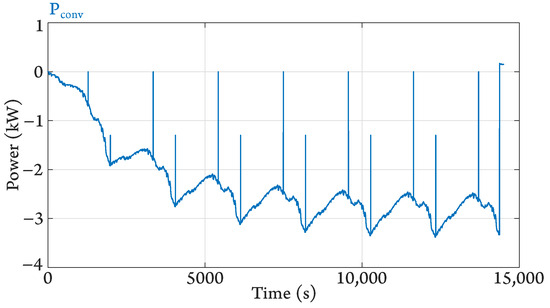
Figure 10.
Power processed by the converter of the Panasonic–A123 pair.
5.1.2. Pair with Reduced Braking Power
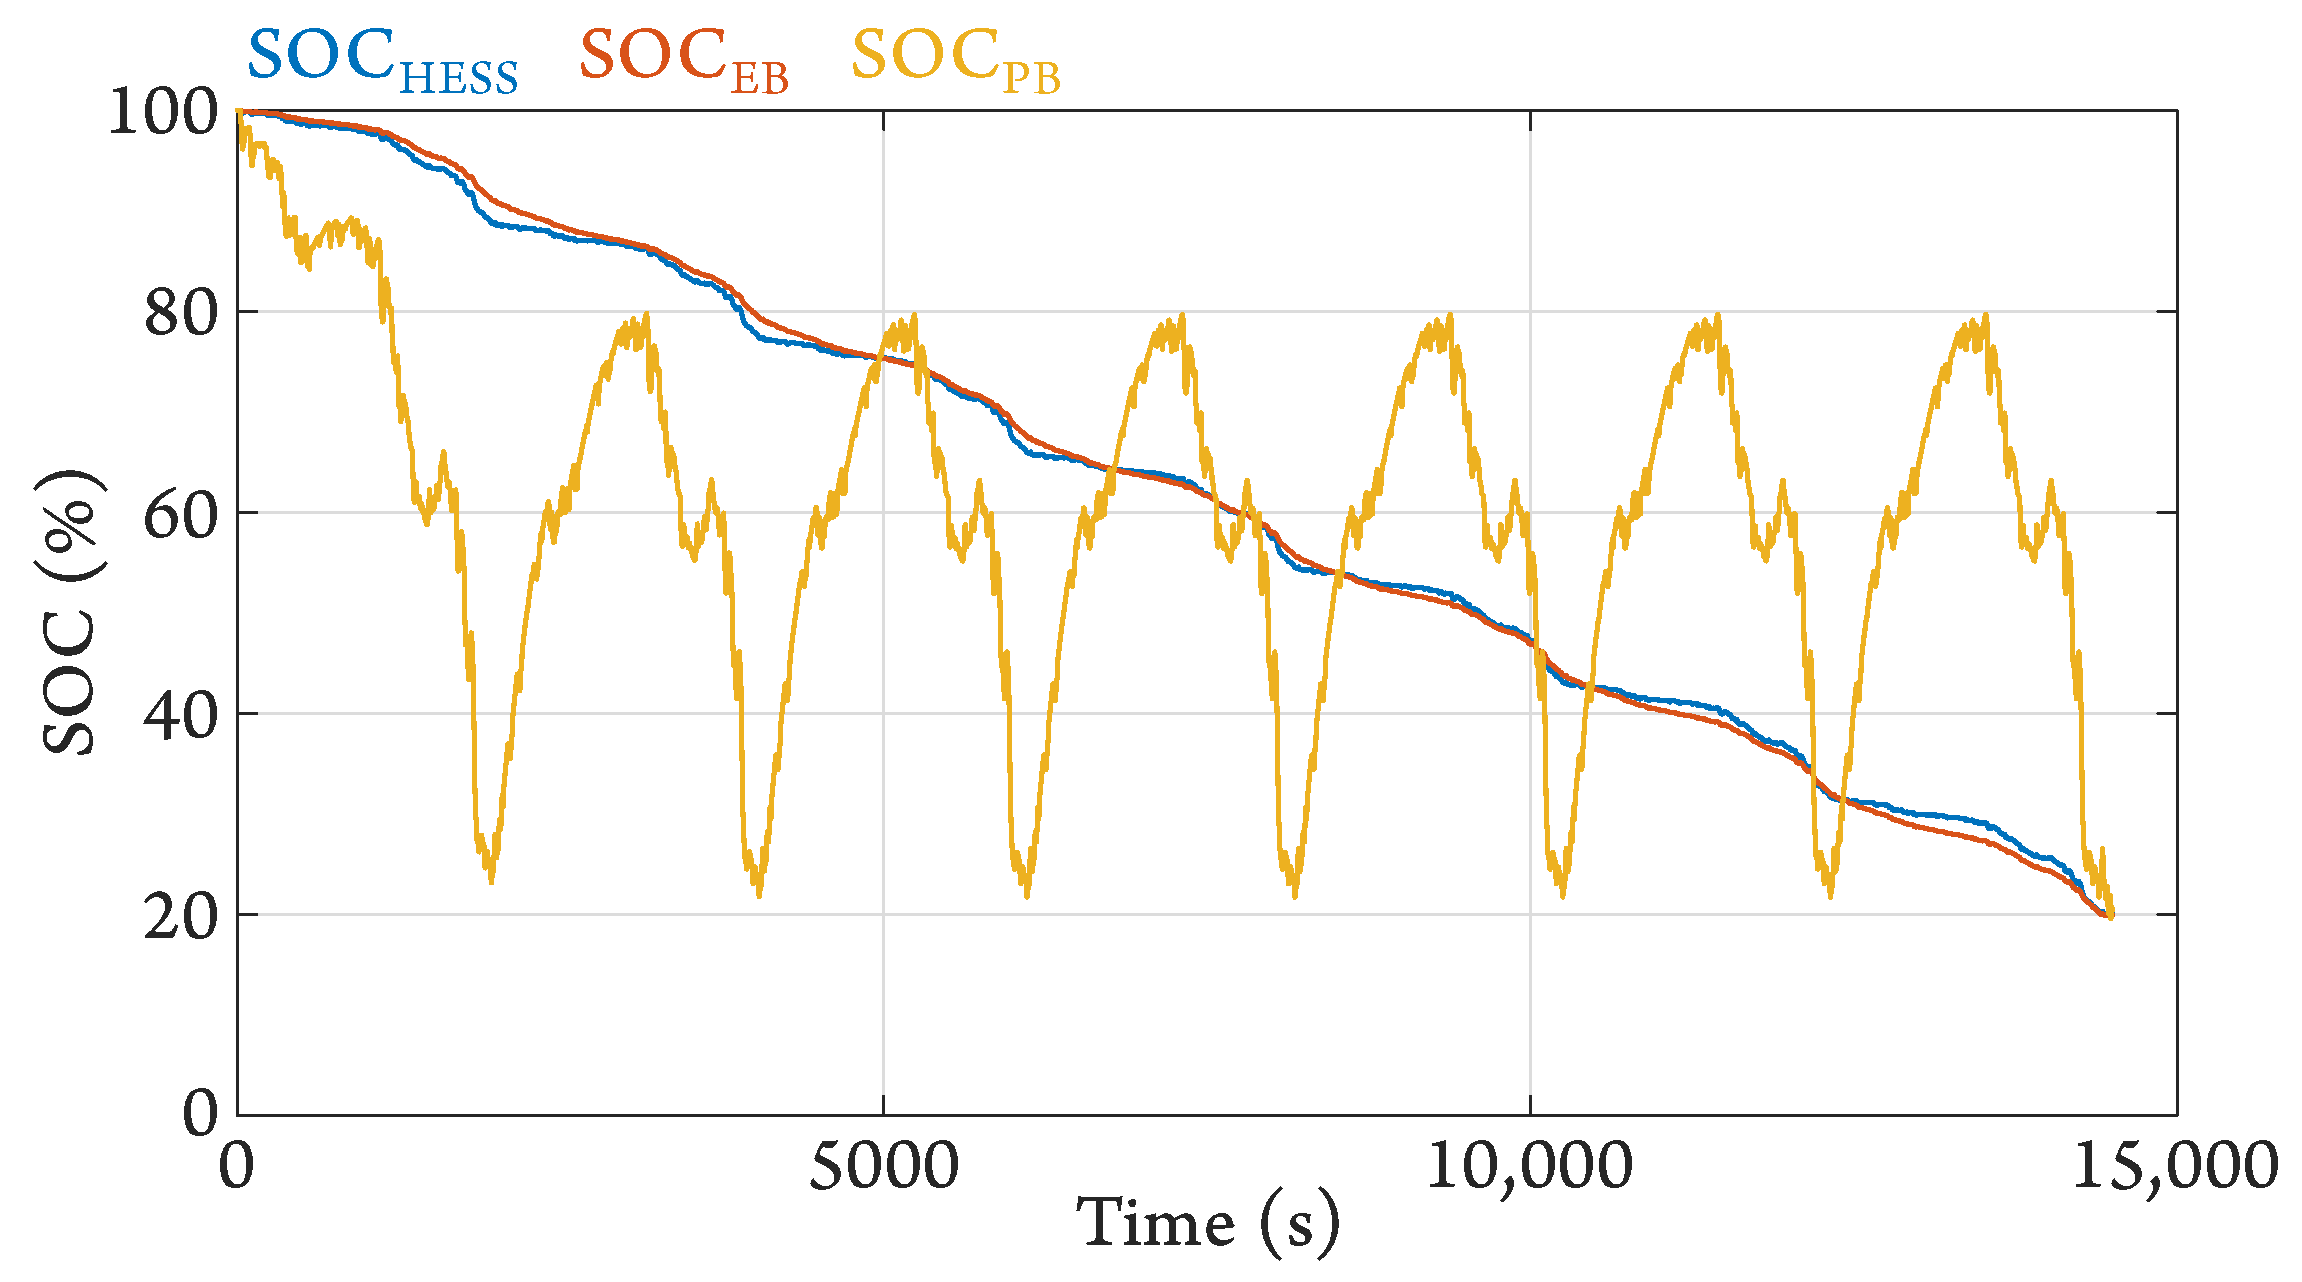
The evolution of the SOCs for this pair (Table 2) is shown in Figure 11. In this case, the PB carries only 3.4% of the HESS energy. The discharge depth of this battery is therefore greater. Nevertheless, the management strategy works as expected and the batteries discharge proportionally.
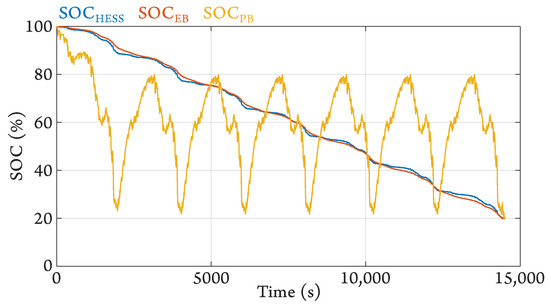
Figure 11.
SOC evolution of the Panasonic–A123 pair with reduced braking power.
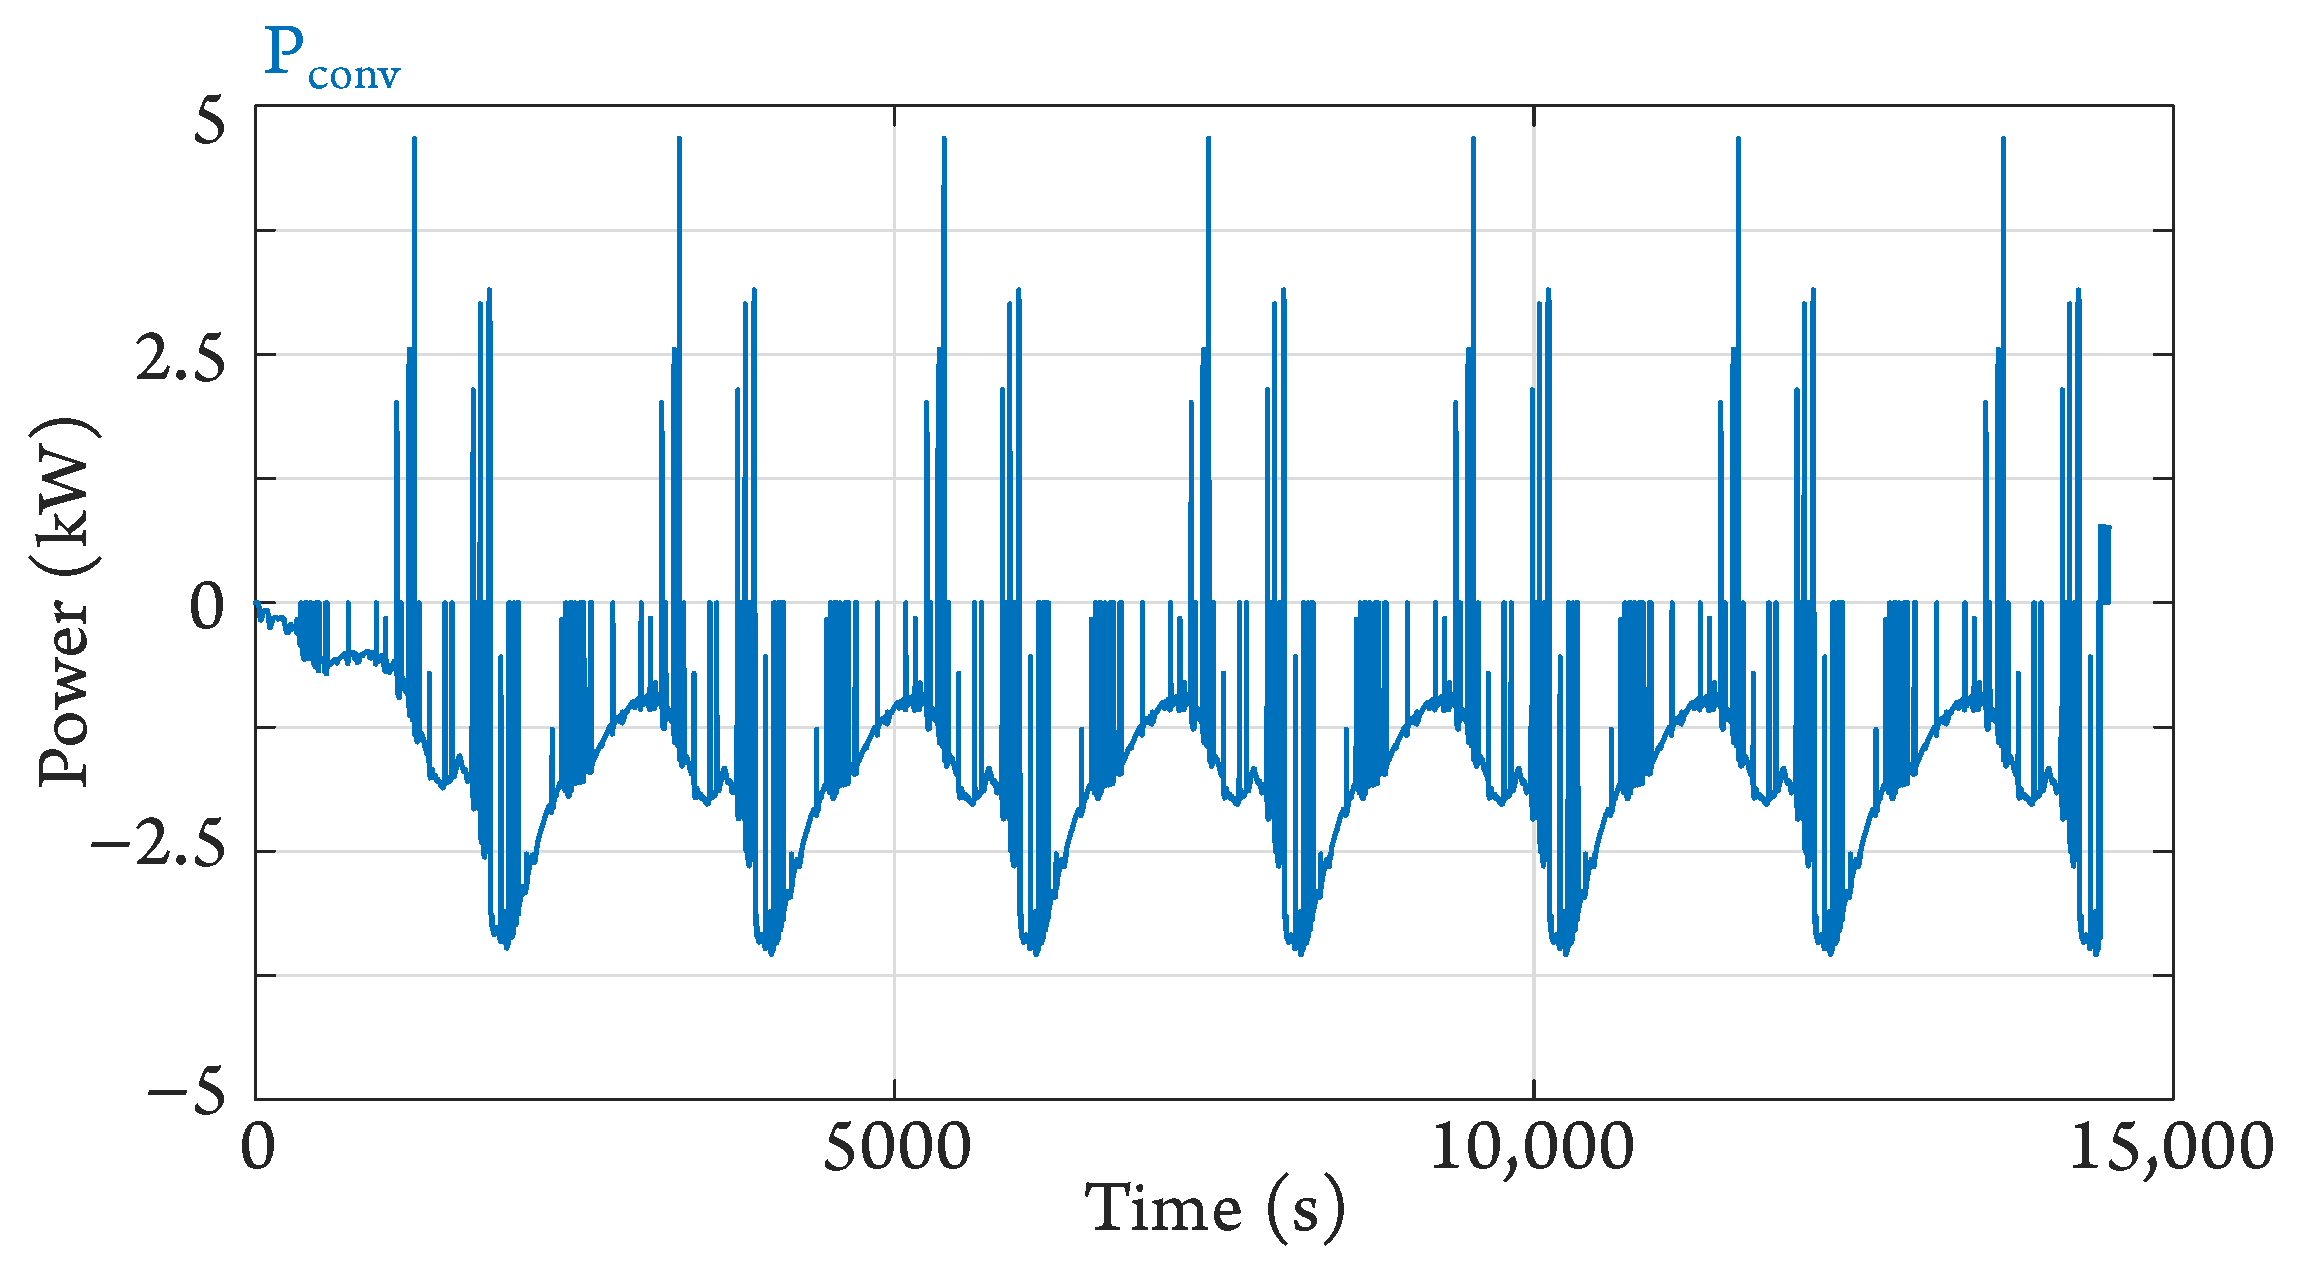
The converter power evolution is presented in Figure 12. In this case, the maximum battery charging currents are equivalent. So, when the braking power reaches the limit of −17.4 kW, the converter is disabled. On the other hand, the maximum discharge currents are not equal. During moments of strong acceleration, the converter processes’ peaks of 4.67 kW compensate the difference between these currents. The rest of the time, the converter is divided between energy balancing and current difference compensation. The converter’s sizing power is determined so that it is capable of processing all the power values obtained in the simulation. Its sizing power for this pair is then equal to 4.67 kVA.
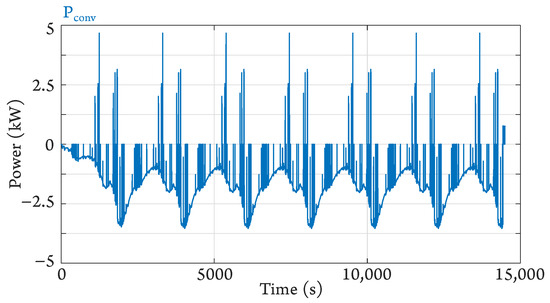
Figure 12.
Power processed by the converter of the Panasonic–A123 pair with reduced braking power.
5.1.3. Pair with 100 % Regenerative Braking and Internal Battery Resistances Considered
To obtain sizing power values closer to those of a real system, new simulations are carried out, considering the internal resistances of the cells that make up the batteries.
Internal resistance affects the battery voltage. As a result, voltages are no longer constant but vary according to the current flowing through the battery. These resistances also add losses to the system, which are proportional to the square of the currents flowing through the batteries, thus reducing the range of the EV. The internal resistance of a Panasonic cell is 30 mΩ [24], while that of an A123 cell is 3.5 mΩ [25].
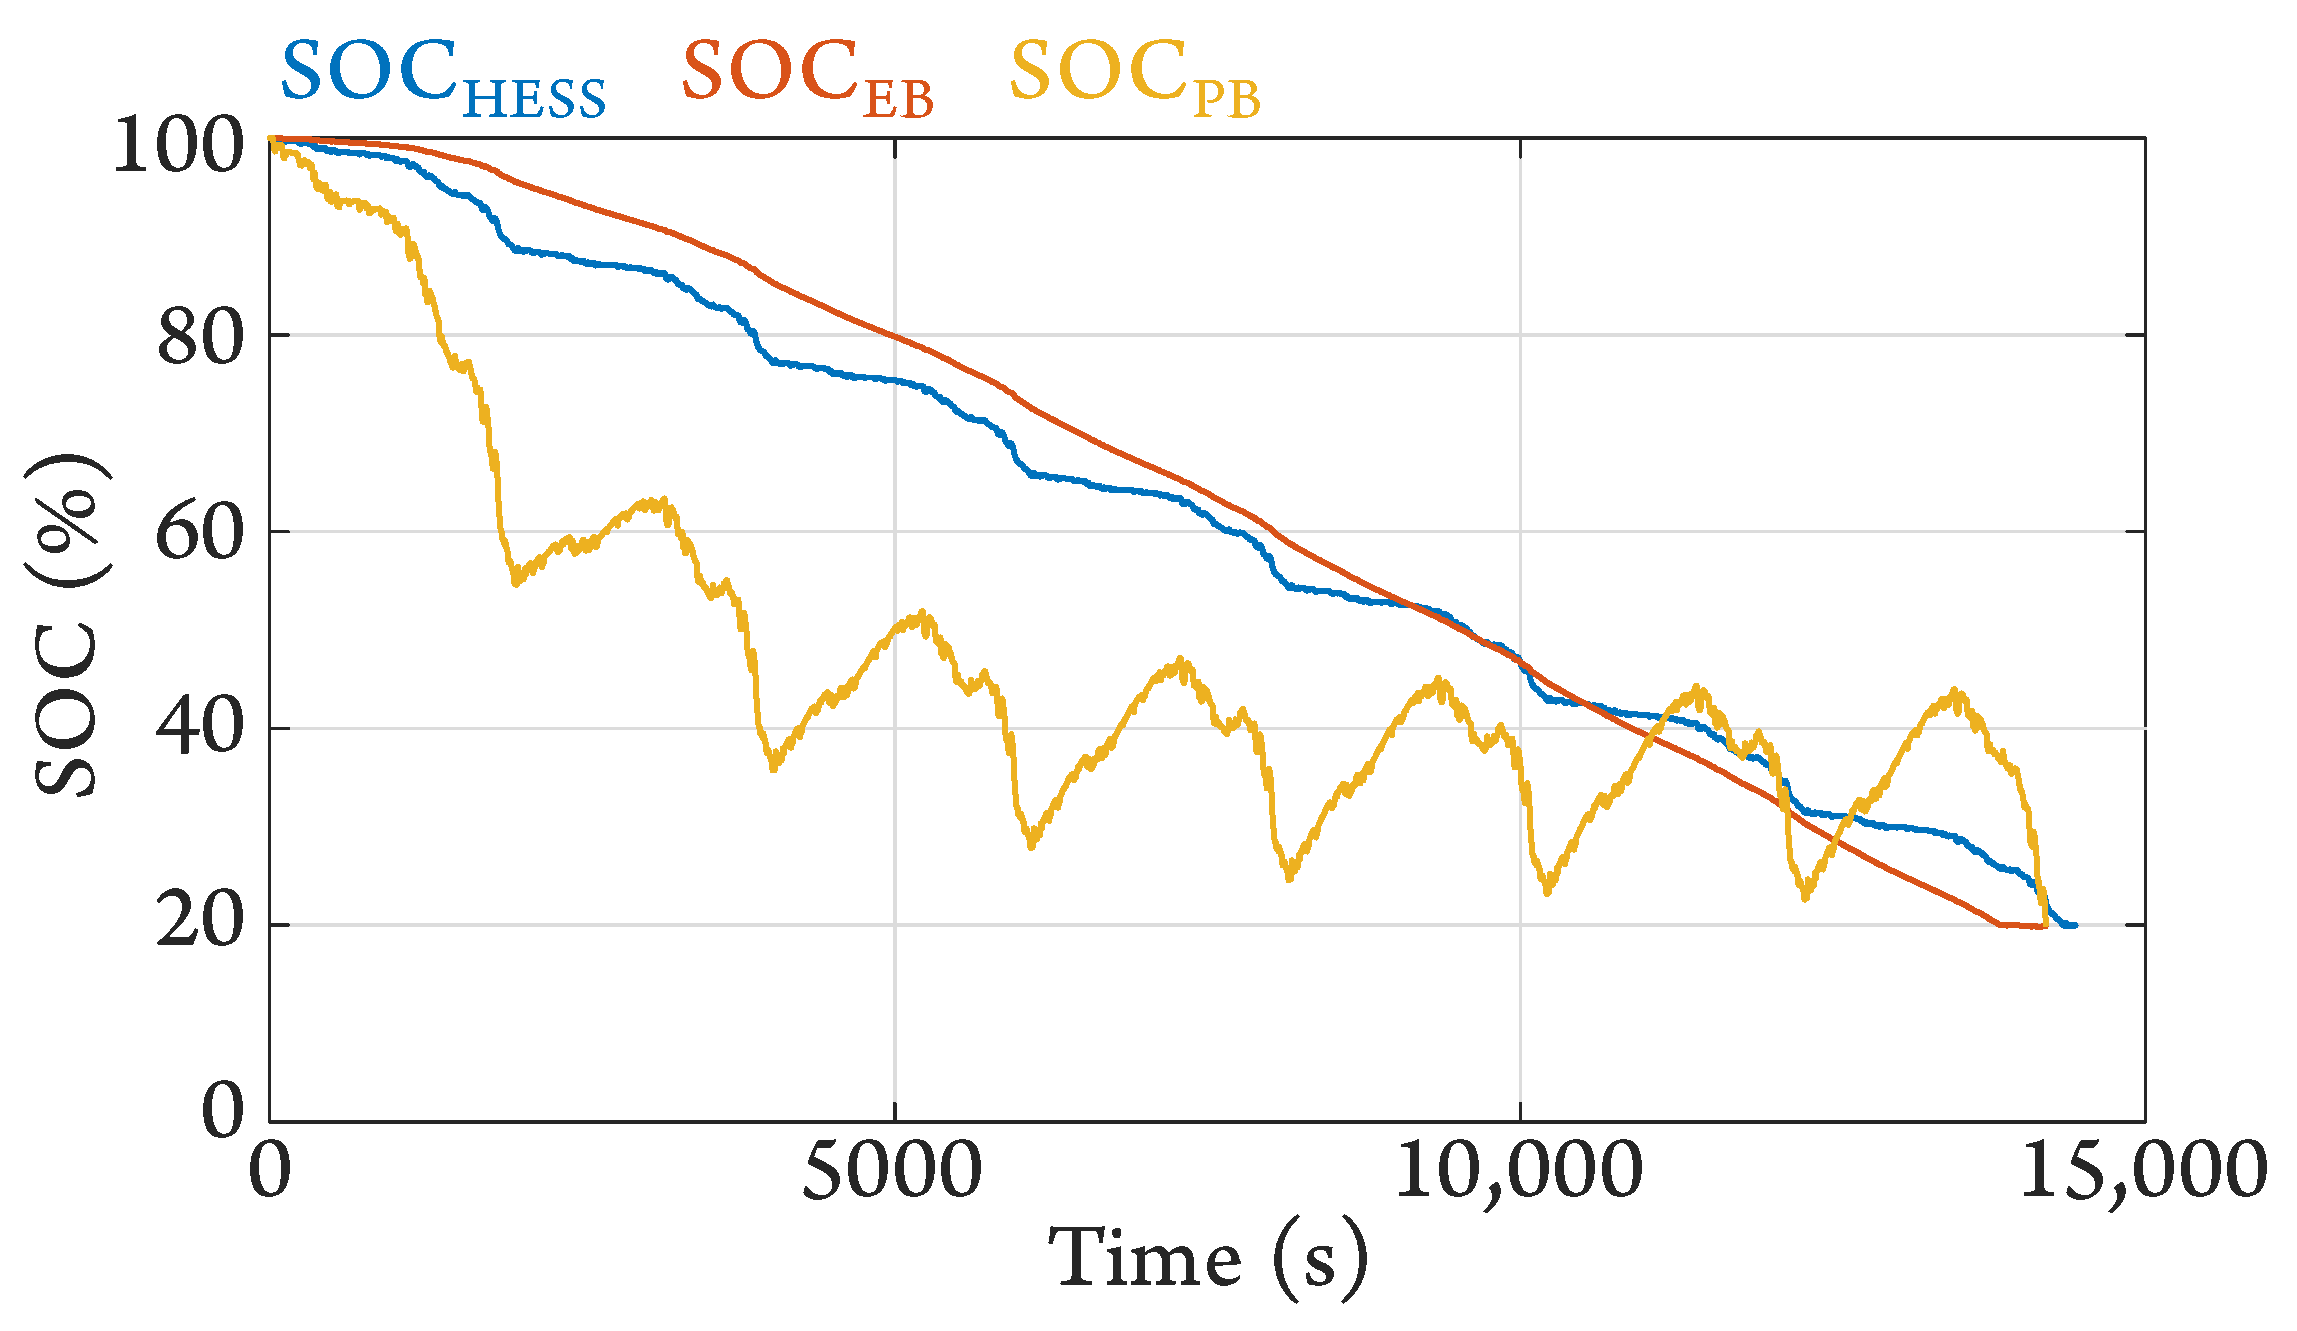
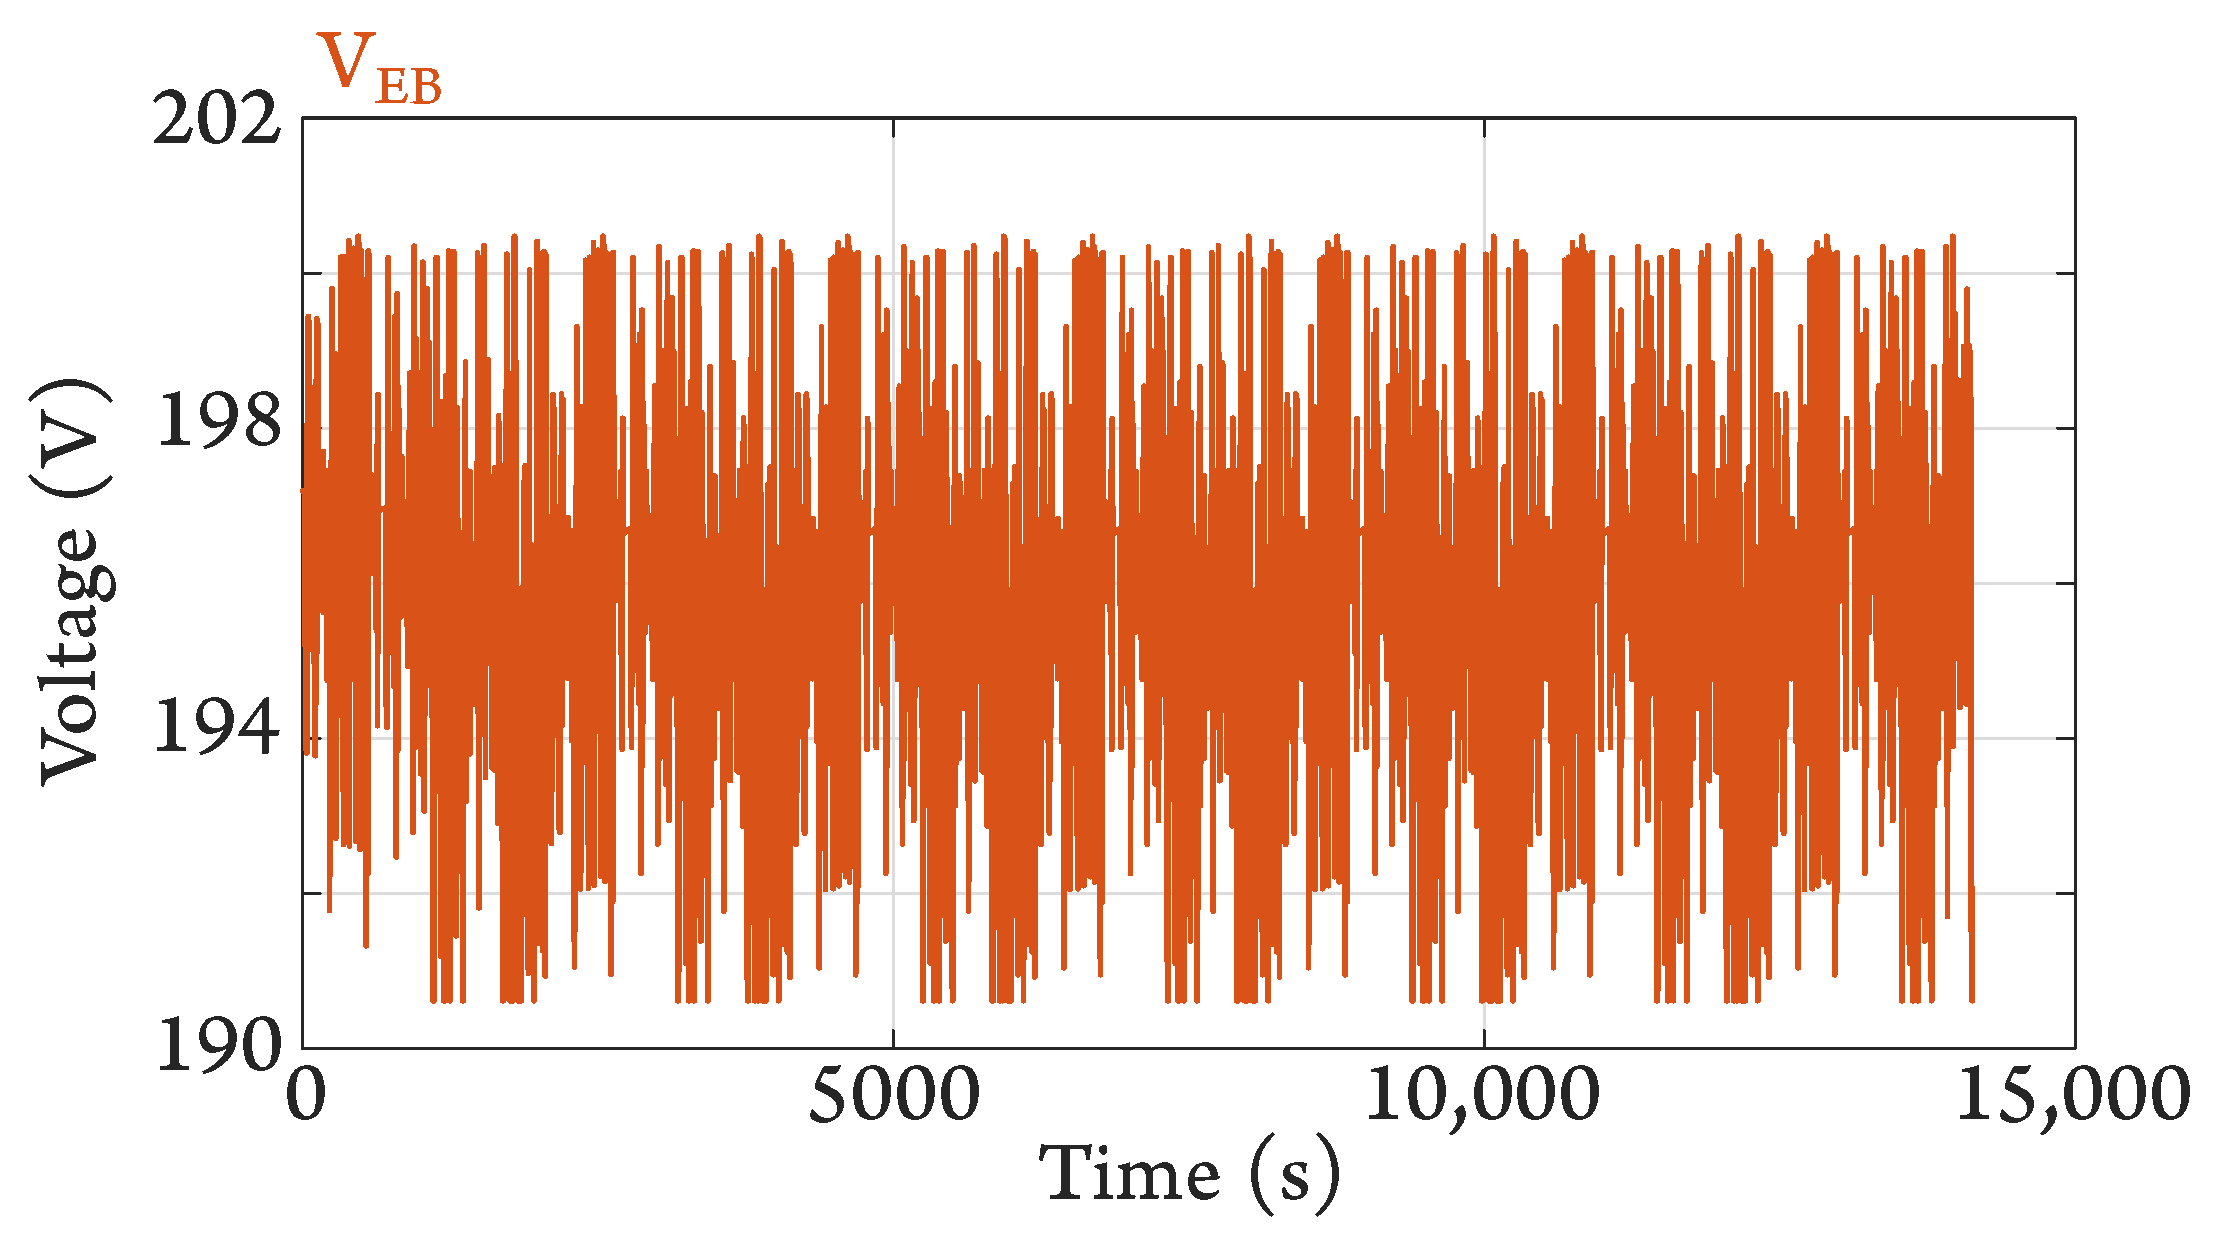
The SOC evolution of the Panasonic–A123 pair with 100% regenerative braking in this case is presented in Figure 13. The blue curve () represents a theoretical evolution for a 100% range. With the losses introduced by the resistances, the batteries are fully discharged before the end of the cycle, reducing the range of the EV. The variation in the EB voltage (converter output voltage), caused by the addition of the resistance, is shown in Figure 14.
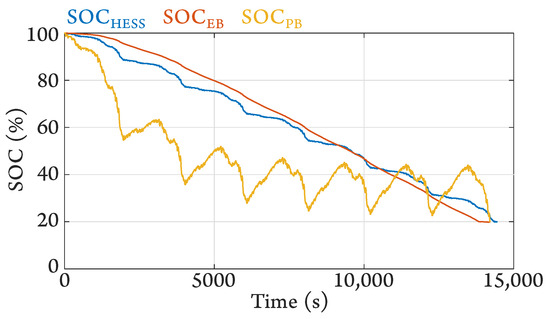
Figure 13.
SOC evolution of the Panasonic–A123 pair, internal battery resistances considered.
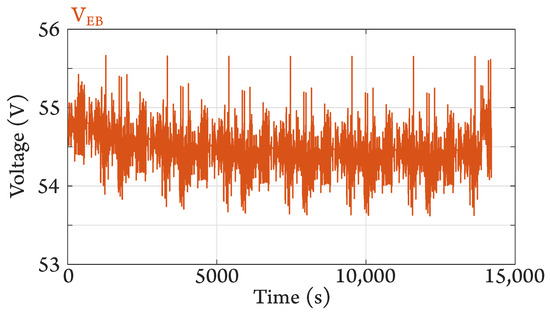
Figure 14.
EB voltage of the Panasonic–A123 pair, internal battery resistances considered.
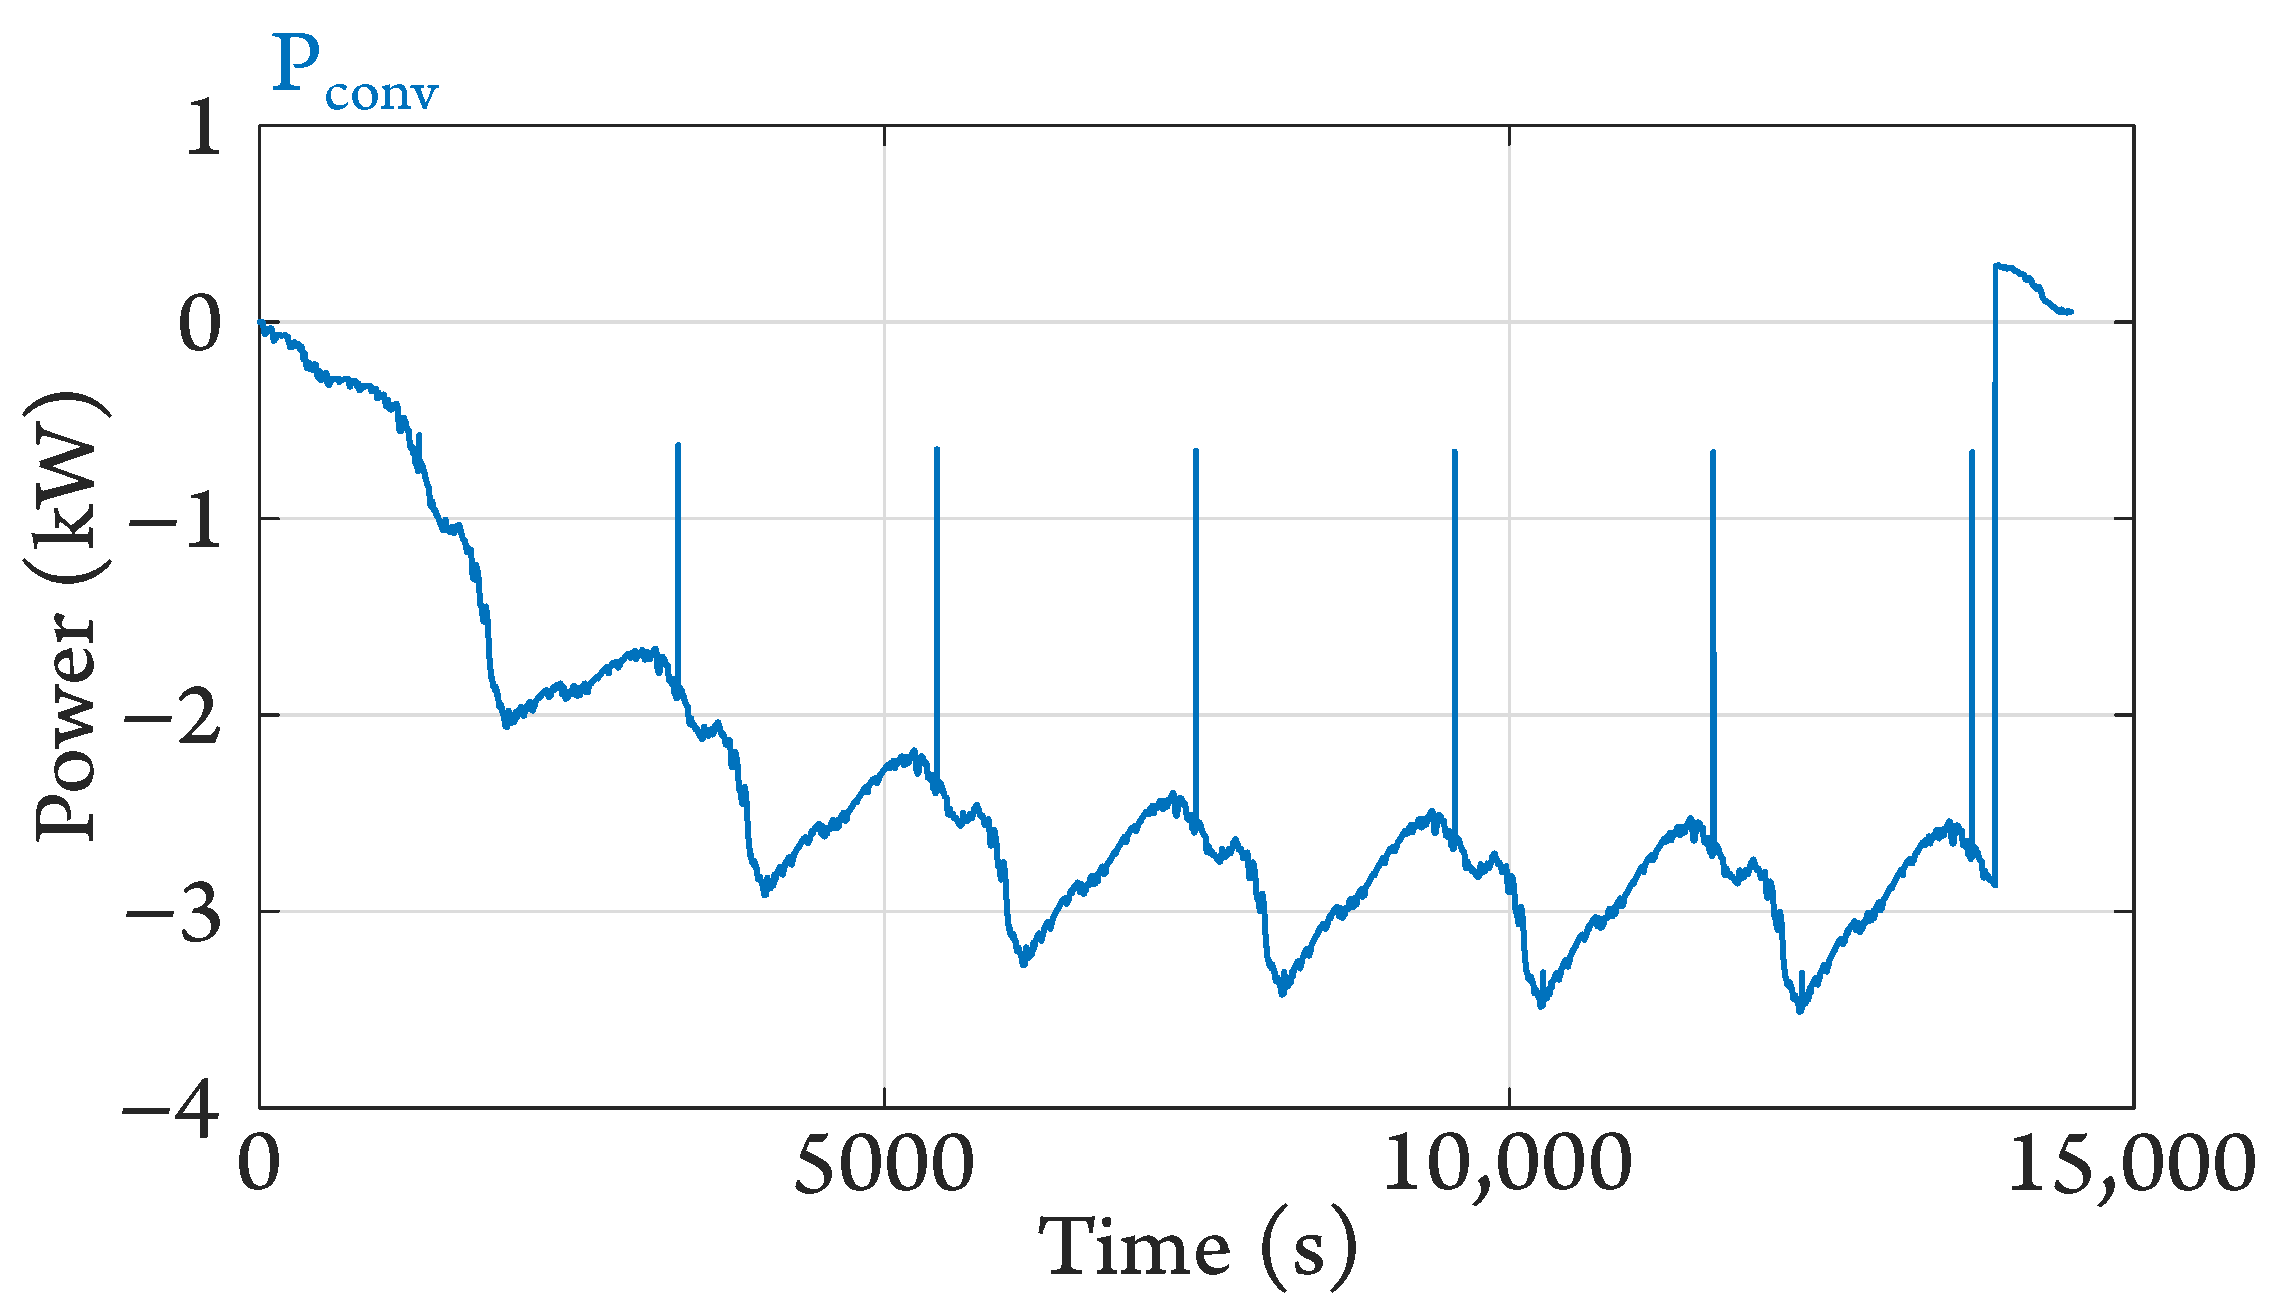
Finally, Figure 15 shows the power processed by the converter. A slight difference in the amplitude can be seen. In particular, at the end of the cycle, the power is positive. This is due to the fact that, at this point in the cycle, the EB is discharged and the cycle ends with the operation exclusively on the PB. The converter must then supply the EB with the power it should have provided, had it not been prematurely discharged. Including the resistances introduces a slight increase in the converter sizing power, from 3.38 kVA to 3.60 kVA.
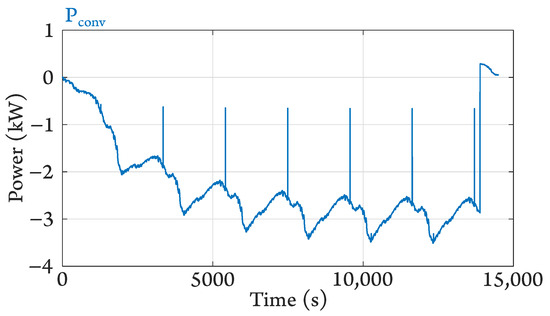
Figure 15.
Power processed by the converter of the Panasonic–A123 pair, internal battery resistances considered.
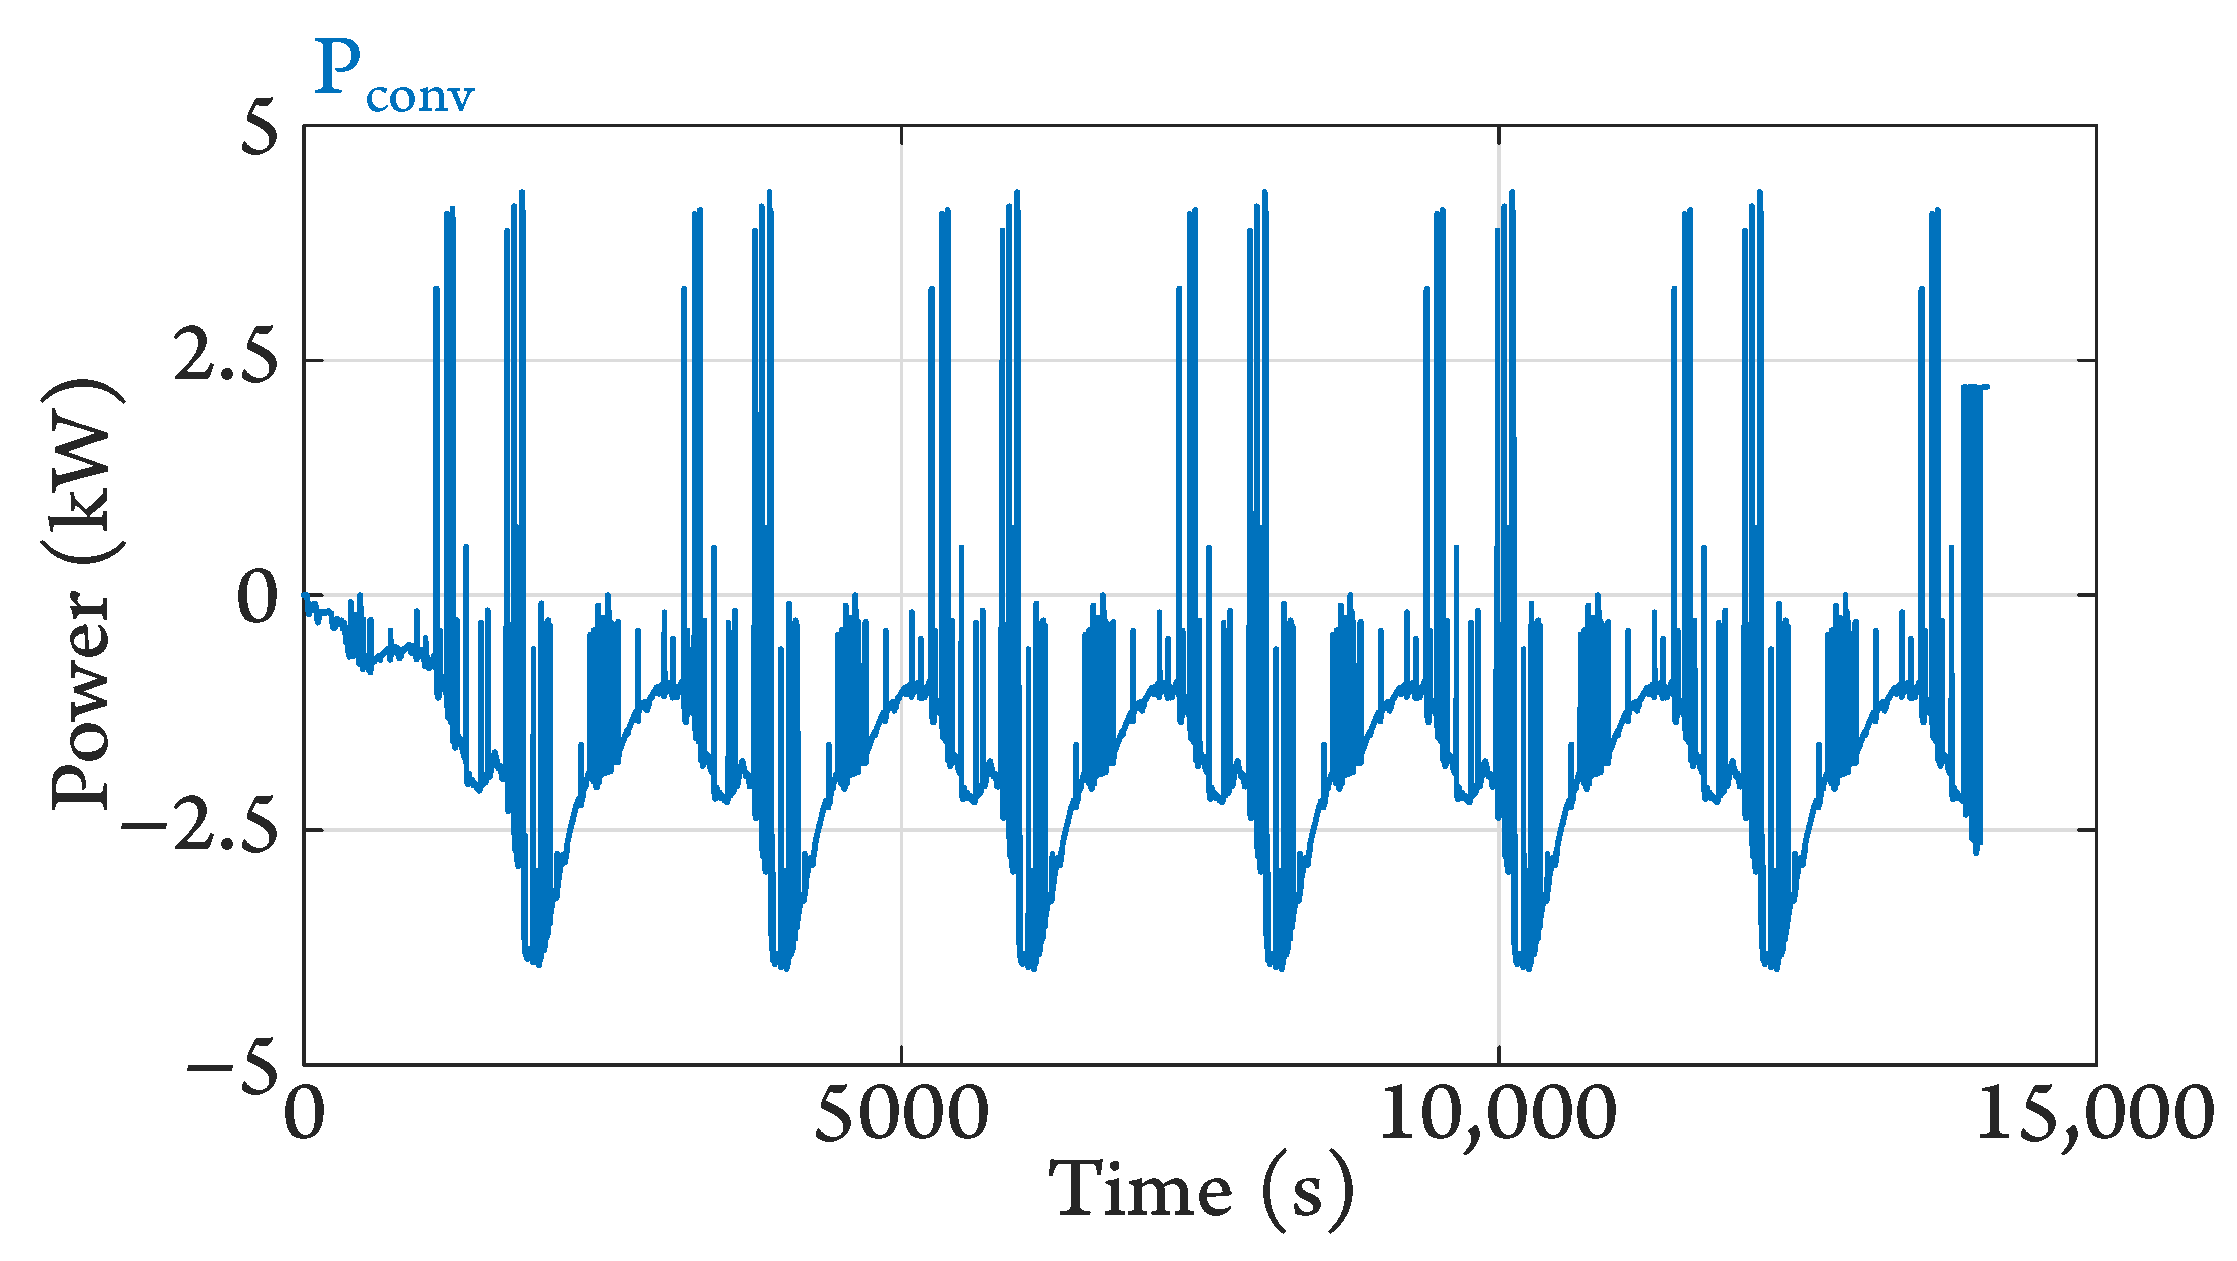
5.1.4. Pair with Reduced Braking Power and Internal Battery Resistances Considered
In this case, the PB energy is much lower. As a result, it discharges more quickly. Since electric braking is only partial, the range of the EV (Figure 16) is reduced. The variation in the EB voltage is shown in Figure 17.
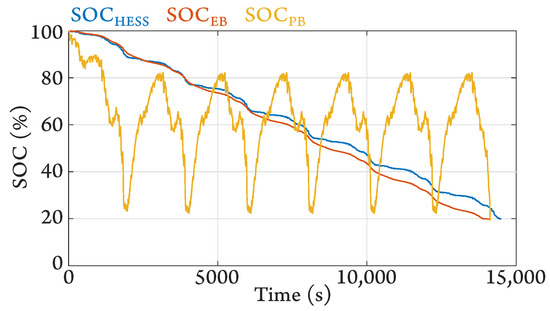
Figure 16.
SOC evolution of the Panasonic–A123 pair with reduced braking power, internal battery resistances considered.
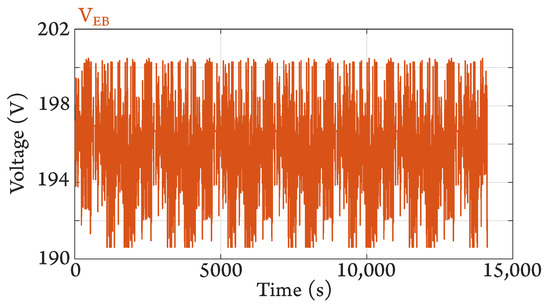
Figure 17.
EB voltage of the Panasonic–A123 pair with reduced braking power, internal battery resistances considered.
The evolution of the power processed by the converter is shown in Figure 18. The variation in voltage, caused by the resistances, also has effects on the “natural” power distribution of the series architecture, linked to the voltage distribution. So, for this pair, as for the first, the converter is no longer disabled and always processes power. In this case, compensation for current differences is even more important, hence, the various power peaks. However, the converter sizing power for this pair is reduced from 4.67 kVA to 4.51 kVA.
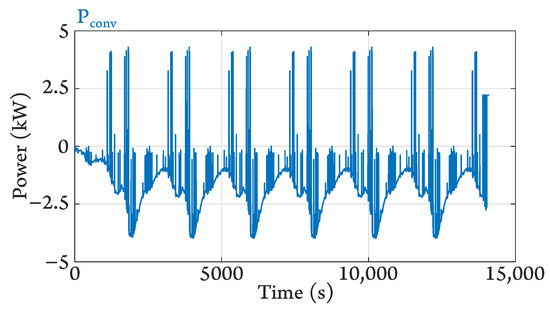
Figure 18.
Power processed by the converter of the Panasonic–A123 pair with reduced braking power, internal battery resistances considered.
5.2. Experimental Results
In addition to the simulations given in the previous subsection, experimental tests were carried out. In the following, the test bench is described, as well as the test protocol. Then, the tests themselves and their respective results are presented.
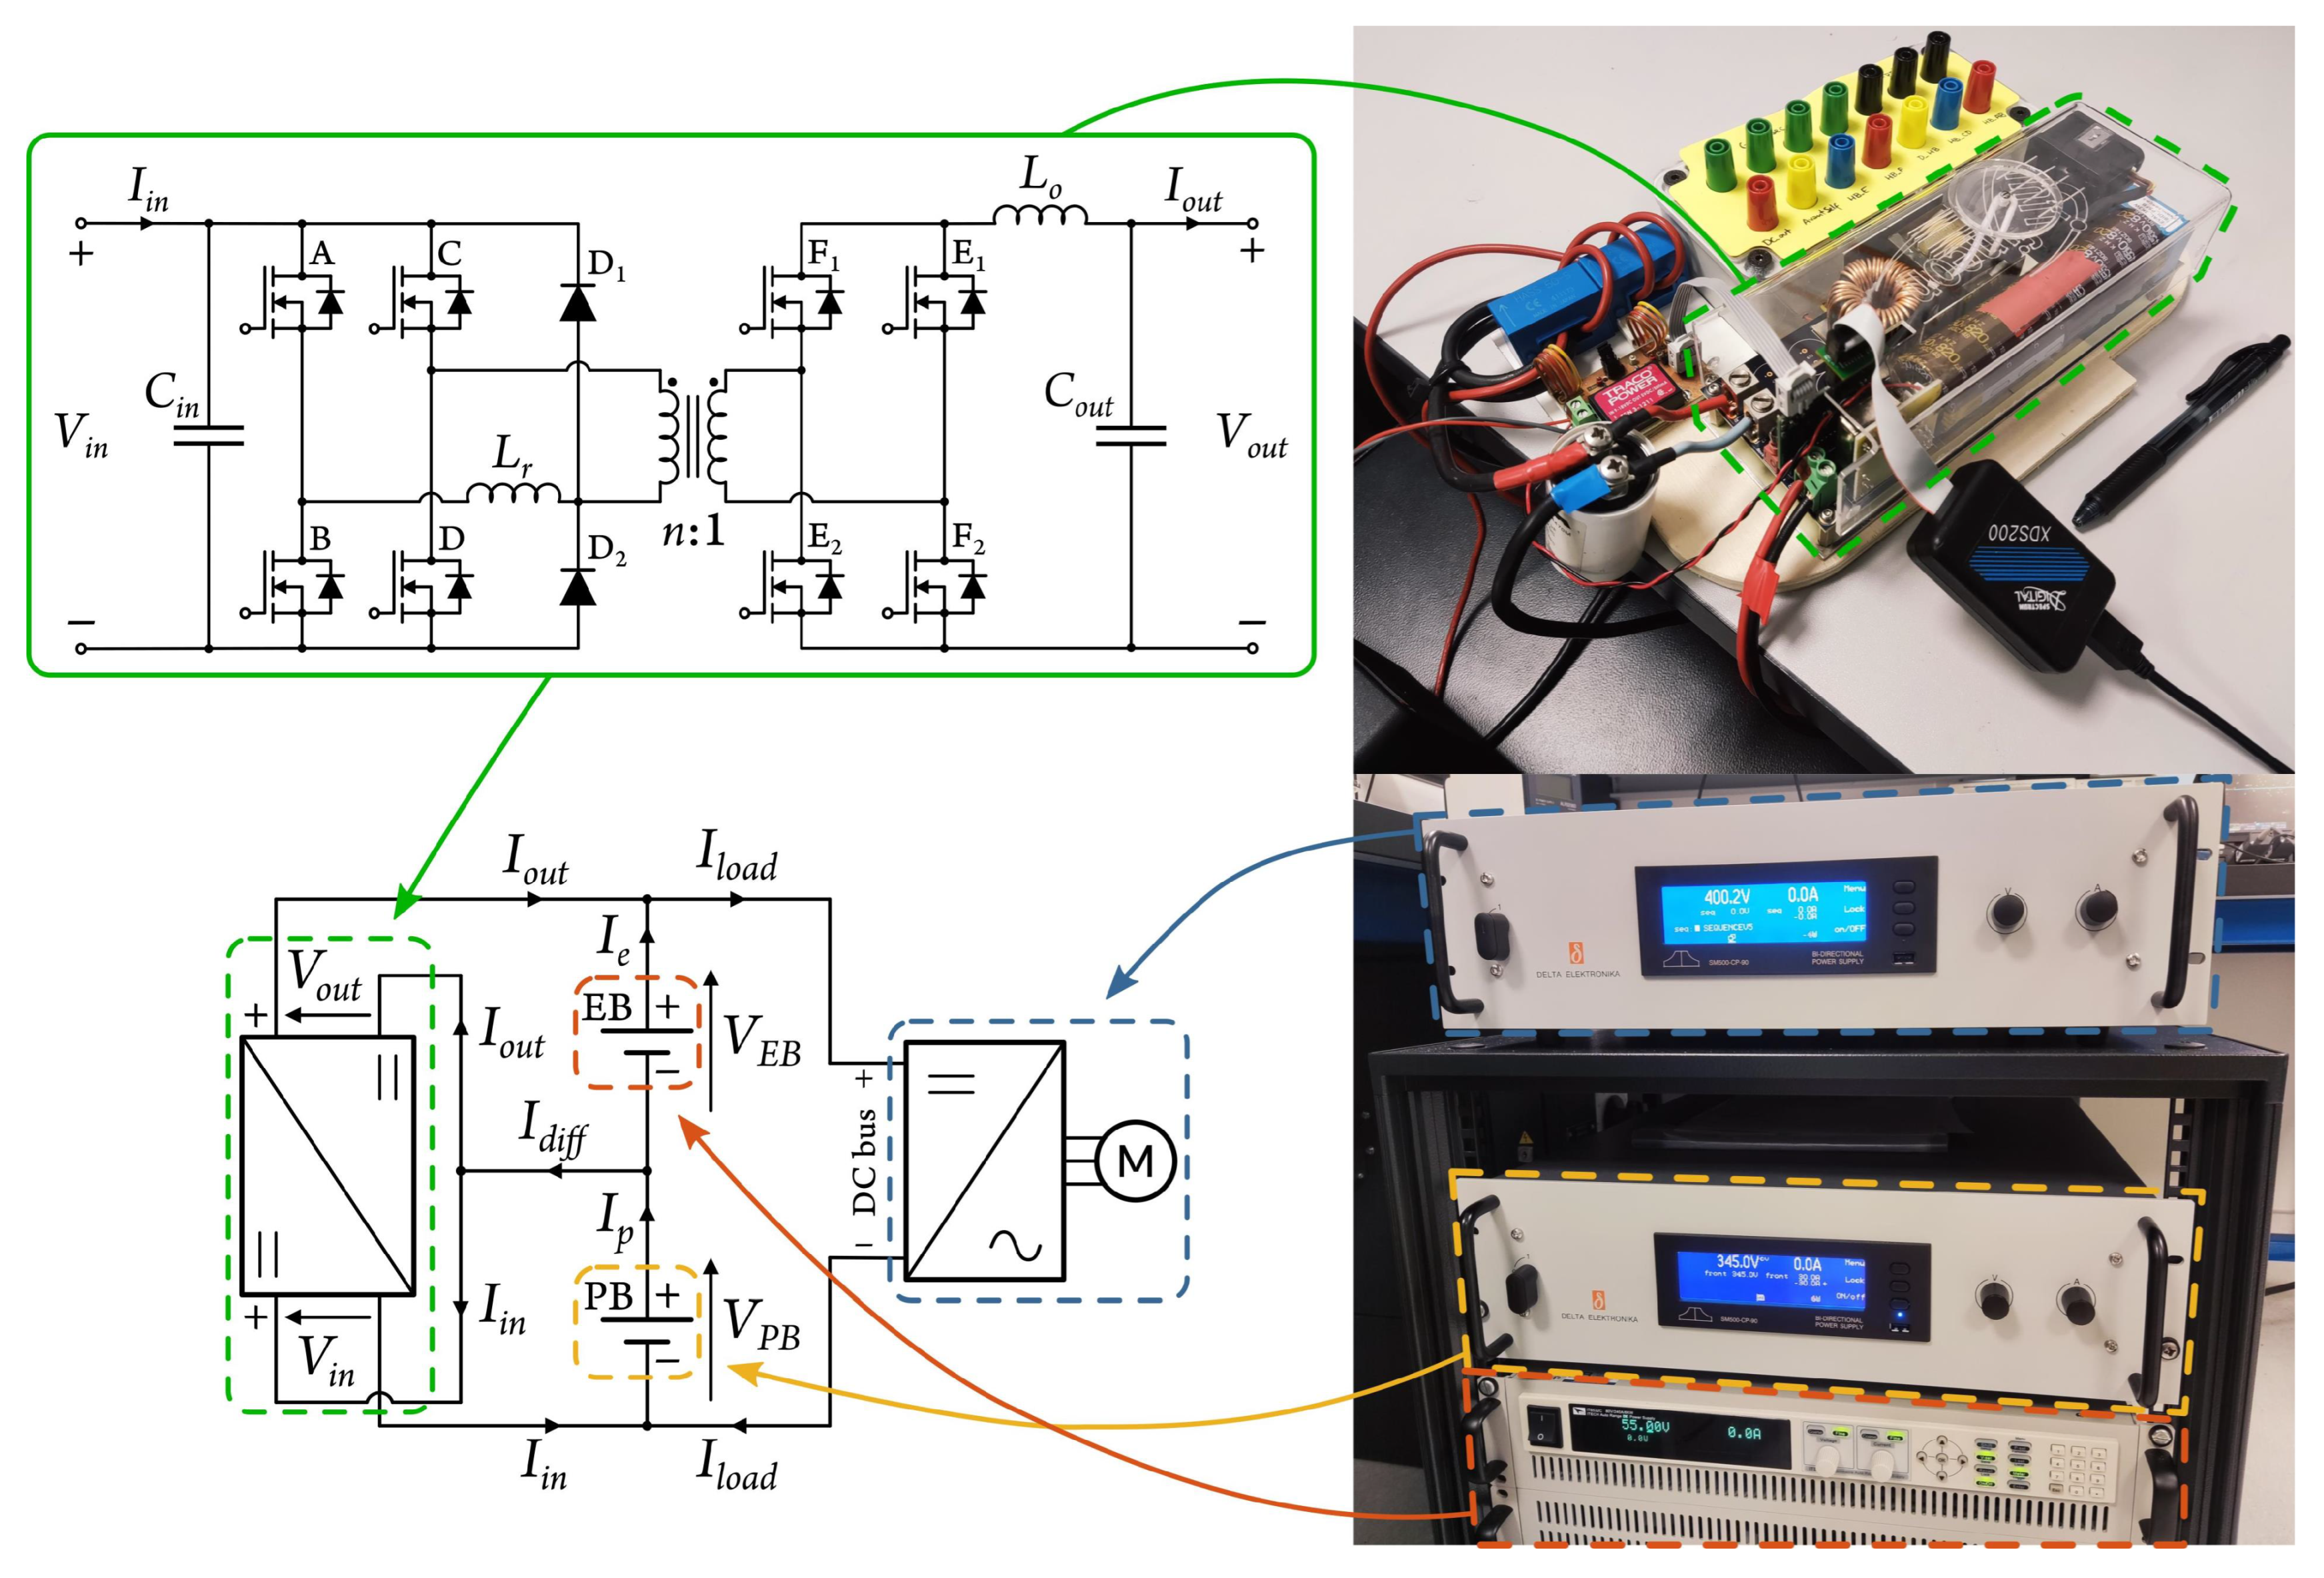
5.2.1. Test Bench Description
To validate the series architecture experimentally, three power supplies were used to emulate the batteries and the load (EV). This way, it is not possible to obtain an evolution of the states of charge. Therefore, the aim of this experimental study is to apply a current profile, corresponding to a small part of the complete cycle, to the sources and the converter. The converter must fulfill its role in the series architecture by processing a certain value of the current so that the EB provides energy support to the PB. If the EB reaches its current limits, the converter must then change its operating mode to ensure that the EB does not exceed them.
The architecture was implemented as presented in Figure 19. The power supplies used are two Delta Elektronika SM500-CP-90 and one Itech IT6532C. The first ones can reach 500 V and can process currents of ±90 A, being limited to ±15 kW. They were used as the load and the PB. The latter is capable of reaching 80 V and 240 A and is limited to 6 kW. It is coupled to an IT-E502 electronic load, which supports 80 V, 120 A, and 3 kW. This one was used as the EB.

Figure 19.
Power supplies and converter used in the experimental tests.
The converter used is an Infineon evaluation board model EVAL_3K3W_BIDI_PSFB [28]. It is based on a Phase-Shift Full-Bridge (PSFB) topology that consists of two full bridges, in which the legs of the first bridge work in phase shift while the second bridge works in synchronous rectification with the reference leg of the first bridge [29,30]. However, some modifications had to be made so that the converter is current-regulated rather than voltage-regulated [27]. Other than that, its nominal power of 3.3 kW is in the order of magnitude of the sizing powers obtained in the simulation for the Panasonic–A123 pair with 100% regenerative braking (Table 1). In addition, the battery voltages of this pair are compatible with the converter operating voltages (Table 3). For these reasons, this combination was chosen to be emulated by the power supplies.
Table 3.
Characteristics of the Infineon PSFB evaluation board (EVAL_3K3W_BIDI_PSFB).
One of the Delta Elektronika sources emulates the load through a current profile and assumes the DC bus voltage as 400 V. Another Delta Elektronika source emulates the power battery, at a voltage of 345 V. The Itech source emulates the energy battery, with a voltage of 55 V. Since the sources are not as powerful as the batteries designed before, the system was emulated at ¼ of the power, compared to the previous simulations. This means that the maximum load current is 27.7 A and the minimum is −31.25 A.
According to this logic, the EB limit currents would be 62 A and 31 A. Since the aim of this study is to visualize the change in the converter operation to ensure that the EB limits are met, these values have been reduced to 30 A and −15 A, respectively.
The current profile applied corresponds to 81 s of the simulated cycle, around the 10,000 s mark. In this interval, at ¼ of the simulation power, the converter must process a SOCs balancing current of −10.2 A for the EB to support the PB. In real conditions, this current would be generated by the batteries SOC management algorithm.
Four tests were carried out for experimental validation. In the first one, the converter is disabled. In the second one, the converter is enabled and processes a constant current of −10.2 A. In the third one, the EB current limitation is activated. In the fourth one, the EB limit currents are reduced, to show that this can be easily performed.
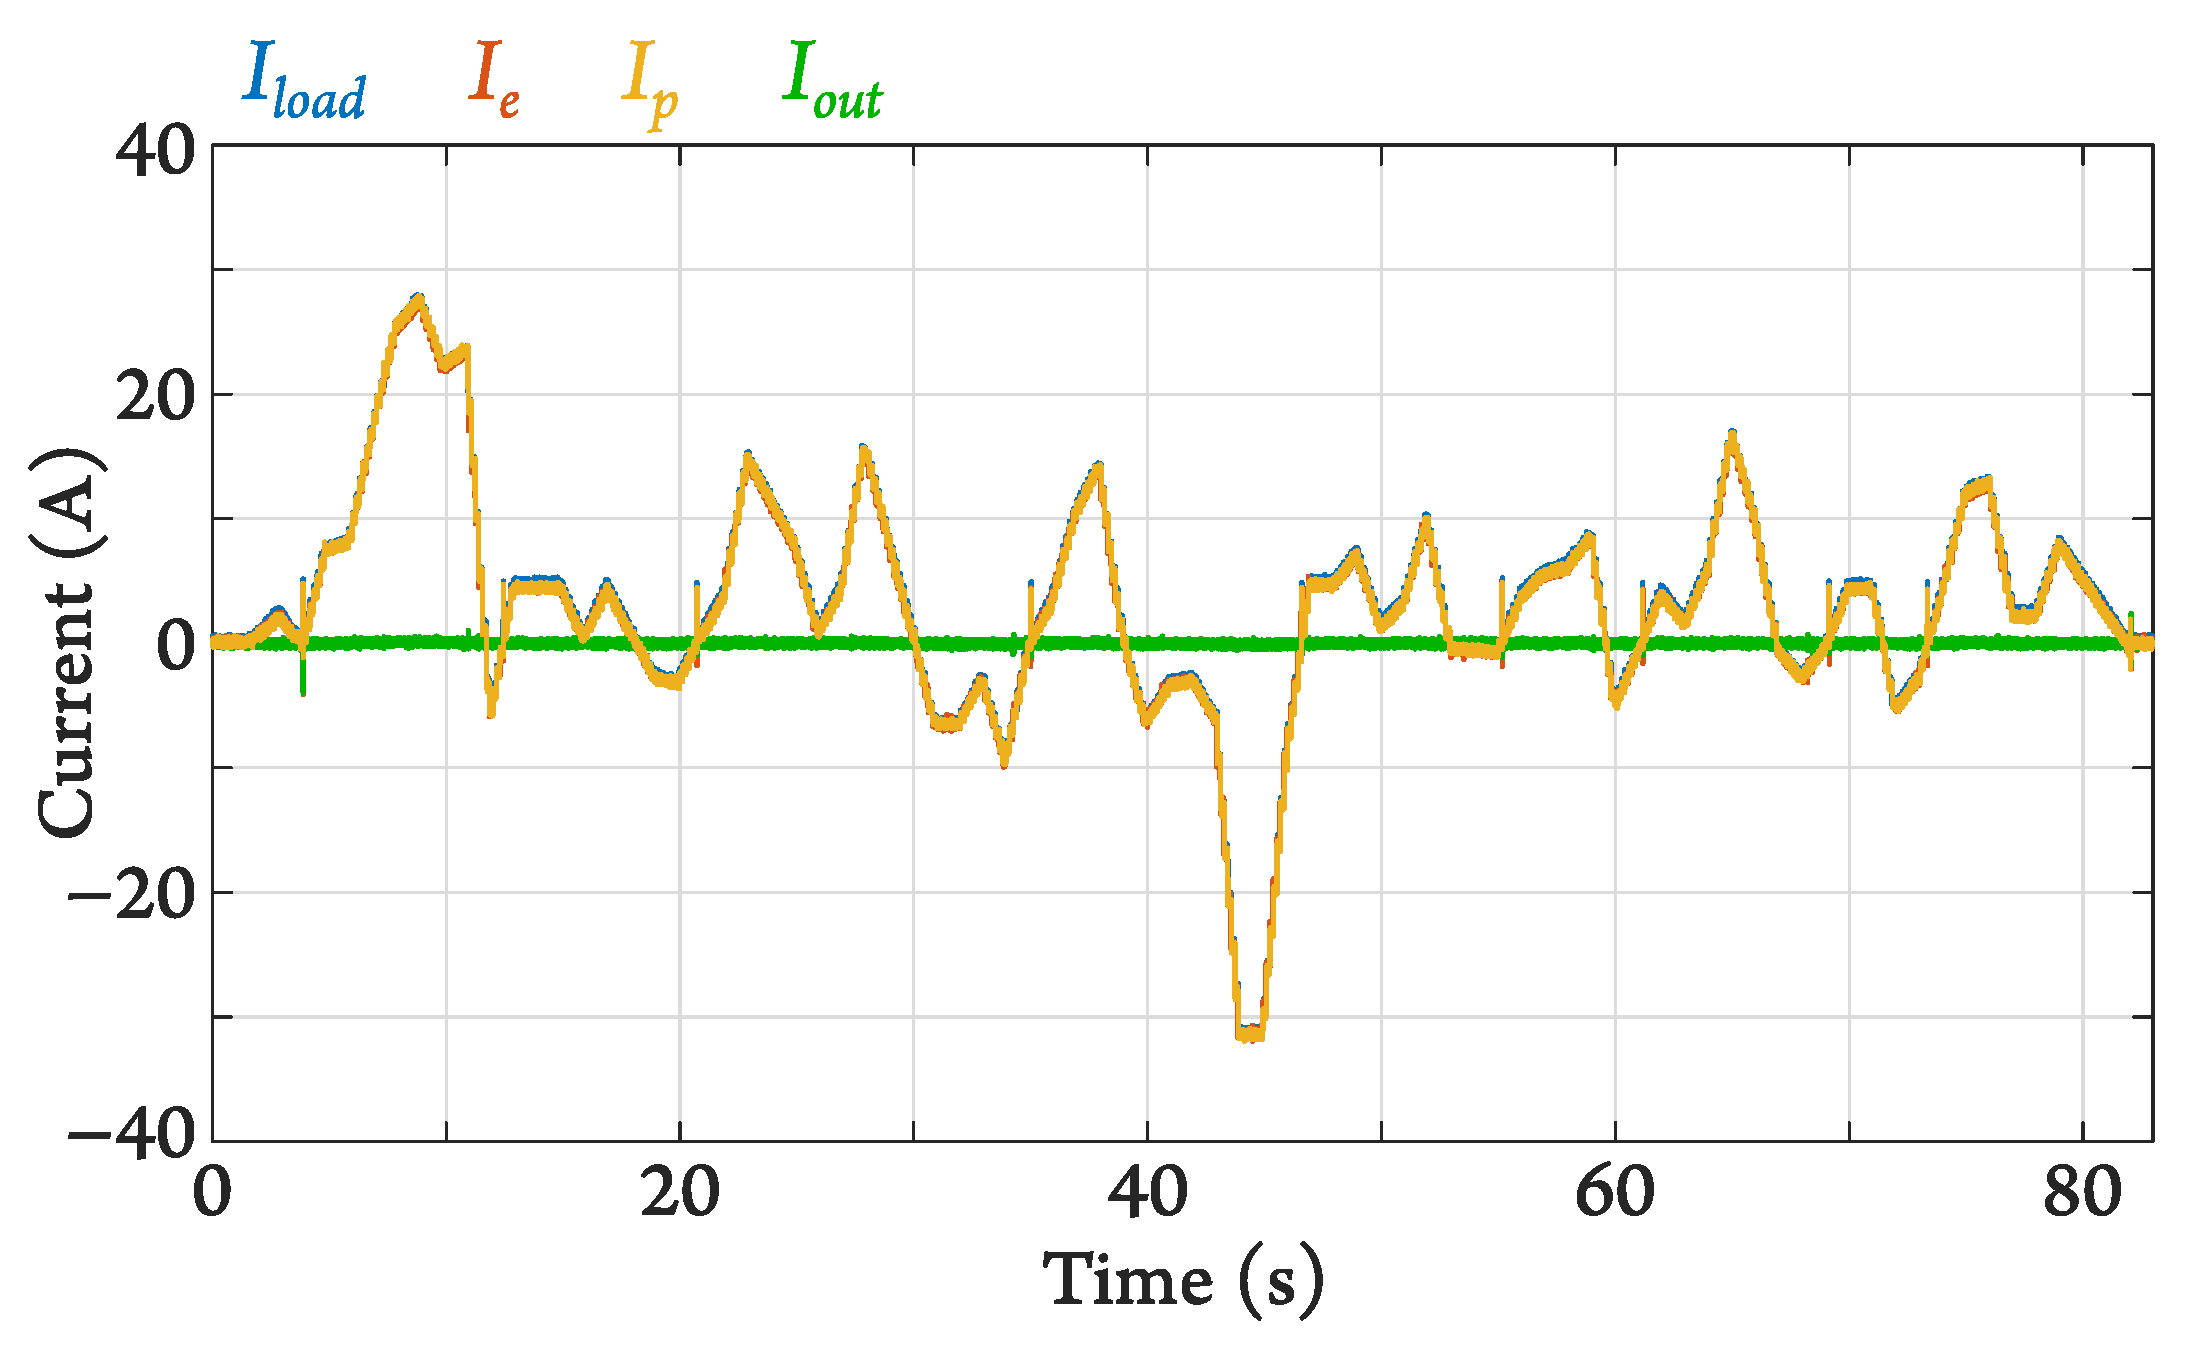
5.2.2. Converter Disabled
A first test was carried out with the converter disabled and is shown in Figure 20. In this case, since no current is processed by the converter, the battery currents are equal to that of the load. In a real system, the EB would have its current limited to −15 A, which would also limit the current processed by the PB and the recovery of braking energy.
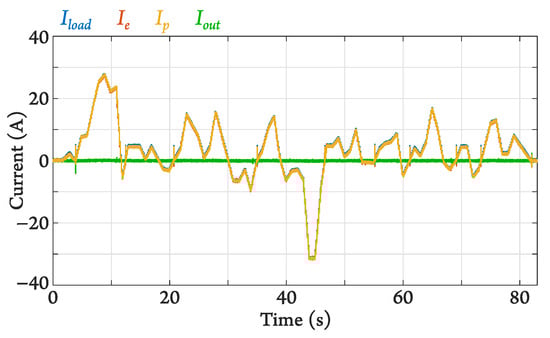
Figure 20.
Experimental test with the converter disabled.
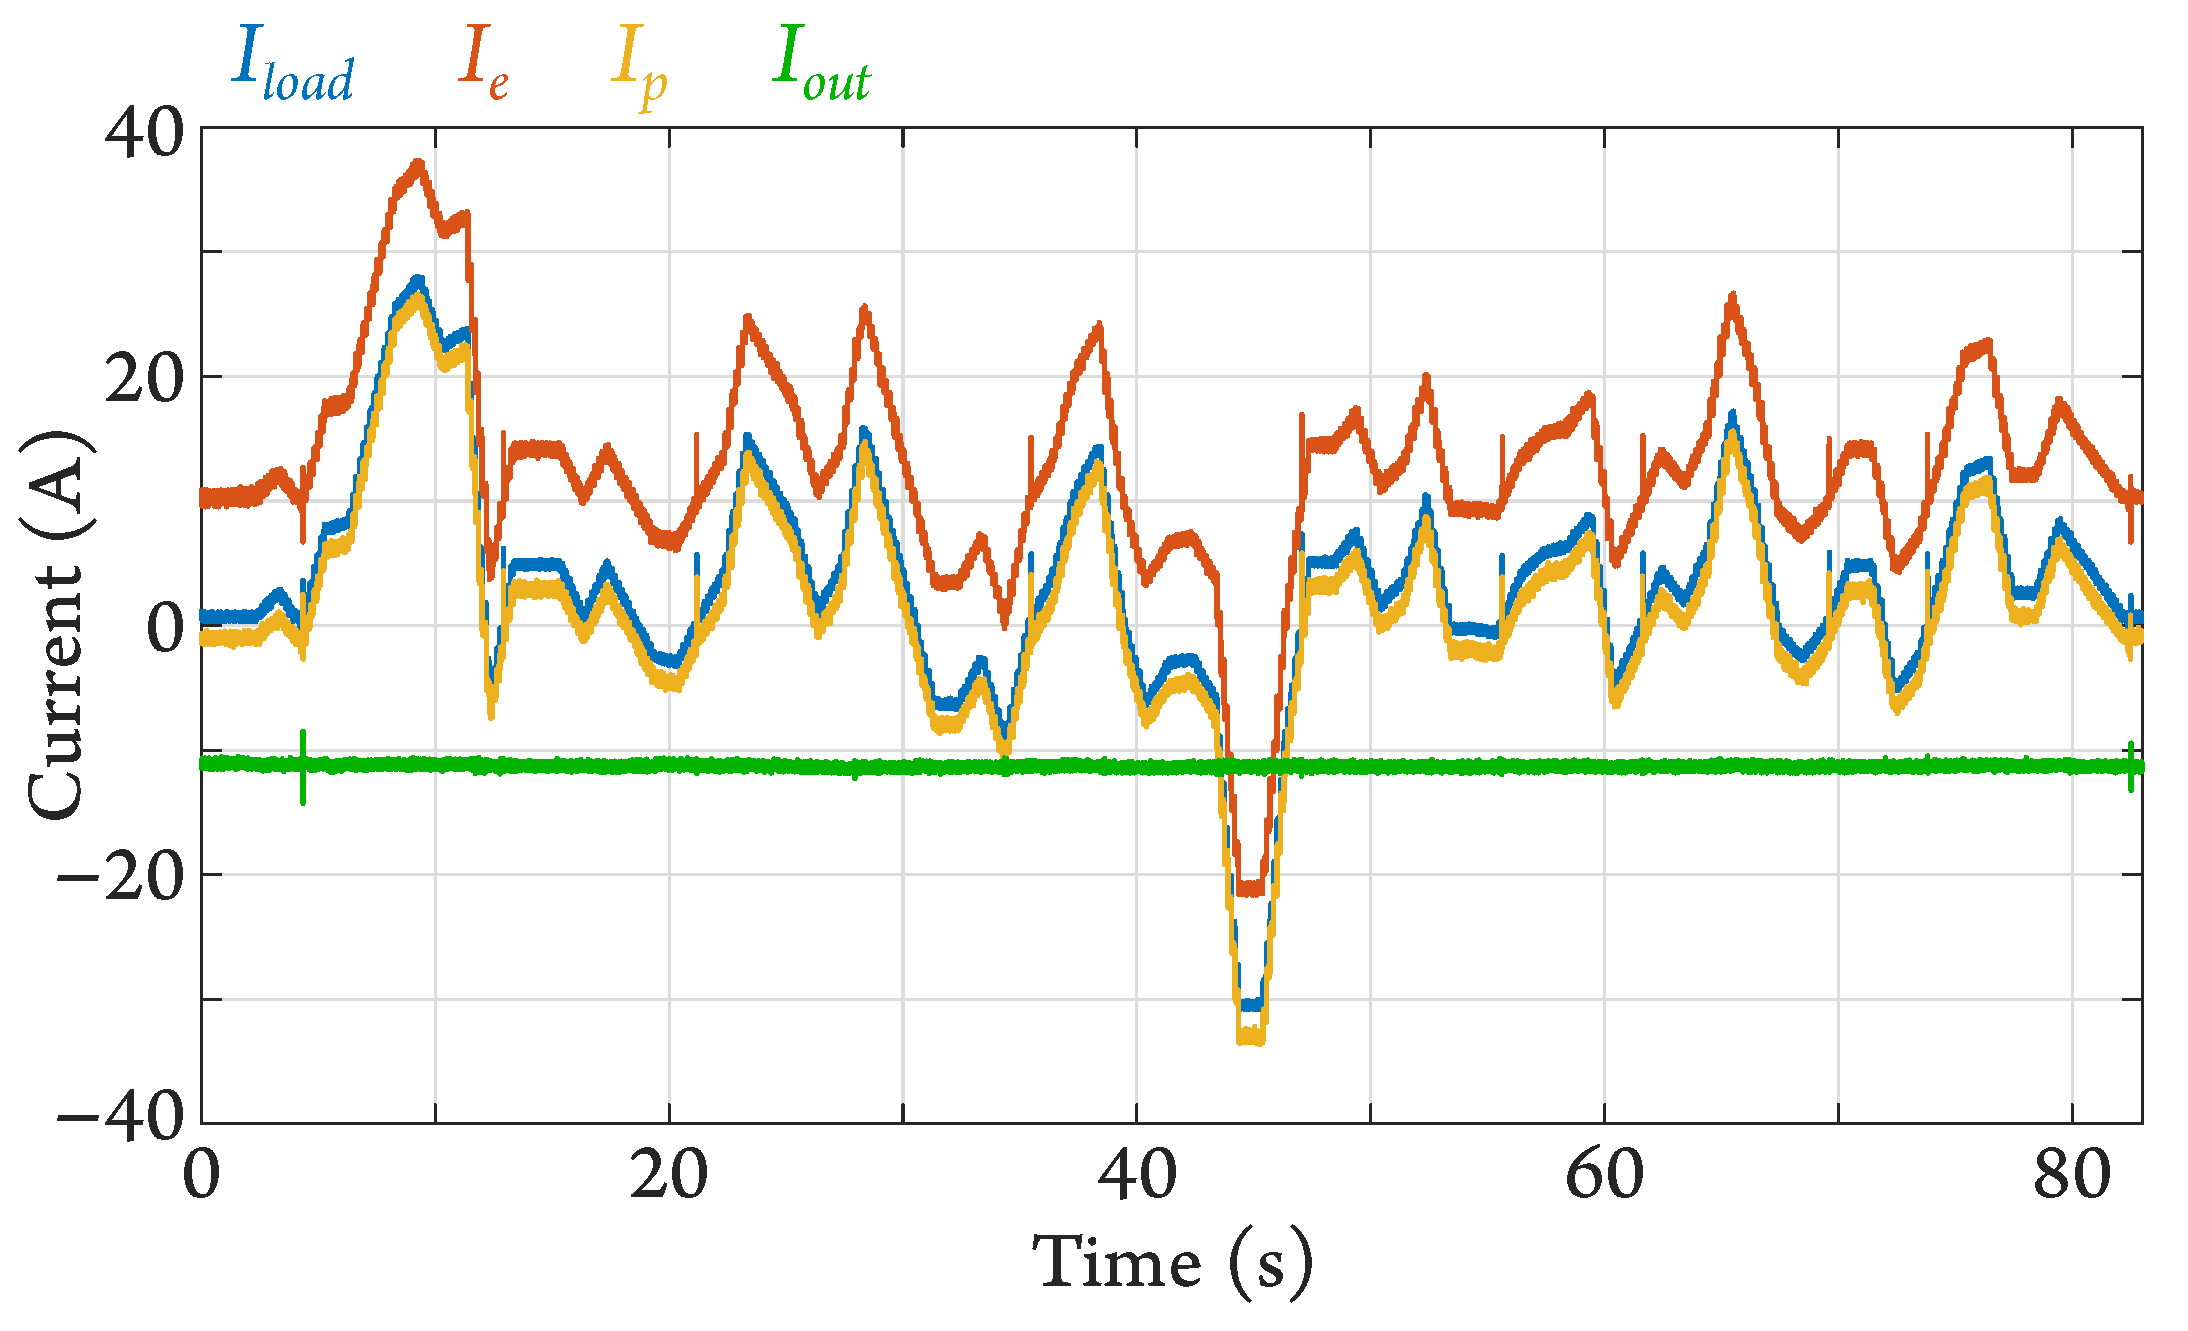
5.2.3. Converter Enabled
In a second test, shown in Figure 21, the converter was enabled and processed a constant current of −10.2 A. This test shows how the converter makes the EB process more current, compared to the test in Figure 20, to provide energy support to the PB. This way, the PB processes less current and would tend to discharge less quickly. In this test, the EB current limitation has not yet been implemented in the converter control.
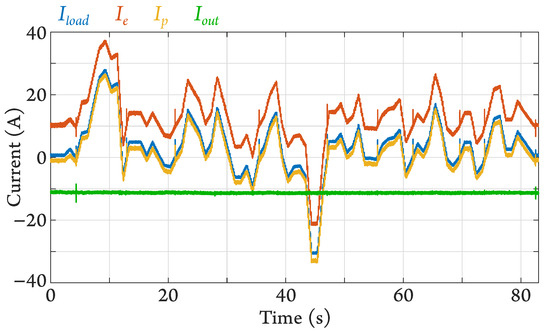
Figure 21.
Experimental test with the converter processing a constant current of −10.2 A.
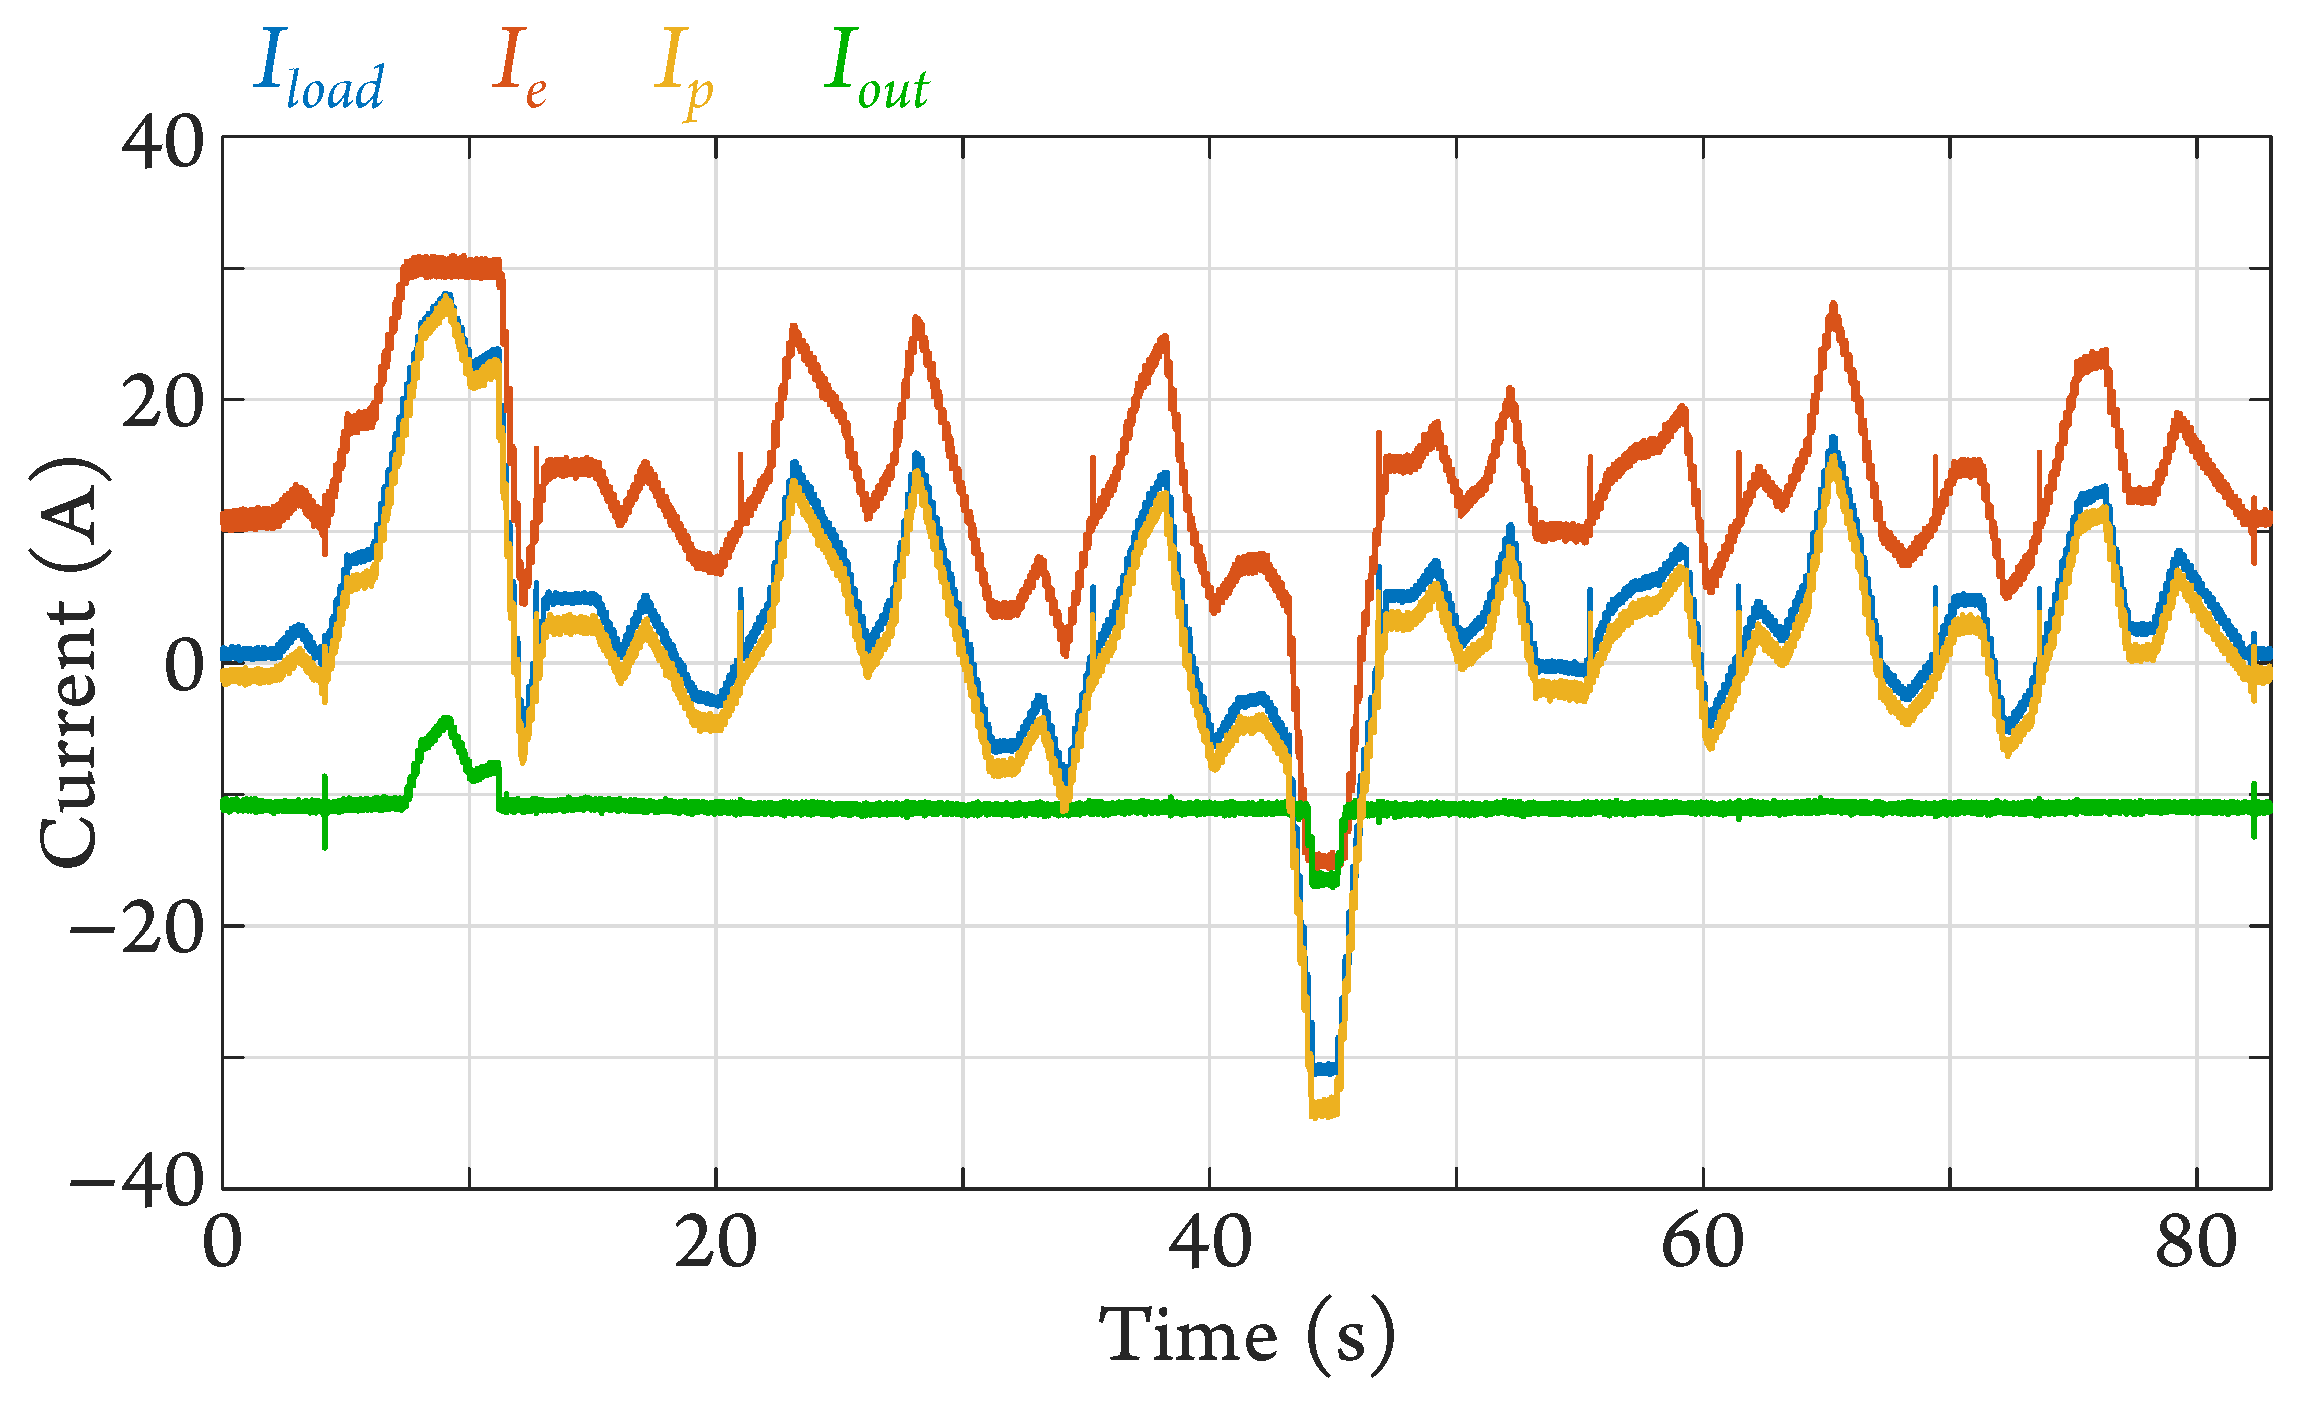
5.2.4. Converter Enabled with EB Current Limitation
The third test, shown in Figure 22, includes the current limitation of the energy battery. It can be seen that in discharge, its current does not exceed 30 A. For this, the current processed by the converter decreases in absolute value, while the current processed by the power battery increases compared to the test in Figure 21. In recharge, the EB current is limited to −15 A, as defined. In absolute value, the maximum power processed by the converter in this test was approximately 890 W.
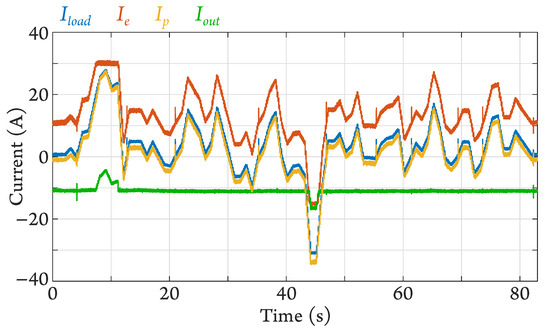
Figure 22.
Experimental test in which the converter limits the EB current between −15 A and 30 A.
5.2.5. Converter Enabled with Reduced EB Current Limitation
As an example, a fourth test was carried out (Figure 23). In it, the EB limit currents were reduced to 20 A and 0 A. The aim is to show that this can be performed relatively simply and that the converter is capable of guaranteeing these limits.
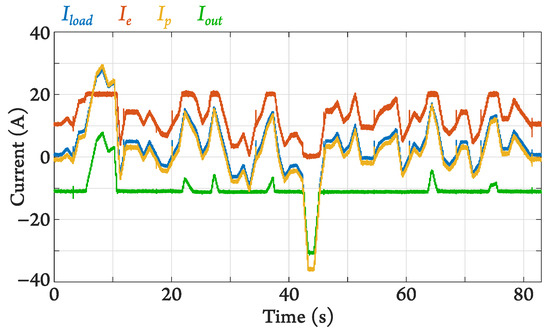
Figure 23.
Experimental test in which the converter limits the EB current between 0 A and 20 A.
Since the limits are lower, the converter changes its operating point more often than in the previous test (Figure 22). The maximum power it processes is still at the load braking peak, and in this case, it increased in absolute value to approximately 1.72 kW.
5.3. Discussion
To demonstrate the benefits of the series architecture, a comparison is made between the sizing powers obtained and the sizing power for the classic cascade with 1 DC-DC converter architecture (Figure 2b). The EB is considered as Source 1 and the PB as Source 2. In this architecture, the converter processes the power flowing through the EB. Consequently, its sizing power is given by the maximum power of this battery (Table 1 and Table 2).
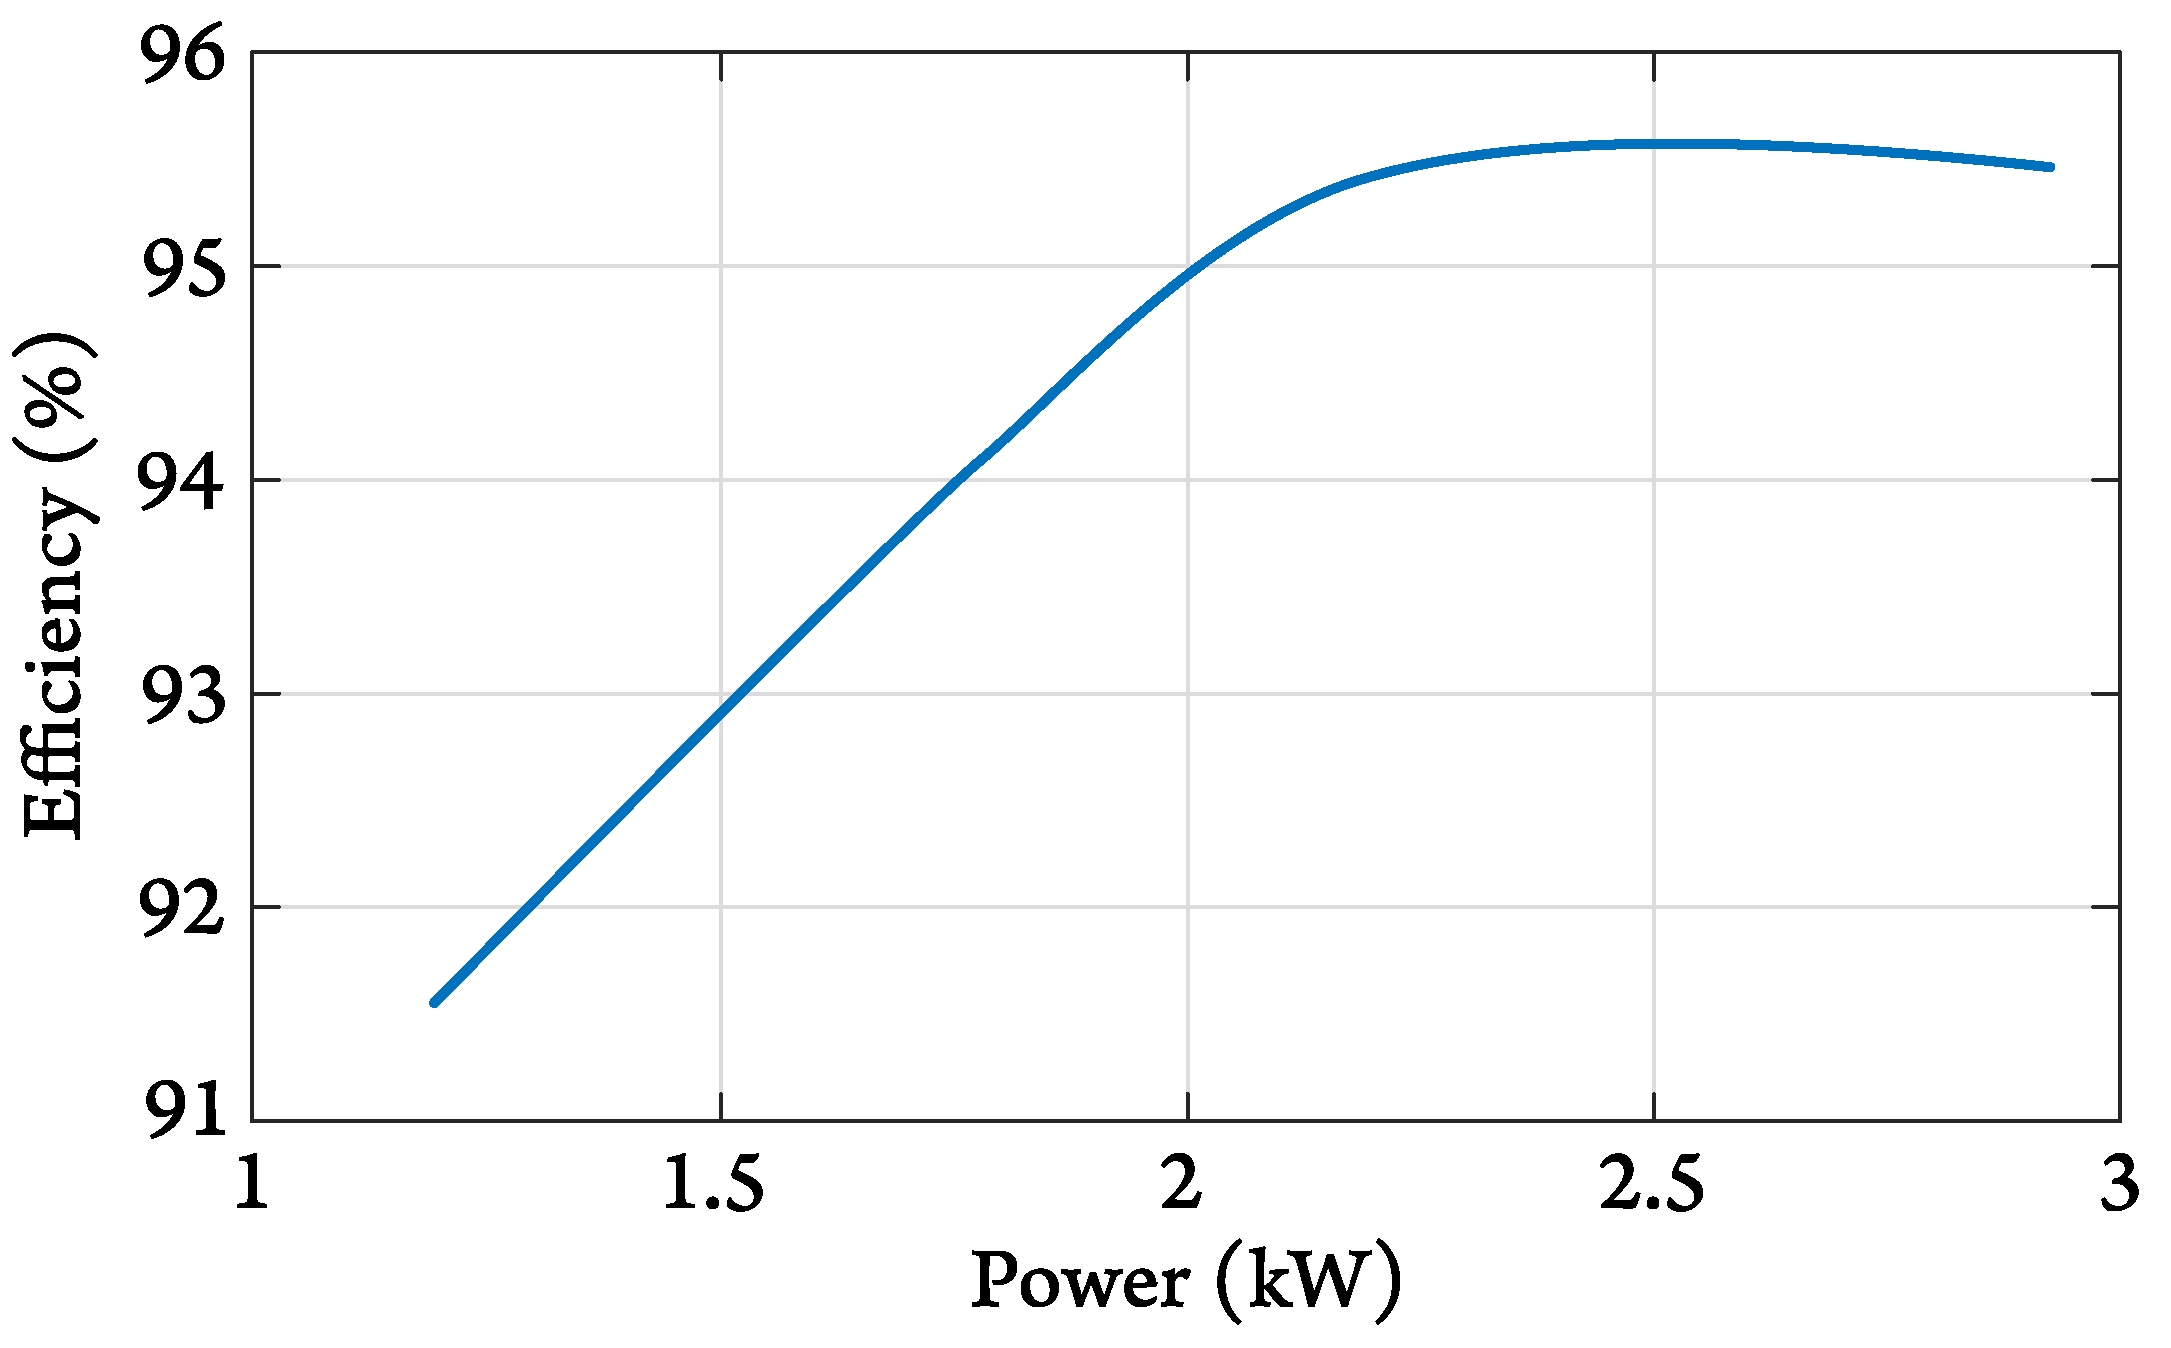
In order to also compare efficiencies, the converter used for the classic cascade architecture in [18] is considered as well as the Infineon evaluation board [28] for the series solution. The efficiency of the converter in the classic architecture has been estimated at around 98%. In order to measure the efficiency of the series architecture PSFB converter, tests were carried out. Voltages between 200 and 400 V and 20 and 50 V were applied to the input and output, respectively. The converter, being current-regulated, meant that different reference values were tested, corresponding to different power values. These tests have resulted in an efficiency of 95.5% at rated power (Figure 24).
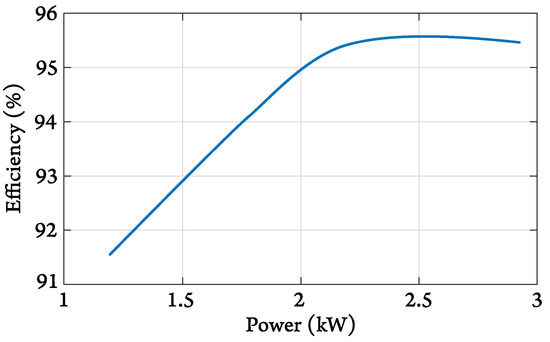
Figure 24.
Measured efficiency of the Infineon PSFB evaluation board.
An overall equivalent efficiency can also be determined. It is given using the ratio between the power requested by the EV and the power that is really supplied by the batteries. In the classic cascade architecture, this is the efficiency of the converter itself, since it processes the power supplied by the EB. In the series architecture, it is given by Equation (8).
Considering the maximum acceleration powers, the equivalent efficiencies are calculated. All sizing powers and efficiencies obtained are listed in Table 4.
Table 4.
Sizing powers and converter efficiencies.
Comparing the classic architecture with the series architecture and considering the internal resistances, since this case is closer to reality, it can be seen that with the series architecture, the converter sizing power is divided by almost 3.7 for the two battery pairs considered. This also reduces the converter’s mass and volume, which preserves the HESS performance.
The converter efficiency of the series solution is lower than that of the classic cascade solution because it is a more robust and complex structure. On the other hand, the overall equivalent efficiency of the series solution is higher than that of the classic one, proving once again the benefits of this architecture.
6. Conclusions
The power supply of an EV with HESS is generally made up of two energy sources: one with high ED and other with high PD. To control the power contribution of each source, one or more DC-DC converters are used. Reducing the volume of this converter improves the HESS performance. Among the different approaches to guaranteeing this reduction, this work proposes the use of an innovative coupling architecture where the sources are connected in series and the converter processes the current difference between them.
The originality of this solution was presented, as well as the simplicity of its implementation and equation. Two EB-PB design cases were tested: one with 100% regenerative braking and one with a braking power limitation. Overall, similar results were obtained between them, with converter sizing powers reduced by almost 3.7 compared with a conventional solution. Experimental tests have also made it possible to validate the real functioning of the architecture. Other than that, the lower efficiency of a more complex converter adapted to the series solution is offset by the overall high equivalent efficiency of the architecture.
Some limitations of the proposed solution led to perspectives for the continuation of this work. In both the simulation and experimental tests, the variation in the batteries’ voltages as a function of their SOCs was not considered. Since the batteries’ voltages are applied directly to the converter, this variation also influences its sizing. Furthermore, the energy management strategy used is a first, non-optimized version. More criteria should be included in its operation. Features such as battery heating and aging modify the system’s current constraints. These changes can have a decisive impact on the converter’s power sizing. Further work will focus on optimizing these strategies or defining new ones to better demonstrate the potential of this architecture. The stationary recharging of batteries may also be studied. In the proposed solution, the recharging source could be connected to the DC bus or directly to the energy battery. A recharging strategy adapted to the chosen option must then be developed to determine the role of the DC-DC converter in this process. A final point worth mentioning is the HESS’ operation in degraded mode, i.e., how the HESS should function in extreme modes. These modes involve certain configurations, for example, when one of the batteries fails or is completely discharged and the driver attempts to accelerate the vehicle. These aspects have not been considered in the development of the management strategy, but they are of extreme importance for obtaining more real results and turning it into an industrial product.
Author Contributions
Conceptualization, C.A.F.d.F. and P.B.; methodology, C.A.F.d.F. and P.B.; validation, C.A.F.d.F. and P.B.; investigation, C.A.F.d.F.; writing—original draft preparation, C.A.F.d.F.; writing—review and editing, C.A.F.d.F., P.B., X.M., and P.L.M.; project administration, P.L.M. All authors have read and agreed to the published version of the manuscript.
Funding
This research received no external funding.
Data Availability Statement
Data are contained within the article.
Conflicts of Interest
The authors declare no conflict of interest.
Abbreviations
The following abbreviations are used in this manuscript:
| HESS | Hybrid Energy Storage System |
| EV | Electric Vehicle |
| ED | Energy Density |
| PD | Power Density |
| EB | Energy Battery |
| PB | Power Battery |
| SOC | State of Charge |
| PSFB | Phase-Shift Full-Bridge |
References
- Li, J.; Du, Z.; Ruther, R.E.; An, S.J.; David, L.A.; Hays, K.; Wood, M.; Phillip, N.D.; Sheng, Y.; Mao, C.; et al. Towar. Low-Cost, High-Energy Density, High-Power Density Lithium-Ion Batteries. J. Miner. Met. Mater. Soc. 2017, 69, 1484–1496. [Google Scholar] [CrossRef]
- ElGhanam, E.; Sharf, H.; Hassan, M.S.; Osman, A. Performance Evaluation of Hybrid Battery–Supercapacitor-Based Energy Storage Systems for Urban-Driven Electric Vehicles. Sustainability 2023, 15, 8747. [Google Scholar] [CrossRef]
- Gebhardt, L.; Brost, M.; Seiffert, R. What Potential Do Light Electric Vehicles Have to Reduce Car Trips? Future Transp. 2023, 3, 918–930. [Google Scholar] [CrossRef]
- Ewert, A.; Schmid, S.; Brost, M.; Davies, H.; Vinckx, L. (Eds.) Small Electric Vehicles; Springer International Publishing: Cham, Switzerland, 2021; ISBN 978-3-030-65842-7. [Google Scholar]
- Lemian, D.; Bode, F. Battery-Supercapacitor Energy Storage Systems for Electrical Vehicles: A Review. Energies 2022, 15, 5683. [Google Scholar] [CrossRef]
- Kouchachvili, L.; Yaïci, W.; Entchev, E. Hybrid battery/supercapacitor energy storage system for the electric vehicles. J. Power Sources 2018, 374, 237–248. [Google Scholar] [CrossRef]
- Lain, M.J.; Brandon, J.; Kendrick, E. Design Strategies for High Power vs. High Energy Lithium Ion Cells. Batteries 2019, 5, 64. [Google Scholar] [CrossRef]
- Burke, A.; Miller, M. The power capability of ultra-capacitors and lithium batteries for electric and hybrid vehicle applications. J. Power Sources 2011, 196, 514–522. [Google Scholar] [CrossRef]
- Chung, S.; Trescases, O. Hybrid Energy Storage System with Active Power-mix Control in a Dual-chemistry Battery Pack for Light Electric Vehicles. IEEE Trans. Transp. Electrif. 2017, 3, 600–617. [Google Scholar] [CrossRef]
- Riczu, C.; Habibi, S.; Bauman, J. Design and optimization of an electric vehicle with two battery cell chemistries. In Proceedings of the 2018 IEEE Transportation Electrification Conference and Expo (ITEC), Long Beach, CA, USA, 13–15 June 2018; pp. 506–512. [Google Scholar] [CrossRef]
- Yim, C.-H.; Niketic, S.; Salem, N.; Naboka, O.; Abu-Lebdeh, Y. Towards Improving the Practical Energy Density of Li-Ion Batteries: Optimization and Evaluation of Silicon:Graphite Composites in Full Cells. J. Electrochem. Soc. 2016, 164, A6294. [Google Scholar] [CrossRef]
- Nizam, M.; Maghfiroh, H.; Nur Kuncoro, F.; Adriyanto, F. Dual Battery Control System of Lead Acid and Lithium Ferro Phosphate with Switching Technique. World Electr. Veh. J. 2021, 12, 4. [Google Scholar] [CrossRef]
- Lipu, M.S.H.; Faisal, M.; Ansari, S.; Hannan, M.A.; Karim, T.F.; Ayob, A.; Hussain, A.; Miah, M.S.; Saad, M.H.M. Review of Electric Vehicle Converter Configurations, Control Schemes and Optimizations: Challenges and Suggestions. Electronics 2021, 10, 477. [Google Scholar] [CrossRef]
- Chakraborty, S.; Vu, H.-N.; Hasan, M.M.; Tran, D.-D.; Baghdadi, M.E.; Hegazy, O. DC-DC Converter Topologies for Electric Vehicles, Plug-in Hybrid Electric Vehicles and Fast Charging Stations: State of the Art and Future Trends. Energies 2019, 12, 1569. [Google Scholar] [CrossRef]
- Jagadeesh, I.; Indragandhi, V. Review and comparative analysis on dc-dc converters used in electric vehicle applications. In Proceedings of the IOP Conference Series: Materials Science and Engineering, Bangkok, Thailand, 17–19 May 2019; Institute of Physics Publishing: Bristol, UK, 2019; Volume 623, p. 12005. [Google Scholar] [CrossRef]
- Zientarski, J.R.R.; Martins, M.L.D.S.; Pinheiro, J.R.; Hey, H.L. Evaluation of Power Processing in Series-Connected Partial-Power Converters. IEEE J. Emerg. Sel. Top. Power Electron. 2019, 7, 343–352. [Google Scholar] [CrossRef]
- Allali, N. Convertisseur Haut Rendement à Dimensionnement réDuit Pour Batterie Hybridée Puissance/éNergie de véHicule éLectrique: Principe de Source de Courant Contrôlée. Ph.D. Thesis, École Centrale de Lille, Lille, France, 2016. [Google Scholar]
- Freitas, C.F.; Bartholomeus, P.; Margueron, X.; Le Moigne, P. Low-volume and high-efficiency converter solution for interfacing a Hybrid Energy Storage System (HESS). In Proceedings of the 2021 IEEE Vehicle Power and Propulsion Conference (VPPC), Gijon, Spain, 25–28 October 2021; pp. 1–6. [Google Scholar] [CrossRef]
- Jayasawal, K.; Karna, A.K.; Thapa, K.B. Topologies for Interfacing Supercapacitor and Battery in Hybrid Electric Vehicle Applications: An Overview. In Proceedings of the 2021 International Conference on Sustainable Energy and Future Electric Transportation (SEFET), Hyderabad, India, 21–23 January 2021; pp. 1–6. [Google Scholar] [CrossRef]
- Song, Z.; Hofmann, H.; Li, J.; Han, X.; Zhang, X.; Ouyang, M. A comparison study of different semi-active hybrid energy storage system topologies for electric vehicles. J. Power Sources 2015, 274, 400–411. [Google Scholar] [CrossRef]
- Ren, J.; Lin, W.; Liu, X.; He, S.; Dongye, Z.; Diao, L. Full Current-Type Control-Based Hybrid Energy Storage System. Energies 2022, 15, 2910. [Google Scholar] [CrossRef]
- Mesbahi, T.; Khenfri, F.; Rizoug, N.; Bartholomeüs, P.; Le Moigne, P. Combined Optimal Sizing and Control of Li-Ion Battery/supercapacitor Embedded Power Supply Using Hybrid Particle Swarm–Nelder–Mead Algorithm. IEEE Trans. Sustain. Energy 2016, 8, 59–73. [Google Scholar] [CrossRef]
- André, M. The ARTEMIS European driving cycles for measuring car pollutant emissions. Sci. Total Environ. 2004, 334–335, 73–84. [Google Scholar] [CrossRef] [PubMed]
- Panasonic Group. NCR20700B Data Sheet. Available online: https://www.batterypacks.com/content/sanyo_ncr20700b.pdf (accessed on 13 October 2023).
- A123 Systems. Battery Pack Design, Validation, and Assembly Guide using A123 Systems Nanophosphate® Cells; A123 Systems: Hangzhou, China, 2014; p. 83. [Google Scholar]
- Freitas, C.F.; Bartholomeus, P.; Margueron, X.; Le Moigne, P. Ragone plot-based method for sizing an Electric Vehicle’s Battery-Battery Hybrid Energy Storage System (HESS). In Proceedings of the 2021 IEEE Vehicle Power and Propulsion Conference (VPPC), Gijon, Spain, 25–28 October 2021; pp. 1–6. [Google Scholar] [CrossRef]
- Freitas, C.F. Hybridation de Batteries Puissance-éNergie Avec Convertisseur de Couplage à Dimensionnement réDuit: Application Aux véHicules éLectriques Urbains. Ph.D. Thesis, École Centrale de Lille, Lille, France, 2023. [Google Scholar]
- Kutschak, M.-A.; Escudero, M. 3300W 54V Bi-Directional Phase-Shift Full-Bridge (PSFB) Evaluation Board with 600V Cool-MOS™ CFD7 and XMC™. Available online: https://www.infineon.com/cms/en/product/evaluation-boards/eval_3k3w_bidi_psfb (accessed on 3 October 2023).
- Escudero, M.; Kutschak, M.-A.; Meneses, D.; Rodriguez, N.; Morales, D.P. A Practical Approach to the Design of a Highly Efficient PSFB DC-DC Converter for Server Applications. Energies 2019, 12, 3723. [Google Scholar] [CrossRef]
- Escudero, M.; Meneses, D.; Rodriguez, N.; Morales, D.P. Modulation Scheme for the Bidirectional Operation of the Phase-Shift Full-Bridge Power Converter. IEEE Trans. Power Electron. 2019, 35, 1377–1391. [Google Scholar] [CrossRef]


Disclaimer/Publisher’s Note: The statements, opinions and data contained in all publications are solely those of the individual author(s) and contributor(s) and not of MDPI and/or the editor(s). MDPI and/or the editor(s) disclaim responsibility for any injury to people or property resulting from any ideas, methods, instructions or products referred to in the content. |
© 2023 by the authors. Licensee MDPI, Basel, Switzerland. This article is an open access article distributed under the terms and conditions of the Creative Commons Attribution (CC BY) license (https://creativecommons.org/licenses/by/4.0/).