Abstract
This paper presents an extended calibration procedure for mode accelerometers, which makes it possible to compare the accuracy of sensors of this type from different manufacturers. This comparison involves determining the upper bound on dynamic error for a given quality criterion, i.e., the integral square error and absolute error. Therefore, this article extends the standard calibration implemented in engineering practice using tests, providing a value for the upper bound on dynamic error as an additional parameter describing the accelerometer under consideration. This paper presents the theoretical basis for this type of solution, which is partly based on measurement data obtained from a standard calibration process and on the results of parametric identification. The charge mode accelerometer is considered here because this type of sensor is commonly used in the energy industry, as it can operate over a wide range of temperatures. The calculation results presented in this paper were obtained using MathCad 5.0 software, and the tests were carried out using an accelerometer of type 357B21. In the experimental part of this article (Results of Extended Calibration section), values for the upper bound of the dynamic error were determined for two error criteria and constrained simulation signals related to these errors. The impact of interference on the results of accelerometer tests was omitted in this paper.
1. Introduction
Charge mode accelerometers [1] are widely used in power plants, thermal power plants, and production plants to monitor vibrations and oscillations in machines and devices installed there [2,3] due to their wide range of operating temperatures (from −200 to 400 °C). These measurements are important in terms of detecting early signs of wear or damage to machines and equipment, and proper planning of their maintenance [4]. This type of accelerometer is widely used to detect vibrations in wind turbines, nuclear and conventional energy generators, nuclear reactors, and hydropower plants and can increase the efficiency of this type of infrastructure [5,6]. Accelerometers are used to optimize the positioning of renewable energy sources (wind farms and photovoltaic panels), which ultimately increases their operating efficiency [7]. They are also used to detect seismic movement, which is extremely important for the operational safety of nuclear power plants in many countries [8,9].
In view of the above applications, it can be seen that the accuracy of charge mode accelerometers, which is verified through a standard calibration process [10], is very important. During this process, the amplitude response is determined with the corresponding sensitivity [11] and linearity characteristics. From the point of view of engineering practice, these activities are sufficient to ensure the operational reliability of many systems used in a wide range of industries [12]. However, to ensure even greater accuracy in energy applications, it seems reasonable to introduce additional criteria for assessing the accuracy of vibration detection carried out using charge mode accelerometers [13]. This paper, therefore, proposes an additional evaluation criterion defined as the upper bound of the dynamic error [14,15], and this procedure is referred to as the extended calibration of charge mode accelerometers [16]. This proposed method is based on measurements of two frequency responses, i.e., the amplitude and phase [17]. The measurement points for these responses are determined by means of practical experiments using dedicated calibrators (for measurement of the amplitude response), supplemented with the use of a measurement data acquisition card [18] and specialized control and measurement software such as LabVIEW 2023 Q2 (for measurement of the phase response) [19]. Based on the measurements of the frequency responses, the parametric identification [20] of the mathematical model of the charge mode accelerometer can be carried out [21]. As a result of parametric identification, other parameters of the mathematical model of the charge mode accelerometer are determined in addition to the sensitivity coefficient. Simultaneous approximation of both responses is achieved using the weighted least squares method [22,23]. The parametric identification of the accelerometer model constitutes the numerical part of this paper. The next stage, also numerical, is devoted to determining the upper bound of the dynamic error and the corresponding simulation input signal with constraints [15,16,24]. Two constraints, the magnitude and duration of the signal, are considered in this paper [24]. The simulation signal determined in this way represents the critical case of accelerometer input excitation, in the sense that any other dynamic signal obtained under the real operating conditions of the sensor and included in the constraints of the simulation signal produces a dynamic error at the sensor output with a value at most equal to the value of the critical signal [15,16]. The upper bound of the dynamic error is determined for a quality criterion that is assumed in advance. The integral-square [25] and absolute error [26] criteria are considered, and for each of these, the upper bound of the dynamic error is determined together with the corresponding signal with constraints. The value of this error is calculated in relation to the reference, which may be a low-pass analog filter [27] with a bandwidth corresponding to the upper operating frequency of the charge mode accelerometer. An eighth-order Bessel filter [28] is applied in this work. The order of this filter was selected to ensure that it was at least twice as high as the order of the accelerometer model.
The relationship between the error criterion (integral-square error and absolute error) and the test time of the charge mode accelerometer is also presented and discussed in this paper. This relationship may allow for determining the value of the upper bound of the dynamic error for any accelerometer testing time, which greatly facilitates the assessment of its dynamic accuracy [14,15]. As a result, one can compare two charge mode accelerometers or even the selected group of this type of sensors.
Section 2 of the paper presents the mathematical models of the charge mode accelerometer and the corresponding reference. These mathematical models reflect the transfer functions of the accelerometer and reference and are presented as the corresponding state-space notation. This section also describes a standard calibration system for this type of accelerometer and the corresponding calibration and linearity certificates. Section 3 explains the parametric identification of the mathematical model of the charge mode accelerometer using the weighted least squares method applied for both the accelerometer frequency responses. Section 4 introduces the extended calibration process for charge mode accelerometers, while Section 5 presents the results of this calibration for the selected accelerometer of type 357B21.
2. Materials and Methods
Figure 1 shows the block diagram of the extended calibration for the charge mode accelerometer.
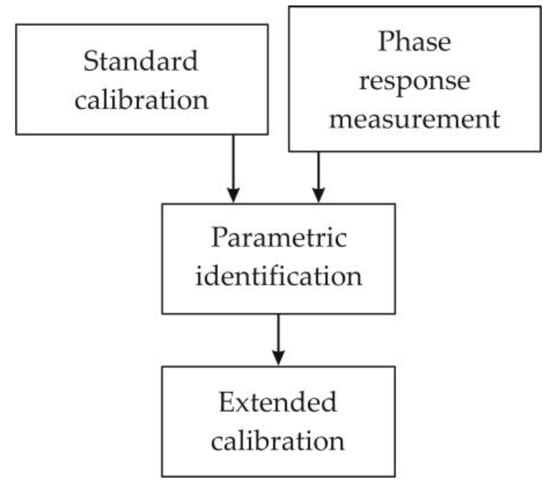
Figure 1.
Block diagram of the extended calibration for the charge mode accelerometer.
The basis for the extended calibration of the charge mode accelerometer is the result of the standard calibration of this sensor in terms of determining the amplitude response (charge sensitivity). As a complement to this procedure, the measurement points of the phase response should be determined. Then, the parametric identification of the mathematical model (transfer function) of the accelerometer is carried out, and the results of this identification constitute the basis for the implementation of the extended calibration of this sensor.
The mathematical model of the charge mode accelerometer, represented by the state equations, has the following form:
where , and while , and are the voltage sensitivity , time constant [s], damping ratio [-], and non-damped natural frequency [Hz], respectively [21].
The mathematical model of the reference, represented by an eighth-order analog Bessel filter, is
where , , , , , and [28]. Here, and denote the measuring range of the accelerometer and cut-off frequency of the filter, respectively. The frequency corresponds to the operating frequency of the accelerometer under test.
Equation (1) concerns the input–output description of the charge mode accelerometer, which is subject to research, while Equation (2) is the input–output description of the theoretical model, which is a reference to determine the upper bound of the dynamic error. The above equations are not a direct result of physical modeling for the charge mode accelerometer, but they present the coordinate transformations that form the optimal model for the parametric identification of the accelerometer under test.
The standard calibration of the charge mode accelerometer was carried out using the portable calibrator shown in Figure 2. The charge mode accelerometer of type 357B21 (1) was connected to the charge amplifier (2) via the connection cable (3) for calibration. As a result of this calibration, the measurement points of the charge sensitivity were obtained, as listed in Table 1. The number of measurement points was limited by the possibility of registering them in the memory of the used portable calibrator. The tests were carried out for frequencies in the range of 15 Hz to 9 kHz at a constant acceleration of 1 g peak.
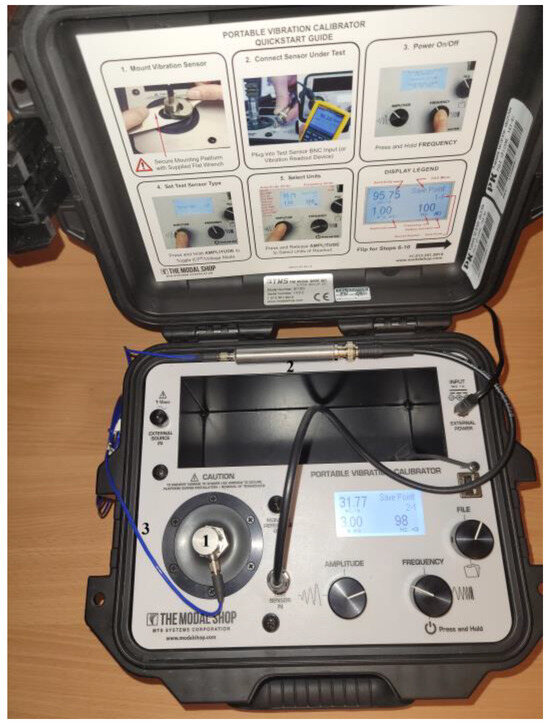
Figure 2.
System for the standard calibration of the charge mode accelerometer using the portable calibrator of type 9110D. 1—accelerometer under test, 2—charge amplifier, 3—connection cable.

Table 1.
Measured points of the charge sensitivity.
Figure 3 shows the calibration certificate obtained using the system shown in Figure 2. The certificate confirms the frequency operating ranges (5% and 10%) of the accelerometer under test, which are drawn from the datasheet [29].
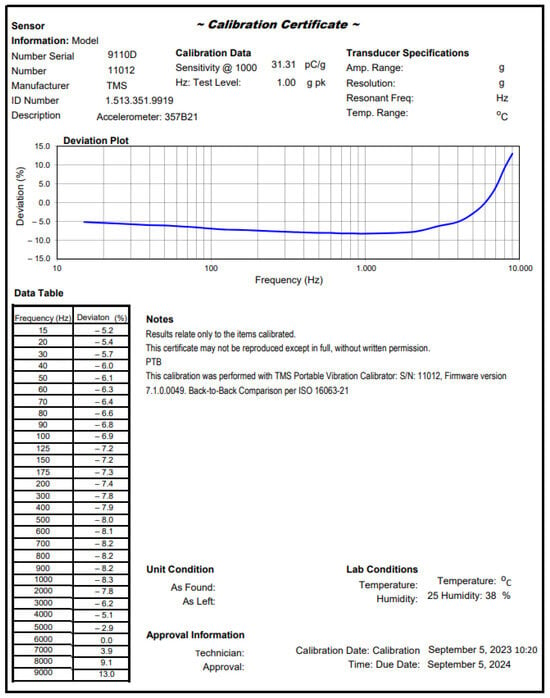
Figure 3.
Calibration certificate obtained for an accelerometer of type 357B21.
Figure 4 shows the linearity certificate, which represents the relationship between the amplitude (in pico Coulomb) and acceleration (in g peak). The acceleration was varied in the range of 0.25 to 3.00 g peak for a constant test frequency of 100 Hz. The range of changes in acceleration was assumed in advance.
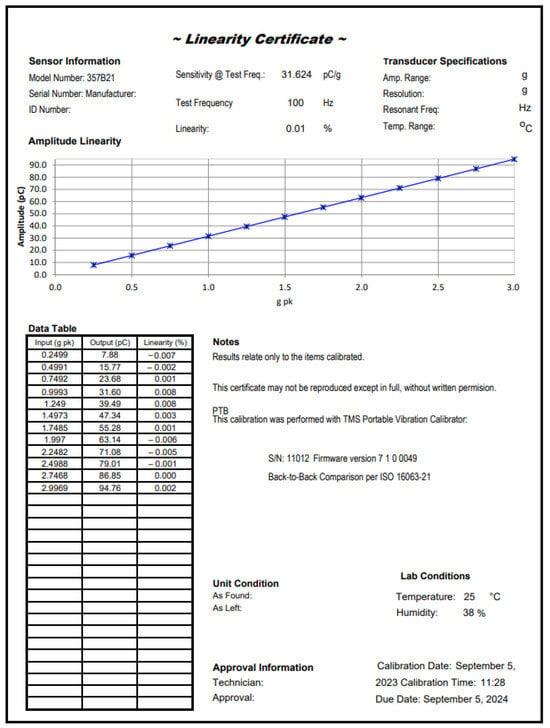
Figure 4.
Linearity certificate obtained for an accelerometer of type 357B21.
The certificate shows that the nonlinearity is consistent with the permissible range () specified in the datasheet [29].
3. Parametric Identification of the Accelerometer Mathematical Model
To carry out parametric identification of the mathematical model of the charge mode accelerometer, in addition to the data shown in Table 1, the phase shift was measured between the output signals of the accelerometer under test and the standard accelerometer built into the structure of the portable calibrator. These measurements were performed at the same frequencies as the charge sensitivity measurements in Table 1. Table 2 presents the measurement results of the phase response for the accelerometer.

Table 2.
Measured results for the phase response.
Table 3 shows the voltage sensitivities obtained from a transformation of the charge sensitivity using the following formula:
where , and denote the acceleration due to gravity and the capacitance of the accelerometer and wire, respectively. This transformation was carried out for the value of equal to 9.8105 (typical for Cracow in Poland), the capacitance taken from the data sheet for the accelerometer, and the capacitance calculated for a typical wire length of 1.2 m. The values of the capacitances and are 930 pF and 100 pF, respectively, for an accelerometer of type 357B21.

Table 3.
Transformation of charge sensitivity to voltage sensitivity.
Simultaneous approximation of frequency responses (amplitude and phase) is carried out using the weighted least squares method based on the formula below:
where is the vector of the estimated parameters for the accelerometer model in Equation (1) [17,21]. The -dimensional vector is obtained based on the following equation:
where and are the number of measurement points for the frequency response. and are the real and imaginary parts of the transfer function , respectively. The vector is then
The matrix has the following form:
where
The covariance matrix is
where
and
Figure 5 shows the results for the simultaneous approximation of both frequency responses, i.e., the amplitude (represented by the accelerometer sensitivity) and the phase (the phase shift between the output signals of the accelerometer under test and the corresponding reference accelerometer). This approximation was obtained by applying the weighted least squares method.
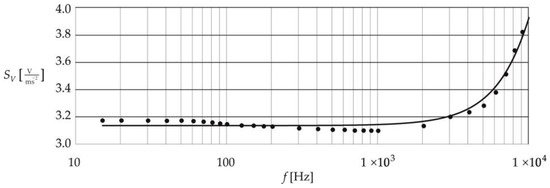
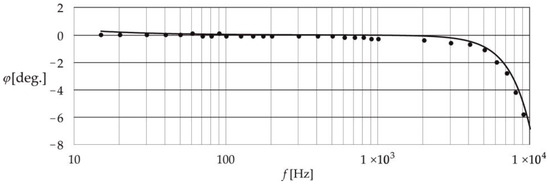
Figure 5.
Frequency responses (amplitude and phase) obtained using the weighted least squares method.
The estimates of the parameters of the accelerometer mathematical model obtained from Equation (4) are as follows: , and These estimates form the basis for determining the upper bound of the dynamic error for two quality criteria: the integral-square error and the absolute error. The values for the dynamic error are obtained from the extended calibration of the charge mode accelerometer, as described in the next section of this paper.
4. Extended Calibration of the Charge Mode Accelerometer
The upper bound of the dynamic error for the integral-square criterion is determined using the following formula [30]:
where and are the magnitude constraints related to the input signal and the testing time of the accelerometer, respectively, and the signal is determined using the fixed-point algorithm (simulation method) by processing the impulse response , which is defined using the following formula:
where and are the impulse responses of the accelerometer and the reference, respectively. The signal is constrained in terms of its magnitude and time and produces the upper bound of the dynamic error. It is, therefore, the critical (worst case) input signal in the sense that any other signal included within its constraints will produce an error less than its upper value [14,15].
The impulse response is determined based on Equation (1) using the following formula:
where and are the state, input, and output matrices, and and are the denominator order, numerator order, number of inputs, and the number of outputs, respectively.
In an analogous way, based on Equation (2), the impulse response of the reference is determined using the formula
The upper bound on the dynamic error for the absolute error is determined using the formula [14,15]
where is determined using Equation (13).
The signal that produces the error given in Equation (3) is defined using the formula
The dynamic error , which is a function of time and constitutes a response to the signal for both criteria, can be determined using the following integral convolution:
The criteria given in Equations (12) and (16) determine the highest mean and instantaneous error values obtained at time These criteria may constitute an additional error function for assessing the accuracy of the charge mode accelerometer.
5. Results of Extended Calibration
In this section, we determine the values of the upper bound of the dynamic error, defined in this paper as the extended calibration process. These values were determined for the error criteria presented in Section 4 based on the results of the parametric identification of the charge mode accelerometer of type 357B21 presented in Section 3. As a reference for determining the dynamic error, the filter model defined in Equation (2) was used.
The value of the integral-square error was determined using Equation (12) and is . The parameter was assumed to correspond to the accelerometer charge sensitivity contained in the corresponding data sheet [29], with a value of 30 pC/g. The time was assumed to be the steady state of the impulse response i.e., 1 ms. A maximum number of iterations for the fixed-point algorithm equal to 50 was also assumed. Figure 6 shows the shape of the signal that produced the upper bound of the dynamic error and the error
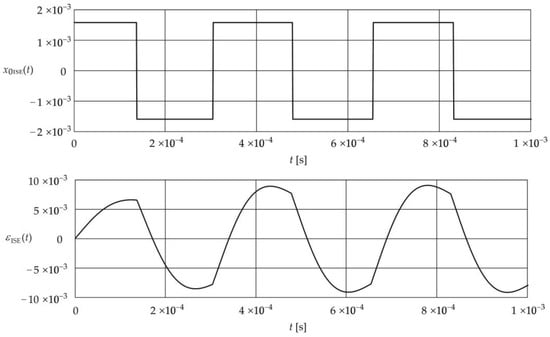
Figure 6.
Shape of the signal and the corresponding error .
The signal has five time switches, while the error is characterized by three rises and falls over time.
Figure 7 shows the relationship between the ISE and the accelerometer test time in the range with a step equal to s.
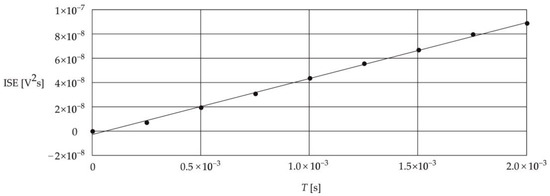
Figure 7.
Relationship between the ISE and the time .
The above characteristic shows that the relationship between the ISE and the time T is linear. This makes it much easier to determine the ISE for higher values of accelerometer testing times using the properties of the linear function. The equation of this function is . To determine the ISE for any time higher than , the uncertainty value of the linear regression is also important, which is .
It should be emphasized, however, that a detailed analysis of the characteristic may show that for the time corresponding to the unsteady impulse response , this relationship is slightly nonlinear [30]. However, due to the very low value of time, which corresponds to the steady state of the response , this nonlinearity can be omitted.
The value of the absolute error, determined using Equation (16), was . Figure 8 shows the shape of the signal produced by this error and the error
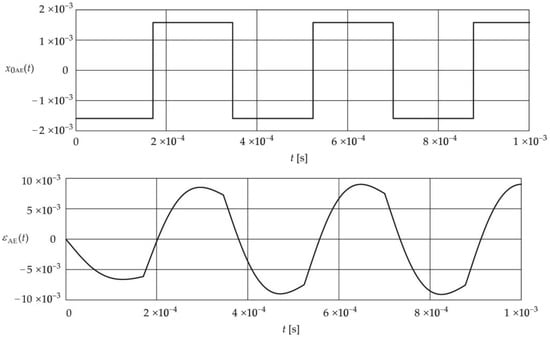
Figure 8.
Shape of the signal and corresponding error .
Similar to signal signal undergoes five time switches. The error reaches its highest value for which is a characteristic property of this criterion. However, it should be noted that both the signal and the error at the initial values of time reach negative values, unlike both the signal and the error .
Figure 9 shows the relationship between the AE and the time for the analogous accelerometer testing time and quantization step of the calculations.
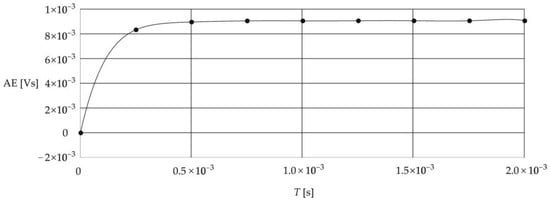
Figure 9.
Relationship between the AE and the time .
Figure 9 shows that the relationship between AE and the accelerometer test time increases exponentially for the times corresponding to the unsteady impulse response . For the times with a value higher than the time corresponding to the steady state of this response, the characteristic becomes constant and is equal to 9.06 .
The approximation of the measurement points of the characteristics shown in Figure 9 was made using polynomial regression [31]. As a result, the following eighth-order approximation equation was obtained: The uncertainty of this regression is equal to .
The ISE and AE obtained in this paper can be treated as the result of the extended calibration of the charge mode accelerometer under consideration. The value of these errors can constitute an additional criterion for comparing various accelerometers and thus help improve the accuracy of this type of sensor.
The values of ISE and AE presented above were obtained in response to the rectangular signals. It is also possible to determine the values of both errors for signals with an additional constraint regarding the rate of change [24]. However, in such a case, it is necessary to use much more advanced computational procedures using evolutionary algorithms [32]. In this case, approximately 40 percent lower dynamic error values are obtained, and the simulation signals with an additional constraint have a triangular or trapezoidal shape [14,15,16].
6. Conclusions
This paper has presented an extended calibration method for charge mode accelerometers, which may enable the accuracy of this type of sensor to be increased for applications in energy systems. This calibration process is based on the measurement results obtained from a standard calibration but requires adopting the order and class of the accelerometer model and determining the parameters of this model through its parametric identification. The parameters determined in this way form the basis for determining the upper bound of the dynamic error for the assumed error criterion. This upper bound may be an important additional criterion for assessing the accuracy of an accelerometer and their mutual comparability in this issue. In this study, we determined the upper bound of the dynamic error for both the integral-square error and the absolute error. The results are numerical values that can be easily and quickly used in practical applications, especially in energy systems where highly accurate sensor measurements are required. Test signals with five constraints were obtained through a simulation for the charge mode accelerometer under test (type 357B21) with both error criteria. The relationship between the errors and the accelerometer testing time was also determined in this paper. Based on the results obtained, it can be concluded that for the integral-square error criterion, this relationship is linear (linear increase in the error value), while for the absolute error, this relationship is exponential (exponential increase until the steady state of the error). It should be stated that the above characteristics are useful tools for assessing the accuracy of the charge mode accelerometer at any time of its operation.
Based on the research conducted in this paper, further directions of research regarding extended calibration of accelerometers can be indicated:
- –
- Analysis of other dynamic error criteria;
- –
- Analysis of additional limitations regarding the simulation signal exciting the accelerometer;
- –
- Testing of other types of accelerometers, e.g., eddy current accelerometer.
Funding
This research was conducted at the Faculty of Electrical and Computer Engineering, Krakow University of Technology, and was financially supported by the Ministry of Science and Higher Education, Republic of Poland (grant no. E-1/2023).
Data Availability Statement
Data are contained within the article.
Conflicts of Interest
The author declares no conflict of interest.
References
- Wu, T.; You, D.; Gao, H.; Lian, P.; Ma, W.; Zhou, X.; Wang, C.; Luo, J.; Zhang, H.; Tan, H. Research Status and Development Trend of Piezoelectric Accelerometer. Crystals 2023, 13, 1363. [Google Scholar] [CrossRef]
- Correa, J.C.; Guzman, A.A. Mechanical Vibration and Condition Monitoring; Elsevier: Amsterdam, The Netherlands, 2020; ISBN 9780128203903. [Google Scholar]
- Romanssini, M.; Aguirre, P.C.; Compassi-Severo, L.; Girard, A.G. A Review on Vibration Monitoring Techniques for Predictive Maintenance of Rotating Machinery. Eng 2023, 4, 1797–1817. [Google Scholar] [CrossRef]
- Falekas, G.; Karlis, A. Digital Twin in Electrical Machine Control and Predictive Maintenance: State-of-the-Art and Future Prospects. Energies 2021, 14, 5933. [Google Scholar] [CrossRef]
- Chiena, F.; Huang, L.; Zhao, W. The Influence of Sustainable Energy Demands on Energy Efficiency: Evidence from China. J. Innov. Knowl. 2023, 8, 100298. [Google Scholar] [CrossRef]
- Kaygusuz, K. Energy Efficiency and Renewable Energy Sources for Industrial Sector. Energy Convers. Manag. 2021, 213–238. [Google Scholar] [CrossRef]
- Smolarz, A.; Lezhniuk, P.; Kudrya, S.; Komar, V.; Lysiak, V.; Hunko, I.; Amirgaliyeva, S.; Smailova, S.; Orazbekov, Z. Increasing Technical Efficiency of Renewable Energy Sources in Power Systems. Energies 2023, 16, 2828. [Google Scholar] [CrossRef]
- Lu, C.; Lyu, J.; Zhang, L.; Gong, A.; Fan, Y.; Yan, J.; Li, X. Nuclear Power Plants with Artificial Intelligence in Industry 4.0 Era: Top-Level Design and Current Applications—A Systemic Review. IEEE Access 2020, 8, 194315–194332. [Google Scholar] [CrossRef]
- Jung, D.; Shin, J.; Lee, C.; Kwon, K.; Seo, J.T. Cyber Security Controls in Nuclear Power Plant by Technical Assessment Methodology. IEEE Access 2023, 11, 15229–15241. [Google Scholar] [CrossRef]
- Zhang, D.; Jing, J.; Qin, L.; Liu, J.; Li, M.; Liu, J. Analytical Mathematical Model of Piezoelectric 6-D Accelerometer About Amplitude–Frequency Characteristics. IEEE Trans. Instrum. Meas. 2022, 71, 1–12. [Google Scholar] [CrossRef]
- Acar, C.; Shkel, A.M. Experimental evaluation and comparative analysis of commercial variable-capacitance MEMS accelerometers. J. Micromech. Microeng. 2003, 13, 633–645. [Google Scholar] [CrossRef]
- Zhang, T.; Xia, R.; Zhao, J.; Wu, J.; Fu, S.; Chen, Y.; Sun, Y. Low-Coherence Measurement Methods for Industrial Parts with Large Surface Reflectance Variations. IEEE Trans. Instrum. Meas. 2023, 72, 1–14. [Google Scholar] [CrossRef]
- Diamond, D.H.; Heyns, P.S.; Oberholster, A.J. Accuracy Evaluation of Sub-pixel Structural Vibration Measurements through Optical Flow Analysis of a Video Sequence. Measurement 2017, 95, 166–172. [Google Scholar] [CrossRef]
- Layer, E.; Gawedzki, W. Theoretical Principles for Dynamic Errors Measurement. Measurement 1990, 8, 45–48. [Google Scholar] [CrossRef]
- Layer, E.; Tomczyk, K. Signal Transforms in Dynamic Measurements; Springer: Berlin/Heidelberg, Germany, 2015; ISBN 978-3-319-13209-9. [Google Scholar]
- Tomczyk, K.; Ostrowska, K. Procedure for the Extended Calibration of Temperature Sensors. Measurement 2022, 196, 111239. [Google Scholar] [CrossRef]
- Link, A.; Täbner, A.; Wabinski, W.; Bruns, T.; Elster, C. Modelling Accelerometers for Transient Signals Using Calibration Measurement upon Sinusoidal Excitation. Measurement 2007, 40, 928–935. [Google Scholar] [CrossRef]
- Austerlitz, H. Data Acquisition Techniques Using PCs; Elsevier: Amsterdam, The Netherlands, 2003. [Google Scholar] [CrossRef]
- Kehtarnavaz, N.; Kim, N. Digital Signal Processing System-Level Design Using LabVIEW; Elsevier: Amsterdam, The Netherlands, 2005; ISBN 9780080477244. [Google Scholar]
- Xia, H.; Chen, F. Filtering-Based Parameter Identification Methods for Multivariable Stochastic Systems. Mathematics 2020, 8, 2254. [Google Scholar] [CrossRef]
- Tomczyk, K. Problems in Modelling of Charge Output Accelerometers. Metrol. Meas. Syst. 2016, 23, 645–659. [Google Scholar] [CrossRef]
- Xu, P. Improving the Weighted Least Squares Estimation of Parameters in Errors-In-Variables Models. J. Frankl. Inst. 2019, 356, 8785–8802. [Google Scholar] [CrossRef]
- Kantar, Y.M. Estimating Variances in Weighted Least-Squares Estimation of Distributional Parameters. Math. Comput. Appl. 2016, 21, 7. [Google Scholar] [CrossRef]
- Rutland, N.K. The Principle of Matching: Practical Conditions for Systems with Inputs Restricted in Magnitude and Rate of Change. IEEE Trans. Autom. Control. 1994, 39, 550–553. [Google Scholar] [CrossRef]
- Uppal, A.A.; Azam, M.R.; Iqbal, J. Sliding Mode Control in Dynamic Systems. Electronics 2023, 12, 2970. [Google Scholar] [CrossRef]
- Franses, P.H. A Note on the Mean Absolute Scaled Error. Int. J. Forecast. 2016, 32, 20–22. [Google Scholar] [CrossRef]
- Martincorena-Arraiza, M.; De La Cruz-Blas, C.A.; Lopez-Martin, A.; Carlosena, A. Micropower Class AB Low-Pass Analog Filter Based on the Super-Source Follower. IEEE Trans. Circuits Syst. II Express Br. 2022, 69, 3684–3688. [Google Scholar] [CrossRef]
- Simancas-García, J.; Meléndez-Pertuz, F.; Vélez-Zapata, J. Analog Filtering in Instrumentation Using Posicast. IEEE Lat. Am. Trans. 2019, 17, 280–287. [Google Scholar] [CrossRef]
- Data Sheet for 357b21 Accelerometer. Available online: https://www.pcb.com/products?m=357b21 (accessed on 25 September 2023).
- Honig, M.L.; Steiglitz, K. Maximizing the Output Energy of a Linear Channel with a Time and Amplitude Limited Input. IEEE T. Inform. Theory 1992, 38, 1041–1052. [Google Scholar] [CrossRef][Green Version]
- Sun, B.; Liu, H.; Zhou, S.; Li, W. Evaluating the Performance of Polynomial Regression Method with Different Parameters during Color Characterization. Math. Probl. Eng. 2014, 2014, 418651. [Google Scholar] [CrossRef]
- Tomczyk, K. Application of Genetic Algorithm to Measurement System Calibration Intended for Dynamic Measurement. Metrol. Meas. Syst. 2006, 13, 93–103. [Google Scholar]
Disclaimer/Publisher’s Note: The statements, opinions and data contained in all publications are solely those of the individual author(s) and contributor(s) and not of MDPI and/or the editor(s). MDPI and/or the editor(s) disclaim responsibility for any injury to people or property resulting from any ideas, methods, instructions or products referred to in the content. |
© 2023 by the author. Licensee MDPI, Basel, Switzerland. This article is an open access article distributed under the terms and conditions of the Creative Commons Attribution (CC BY) license (https://creativecommons.org/licenses/by/4.0/).