Abstract
The rapid expansion of solar photovoltaic (PV) generation has established its pivotal role in the shift toward sustainable energy systems. This study conducts an in-depth analysis of solar generation data from 2015 to 2018 in Spain, with a specific emphasis on temporal patterns, excluding weather data. Employing the powerful eXtreme gradient boosting (XGBoost) algorithm for modeling and forecasting, our research underscores its exceptional efficacy in capturing solar generation trends, as evidenced by a remarkable root mean squared error (RMSE) of 11.042, a mean absolute error (MAE) of 5.621, an R-squared (R²) of 0.999, and a minimal mean absolute percentage error (MAPE) of 0.046. These insights hold substantial implications for grid management, energy planning, and policy development, reaffirming solar energy’s promise as a dependable and sustainable contributor to the electrical power system’s evolution. This research contributes to the growing body of knowledge aimed at optimizing renewable energy integration and enhancing energy sustainability for future generations.
1. Introduction
The rapid decline in the cost of renewable energies, as highlighted by IRENA [1], is driving a global transition towards more sustainable options, with photovoltaic energy expected to contribute up to 40% of the world’s energy supply by 2040 [2]. However, this shift presents a significant challenge due to the inherent volatility of renewable energy sources (RES) caused by climate fluctuations, creating substantial barriers for electricity companies. As the proportion of RES in energy production increases, the risk of temporary blackouts [3] and a reduction in energy quality also rises [4]. This volatility is primarily attributed to RES, such as solar photovoltaic (PV) generation, which are intermittent and susceptible to weather conditions. Effectively managing this variability is crucial for maintaining a reliable energy supply.
The expansion of RES in electricity production introduces a new set of challenges [5]. Accurate short-term predictions are crucial for optimal energy management, encompassing storage, sale, and distribution, while forecasting errors can lead to significant profit losses [6]. The need to adapt energy production to current demand, already in practice, becomes more complex as wind and solar power gain prominence [7,8]. Developing methods for forecasting electricity production by these sources, contingent on weather conditions, and analyzing production capacity at different intervals are essential [9]. Continuous advancements in technology aim to enhance predictive accuracy, ensuring sustainability and reliability in grid operations amid the evolving landscape of renewable energy.
Renewable energy, particularly solar PV, will become a significant source of energy in the future. To ensure safety, reliability, and profitability as their proportion in the electrical energy supply grows, the accurate prediction of photovoltaic panel power generation is crucial. Solar energy’s unpredictable nature poses challenges such as voltage fluctuations, power factor issues, and stability. Solar energy’s ascendancy underscores the importance of a thorough understanding of its temporal and spatial behavior, particularly in the absence of weather data. While previous studies have often emphasized the interplay between solar generation and weather conditions, this research uniquely focuses on analyzing solar generation patterns independently of weather variables. It delves into the inherent capabilities and challenges of solar energy as a standalone contributor to the electricity power grid.
The purpose of this research is to unveil the intricate temporal patterns of solar generation in Spain during the aforementioned critical period. Through rigorous analysis and predictive modeling employing the XGBoost algorithm, we scrutinize diurnal variations, seasonal trends, and geographic disparities in solar generation. The following metrics are used to assess the outcome: mean absolute error (MAE), mean absolute percentage error (MAPE), root mean squared error (RMSE), and coefficient of determination (R2). The research’s primary objective is to provide insights into the self-reliance and potential reliability of solar energy within the electrical power system. Furthermore, it explores the implications of these patterns for grid management, energy planning, and policy formulation in Spain and beyond.
As solar energy continues to gain prominence on the global energy landscape, understanding its nuances and capabilities, especially without the crutch of weather data, holds profound implications for harnessing its full potential. This research endeavors to contribute to this essential discourse, offering a comprehensive analysis that illuminates the contribution of solar energy in defining the prospects of sustainable energy systems. The following is how this paper is structured: Section 2 offers a review of previous research on this topic; Section 3 provides details the methodology of research utilizing XGBoost; Section 4 presents and analyzes the results of the research; and Section 5 summarizes the paper by discussing future recommendations.
2. Related Work
This section delves into the most recent research literature within the area of study, highlighting the extensive range of solar power models and techniques that have been proposed. These models encompass various mathematical functions, both linear and non-linear, applied across diverse contexts, including projects in Saudi Arabia [9], Malaysia [10], Brazil [11], Israel [12], Australia [13,14], Turkey [15], India [16], the United States [17], Scotland [18], South Korea [19], Nigeria [20], Italy [21], and Algeria [22]. Moreover, non-linear functions have been employed for daily diffuse solar energy radiation calculations [23], irradiation simulations [24], and unrestricted methods [25]. In [26,27], the focus was on forecasting the solar power radiation output, while our method focus on the predicting solar generation output, providing a more accessible perspective for end-users and emphasizing the return on investment of solar installations. Fuzzy logic techniques have found utility in short-term energy forecasting [28]. Additionally, genetic algorithms have played a role in achieving pump self-sustainability [29], while artificial neural networks (ANNs) have become increasingly prevalent. Table 1 presents the related work concerning forecasting solar PV power generation using machine learning algorithms, including the parameters employed and the output metrics.

Table 1.
Parameters and output metrics in machine learning-based solar power generation forecasting models.
The significance of these advancements in solar energy modeling becomes evident when assessing their performance against traditional statistical methods [38]. For instance, the LSTM model has consistently demonstrated superior solar forecast accuracy compared to ARIMA in the absence of data with noise [39]. The application of deep learning techniques, such as ANNs, has yielded impressive outcomes in regression and classification challenges thanks to their automatic parameter tuning through supervised learning algorithms [40]. Research has closely examined artificial intelligence methods in renewable energy forecasting and optimization [41], particularly for modeling and simulating solar energy systems [42]. Furthermore, artificial neural networks have been pivotal in predicting environmental variables and estimating unconventional energy systems [43]. In the realm of solar radiation applications, MLPs, empowered decision trees combined with linear regression and other approaches have been evaluated [44], while LSTM models process large datasets and exhibit adaptability to unknown data, making them preferable to SVM-based models due to their superior results [45].
Numerous prior studies in [11,46,47,48] have conventionally focused on a multitude of meteorological parameters. These encompass, but are not limited to, irradiance, temperature, humidity, air pressure, wind speed, wind direction, precipitation, dust deposition, and cloud cover. In contrast, the distinctiveness of our research paper lies in its deliberate omission of meteorological data, with a sole reliance on historical data spanning the years 2015 to 2018, sourced exclusively from Spain. Furthermore, our study introduces a pioneering approach by exclusively utilizing historical data, thereby eliminating the inherent uncertainties associated with weather forecasting.
3. Methods
3.1. Dataset and Preprocessing
The foundation of this research rests upon a meticulously collected dataset of hourly solar generation spanning the years 2015 to 2018 in Spain. The data were sourced from reliable repositories and encompass records of solar energy production across various regions of the country. To ensure data integrity and reliability, a rigorous preprocessing phase was undertaken. This entailed data cleaning to address missing values and outliers, data transformation to handle datetime formats, and data consistency checks. The Python programming language was instrumental in this phase, facilitating data manipulation and validation.
3.2. Training and Testing Data
To ensure robust model training and evaluation, we implemented a chronological split of the data to simulate real-world forecasting scenarios. The dataset was partitioned, allocating 80% for the training stage, where the machine learning model learned patterns from historical data. The remaining 20% was reserved for the testing stage. The training set encompasses data from the years 2015 to 2017, allowing the model to learn from historical patterns and trends. Subsequently, the testing set comprises data from the year 2018, representing unseen future data for the model to predict. This approach ensures a rigorous evaluation of the model’s generalization capabilities to predict solar energy generation beyond the training period.
3.3. Exploratory Data Analysis (EDA)
The initial insights into the temporal and spatial dynamics of solar generation were unearthed through an extensive EDA. Descriptive statistics, time series decomposition, and visualization techniques such as line plots, box plots, and heatmaps were employed. The EDA phase provided valuable context by revealing diurnal patterns, seasonal variations, and geographic disparities in solar generation. Python’s data visualization libraries, including Matplotlib and Seaborn, played a pivotal role in visualizing and interpreting these patterns.
3.4. Time Series Modeling with XGBoost
Central to our research is the application of the XGBoost algorithm, a state-of-the-art gradient boosting framework renowned for its exceptional predictive power. Leveraging Python’s XGBoost library, we capitalize on the algorithm’s capabilities to unveil the intricate dynamics of solar generation. Employing a supervised learning paradigm, we treat solar generation as our target variable, while the meticulously engineered features serve as predictors. XGBoost is an open-access package or library that efficiently implements the gradient boosting approach, which is based on a greedy function approximation of the gradient [49]. This technique involves iteratively finetuning several weak forecasting models sequentially, where each model of which builds on the findings obtained by the prior model, ultimately generating a better model in the end.
The XGBoost gradient algorithm, a powerful ensemble learning technique, plays a pivotal role in predicting solar energy production in this research. The algorithm’s effectiveness lies in its ability to deal with complex, non-linear connections in the data, making it ideal for capturing the dynamic patterns of solar generation. Specifically, XGBoost leverages a collection of decision trees that work collaboratively to refine predictions. Each tree examines different aspects of the data, enabling the model to capture nuanced patterns and dependencies. The algorithm also incorporates regularization techniques, which prevent overfitting by penalizing overly complex models. This balance between model complexity and predictive accuracy is essential in solar generation forecasting, as it ensures that the model generalizes well to unseen data. Furthermore, XGBoost provides feature importance rankings, indicating the significance of different input features, helping to identify the key drivers of solar output. Its ability to handle missing data and optimization for parallel processing further enhances its utility in the context of this research. In summary, XGBoost’s comprehensive capabilities make it a robust tool for accurately predicting solar energy production and understanding the factors influencing it.
The journey to model development commences with the rigorous training of our XGBoost model on the designated training dataset. Here, Python’s Scikit-Learn interface to XGBoost proves indispensable, enabling seamless integration into our workflow. To maximize the model’s predictive prowess, we embark on hyperparameter tuning—a meticulous process fine-tuning the model’s settings. This optimization endeavor is conducted with utmost care to ensure that our model extracts every nugget of insight latent in the data.
As we delve into the inner workings of our model, we place a premium on interpretability. This interpretability not only enriches our understanding but also informs decision-makers and stakeholders about the key drivers of solar energy production.
Our choice of the XGBoost algorithm stems from its robustness, adaptability to time series data, and proven track record in predictive modeling. It equips us with the means to distil complex temporal patterns and seasonality in solar generation, culminating in a model that not only forecasts but also elucidates the intricate interplay of variables within the renewable energy landscape.
3.5. Model Evaluation and Validation
The effectiveness of our XGBoost model is subjected to meticulous scrutiny through a comprehensive evaluation process, ensuring the reliability of our findings. Recognizing the unique characteristics of time series data, we employ four evaluation metrics that are tailor-made for the domain of time series forecasting: MAPE, RMSE, MAE, and R2 [50,51,52] are used in this study.
- 1.
- Root mean squared error (RMSE) stands as a sentinel of predictive accuracy, gauging the extent of discrepancies between predicted and observed values. A low RMSE value signifies a model that closely tracks the actual solar generation, while higher values reveal areas for improvement. The formula for RMSE is as follows:
- 2.
- Mean absolute error (MAE) provides insights into the average magnitude of errors between predictions and actual data points. It complements RMSE by offering a more intuitive understanding of forecasting accuracy. The formula for MAE is as follows:
- 3.
- R-squared (R2) often regarded as the coefficient of determination; it unveils the proportion of variance in the target variable captured by our model. A value of 1.00 signifies a perfect fit, while values closer to 0 indicate diminishing predictive power. The formula for the R2 score is as follows:
- 4.
- Mean absolute percentage error (MAPE) allows us to assess the relative magnitude of errors as a percentage of the actual solar generation values. This metric is particularly valuable in understanding the proportional accuracy of our predictions. The formula for MAPE is as follows:where n is the total amount of measurements, yi is the actual value for the data point, yp is the projection made by the model forecast, and e represent the amount of residual.
To fortify the robustness of our model and ensure its adaptability across varying temporal segments, we conduct rigorous cross-validation. This iterative process assesses our model’s performance on distinct subsets of the data, enhancing its ability to generalize beyond the training dataset. Cross-validation provides an essential layer of validation, bolstering the reliability of our forecasts.
By leveraging this comprehensive suite of evaluation metrics and cross-validation techniques, we construct a well-vetted model capable of not only capturing temporal patterns but also providing a clear and quantifiable assessment of its predictive accuracy. These validation measures fortify the foundations of our research, instilling confidence in our results and conclusions.
3.6. Temporal Analysis
The research further encompasses temporal and spatial analyses of solar generation patterns. Temporal analysis focuses on diurnal, weekly, and seasonal patterns, daily fluctuations, and seasonality effects. Python’s libraries for data analysis, such as Pandas and NumPy, were instrumental in performing these analyses.
4. Results and Discussion
4.1. Temporal Patterns of Solar Generation
The analysis of hourly solar generation data from 2015 to 2018 in Spain has unveiled distinct temporal patterns that shed light on the dynamics of solar energy production. As expected, diurnal variations in solar generation are prominent, with peak generation consistently occurring during daylight hours and a notable decline at night. Figure 1 illustrates displays the hourly solar generation patterns for four selected days in the year 2017. Each day is represented by a distinct line with a different color, and the x-axis shows the hours of the day in a 24-h format (e.g., “00:00” to “23:00”). Furthermore, the examination of the data reveals pronounced seasonality, with solar generation consistently higher during sunnier months and experiencing a dip during the winter period. These patterns underscore the strong influence of solar irradiance on generation, offering valuable insights into the inherent predictability of solar energy production.
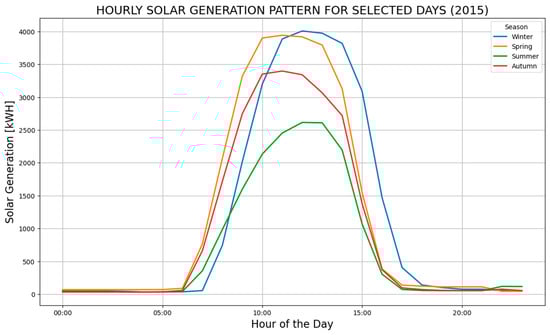
Figure 1.
Hourly solar generation comparison for selected days in 2015.
Figure 2 is a heatmap that illustrates the hourly solar generation patterns for a specific week in 2018, from 1 August to 7 August. Each row in the heatmap represents a date, and each column represents an hour of the day. The color intensity in the heatmap cells indicates the level of solar generation during that hour, with brighter colors representing higher solar generation. The figure below shows the description of the fluctuation in solar energy generation across the given time period in a selected week. Figure 2 shows that the solar energy generation peaks on 7 August 2018, while its lowest points were recorded on 3 August 2018. This information gives important context for understanding the daily variations in solar energy output.
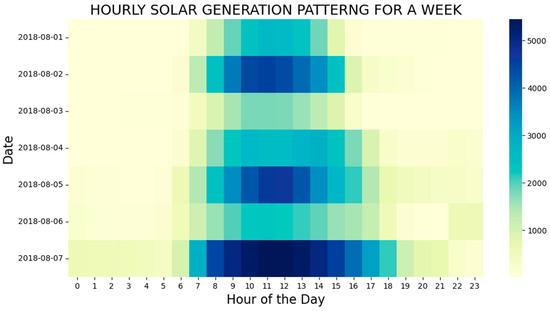
Figure 2.
Hourly solar output variations for a week in August 2018.
The graph in Figure 3 illustrates the amount of solar energy generation in 2015–2017 for each of the four seasons: spring, summer, fall, and winter. Each season is presented as a different bar, and each year is distinguished by a distinct color. The figure provides a clear visual comparison of how solar generation varies across seasons in the specified years.
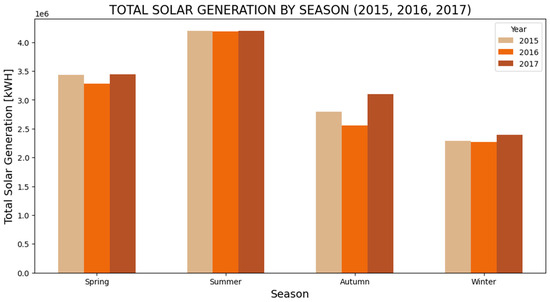
Figure 3.
Solar generation patterns across seasons in three consecutive years.
The box plots in Figure 4 provide a comprehensive view of solar generation behavior, highlighting monthly variations. Each box plot within the figure represents a specific year, enabling a detailed analysis of how solar power generation levels fluctuate across the seasons and months. The figure presents a visual comparison of how variety in solar generation enhances the understanding of annual solar generation patterns from month to month across the years 2015–2018.
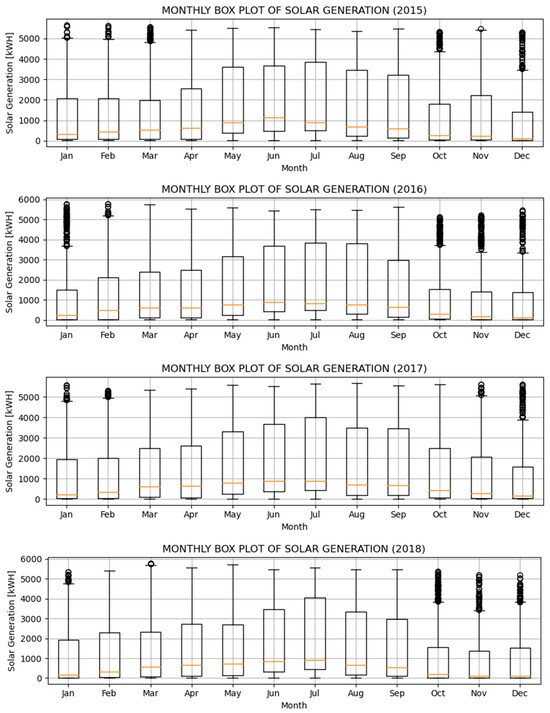
Figure 4.
Monthly solar generation patterns for 2015–2018.
Figure 5 displays the total solar power generation over different time intervals. The first subplot presents the daily total solar generation, the second shows the weekly total solar generation, and the last line graph shows the monthly total solar generation. The x-axis in each line graph represents time (date), while the y-axis represents the corresponding total solar power generation values. The figure provides a clear and concise visual line graph of the fluctuations of solar generation on a daily, weekly, and monthly basis.
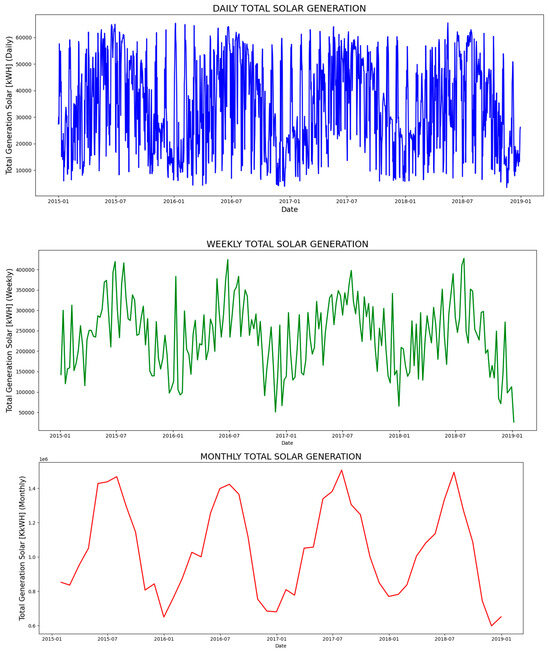
Figure 5.
Solar generation trends over different time intervals.
4.2. XGBoost Modeling and Forecasting
The research employed the XGBoost algorithm, a robust gradient boosting machine learning technique, to model and predict solar generation patterns. Figure 6 provides a visual comparison between the actual and projected values of a machine learning model for solar generation on a weekly basis. The x-axis represents the weeks over the data’s time period, and the y-axis indicates the values of the solar generation. Two lines are depicted in the plot, one representing the actual solar generation (marked with circles) and the other representing the predicted values (marked with crosses). This figure enables a direct assessment of how well the model aligns with the actual solar generation trends on a weekly scale, offering insights into the model’s accuracy in capturing weekly variations.
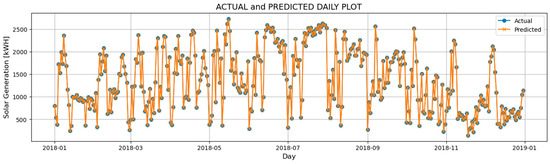
Figure 6.
Actual and predicted result.
The model fitting process demonstrated its remarkable capacity to capture the intricate temporal dependencies inherent in the dataset. Notably, the model excelled in predicting solar generation trends with a high degree of accuracy, as evidenced by its evaluation metrics. Specifically, the model achieved a root mean squared error (RMSE) of 11.042, a mean absolute error (MAE) of 5.86, a perfect R-squared (R²) value of 0.999, and an impressively low mean absolute percentage error (MAPE) of 0.0463. These metrics collectively underscore the model’s ability to closely align with observed historical data, making it a powerful tool for solar generation forecasting.
Figure 7 presents a graphical representation of the machine learning model’s performance metrics, serving as a crucial visual aid for evaluating its effectiveness. The bar chart elegantly portrays four essential metrics: root mean squared error (RMSE), mean absolute error (MAE), R-squared (R²), and mean absolute percentage error (MAPE). The inclusion of numerical values alongside the graphical elements offers precise measurements of the model’s accuracy and its efficiency in forecasting solar generation patterns. This figure provides a valuable means of assessing and comparing the model’s performance across various evaluation criteria, enhancing the comprehensibility and interpretability of the research results.
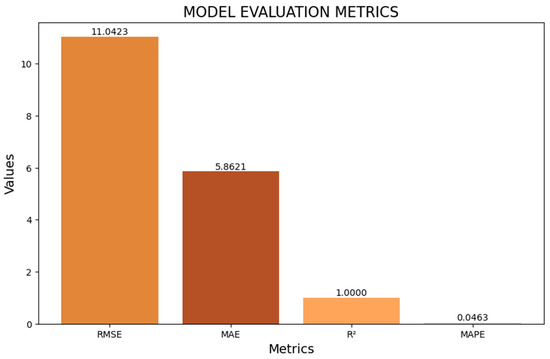
Figure 7.
Comparative model evaluation metrics for solar generation prediction.
4.3. Learning Curves
The model’s performance was further examined through learning curve analysis, providing a valuable depiction of its behavior. Learning curves serve as a visual representation of the model’s training and validation performance relative to the number of data points used for training, aiding in the identification of potential overfitting or underfitting tendencies.
Figure 8 illustrates the learning curve for the machine learning model employed in solar generation prediction. This visualization reveals changes in the model’s root mean squared error (RMSE) on both the training and validation datasets as a function of the number of training examples. The x-axis corresponds to the count of training examples, while the y-axis showcases the corresponding RMSE values. The red curve represents the training RMSE, and the green curve pertains to the validation RMSE. As the number of training examples increases, the training RMSE diminishes, indicating a progressively improved fit to the training data. Simultaneously, the validation RMSE initially decreases but eventually stabilizes, signifying the point at which additional training examples provide marginal enhancements. This figure proves instrumental in comprehending how the model’s accuracy evolves concerning varying training set sizes, serving as a critical tool for model assessment and optimization. Subsequent observations from the learning curve analysis reassure that the model exhibits robust generalization performance.
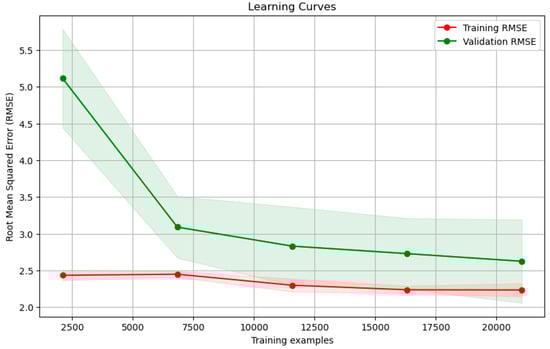
Figure 8.
Model learning curves: training vs. validation RMSE.
The learning curves unveil the convergence of training and validation scores, highlighting that as the model encounters more data, its performance on both the training and validation sets reaches a state of stability. The limited divergence between the two curves underscores the model’s capability to refrain from overfitting the training data and to make accurate predictions on unseen data. These insights align seamlessly with the earlier discussion of evaluation metrics, further underlining the model’s ability to capture intricate solar generation patterns.
5. Conclusions
In the ever-evolving landscape of renewable energy, our research has delved into the temporal patterns of solar generation in Spain from 2015 to 2018. By focusing on solar generation patterns independently of weather data, we have highlighted the inherent predictability and self-reliance of solar energy within the electrical power system. The study revealed diurnal variations with peak generation during daylight hours and seasonal trends characterized by higher output in sunnier months, offering opportunities for efficient grid management.
At the core of our investigation, the XGBoost algorithm played a pivotal role, enabling us to capture and forecast solar generation trends with unparalleled precision. The journey involved meticulous model development, enriching our understanding of the factors influencing solar generation and providing a robust predictive tool. Our research’s implications extend to the incorporation of solar energy into the electrical power system, facilitating optimized grid operations, efficient energy storage, and informed demand management strategies. By aligning peak solar generation with high-demand periods, we can enhance grid reliability and reduce reliance on fossil-fuel-based peaking plants. As we conclude this exploration of solar generation, it is vital to acknowledge that our research primarily focuses on historical patterns.
The future of solar energy holds boundless potential, shaped by technological advancements, evolving policies, and unforeseen events. Our findings serve as a solid foundation, guiding stakeholders, policymakers, and grid operators in navigating the evolving energy landscape. In summary, this research underscores the enduring promise of solar energy as a reliable and sustainable contributor to the electrical power system. We discovered patterns that indicate the path toward a cleaner and more environmentally friendly energy future by looking into the temporal dimensions of solar generation. As we stand at the nexus of renewable energy expansion, these insights empower us to make informed decisions and shape a world where solar energy’s full potential is harnessed to illuminate our path forward.
Author Contributions
Conceptualization, P.P.; methodology, C.S. and P.P.; software, C.S.; validation, C.S.; formal analysis, P.P.; investigation, C.S.; resources, C.S.; data curation, C.S. and P.P.; writing—original draft preparation, C.S. and P.P.; writing—review and editing, P.P.; visualization, C.S.; supervision, P.P.; project administration, P.P.; funding acquisition, P.P. All authors have read and agreed to the published version of the manuscript.
Funding
This research received no external funding.
Data Availability Statement
Data are contained within the article.
Conflicts of Interest
The authors declare no conflict of interest.
References
- Dhabi, A.; Irena. Renewable Energy Statistics. 2020. Available online: http://www.evwind.es/2020/06/05/renewable-energycosts-plummet-according-toirena/75021 (accessed on 3 September 2023).
- Nassar, N.T.; Wilburn, D.R.; Goonan, T.G. Byproduct metal requirements for U.S. Wind and solar photovoltaic electricity generation up to the year 2040 under various clean power plan scenarios. Appl. Energy 2016, 183, 1209–1226. [Google Scholar] [CrossRef]
- Vita, V.; Fotis, G.; Pavlatos, C.; Mladenov, V. A New Restoration Strategy in Microgrids after a Blackout with Priority in Critical Loads. Sustainability 2023, 15, 1974. [Google Scholar] [CrossRef]
- Soto, E.A.; Bosman, L.B.; Wollega, E.; Leon-Salas, W.D. Analysis of Grid Disturbances Caused by Massive Integration of Utility Level Solar Power Systems. Eng 2022, 3, 236–253. [Google Scholar] [CrossRef]
- ElNozahy, M.S.; Salama, M.M.A. Technical impacts of grid-connected photovoltaic systems on electrical networks—A review. J. Renew. Sustain. Energy 2013, 5, 032702. [Google Scholar] [CrossRef]
- Buwei, W.; Jianfeng, C.; Bo, W.; Shuanglei, F. A Solar Power Prediction Using Support Vector Machines Based on Multi-Source Data Fusion. In Proceedings of the 2018 International Conference on Power System Technology (POWERCON), Guangzhou, China, 6–8 November 2018; pp. 4573–4577. [Google Scholar]
- Paska, J.; Surma, T.; Terlikowski, P.; Zagrajek, K. Electricity Generation from Renewable Energy Sources in Poland as a Part of Commitment to the Polish and EU Energy Policy. Energies 2020, 13, 4261. [Google Scholar] [CrossRef]
- Yin, L.; Cao, X.; Liu, D. Weighted fully connected regression networks for one-day-ahead hourly photovoltaic power forecasting. Appl. Energy 2023, 332, 120527. [Google Scholar] [CrossRef]
- Alaraj, M.; Kumar, A.; Alsaidan, I.; Rizwan, M.; Jamil, M. Energy Production Forecasting from Solar Photovoltaic Plants Based on Meteorological Parameters for Qassim Region, Saudi Arabia. IEEE Access 2021, 9, 83241–83251. [Google Scholar] [CrossRef]
- Khatib, T.; Mohamed, A.; Mahmoud, M.M.; Sopian, K. Modeling of Daily Solar Energy on a Horizontal Surface for Five Main Sites in Malaysia. Int. J. Green Energy 2011, 8, 795–819. [Google Scholar] [CrossRef]
- Andrade, C.H.T.d.; Melo, G.C.G.d.; Vieira, T.F.; Araújo, Í.B.Q.d.; Medeiros Martins, A.d.; Torres, I.C.; Brito, D.B.; Santos, A.K.X. How Does Neural Network Model Capacity Affect Photovoltaic Power Prediction? A Study Case. Sensors 2023, 23, 1357. [Google Scholar] [CrossRef]
- Khademi, M.; Moadel, M.; Khosravi, A. Power Prediction and Technoeconomic Analysis of a Solar PV Power Plant by MLP-ABC and COMFAR III, considering Cloudy Weather Conditions. Int. J. Chem. Eng. 2016, 2016, 1031943. [Google Scholar] [CrossRef]
- Li, G.; Wei, X.; Yang, H. Decomposition integration and error correction method for photovoltaic power forecasting. Measurement 2023, 208, 112462. [Google Scholar] [CrossRef]
- Trabelsi, M.; Massaoudi, M.; Chihi, I.; Sidhom, L.; Refaat, S.S.; Huang, T.; Oueslati, F.S. An Effective Hybrid Symbolic Regression–Deep Multilayer Perceptron Technique for PV Power Forecasting. Energies 2022, 15, 9008. [Google Scholar] [CrossRef]
- Icel, Y.; Mamis, M.S.; Bugutekin, A.; Gursoy, M.I. Photovoltaic Panel Efficiency Estimation with Artificial Neural Networks: Samples of Adiyaman, Malatya and Sanliurfa. Int. J. Photoenergy 2019, 2019, 6289021. [Google Scholar] [CrossRef]
- Khilar, R.; Suba, G.M.; Kumar, T.S.; Samson Isaac, J.; Shinde, S.K.; Ramya, S.; Prabhu, V.; Erko, K.G. Improving the Efficiency of Photovoltaic Panels Using Machine Learning Approach. Int. J. Photoenergy 2022, 2022, 4921153. [Google Scholar] [CrossRef]
- Zhu, T.; Guo, Y.; Li, Z.; Wang, C. Solar Radiation Prediction Based on Convolution Neural Network and Long Short-Term Memory. Energies 2021, 14, 8498. [Google Scholar] [CrossRef]
- Cabezón, L.; Ruiz, L.G.B.; Criado-Ramón, D.; Gago, E.J.; Pegalajar, M.C. Photovoltaic Energy Production Forecasting through Machine Learning Methods: A Scottish Solar Farm Case Study. Energies 2022, 15, 8732. [Google Scholar] [CrossRef]
- Son, J.; Park, Y.; Lee, J.; Kim, H. Sensorless PV Power Forecasting in Grid-Connected Buildings through Deep Learning. Sensors 2018, 18, 2529. [Google Scholar] [CrossRef]
- Fadare, D. Modellingof solar energy potential in Nigeria using an artificial neural network model. Appl. Energy 2009, 86, 1410–1422. [Google Scholar] [CrossRef]
- Dellino, G.; Laudadio, T.; Mari, R.; Mastronardi, N.; Meloni, C.; Vergura, S. Energy production forecasting in a PV plant using transfer function models. In Proceedings of the 2015 IEEE 15th International Conference on Environment and Electrical Engineering (EEEIC), Rome, Italy, 10–13 June 2015; pp. 1379–1383. [Google Scholar]
- Nia, M.; Chegaar, M.; Benatallah, M.F.; Aillerie, M. Contribution to the quantification of solar radiation in Algeria. Energy Procedia 2013, 36, 730–737. [Google Scholar] [CrossRef]
- Li, H.; Ma, W.; Wang, X.; Lian, Y. Estimating monthly average daily diffuse solar radiation with multiple predictors: A case study. Renew. Energy 2011, 36, 1944–1948. [Google Scholar] [CrossRef]
- Şen, Z. Simple nonlinear solar irradiation estimation model. Renew. Energy 2007, 32, 342–350. [Google Scholar] [CrossRef]
- Şen, Z. Angström equation parameter estimation by unrestricted method. Sol. Energy 2001, 71, 95–107. [Google Scholar] [CrossRef]
- Mellit, A.; Benghanem, M.; Bendekhis, M. Artificial neural network model for prediction solar radiation data: Application for sizing stand-alone photovoltaic power system. In Proceedings of the 2005 IEEE Power Engineering Society General Meeting, San Francisco, CA, USA, 12–16 June 2005; Volume 1, pp. 40–44. [Google Scholar]
- Amrouche, B.; Le Pivert, X. Artificial neural network based daily local forecasting for global solar radiation. Appl. Energy 2014, 130, 333–341. [Google Scholar] [CrossRef]
- Chugh, A.; Chaudhary, P.; Rizwan, M. Fuzzy logic approach for short term solar energy forecasting. In Proceedings of the 12th IEEE International Conference Electronics, Energy, Environment, Communication, Computer, Control: (E3-C3) INDICON, Piscataway, NJ, USA, 17–20 December 2015. [Google Scholar]
- Monís, J.I.; López-Luque, R.; Reca, J.; Martínez, J. Multistage Bounded Evolutionary Algorithm to Optimize the Design of Sustainable Photovoltaic (PV) Pumping Irrigation Systems with Storage. Sustainability 2020, 12, 1026. [Google Scholar] [CrossRef]
- Lateko, A.A.H.; Yang, H.-T.; Huang, C.-M.; Aprillia, H.; Hsu, C.-Y.; Zhong, J.-L.; Phuong, N.H. Stacking Ensemble Method with the RNN Meta-Learner for Short-Term PV Power Forecasting. Energies 2021, 14, 4733. [Google Scholar] [CrossRef]
- Erduman, A. A smart short-term solar power output prediction by artificial neural network. Electr. Eng. 2020, 102, 1441–1449. [Google Scholar] [CrossRef]
- Bhatti, A.R.; Bilal Awan, A.; Alharbi, W.; Salam, Z.; Bin Humayd, A.S.; Praveen, R.P.; Bhattacharya, K. An Improved Approach to Enhance Training Performance of ANN and the Prediction of PV Power for Any Time-Span without the Presence of Real-Time Weather Data. Sustainability 2021, 13, 11893. [Google Scholar] [CrossRef]
- Meng, M.; Song, C. Daily Photovoltaic Power Generation Forecasting Model Based on Random Forest Algorithm for North China in Winter. Sustainability 2020, 12, 2247. [Google Scholar] [CrossRef]
- Zazoum, B. Solar photovoltaic power prediction using different machine learning methods. Energy Rep. 2022, 8, 19–25. [Google Scholar] [CrossRef]
- Elsaraiti, M.; Merabet, A. Solar Power Forecasting Using Deep Learning Techniques. IEEE Access 2022, 10, 31692–31698. [Google Scholar] [CrossRef]
- Obiora, C.N.; Hasan, A.N.; Ali, A.; Alajarmeh, N. Forecasting Hourly Solar Radiation Using Artificial Intelligence Techniques. IEEE Can. J. Electr. Comput. Eng. 2021, 44, 497–508. [Google Scholar] [CrossRef]
- Akhter, M.N.; Mekhilef, S.; Mokhlis, H.; Almohaimeed, Z.M.; Muhammad, M.A.; Khairuddin, A.S.M.; Akram, R.; Hussain, M.M. An Hour-Ahead PV Power Forecasting Method Based on an RNN-LSTM Model for Three Different PV Plants. Energies 2022, 15, 2243. [Google Scholar] [CrossRef]
- Kalogirou, S.A. Artificial neural networks in renewable energy systems applications: A review. Renew. Sustain. Energy Rev. 2001, 5, 373–401. [Google Scholar] [CrossRef]
- Elsaraiti, M.; Merabet, A. A comparative analysis of the ARIMA and LSTM predictive models and their effectiveness for predicting wind speed. Energies 2021, 14, 6782. [Google Scholar] [CrossRef]
- Young, S.R.; Rose, D.C.; Karnowski, T.P.; Lim, S.-H.; Patton, R.M. Optimizing deep learning hyper-parameters through an evolutionary algorithm. In Proceedings of the Workshop on Machine Learning in High-Performance Computing Environments, Austin, TX, USA, 15 November 2015; pp. 1–5. [Google Scholar]
- Raza, M.Q.; Khosravi, A. A review on artificial intelligence-based load demand forecasting techniques for smart grid and buildings. Renew. Sustain. Energy Rev. 2015, 50, 1352–1372. [Google Scholar] [CrossRef]
- Kalogirou, S.A. Solar thermal power systems. In Solar Energy Engineering; Academic Press: New York, NY, USA, 2009; pp. 521–552. [Google Scholar]
- Azadeh, A.; Babazadeh, R.; Asadzadeh, S.M. Optimum estimation and forecasting of renewable energy consumption by artificial neural networks. Renew. Sustain. Energy Rev. 2013, 27, 605–612. [Google Scholar] [CrossRef]
- Rabehi, A.; Guermoui, M.; Lalmi, D. Hybrid models for global solar radiation prediction: A case study. Int. J. Ambient Energy 2020, 41, 31–40. [Google Scholar] [CrossRef]
- Xiaoyun, Q.; Xiaoning, K.; Chao, Z.; Shuai, J.; Xiuda, M. Shortterm prediction of wind power based on deep long short-term memory. In Proceedings of the 2016 IEEE PES Asia-Pacific Power and Energy Engineering Conference (APPEEC), Xi’an, China, 25–28 October 2016; pp. 1148–1152. [Google Scholar]
- Olabi, A.G.; Abdelkareem, M.A.; Semeraro, C.; Radi, M.A.; Rezk, H.; Muhaisen, O.; Al-Isawi, O.A.; Sayed, E.T. Artificial neural networks applications in partially shaded PV systems. Therm. Sci. Eng. Prog. 2023, 37, 101612. [Google Scholar] [CrossRef]
- Das, U.K.; Tey, K.S.; Seyedmahmoudian, M.; Mekhilef, S.; Idris, M.Y.I.; Van Deventer, W.; Horan, B.; Stojcevski, A. Forecasting of photovoltaic power generation and model optimization: A review. Renew. Sustain. Energy Rev. 2018, 81, 912–928. [Google Scholar] [CrossRef]
- Zhong, J.; Liu, L.; Sun, Q.; Wang, X. Prediction of Photovoltaic Power Generation Based on General Regression and Back Propagation Neural Network. Energy Procedia 2018, 152, 1224–1229. [Google Scholar] [CrossRef]
- Yucong, W.; Bo, W. Research on ea-xgboost hybrid model for building energy prediction. J. Phys. Conf. Ser. 2020, 1518, 012082. [Google Scholar] [CrossRef]
- Manikanta, C.; Mamatha Jadav, V. Evaluation of modified PLS regression method to fill the missing values in training dataset. In Proceedings of the 2015 International Conference on Smart Sensors and Systems (IC-SSS), Bangalore, India, 21–23 December 2015. [Google Scholar]
- Chai, T.; Draxler, R.R. Root mean square error (rmse) or mean absolute error (mae)? Arguments against avoiding rmse in the literature. Geosci. Model Dev. 2014, 7, 1247–1250. [Google Scholar] [CrossRef]
- Di Bucchianico, A. Coefficient of Determination (r2). In Encyclopedia of Statistics in Quality and Reliability; Wiley: Hoboken, NJ, USA, 2007. [Google Scholar]
Disclaimer/Publisher’s Note: The statements, opinions and data contained in all publications are solely those of the individual author(s) and contributor(s) and not of MDPI and/or the editor(s). MDPI and/or the editor(s) disclaim responsibility for any injury to people or property resulting from any ideas, methods, instructions or products referred to in the content. |
© 2023 by the authors. Licensee MDPI, Basel, Switzerland. This article is an open access article distributed under the terms and conditions of the Creative Commons Attribution (CC BY) license (https://creativecommons.org/licenses/by/4.0/).