Article

A New Multi-Scale Method to Evaluate the Porosity and MICP Curve for Digital Rock of Complex Reservoir

1
School of Earth Sciences, Yangtze University, Jingzhou 434023, China
2
Shenzhen Branch, CNOOC Co., Ltd., Shenzhen 518000, China
3
Zhanjiang Branch, CNOOC Co., Ltd., Zhanjiang 524057, China
4
College of Geophysics and Information Technology, China University of Geosciences, Beijing 100190, China
5
Shenzhen Branch, China Oilfield Services Limited, Shenzhen 518071, China
6
ICORE GROUP INC., Shenzhen 518057, China
7
Research Institute of Tsinghua University in Shenzhen, Shenzhen 518071, China
*
Author to whom correspondence should be addressed.
Energies 2023, 16(22), 7613; https://doi.org/10.3390/en16227613
Submission received: 8 October 2023 / Revised: 1 November 2023 / Accepted: 14 November 2023 / Published: 16 November 2023

Abstract

:
The evaluation of rock porosity and the mercury injection capillary pressure (MICP) curve is fundamental for oil and gas exploration and production. Digital rock (DR) technology, incorporating 3D micro-CT imaging and numerical methods, has been widely employed to predict these properties. However, analyzing the pore structure of heterogeneous rocks, such as fractured rocks or glutenite, solely through single-scale DR analysis poses challenges. Existing upscaling methods have limitations in fully representing the complete range of pore structures at different scales, with limited comparison to experimental data. To address this, we propose a novel method that upscales porosity and simulates the MICP curve from nano-scale to core scale by merging results from micro-CT (at resolutions of 35 μm and 2 μm) and SEM (at resolutions of 6.5 nm and 65 nm). We validate the developed DR model by applying it to sandstones, glutenite, and igneous rocks, and achieve excellent agreement between the experimental data and the multi-scale DR model across 67 samples. The results demonstrate that the multi-scale model effectively captures the porosity and pore structures across the entire range. In contrast, the single digital rock (DR) model underestimates the porosity measurements for both homogeneous sandstones and heterogeneous cores. While the MICP model based on a single DR proves suitable for homogeneous rock samples, it introduces noticeable discrepancies when applied to heterogeneous rock samples. The developed multi-scale method significantly enhances the confidence in using DR to assess the pore structure of complex rocks.

1. Introduction

The characterization of porosity and pore throat distribution is crucial for reservoir classification and reserve evaluation [1,2,3,4]. Various techniques have been developed to assess the pore structure, including qualitative and quantitative methods [5,6,7,8,9,10]. Techniques such as casting thin section and scanning electron microscopy (SEM) have been used for qualitative analysis of pore throat size and structure, while high-pressure mercury intrusion porosimetry (MICP) and nuclear magnetic resonance (NMR) have been used for quantitative analysis. However, traditional methods for the characterization of porosity and pore throat distribution have certain limitations, including destructive nature, lack of spatial resolution, sampling bias, and limited resolution range [11,12].
With advances in micro-CT technology and numerical methods, digital rock (DR) analysis based on 3D images has become an important tool for predicting petrophysical properties of rock [13,14,15,16,17,18,19]. Compared to traditional laboratory experiments, micro-CT combined with numerical simulations can provide quicker and cost-effective results [20,21,22,23]. However, traditional single-scale DR analysis is limited in its ability to capture the unresolved nano-sized pores, as well as the centimeter-sized intergranular pores, which limits its accuracy in assessing pore structure in heterogeneous reservoirs [24]. There are several studies on the effect of unresolved pores and how to predict petrophysical properties through upscaling methods. Inadequate digital rock upscaling can result in substantial consequences in field applications. For example, it can lead to the inaccurate depiction of pore structures, directly affecting subsequent tasks such as reserve evaluation and reservoir simulation. Additionally, improper prediction of physical properties, which is essential for evaluating reservoir quality and optimizing strategies for oil recovery, can also be influenced by poor digital rock upscaling [25,26,27,28,29,30,31].
To overcome the trade-off, one strategy is to combine imaging data from different sources. For instance, the integration of 3D micro-CT images at the micron scale and 2D scanning electron microscopy (SEM) images at the nano-scale can be employed. Traditionally, stochastic methods that rely on spatial statistical information, such as two-point correlation functions and multiple-point statistics, have been used to tackle this challenging problem. Okabe and Blunt [32] reconstructed the 3D pore space structure by integrating micro-CT images (capturing large pores) with statistically simulated high-resolution images from 2D thin sections (offering finer-scale features). Mohebi et al. [33] proposed a statistical approach to fuse low-resolution measurements with a high-resolution prior model, aiming to improve the overall resolution of the reconstructed images. Furthermore, Tahmasebi et al. [34] introduced a multi-scale and multi-resolution reconstruction method for generating 3D models of shales based on 2D images. However, these methods can be computationally expensive, and the generated results may not always capture the full range of possible pore structures at the core scale [35,36,37,38,39].
Existing upscaling methods exhibit limitations in adequately depicting the full spectrum of pore structures at various scales, while also having limited comparison with experimental data. These challenges hinder the effective utilization of digital rock techniques for assessing the intricate pore structure of complex rock formations. In this study, we used a multi-scale approach to evaluate porosity and the simulated MICP curve using two different micro-CT resolutions (35 μm and 2 μm) and two SEM resolutions (65 nm and 6.5 nm) to generate the DR model. Sixty-seven cores including sandstone, glutenite, and igneous rock from the eastern South China Sea were used, and the results obtained from the DR analysis were compared against laboratory measurements. We analyzed the differences between the two and corrected the simulated MICP curve obtained from the DR analysis to be consistent with laboratory results for practical application. This multi-scale approach provides a more accurate and comprehensive assessment of the pore structure of heterogeneous reservoirs.

2. Methods

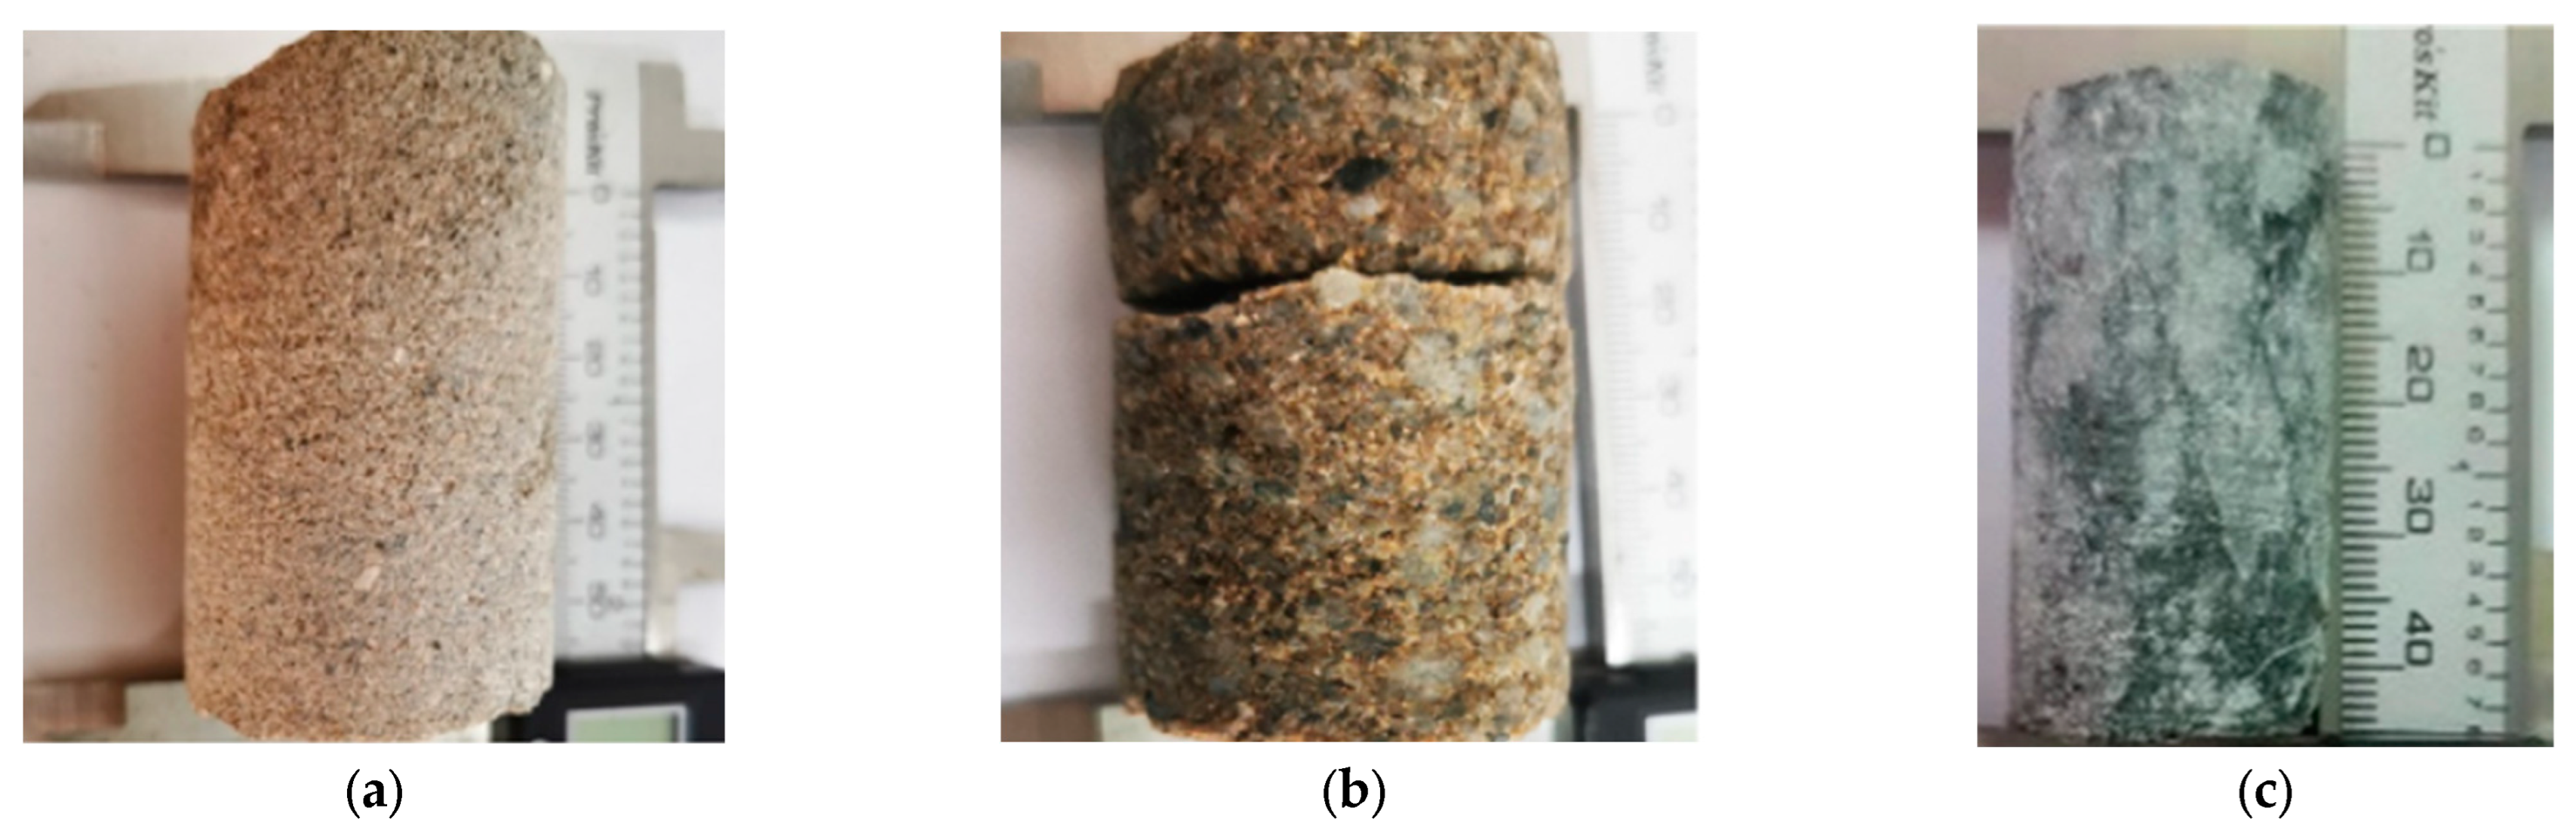
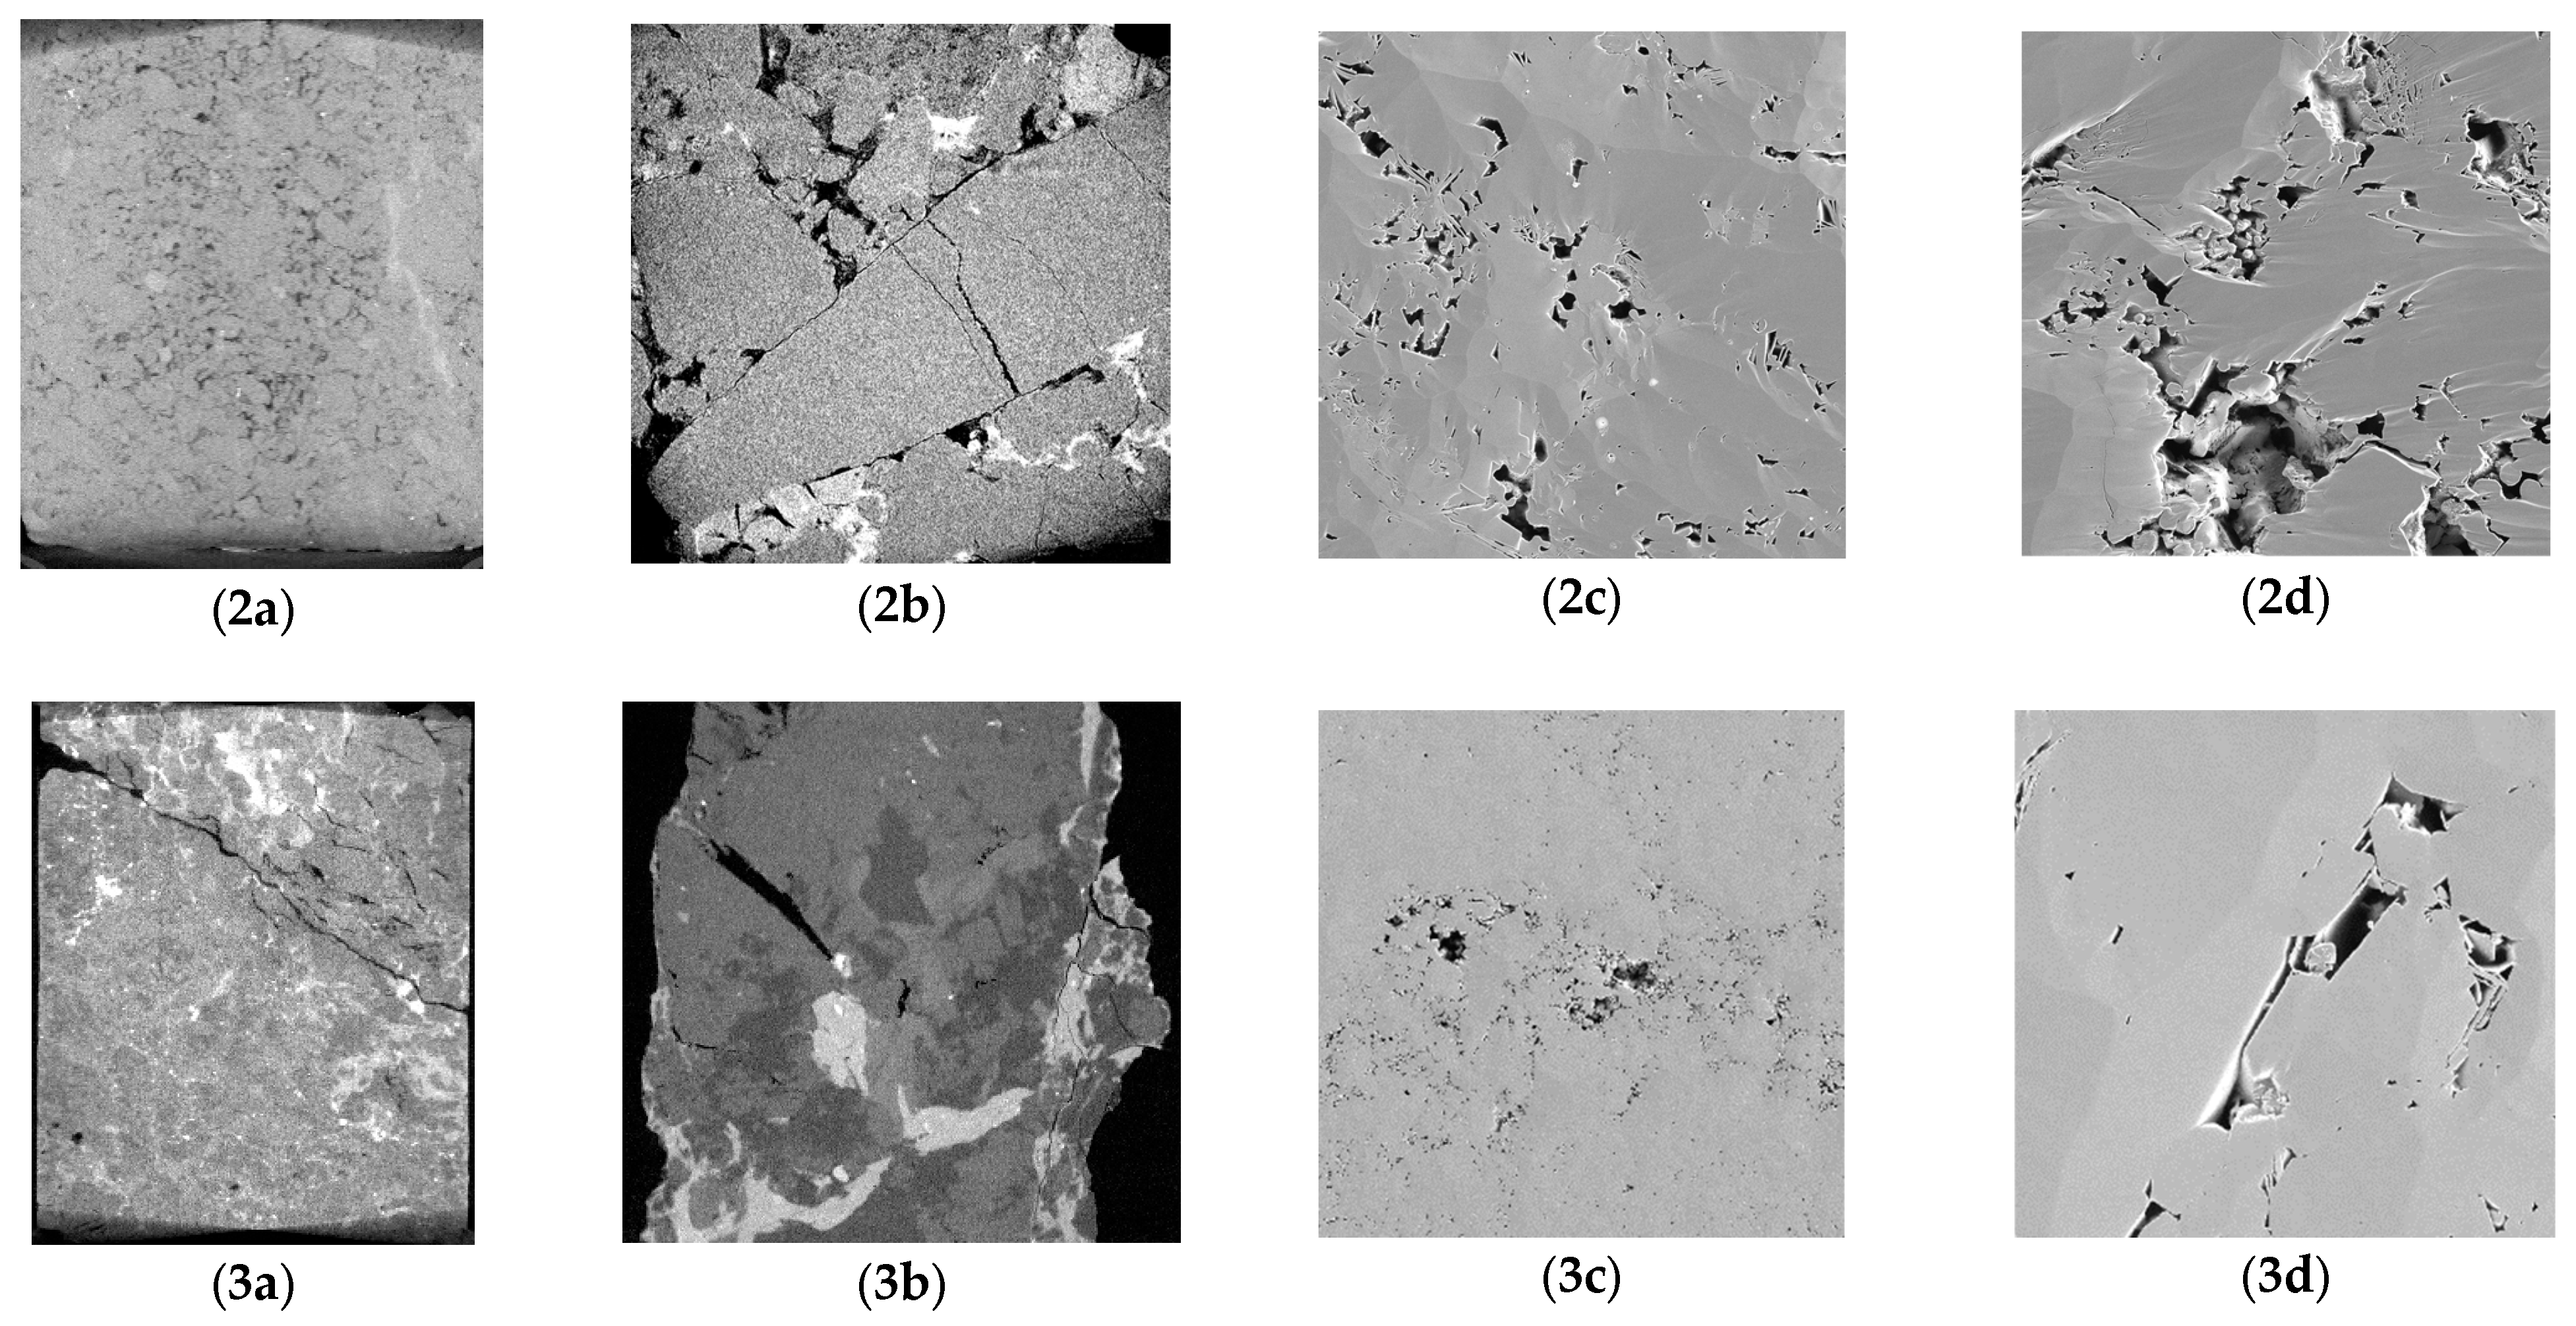
2.1. Image Acquisition Procedures

The procedure for evaluating the porosity and MICP curve at the multi-scale is as follows: (1) Real 3D geometric structures are generated by micro-CT scanning for the core plug, with a resolution of 35 μm. (2) Micro-samples with a size of 2~3 mm are drilled from the core plug and scanned by micro-CT with a resolution of 2 μm. (3) The micro-samples are then scanned by SEM at two different magnifications (500× and 5000×), corresponding to the resolution of 65 nm and 6.5 nm, respectively. (4) The porosity and the pore throat distribution are calculated at each scale and then are combined and upscaled to the core plug scale. (5) The laboratory measurements for porosity and high-pressure mercury injection are performed to compare with the DR method. (6) The differences are analyzed, and then the corrected DR model for porosity and simulated MICP curve is obtained.
In order to better understand the pore structure characteristics of the core plugs, the traditional single-scale DR is not sufficient to capture the nano-pores due to the resolution of 1~3 μm, as well as the large intergranular pores due to the physical size of 1~3 mm. Thus, scanning of the whole core plug at a resolution of 35 μm is conducted first to capture the intergranular pores, and then three micro-samples are drilled from the core plug and scanned by micro-CT with a resolution of 2 μm. In order to capture the pores smaller than 2 μm, SEM is used to describe the porosity and the pore structure characteristics at a finer scale. The sample size is 5 mm × 5 mm, and two magnifications, 500× and 5000×, are selected at three different locations, respectively, in order to capture the heterogeneity. The SEM results are then used as a supplement to the micro-CT results.
Micro-computed tomography (CT) refers to a non-destructive imaging technique that allows researchers to obtain high-resolution 3D images of objects. The micro-CT instrument used in this study is nanoVoxel-3502E, manufactured by QingNengSanYing in Tianjin, China, one of the leading manufacturers of micro-CT systems in China. The micro-CT system is equipped with a high-resolution detector and a high-precision X-ray tube that allows it to achieve high-quality imaging of objects. Its advanced data acquisition system enables the acquisition of images at a high speed with high spatial resolution, making it ideal for studying the micro-structure of objects. The view field of the equipment is a 1920 × 1920 × 1920 grid, and the scanner is equipped with a micro-focus ray source up to 300 KV. The micro-CT instrument consists of a radiation source, a sample table, and a signal receiver. The signal attenuated by the tested sample after the radiation source emits X-rays is received by the receiver to obtain the projected image of the sample. Images are taken from different angles, and reconstruction is carried out to obtain the 3D structures, with a resolution up to 0.5 μm.
The TESCAN MIRA3 XMH (TESCAN, Brno, Czech Republic) is a latest generation scanning electron microscope (SEM) designed for high-performance imaging and analysis of various types of samples, which is used in this study to obtain the porosity and pore distribution at the nano-scale.

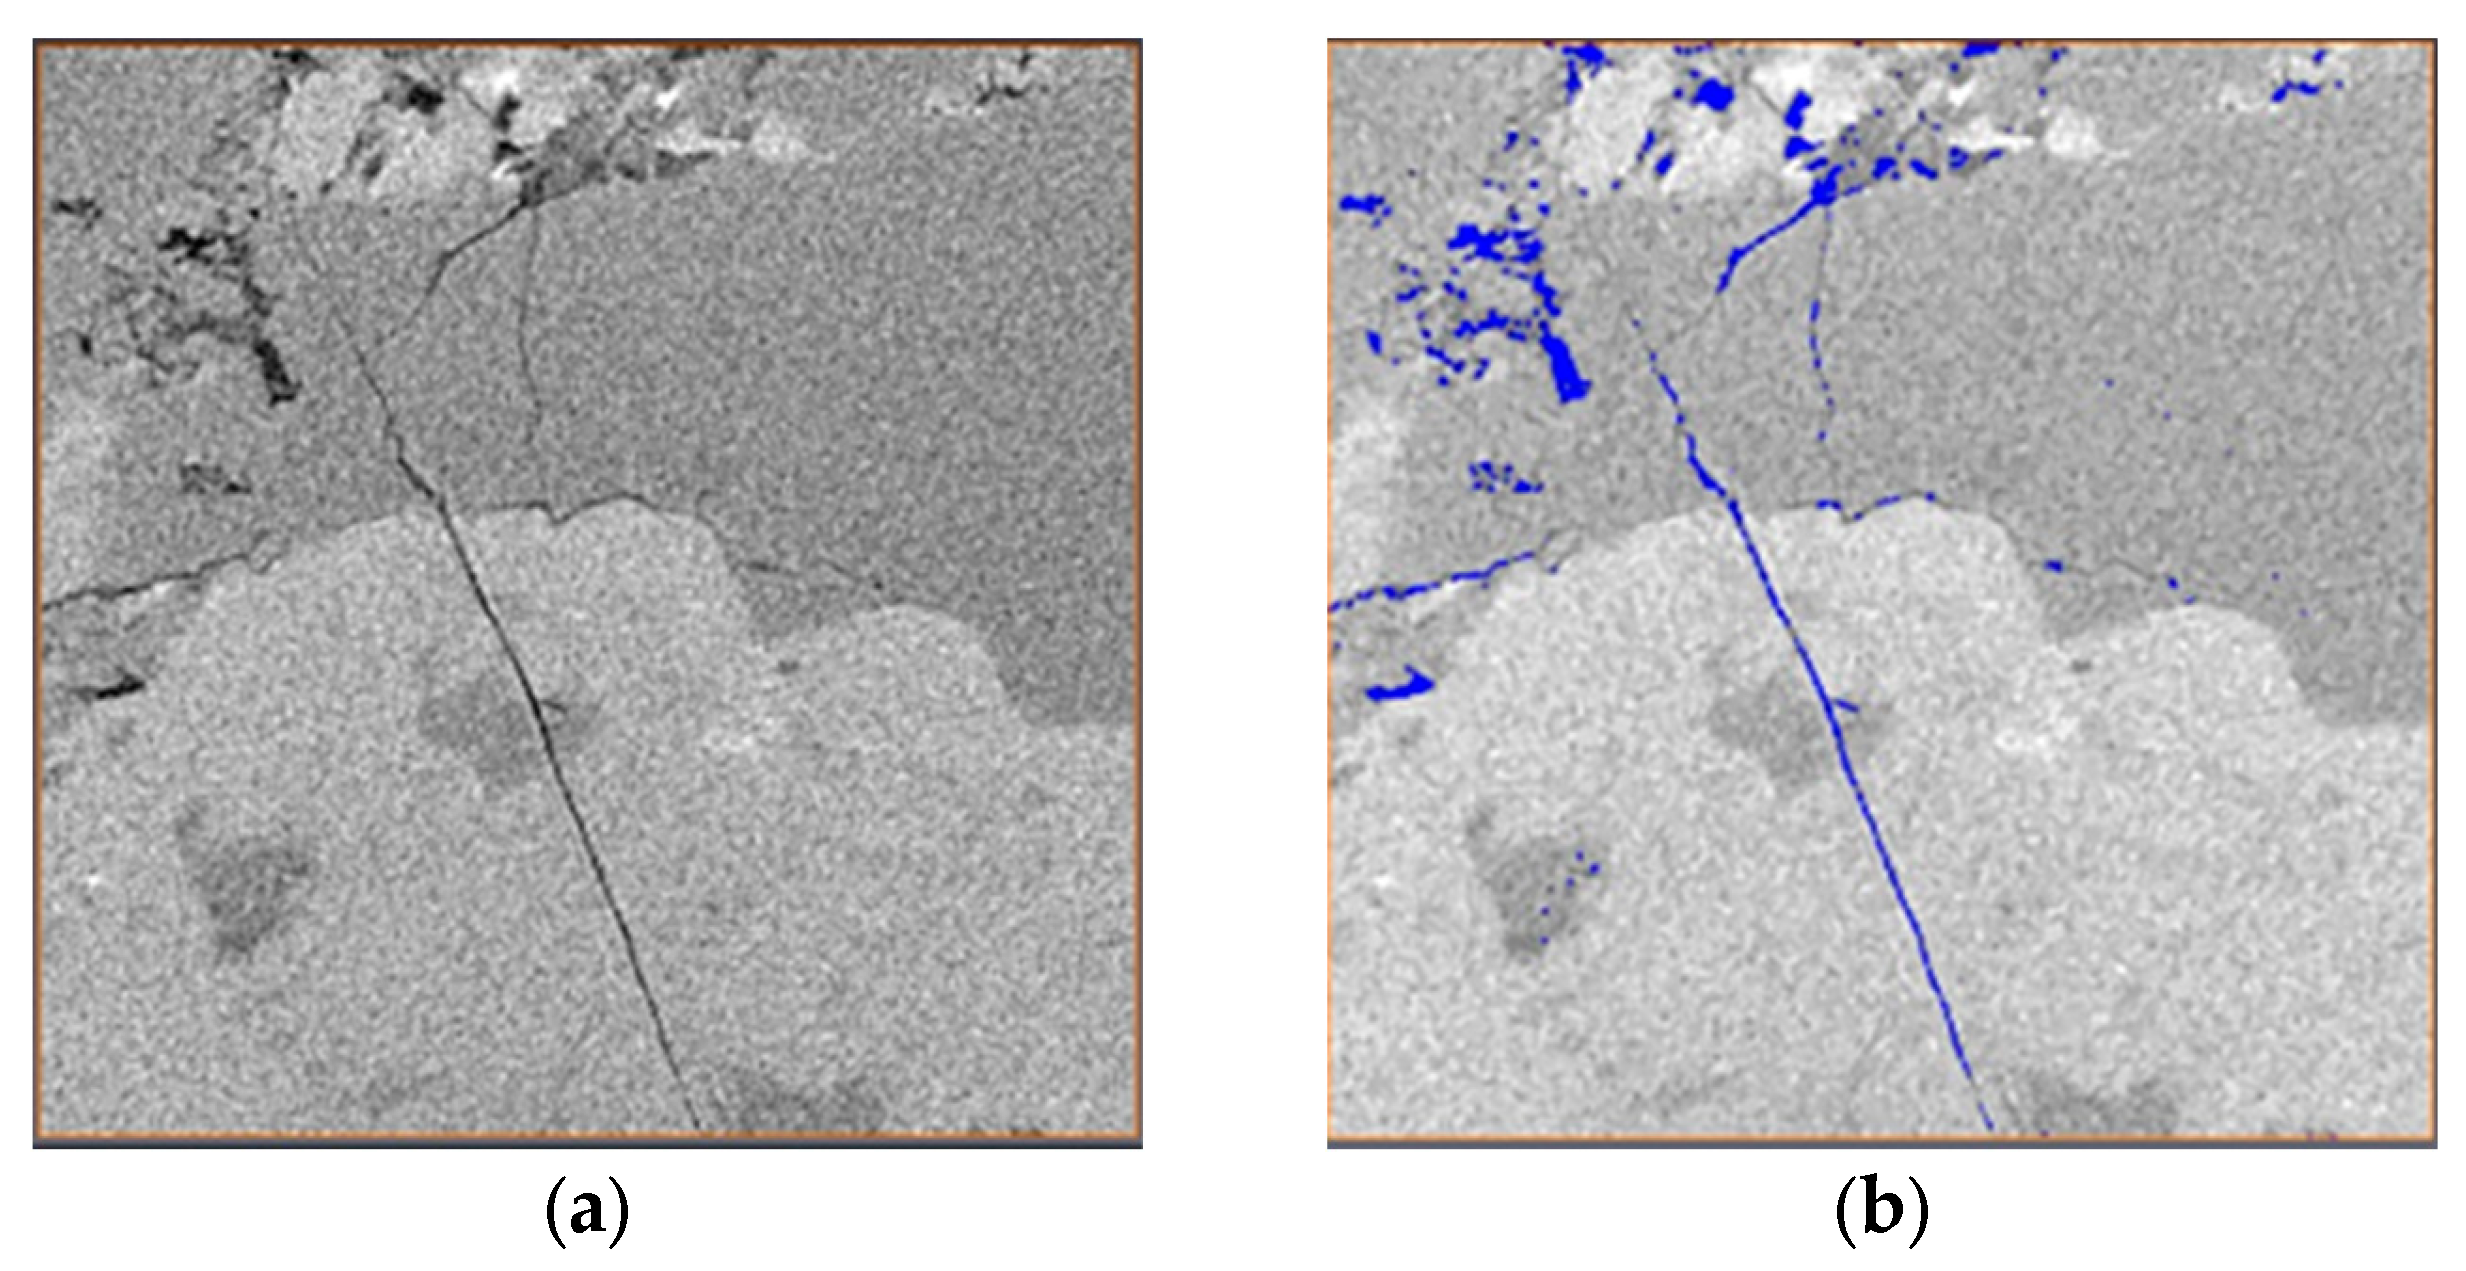
2.2. Image Segmentation Method

X-ray CT scanning technology uses a synchrotron to generate high-energy X-rays, and different components have different absorption of X-rays. The gray value of each pixel on the CT image is represented by the CT number, which is related to the linear attenuation coefficient of the corresponding minerals [40,41]. Image-processing methods are performed, including three-dimensional reconstruction, image denoising, and intelligent image segmentation, and a series of petrophysical properties are then calculated based on the segmented 3D model.
In this study, we use Weka for two-phase image segmentation. Weka is a highly beneficial tool when it comes to two-phase image segmentation, as it significantly reduces the need for human intervention. By leveraging its powerful algorithms and machine-learning capabilities, Weka automates the process of dividing images into two distinct phases, eliminating the manual effort required for this task. This automation not only saves time and resources but also enhances accuracy and consistency in image segmentation, making Weka an invaluable asset in various image analysis applications [42,43]. The Weka procedure for image segmentation involves preparing image data, extracting relevant features, generating labeled training data, training the segmentation model, evaluating the model’s performance, performing image segmentation on new images, and post-processing the segmented images. This automated process uses machine-learning algorithms to accurately segment images and provides consistent results with reduced manual intervention. For example, the 2D gray image of the core obtained by CT scanning is shown in Figure 1a, where gray represents rock matrix and dark areas represent pores. The CT image segmented by the machine-learning algorithm is shown in Figure 1b, where the pores are represented by blue. The machine-learning algorithm is also used for two-phase SEM segmentations to obtain the corresponding porosity.

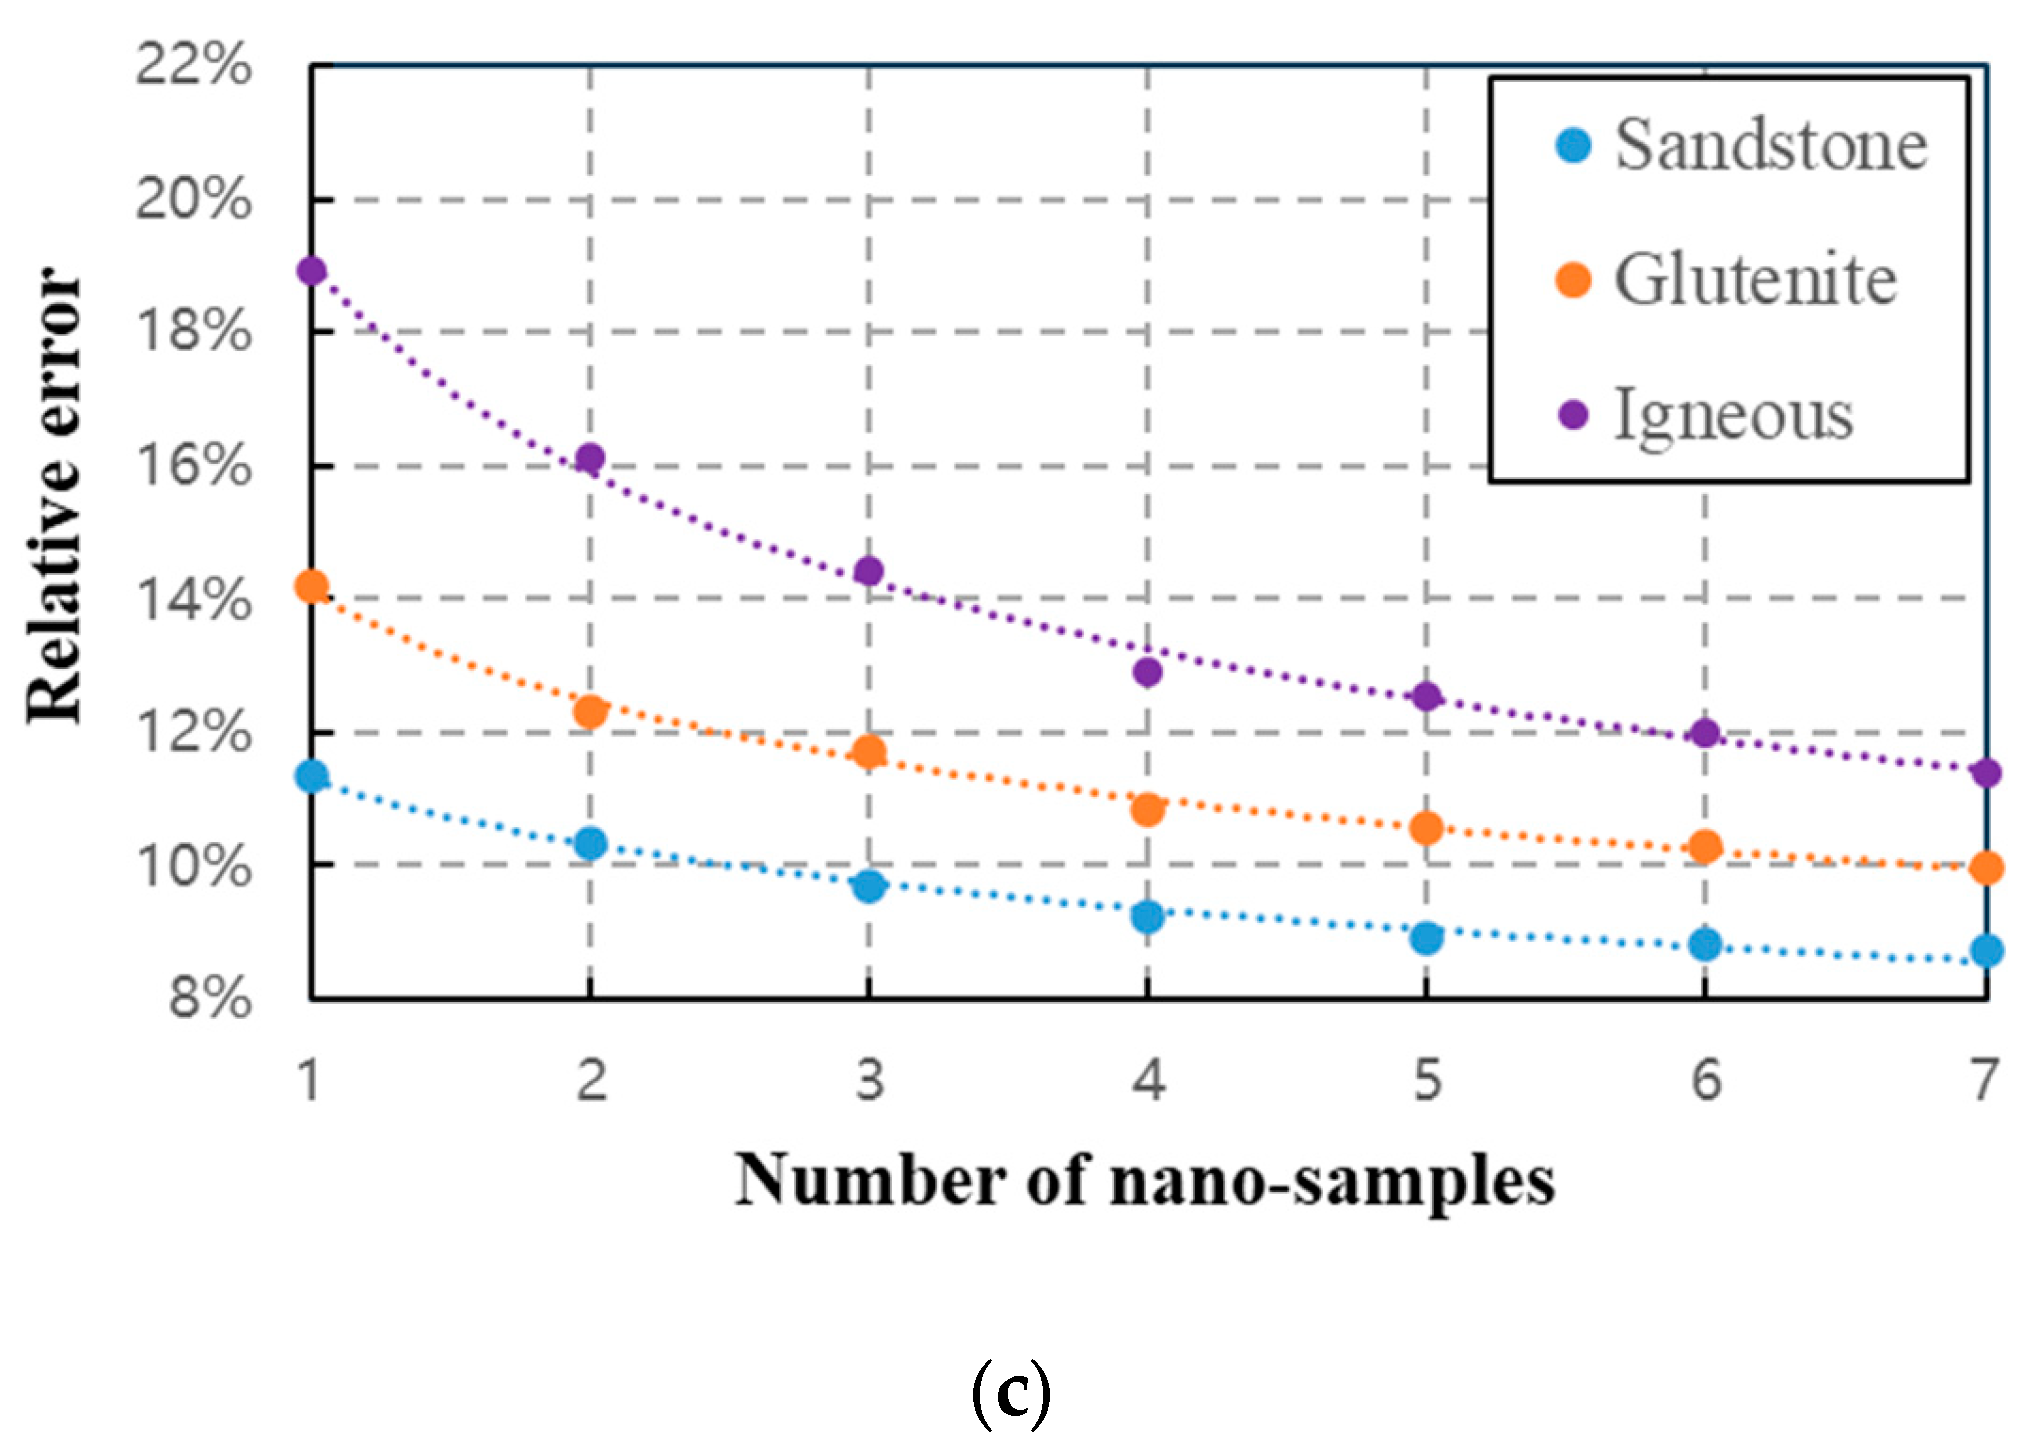
2.3. Calculation of the Porosity at Multi-Scale

Due to the limitation of the resolution and its physical size, it is difficult to capture the pore information of the core plug using the traditional single-scale DR analysis, so a new upscale method is established to capture the unresolved pores by integrating the porosity at four scales with resolutions of 6.5 nm, 65 nm using SEM, and 2 μm and 35 μm using micro-CT, respectively. We first scan the whole core with a diameter of 1 inch and a length of 2 inches, using micro-CT at a resolution of 35 μm in order to capture its entire information. After that, representative sub-samples with a physical size of 2~3 mm are taken from the core for further analysis using micro-CT at a resolution of 2 μm. Subsequently, micro-samples with a size of 0.13~0.15 mm and nano-samples with a size of 13~15 μm from the sub-samples are taken for SEM analysis at 65 nm and 6.5 nm, respectively. At each scale, we obtain the porosity by summation of the pore pixels through the segmentation and assume the rock pixels contain the unresolved porosity which can be obtained from the finer-scale analysis. We can then obtain the total core porosity by combining the four scales:
φ n a n o = φ 65 nm + 1 φ 65 nm × φ 6.5 nm φ m i c r o = φ 2 μm + 1 φ 2 μm × φ n a n o φ t o t a l = φ 35 μm + 1 φ 35 μm × φ m i c r o
where φnano is defined as the nano-porosity where the pore size is below 2 μm, by summation of the porosity for SEM at 65 nm and 6.5 nm resolutions, φmicro is defined as the micro-porosity where the pore size is below 35 μm, by summation of the porosity for SEM and micro-CT with 2 μm resolution, and φtotal is defined as the total DR porosity for the core plug. To prevent the redundancy of pore volume calculations, for each scale, if the pore size is larger than the resolution of the coarser scale, the pore volume will then be subtracted in the calculations. In other words, only when the pore size is less than or equal to the resolution of the coarser scale will it be considered and contribute to the overall pore volume calculation. This approach avoids multiple calculations of the same pore, and we then update Equation (1) to:
φ n a n o = f 2 μm φ 65 nm + 1 φ 65 nm × φ 6.5 nm φ m i c r o = f 35 μm φ 2 μm + 1 φ 2 μm × φ n a n o φ t o t a l = φ 35 μm + 1 φ 35 μm × φ m i c r o
where f2μm is the ratio of the pore volume greater than 2 μm to the total pore volume at the resolution of 65 nm, and f35μm is the ratio of the pore volume greater than 35 μm to the total pore volume at the resolution of 2 μm.
We performed a study aimed at evaluating the influence of the representative elemental volume (REV) on porosity. The objective was to determine the appropriate number of sub-samples, micro-samples, and nano-samples to obtain a comprehensive representation of pore information during micro-CT and SEM analysis of a core sample. Figure 2 depicts a comparative analysis between the porosity values obtained using varying numbers of samples at each scale and the experimental porosity. The relative error quantifies the average deviation for the respective formations (consisting of 29 glutenite, 33 sandstone, and 5 igneous rocks).
Our findings indicate that increasing the number of samples for each corresponding scale leads to a decrease in relative error. This can be attributed to the REV effect, which ensures a more accurate representation of the overall pore characteristics. In the case of homogeneous cores like sandstone, the impact of the number of samples is relatively small across all scales. However, for glutenite cores, the number of sub-samples has a significant influence due to the heterogeneity at the pore scale. Similarly, for igneous cores, the numbers of both micro-samples and nano-samples play a significant role due to the heterogeneity at the nano-scale.
Based on our study, we selected three REV samples for each corresponding scale, ensuring that the relative error remains below 15%.

2.4. Calculation of the Pore Structure and the Simulated MICP Curve

After obtaining 2D and 3D rock images, the pore morphology model is used to extract the pore network topology and pore throat distribution for CT and SEM images [37]. The pore morphology model is advantageous for extracting pore network topology and pore throat distribution from CT and SEM images due to its ability to accurately represent complex pore structures, handle various types of pores, and provide quantitative analysis of pore throats. It is computationally efficient, enabling analysis of large image datasets, and aligns with the non-destructive nature of CT and SEM imaging techniques. More complete descriptions of the basic concepts and techniques can be found elsewhere [44,45,46]. The model is established by two steps: Building a maximal inscribed sphere list and assembling the spheres into chains. In the first step, each void point is taken as the starting point and the center of an expanding sphere, where the sphere grows until it touches a rock or a boundary point, becoming an inscribed sphere. Then, the list of all the inscribed spheres is sorted in descending order of their radii. For each of the inscribed spheres, one locally searches for smaller or equal-sized inscribed spheres overlapped with it, namely, its neighbors, and removes them completely, including ones from the list. The remaining spheres consist of the maximal inscribed sphere list. In the second step, an auxiliary index pair (node, rank) is built for each maximal inscribed sphere. The maximal inscribed sphere list in descending order of their radii is traversed again to find all the chains between neighboring maximal inscribed spheres. Hence, traverse process is able to assemble all maximal inscribed spheres into different chains, with end node spheres as pores and middle spheres as throats. Finally, according to the morphological information of the original pore space, the pores and throats are simplified as spherical and pipe objects. After the division of pore throats, parameters such as pore size distribution, average pore throat ratio, and average pore radius can be obtained by calculating the link length and inscribed sphere radius.
The relationship between the capillary pressure of reservoir rocks and the saturation of the wetting phase is called the MICP curve [47]. After the pore distribution is obtained using the pore morphology model at various scales, the simulated MICP curve can then be derived using the Young–Laplace equation:
p c = 2 σ c o s θ r c
where pc is the capillary pressure, σ is the surface tension, θ is the wetting contact angle, and rc is the pore radius. σ = 0.48 N/m and θ = 140° are obtained from the laboratory under ambient conditions:
p c = 0.735 r c
Then, the MICP curve can be obtained as follows:
1.
Pore size distribution: Based on the segmented pore spaces for micro-CT and SEM images, the frequencies or percentages of pores at different size ranges present in the rock sample can be combined together.
2.
Pore radius assignment: Each identified pore is assigned a specific radius to provide the necessary input for Equation (4).
3.
Young–Laplace equation: Equation (4) is then employed to relate the capillary pressure (ΔP) to the radius of curvature (R).
4.
Capillary pressure calculation: Using the assigned pore radii and Equation (4), the capillary pressure for each pore is calculated to quantify the pressure difference for mercury injection.
5.
Mercury saturation determination: The calculated capillary pressure values are then used to determine the corresponding mercury saturation to represent the ratio of the mercury-filled pore volume to the total pore volume.

2.5. Laboratory Measurement of the Porosity and MICP Curve

A comprehensive laboratory measurement is conducted for determining the porosity of core plugs using the water saturation technique. This technique is widely employed in the fields of rock physics and lithology analysis. The 67 plugs used in this experiment are cylindrical, with a diameter of 1 inch and a length of 2 inches. To ensure accuracy and repeatability, a detailed description of the experimental procedure is as follows:
1.
Core selection and preparation: Representative core plugs are chosen from extracted rock samples, ensuring removal of impurities and uneven sections.
2.
Sample drying: Selected core plugs are placed in a temperature-controlled oven at 60 °C until a constant weight is achieved.
3.
Core size measurement: Digital calipers are used to accurately measure the diameter and length of the plugs, with the results recorded.
4.
Core saturation: Dry plugs are placed in a sealed container and saturated with deionized water to remove any residual air or gas.
5.
Mass measurement in saturated state: The saturated plugs are removed and accurately weighed to determine their mass, with the results recorded.
6.
Porosity calculation: The percentage of porosity is calculated based on the dry and saturated masses of the plugs.
By following the aforementioned experimental procedure and maintaining strict control over laboratory conditions, the porosity of core plugs can be accurately measured, providing reliable data for comparison to the DR porosity at the core scale.
The laboratory measurement of the mercury injection capillary pressure (MICP) curve is conducted to characterize the pore structure. The core plugs used in the experiment were cylindrical in shape with a diameter of 1 inch and a length of 2 inches as well. Prior to the measurements, the core plugs were cleaned thoroughly using a series of organic solvents to remove any contaminants that could potentially interfere with the measurements. The experiment was performed under ambient temperature and pressure conditions to mimic the subsurface reservoir conditions. The core plugs were placed in a high-pressure vessel, and mercury intrusion was performed using a state-of-the-art MICP apparatus, which allows precise control of the pressure and monitoring of the intrusion of mercury into the rock’s pore space. The MICP curve was obtained by measuring the pressure at which mercury intruded into the sample versus the volume of mercury that intruded. The entire process was conducted meticulously to ensure accurate and reliable results. The data obtained from the MICP measurements were further analyzed to quantify the pore size distribution using Equation (4).

3. Results and Discussion

3.1. Evaluation of the Porosity at Multi-Scale

Sixty-seven core plugs with a diameter of 1 inch and a length of 2 inches were used to validate the multi-scale DR method, including sandstone (quartz sandstone and feldspathic sandstone), glutenite, and igneous rock from the eastern South China Sea. The depositional environment in this region is primarily influenced by various factors including sea level changes, sediment supply, tectonic activity, and paleoclimate conditions. Extensive research has revealed that the reservoirs in the South China Sea consist of a variety of lithologies such as sandstone, mudstone, glutenite, and igneous rocks. The reservoirs in the South China Sea are commonly associated with clastic sedimentation, indicating a predominantly terrestrial input of sediments. However, the influence of marine processes, such as currents and waves, is also evident in certain areas. Depositional environments vary across the region, ranging from fluvial-deltaic systems near river mouths to deepwater turbidite systems in the basin floor. These variations in depositional environments contribute to the heterogeneity of the reservoirs, affecting their petrophysical properties and hydrocarbon distribution. Figure 3 shows the photos of the samples for the representative core plugs of sandstone, glutenite, and igneous rocks, respectively.
The experimental porosity is measured and compared with the DR porosity at the same size. Figure 4 shows the CT and SEM images for sandstone, glutenite, and igneous rocks at four scales, respectively.
Figure 5a shows the comparison between the laboratory porosity and traditional DR porosity at a resolution of 2 μm ( φ m i c r o , the third column in Table 1), for three different reservoir rocks, sandstone, glutenite, and igneous. The red line represents where the DR porosity is equal to the experimental porosity, and the black dashed line represents a margin of error of ±2% in porosity. We can clearly observe that the traditional single-scale DR estimates the porosity lower than the laboratory, especially for glutenite. This is because the unresolved pores with a resolution less than 2 μm cannot be captured, and the physical dimensions of the samples are only 1.6 mm × 1.6 mm × 1.6 mm (800 × 800 × 800 voxels) which fails to capture the large pores greater than 1.6 mm. The φtotal calculated by the multi-scale method agrees well with the experimental result with an R2 of 0.92 as shown in Figure 5b, which verifies the reliability of the upscale method ( φ t o t a l , the fourth column in Table 1). Table 1 summarizes the porosity from the laboratory experiments and the multi-scale DR. There are very few instances where the measured porosity deviates significantly from the experimental values. This is primarily due to the fact that the REV does not accurately represent sub-samples, micro-samples, and nano-samples. To capture the heterogeneity of the REV, additional samples are required.

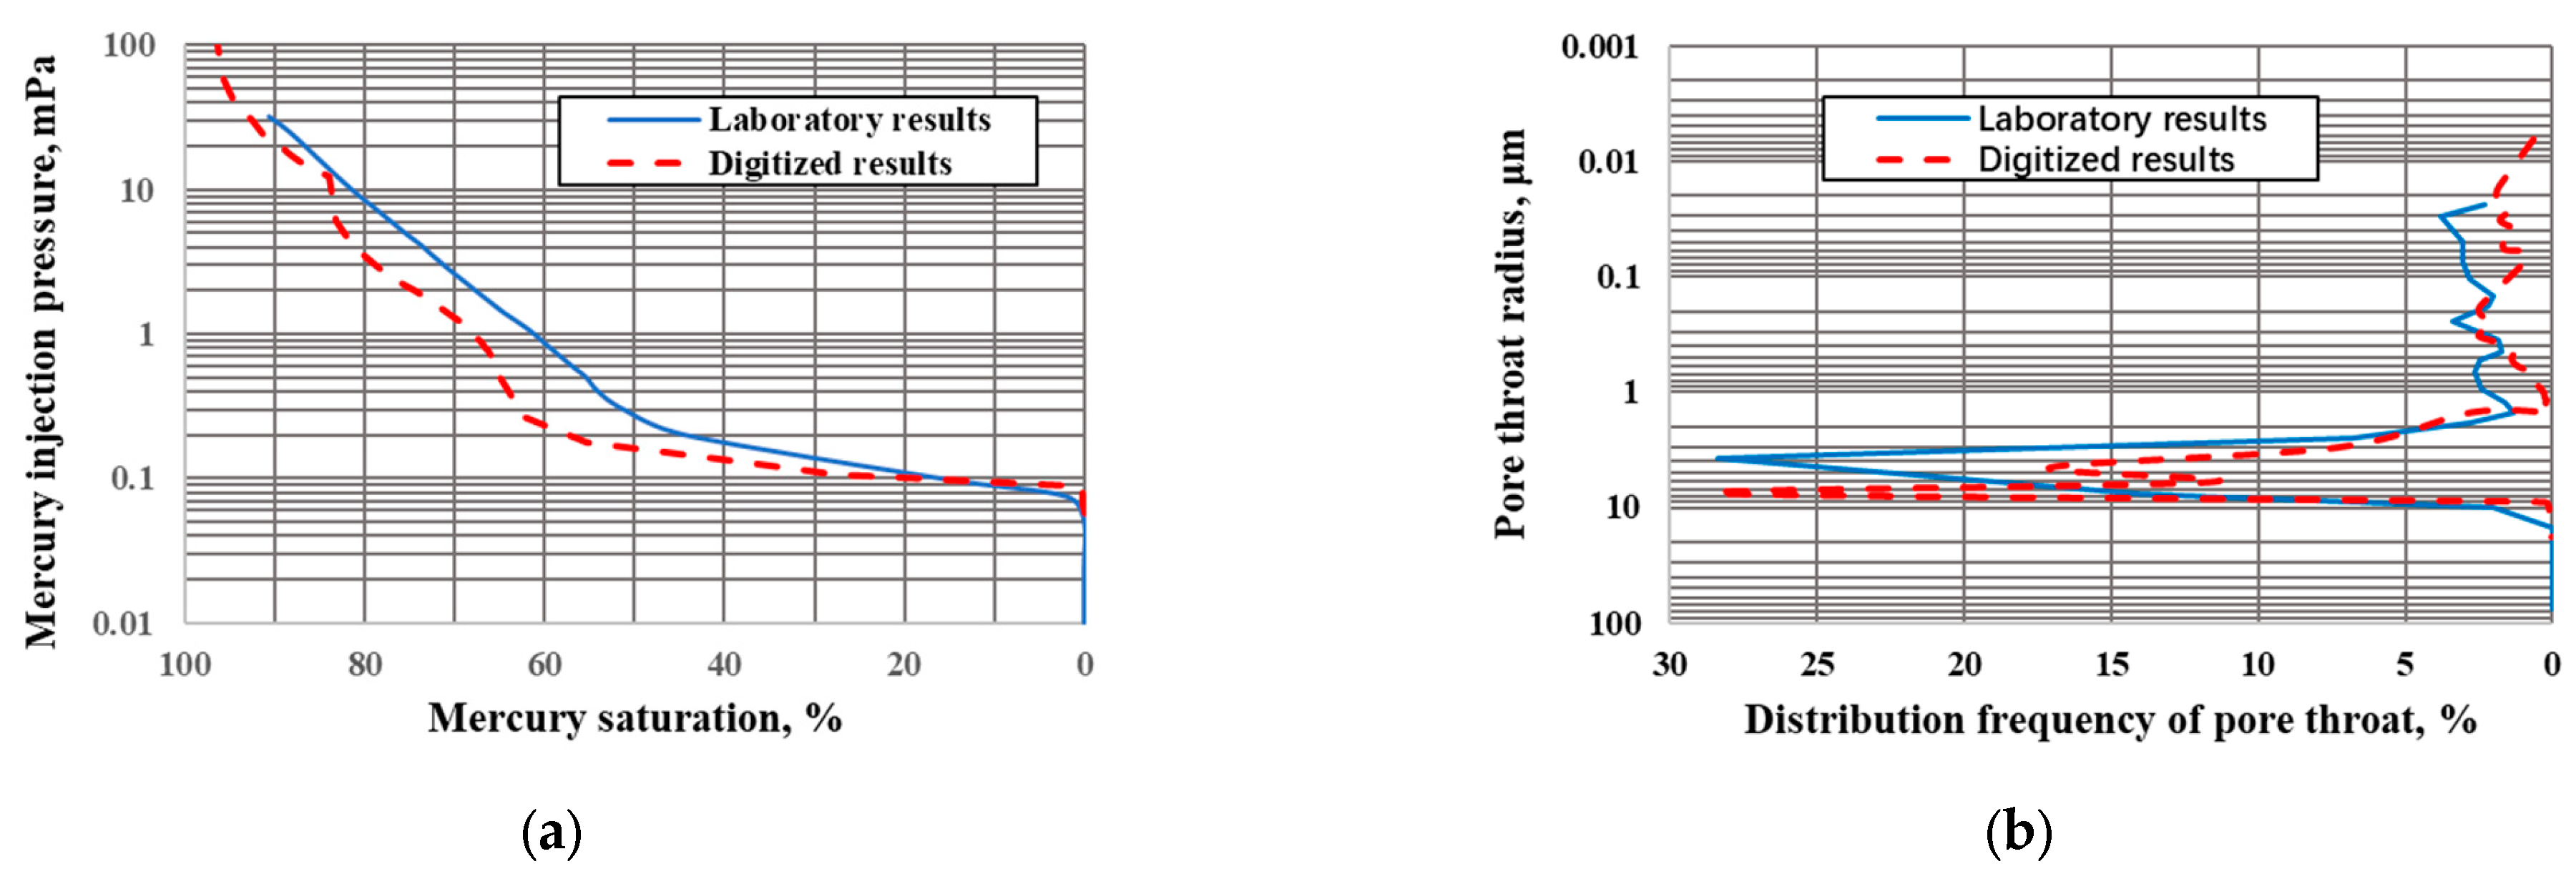
3.2. Evaluation of the Simulated MICP Curve at Multi-Scale

The pore throat distribution can be simply combined at four different scales into one, and the simulated MICP curve can be calculated following the procedure in Section 2.4. Figure 6 compares the MICP curve and the pore throat distribution between the multi-scale DR and the laboratory results for the sandstone with a good homogeneity (sample #49 in Table 1). The good agreements prove that the method is suitable for homogeneous rock.
Figure 7 compares the MICP curve for heterogeneous glutenite between the multi-scale DR model and the laboratory results. The dashed line for each corresponding pore size is calculated following the procedure in Section 2.4. A good agreement for the saturation at the entry point and ending point can be observed. However, a large discrepancy exists in between.
A further analysis is performed to explain this discrepancy. DR combines the pore throat distribution at four different scales, and then calculates the simulated MICP curve from the pore distribution through Equation (4). Meanwhile, for experiments the MICP curve is measured first, then the pore throat distribution is calculated. When the simulated MICP curve is derived from DR based on the pore throat distribution, the default sequence of packings is from large pores to small pores as shown in Figure 8a, while in reality the packings or the pore throat distribution is random as shown in Figure 8b. In other words, DR describes the pore throat distribution more accurately, yet it does not account for the random distribution of pore throats within the sample. Thus, a homogenous rock leads to little discrepancy, while heterogenous rock and poor pore connectivity lead to a large discrepancy between DR and the laboratory results. A better simulated MICP model is necessary for DR in practical application.

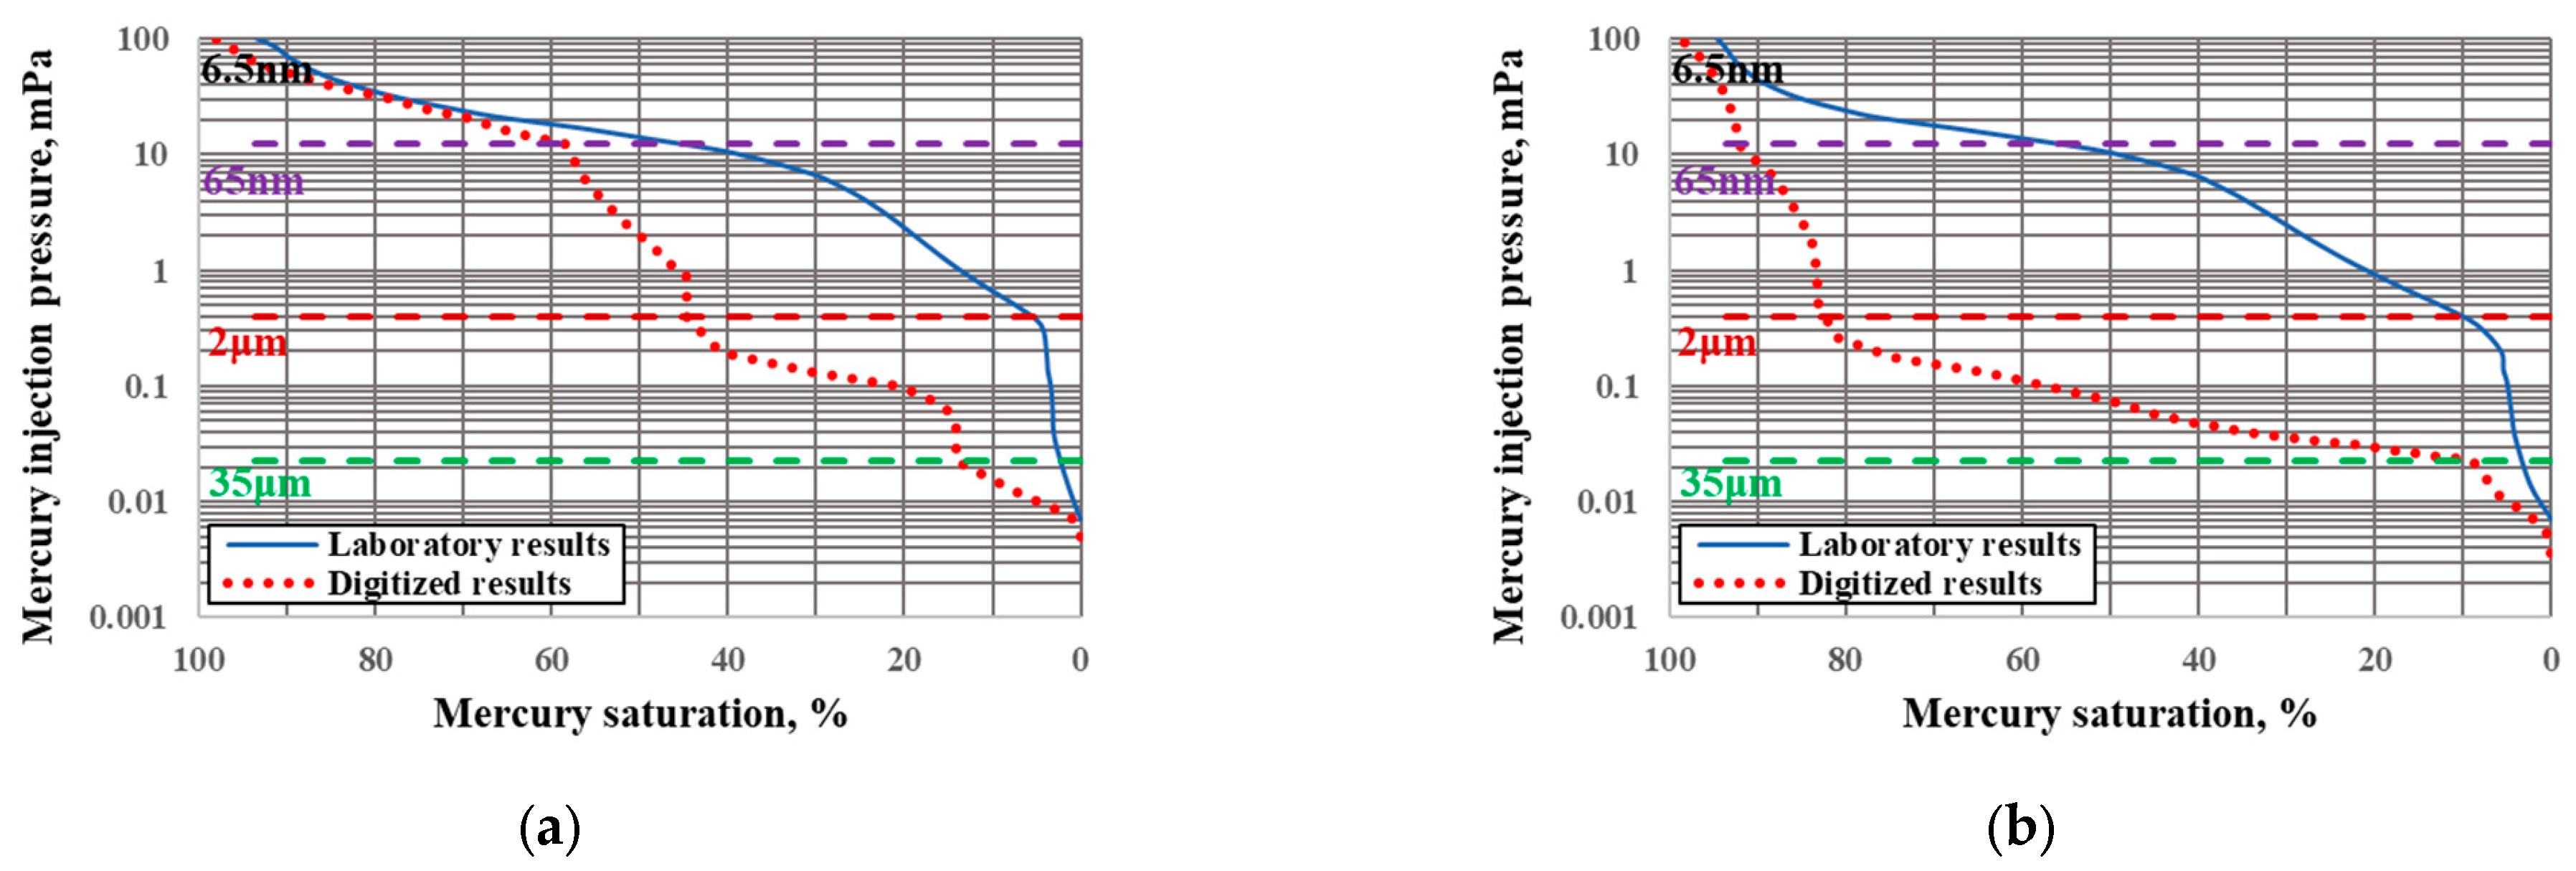
3.3. A Corrected DR Model for the Simulated MICP Curve

A corrected model is proposed in this study in order to improve the simulated MICP curve from DR for glutenite. The model involves adjusting the saturation points of the simulated MICP curves at 35 μm, 2 μm, and 65 nm to align with those obtained from experimental MICP data. Subsequently, the saturations between these points from the simulated MICP curves are stretched while keeping pressure unchanged. We examine the correlation between the saturation points of the simulated MICP and experiments at 35 μm, 2 μm, and 65 nm, respectively, for the six glutenite cores in order to obtain a constant correction coefficient. First, the mercury inlet pressure for three pore throat sizes of 0.065 μm, 2 μm and 35 μm are calculated by Equation (4), then the corresponding saturation points can be obtained from Figure 7. The relationship for the three saturation points between the laboratory and DR is compared and shown in Figure 9.
A good linear relationship can be observed, thus the DR saturation at the three corresponding nodes can be corrected:
s 1,2 , 3 * = c 1,2 , 3 × s 1,2 , 3
where subscripts 1,2,3 represent three nodes of 0.065 μm, 2 μm, and 35 μm, respectively, s 1,2 , 3 * is the corrected saturation, and s1,2,3 is the original saturation calculated from DR. The correlation coefficient c1,2,3, obtained from Figure 9, has values of 0.78, 0.22, and 0.25, respectively. Keeping the mercury saturation at the inlet and outlet unchanged, we stretch the saturation at each corresponding scale where:
s i 35 μm = s i n l e t + S 1 * S i n l e t S 1 S i n l e t × s i s i n l e t s i 2 μm = s 1 * + S 2 * S 1 * S 2 S 1 × s i s 1 s i 65 nm = s 2 * + S 3 * S 2 * S 3 S 2 × s i s 2 s i 6.5 nm = s 3 * + S o u t l e t S 3 * S o u t l e t S 3 × s o u t l e t s i
where s i 35 μm , s i 2 μm , s i 65 nm , and s i 6.5 nm are the mercury saturation at the corresponding scales, sinlet and soutlet are the mercury saturation of inlet and outlet, respectively, and si is the original mercury saturation from DR.
Figure 10 shows the comparison for the MICP curve between the corrected DR model and the laboratory results for the six glutenite samples. An improved agreement can be clearly observed by comparing to Figure 7.

4. Conclusions

This study developed a new DR method to upscale the porosity and the simulated MICP curve from nano-scale to core scale. The porosity agrees well with the laboratory experiments for 67 cores, including sandstone, glutenite, and igneous rock. The MICP curve, however, has a large discrepancy between the DR and laboratory for the heterogeneous rock. A corrected simulated MICP method is developed in order to match the experiments. The corrected DR method will provide a basis to guide reservoir evaluation, for example, to support the interpretation for nuclear magnetic resonance logging where a pseudo capillary pressure curve is usually used which is indirect and inaccurate (Xiao et al., 2016) [46]. Based on the results, we can conclude that:
(1)
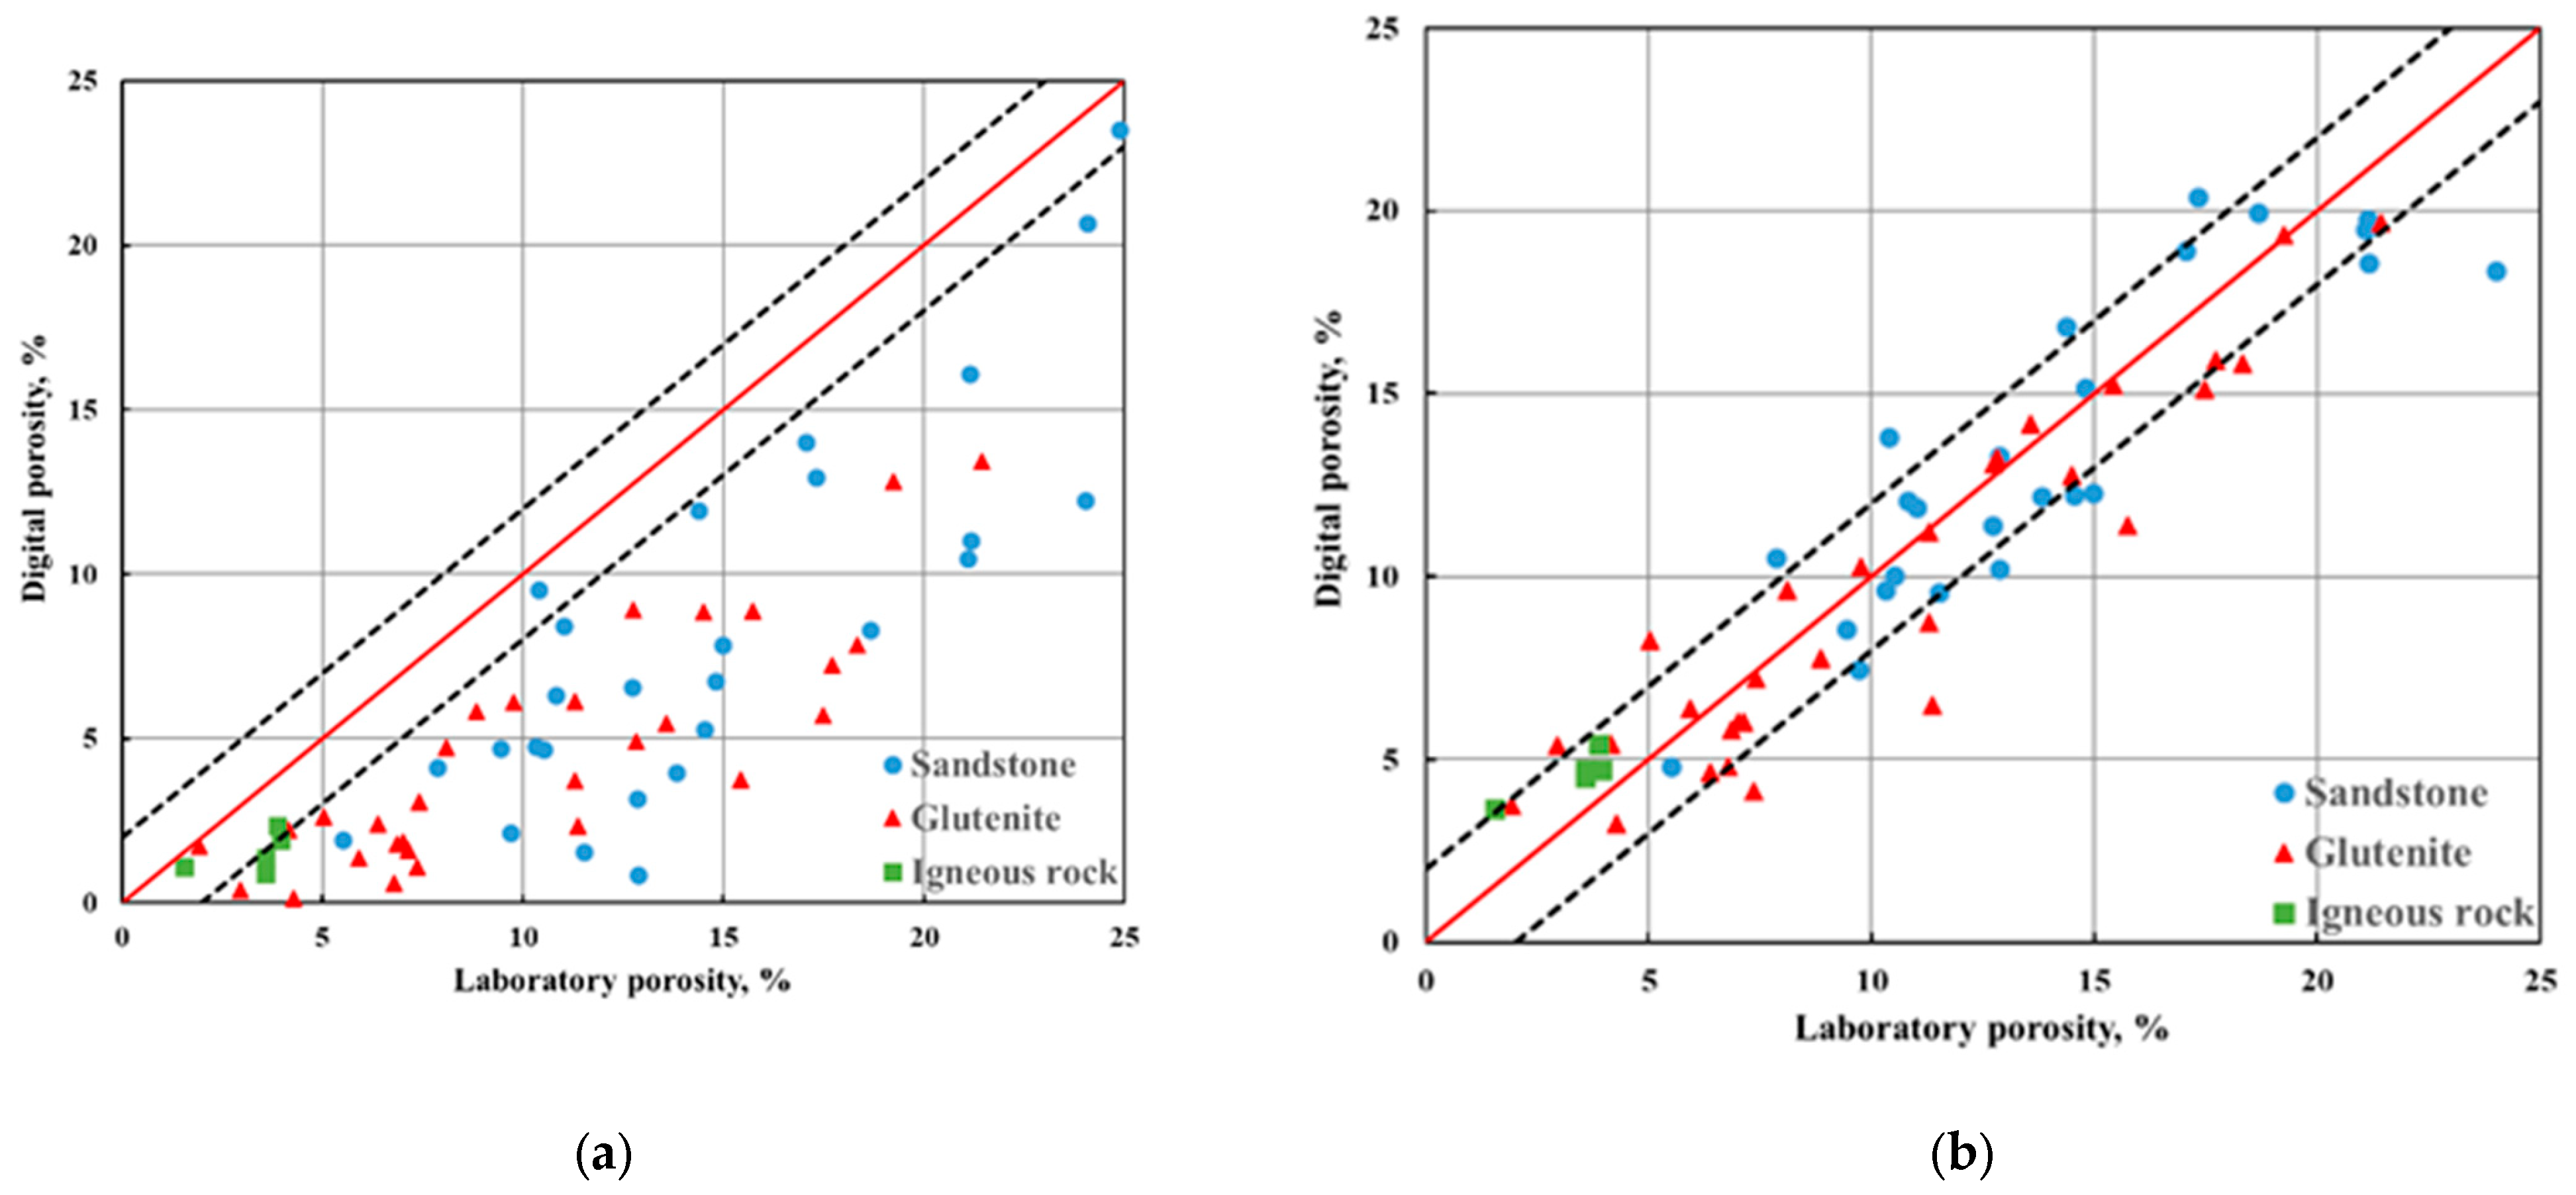
The traditional DR method by the single-resolution micro-CT scanning (usually 1~3 μm) cannot capture all the pore information, including the nano-pores less than 1 μm and macro-pores greater than 1 mm. Thus, the traditional single-scale DR often leads to lower porosity for both homogeneous and heterogeneous rock. The upscale DR model combining four scales represents the porosity and the pore throat distribution better by comparing to the laboratory experiments.
(2)
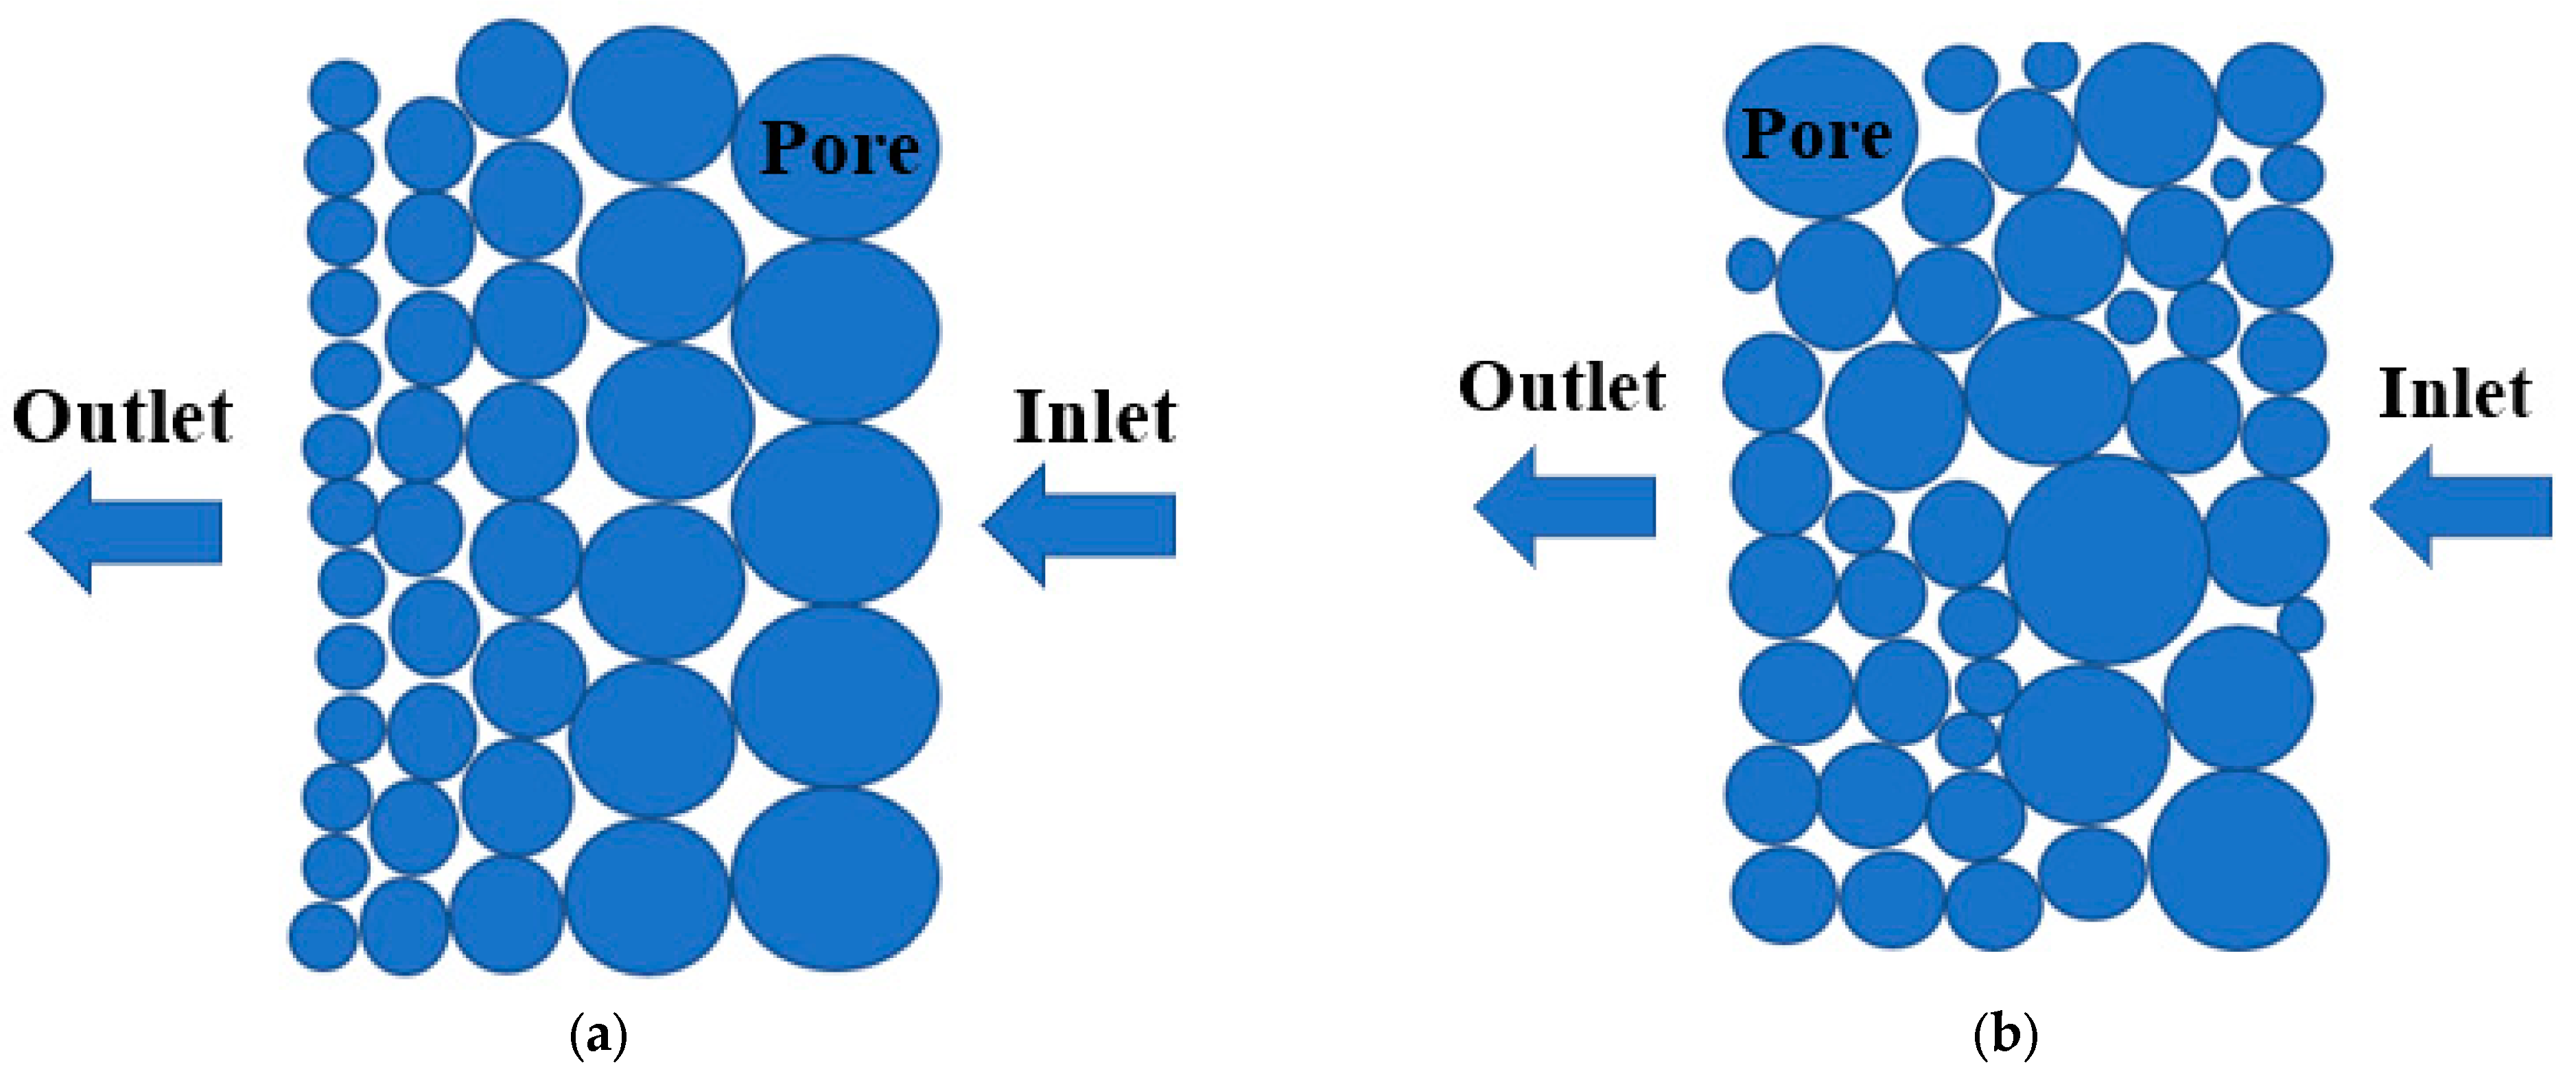
The pore distribution and the simulated MICP curve from the multi-scale DR agree well with the experiments for sandstones with good homogeneity, but a large discrepancy has been observed for heterogenous rock such as glutenite. A further analysis is performed to investigate the discrepancy, where DR obtains the pore throat distribution from images first, and then calculates the simulated MICP curve from the pore throat distribution through Equation (4), while the laboratory experiment measures the MICP curve first, and then calculates the pore throat distribution. Also, the multi-scale DR accounts for all the pore information at four scales, while the mercury injection experiment only accounts for the connected pores. Thus, the pore throat distribution by multi-scale DR is more accurate, while the MICP curve by the laboratory experiments is more representative. The simulated MICP curve by the multi-scale DR model assumes the mercury enters the pore throats from large to small, while in the experiment mercury enters large and small pores at the same time, as shown in Figure 8.
(3)
The multi-scale DR method involves the integration of high-resolution digital imaging and advanced modeling techniques to assess the porous structure of rocks at multiple scales. In comparison to previous upscaling methods, the new method demonstrates a higher level of accuracy in depicting the full range of pore structures across different length scales. This work also allows for more comprehensive comparison with experimental data, which addresses the limitations of previous methods and improves the confidence for the DR application. The implications for petroleum exploration and development are crucial, as rock pore structure greatly affects the flow of fluids, such as oil and gas, through rock formations. Consequently, a better understanding of pore structures via DR techniques can significantly enhance the accuracy of reservoir characterization, forecasting production rates, and optimizing petroleum recovery strategies. The multi-scale DR method offers a potentially valuable tool for these purposes.
(4)
The present study utilized the DR model at four different scales to upscale porosity values from the nano-scale to core scale. However, it is worth noting that the characterization of pore connectivity is essential to gain a comprehensive understanding of the pore structure within rock samples. Unfortunately, the pore connectivity can only be determined using the single-scale DR at the 2 µm resolution, which restricts the accuracy in the evaluation of pore connectivity. Thus, the total pore connectivity cannot be accurately captured by the multi-scale DR method and can lead to discrepancies for some rocks. Further research is recommended to investigate this limitation and explore methods that can accurately capture pore connectivity down to the nano-scale.

Author Contributions

Conceptualization, W.L.; Validation, M.C. and G.W.; Investigation, H.S.; Data curation, Y.J.; Writing— original draft, T.X.; Writing—review & editing, E.L.; Project administration, W.Z. All authors have read and agreed to the published version of the manuscript.

Funding

This work was supported by the Program for Guangdong Introducing Innovative and Entrepreneurial Teams (No. 2017ZT07G264); Shenzhen Peacock Plan (No. KQTD2017033114582189); and the Shenzhen Science and Technology Innovation Committee (JCYJ20170817152743178).

Data Availability Statement

The data presented in this study are available on request from the corresponding author. The data are not publicly available due to confidentiality.

Conflicts of Interest

Author Wei Long has received research grants from Company CNOOC in Shenzhen Branch and Zhanjiang Branch.

References

  1. Antonio, R.C.; Azita, A.S.; Abdelaziz, O. Analysis of the length scale characterized by the yield stress fluids porosimetry method for consolidated media: Comparison with pore network models and mercury intrusion porosimetry. Hydrogeol. J. 2019, 29, 2853–2866. [Google Scholar]
  2. Blunt, M.J.; Bijeljic, B.; Dong, H.; Gharbi, O.; Iglauer, S.; Mostaghimi, P.; Paluszny, A.; Pentland, C. Pore-scale imaging and modelling. Adv. Water Resour. 2013, 51, 197–216. [Google Scholar] [CrossRef]
  3. Raza, S.S.; Ge, L.; Rufford, T.E.; Chen, Z.; Rudolph, V. Anisotropic coal permeability estimation by determining cleat compressibility using mercury intrusion porosimetry and stress–strain measurements. Int. J. Coal Geol. 2019, 205, 75–86. [Google Scholar] [CrossRef]
  4. Radwan, A.E.; Husinec, A.; Benjumea, B.; Kassem, A.A.; Abd El Aal, A.K.; Hakimi, M.H.; Shehata, A.A. Diagenetic overprint on porosity and permeability of a combined conventional-unconventional reservoir: Insights from the Eocene pelagic limestones, Gulf of Suez, Egypt. Mar. Pet. Geol. 2022, 146, 105967. [Google Scholar] [CrossRef]
  5. Miao, Z.; Jindong, W.; Xuehai, F.; Haifeng, L.; Zhiyong, D.; Lirong, L.; Hao, W. Multifractal Characteristics and Genetic Mechanisms of Pore Throat Structures in Coal Measure Tight Sandstone. Nat. Resour. Res. 2022, 31, 2885–2900. [Google Scholar] [CrossRef]
  6. Zhao, X.; Yang, Z.; Zhou, S.; Luo, Y.; Liu, X.; Zhang, Y.; Lin, W.; Xiao, Q.; Niu, Z. Research on Characterization and Heterogeneity of Microscopic Pore Throat Structures in Tight Oil Reservoirs. ACS Omega 2021, 6, 24672–24682. [Google Scholar] [CrossRef]
  7. Wang, R.; Shi, W.; Xie, X.; Zhang, W.; Qin, S.; Liu, K.; Busbey, A.B. Clay mineral content, type, and their effects on pore throat structure and reservoir properties: Insight from the Permian tight sandstones in the Hangjinqi area, north Ordos Basin, China. Mar. Pet. Geol. 2020, 115, 104281. [Google Scholar] [CrossRef]
  8. Wang, Y.; Gao, Y.; Fang, Z. Pore throat structure and classification of Paleogene tight reservoirs in Jiyang depression, Bohai Bay Basin, China. Pet. Explor. Dev. 2021, 48, 308–322. [Google Scholar] [CrossRef]
  9. Zhang, L.; Liu, X.; Zhao, Y.; Zhou, Y.; Shan, B. Effect of pore throat structure on micro-scale seepage characteristics of tight gas reservoirs. Nat. Gas Ind. B 2020, 7, 160–167. [Google Scholar] [CrossRef]
  10. Lai, J.; Wang, G.; Wang, Z.; Chen, J.; Pang, X.; Wang, S.; Zhou, Z.; He, Z.; Qin, Z.; Fan, X. A review on pore structure characterization in tight sandstones. Earth-Sci. Rev. 2018, 177, 436–457. [Google Scholar] [CrossRef]
  11. Liu, G.; Bai, Y.; Gu, D.; Lu, Y.; Yang, D. Determination of static and dynamic characteristics of microscopic pore throat structure in a tight oil-bearing sandstone formation. AAPG Bull. 2018, 102, 1867–1892. [Google Scholar] [CrossRef]
  12. Wang, L.; He, Y.; Peng, X.; Deng, H.; Liu, Y.; Xu, W. Pore structure characteristics of an ultradeep carbonate gas reservoir and their effects on gas storage and percolation capacities in the Deng IV member, Gaoshiti-Moxi Area, Sichuan Basin, SW China. Mar. Pet. Geol. 2020, 111, 44–65. [Google Scholar] [CrossRef]
  13. Jia, L.; Ross, C.M.; Kovscek, A.R. A Pore-Network-Modeling Approach to Predict Petrophysical Properties of Diatomaceous Reservoir Rock. SPE Res. Eval. Eng. 2007, 10, 597–608. [Google Scholar] [CrossRef]
  14. Karpyn, Z.T.; Piri, M.; Singh, G. Experimental investigation of trapped oil clusters in a water-wet bead pack using X-ray microtomography. Water Resour. Res. 2010, 46, W04510. [Google Scholar] [CrossRef]
  15. Singh, K.; Niven, R.K.; Senden, T.J.; Turner, M.L.; Sheppard, A.P.; Middleton, J.P.; Knackstedt, M.A. Remobilization of residual non-aqueous phase liquid in porous media by freeze-thaw cycles. Environ. Sci. Technol. 2011, 45, 3473–3478. [Google Scholar] [CrossRef]
  16. Landry, J.C.; Karpyn, Z.T.; Ayala, O. Relative permeability of homogenous-wet and mixed-wet porous media as determined by pore-scale lattice Boltzmann modeling. Water Resour. Res. 2014, 50, 3672–3689. [Google Scholar] [CrossRef]
  17. AlRatrout, A.; Raeini, A.Q.; Bijeljic, B.; Blunt, M.J. Automatic measurement of contact angle in pore-space images. Adv. Water Resour. 2017, 109, 158–169. [Google Scholar] [CrossRef]
  18. Tawfik, M.; Adishesha, A.; Hsi, Y.; Purswani, P.; Johns, R.; Shokouhi, P.; Huang, X.; Karpyn, Z. Comparative Study of Traditional and Deep-Learning Denoising Approaches for Image-Based Petrophysical Characterization of Porous Media. Front. Water 2022, 3, 800369. [Google Scholar] [CrossRef]
  19. Giudici, L.; Raeini, A.; Akai, T.; Blunt, M.; Bijeljic, B. Pore-scale modeling of two-phase flow: A comparison of the generalized network model to direct numerical simulation. Phys. Rev. E 2023, 107, 035107. [Google Scholar] [CrossRef]
  20. Bultreys, T.; De Boever, W.; Cnudde, V. Imaging and image-based fluid transport modeling at the pore scale in geological materials: A practical introduction to the current state-of-the-art. Earth-Sci. Rev. 2016, 155, 93–128. [Google Scholar] [CrossRef]
  21. Cnudde, V.; Boone, M.N. High-resolution X-ray computed tomography in geosciences: A review of the current technology and applications. Earth-Sci. Rev. 2013, 123, 1–17. [Google Scholar] [CrossRef]
  22. Wildenschild, D.; Sheppard, A.P. X-ray imaging and analysis techniques for quantifying pore-scale structure and processes in subsurface porous medium systems. Adv. Water Resour. 2013, 51, 217–246. [Google Scholar] [CrossRef]
  23. Qajar, J.; Arns, C.H. A comparative study of micro-CT and mercury intrusion techniques for predicting permeability and surface area evolution during chemical dissolution. Adv. Water Resour. 2022, 168, 104301. [Google Scholar] [CrossRef]
  24. Chhatre, S.S.; Sahoo, H.; Leonardi, S.; Vidal, K.; Rainey, J.; Braun, E.M.; Patel, P. A Blind Study of Four Digital Rock Physics Vendor Laboratories on Porosity, Absolute Permeability, and Primary Drainage Capillary Pressure Data on Tight Outcrops. Petrophysics 2018, 59, 15–24. [Google Scholar] [CrossRef]
  25. Jin, X.; Yu, C.; Wang, X.; Liu, X.; Li, J.; Jiao, H.; Su, L. Multi-Scale Digital Rock Quantitative Evaluation Technology on Complex Reservoirs. Presented at the SPE Asia Pacific Oil and Gas Conference and Exhibition, Brisbane, Australia, 23–25 October 2018. [Google Scholar] [CrossRef]
  26. Yang, Y.; Wang, C.; Yao, J.; Gao, Y. A new voxel upscaling method based on digital rock. Int. J. Multiscale Comput. Eng. 2015, 13, 339–346. [Google Scholar] [CrossRef]
  27. Hertel, S.A.; Rydzy, M.; Anger, B.; Berg, S.; Appel, M.; de Jong, H. Upscaling of Digital Rock Porosities by Correlation with Whole-Core CT-Scan Histograms. Petrophysics 2018, 59, 694–702. [Google Scholar] [CrossRef]
  28. Zhang, T. MPS-Driven Digital Rock Modeling and Upscaling. Math. Geosci. 2015, 47, 937–954. [Google Scholar] [CrossRef]
  29. Liu, X.; Yan, J.; Zhang, X.; Zhang, L.; Ni, H.; Zhou, W.; Wei, B.; Li, C.; Fu, L. Numerical upscaling of multi-mineral digital rocks: Electrical conductivities of tight sandstones. J. Pet. Sci. Eng. 2021, 201, 108530. [Google Scholar] [CrossRef]
  30. Liu, Y.; Teng, Q.; He, X.; Yang, X. Improved throat finding algorithm of 3D core images. J. Sichuan Univ. Eng. Sci. Ed. 2012, 44 (Suppl. S1), 171–176. [Google Scholar]
  31. Carrillo, F.J.; Bourg, I.C.; Soulaine, C. Multiphase flow modeling in multiscale porous media: An open-source micro-continuum approach. J. Comput. Phys. X 2020, 8, 100073. [Google Scholar] [CrossRef]
  32. Okabe, H.; Blunt, M.J. Pore space reconstruction of vuggy carbonates using microtomography and multiple-point statistics. Water Resour. Res. 2007, 43, W12S02. [Google Scholar] [CrossRef]
  33. Mohebi, A.; Fieguth, P.; Ioannidis, M.A. Statistical fusion of two-scale images of porous media. Adv. Water Resour. 2009, 32, 1567–1579. [Google Scholar] [CrossRef]
  34. Tahmasebi, P.; Javadpour, F.; Sahimi, M. Multiscale and multiresolution modeling of shales and their flow and morphological properties. Sci. Rep. 2015, 5, 16373. [Google Scholar] [CrossRef]
  35. Wang, Y.; Armstrong, R.T.; Mostaghimi, P. Enhancing Resolution of Digital Rock Images with Super Resolution Convolutional Neural Networks. J. Pet. Sci. Eng. 2019, 182, 106261. [Google Scholar] [CrossRef]
  36. Armstrong, R.T.; Sun, C.; Mostaghimi, P.; Berg, S.; Rücker, M.; Luckham, P.; Georgiadis, A.; McClure, J.E. Multiscale Characterization of Wettability in Porous Media. Transp. Porous Med. 2021, 140, 215–240. [Google Scholar] [CrossRef]
  37. Walczak, M.; Binkowski, M.; Sulikowska-Drozd, A.; Wrobel, Z. Maximum sphere method for shell patency measurements in viviparous land snails based on X-ray microcomputed tomography imaging. Comput. Biol. Med. 2015, 64, 187–196. [Google Scholar] [CrossRef]
  38. Hosseinzadeh, S.; Kadkhodaie, A.; Mosaddegh, H.; Kadkhodaie-IIkhchi, R. Pore throat size characterization of carbonate reservoirs by integrating core data, well logs and seismic attributes. Geopersia 2019, 9, 395–410. [Google Scholar]
  39. Ruspini, L.C.; Øren, P.E.; Berg, S.; Masalmeh, S.; Bultreys, T.; Taberner, C.; Sorop, T.; Marcelis, F.; Appel, M.; Freeman, J.; et al. Multiscale Digital Rock Analysis for Complex Rocks. Transp. Porous Media 2021, 139, 301–325. [Google Scholar] [CrossRef]
  40. Knoll, G.F. Radiation Detection and Measurement, 3rd ed.; Wiley: New York, NY, USA, 2000. [Google Scholar]
  41. Attix, F.H. Introduction to Radiological Physics and Radiation Dosimetry; WILEY-VCH Verlag GmbH & Co., Ltd., KGaA: Weinheim, Germany, 2004. [Google Scholar]
  42. Arganda-Carreras, I.; Kaynig, V.; Rueden, C.; Eliceiri, K.W.; Schindelin, J.; Cardona, A.; Seung, H.S. Trainable Weka Segmentation: A machine learning tool for microscopy pixel classification. Bioinformatics 2017, 33, 2424–2426. [Google Scholar] [CrossRef]
  43. Sun, H.; Vega, S.; Tao, G. Analysis of heterogeneity and permeability anisotropy in carbonate rock samples using digital rock physics. J. Pet. Sci. Eng. 2017, 156, 419–429. [Google Scholar] [CrossRef]
  44. Al-Kharusi, A.S.; Martin, J. Network extraction from sandstone and carbonate pore space images. J. Pet. Sci. Eng. 2007, 56, 219–231. [Google Scholar] [CrossRef]
  45. Hilpert, M.; Miller, C. T Pore-morphology based simulation of drainage in totally wetting porous media. Adv. Water Resour. 2001, 24, 243–255. [Google Scholar] [CrossRef]
  46. Xiao, L.; Mao, Z.Q.; Zou, C.C.; Jin, Y.; Zhu, J.C. A new methodology of constructing pseudo capillary pressure (Pc) curves from nuclear magnetic resonance (NMR) logs. J. Pet. Sci. Eng. 2016, 147, 154–167. [Google Scholar] [CrossRef]
  47. Zankoor, A.; Khishvand, M.; Mohamed, A.; Wang, R.; Piri, M. In-situ capillary pressure and wettability in natural porous media: Multi-scale experimentation and automated characterization using X-ray images. J. Colloid Interface Sci. 2011, 603, 356–369. [Google Scholar] [CrossRef] [PubMed]
Figure 1. Images before and after segmentation by machine-learning method. (a) Original image obtained by micro-CT, (b) image segmented by the machine-learning algorithm (blue represents pores and gray represents rock matrix).
Energies 16 07613 g001
Figure 2. Comparison of DR porosity to experimental porosity at various scales. (a) Impact of number of sub-samples on porosity, CT at 35 μm, (b) impact of number of micro-samples on porosity, SEM at 65 nm, (c) impact of number of nano-samples on porosity, SEM at 6.5 nm.
Energies 16 07613 g002aEnergies 16 07613 g002b
Figure 3. Appearance of the samples: (a) Sandstone; (b) Glutenite; (c) Igneous.
Energies 16 07613 g003
Figure 4. Comparison of CT and SEM images at four scales. (1a) Sandstone, CT at 35 μm; (1b) Sandstone, CT at 2 μm; (1c) Sandstone, SEM at 65 nm; (1d) Sandstone, SEM at 6.5 nm; (2a) Glutenite, CT at 35 μm; (2b) Glutenite, CT at 2 μm; (2c) Glutenite, SEM at 65 nm; (2d) Glutenite, SEM at 6.5 nm; (3a) Igneous, CT at 35 μm; (3b) Igneous, CT at 2 μm; (3c) Igneous, SEM at 65 nm; (3d) Igneous, SEM at 6.5 nm.
Energies 16 07613 g004aEnergies 16 07613 g004b
Figure 5. Comparison of porosity between DR and laboratory measurements: Red line means the DR porosity is equal to the experimental results, and black line represents a margin of error of ±2% in porosity. (a) Porosity by traditional DR method, (b) porosity by multi-scale method.
Energies 16 07613 g005
Figure 6. Comparison of the MICP curve and the pore distribution for sandstone (sample #49). (a) MICP curve; (b) Pore throat distribution.
Energies 16 07613 g006
Figure 7. Comparison of the MICP curve between multi-scale DR and laboratory results. (a) Sample 1; (b) Sample 2.
Energies 16 07613 g007
Figure 8. Difference in mercury injection sequence. (a) Digitized sequence from multi-scale MICP; (b) Laboratory mercury injection sequence.
Energies 16 07613 g008
Figure 9. Relationship between mercury saturation under node pressure and laboratory results. (a) 0.065 μm (12.224 mPa); (b) 2 μm (0.397 mPa); (c) 35 μm (0.023 mPa). (Red dashed line is the linear regression).
Energies 16 07613 g009
Figure 10. Comparison of the MICP curve between the corrected DR and laboratory results. (a) Sample 1; (b) Sample 2; (c) Sample 3; (d) Sample 4; (e) Sample 5; (f) Sample 6.
Energies 16 07613 g010
Table 1. Summary of the porosities from the laboratory and multi-scale DR.
Index φ n a n o (%) φ m i c r o (%) φ t o t a l (%) φ e x p (%) k e x p (mD)Type
12.1712.8119.3419.2525.29Glutenite
20.907.8415.8318.3412.91Glutenite
30.6513.4419.6821.4438.09Glutenite
42.245.7115.1217.4754.44Glutenite
52.295.4714.1813.562.35Glutenite
62.467.2315.9317.7213.29Glutenite
73.693.7515.2515.431.24Glutenite
82.884.9313.2412.830.62Glutenite
91.908.8811.4115.7454.13Glutenite
103.088.8512.7814.51206.19Glutenite
112.746.1010.289.7615.64Glutenite
122.288.9213.0712.753.62Glutenite
132.523.087.227.410.33Glutenite
141.095.827.778.850.24Glutenite
152.132.356.4911.362.04Glutenite
162.324.749.628.100.49Glutenite
171.191.733.731.920.00Glutenite
182.461.795.806.860.10Glutenite
191.592.414.656.390.05Glutenite
201.200.624.816.780.15Glutenite
210.841.104.127.360.21Glutenite
221.601.626.017.130.09Glutenite
232.142.225.424.160.02Glutenite
242.050.143.254.270.11Glutenite
252.051.886.037.010.11Glutenite
261.830.405.372.960.02Glutenite
271.422.618.255.030.03Glutenite
281.641.376.395.920.01Glutenite
292.953.728.7411.304.92Glutenite
303.721.569.5711.511.95Sandstone
314.963.1610.2012.865.93Sandstone
325.5010.4719.5021.091.21Sandstone
332.256.7415.1414.800.29Sandstone
349.200.8613.2912.870.08Sandstone
354.5120.4826.1525.46280.09Sandstone
365.286.3412.0810.810.16Sandstone
373.0716.0819.7721.1425.72Sandstone
383.358.3119.9518.67216.63Sandstone
398.2715.0825.0828.96666.30Sandstone
406.6016.7927.0531.051563.74Sandstone
413.8511.0218.5821.1680.12Sandstone
423.6520.6625.1724.0839.27Sandstone
433.1223.5127.3324.87758.01Sandstone
444.8112.2518.3624.0241.06Sandstone
451.589.5413.8010.405.07Sandstone
462.3214.0118.9017.06969.66Sandstone
472.258.4311.8811.027.69Sandstone
482.567.8612.3014.98259.27Sandstone
492.9011.9316.8414.3758.94Sandstone
503.116.1511.2211.3053.04Sandstone
512.985.2712.2314.542.27Sandstone
522.574.6610.0210.520.29Sandstone
531.754.718.579.440.91Sandstone
542.096.5511.3912.7396.31Sandstone
552.7416.7127.3927.442994.98Sandstone
562.8119.4027.0428.605770.15Sandstone
574.1212.9520.3717.3220.95Sandstone
582.164.759.6310.312.75Sandstone
593.402.137.469.701.41Sandstone
602.333.9812.1813.831.37Sandstone
611.484.1310.527.870.06Sandstone
621.601.924.795.500.01Sandstone
632.351.944.713.950.17Igneous
642.352.345.413.880.05Igneous
651.801.374.523.580.05Igneous
661.741.113.641.540.03Igneous
672.230.894.703.580.01Igneous
Disclaimer/Publisher’s Note: The statements, opinions and data contained in all publications are solely those of the individual author(s) and contributor(s) and not of MDPI and/or the editor(s). MDPI and/or the editor(s) disclaim responsibility for any injury to people or property resulting from any ideas, methods, instructions or products referred to in the content.

