Abstract
Small power generators (up to 5 kW) with a dual-fuel function rely on the use of fuels with standardized quality parameters. The use of gaseous and liquid biofuels, produced by the prosumers themselves, to power the engines of these generators poses the problem of their impact on the operation of the fuel system and on exhaust gas emissions. The goal of this study was to indicate the environmental effects of adapting the internal combustion engine of a 2 kW multi-fuel generator to burn gaseous and liquid biofuels produced by the prosumer. Exhaust emission tests were carried out for the combustion of biogas, methanol, natural gas (methane) and conventional fuel. Forms of propellants that were generated at laboratory scale were used during the tests. Anaerobic organic waste management technologies were used in the tests. Biogas and biomethanol were generated for the tests. A modified SI generator fuel system: pressure reduction and fuel pre-conditioning, was tested burning gasoline, methanol, biogas and natural gas with 98% methane content. Exhaust gas emission tests in three operating states (idle, 50% load, 100% load) indicated CO2, CO, NOx and HC emission levels. The feasibility of using renewable fuels in a low-power generator was demonstrated, as well as the correct operation of the author’s system for supplying the generator with gaseous fuels. In the case of bioethanol, better complete combustion of the fuel was achieved than with gasoline, which was characterized by, among other things, 20% lower carbon monoxide emissions at full load. NOx emissions from the combustion of bioethanol compared to gasoline were 1.75 times lower at full load, and HC emissions were almost twice as low. In the case of biogas, there were significant carbon dioxide emissions due to the high carbon dioxide content of the fuel (40%). The other emission results for biogas were not significantly different from those from natural gas combustion.
1. Introduction
Environmental pollution, the progressive greenhouse effect and depletion of conventional energy sources are fostering interest in and implementation of renewable energy sources [1].
Photovoltaics and wind power plants are characterized by unsteady electricity production over time. The reason is the dependence of these sources on atmospheric conditions, insolation in the case of photovoltaics and wind in the case of wind turbines [2]. Of the renewable energy sources, only the use of biomass guarantees energy production correlated in time with demand. Energy carriers produced from biomass include, in addition to biomass itself, fuels produced from it, such as biogas and bioethanol or biodiesel [3]. These fuels are usually not used for small-scale electricity production. In the case of prosumers, they can primarily be used to power vehicles (bietanol, biodiesel and biogas) or to heat buildings (biomass) [4].
In the work presented here, research is presented on the use of a low-power generator system for prosumer solutions for periodic energy production in response to energy demand. The issue of using biofuels, biofuel blends and mixtures of conventional and biofuels for power generation and mechanical power systems (traction systems) can be considered from many aspects [5].
The topics that are emerging through the scientific discourse are: ecology, energy efficiency and the economic aspect [6].
In addition to industrial-scale systems for the production of first-generation fuels and biofuels, there are also prosumer systems for the production of biofuels on a micro technical scale. Industrial-scale systems include agricultural and utility biogas plants, refineries preparing conventional fuels blended with alcohols and oil esters and biofuels based on alcohols and vegetable oil esters. Methane fermentation is one of the basis technologies for commercial full-scale renewable energy generation. It can also be used on a smaller scale to meet prosumer needs. [7]. Biogasification of waste, which can come from organic food waste, household waste and municipal waste, is popular in extensive technologies used by individual users (also in the sense of prosumers) [8]. Popular biogas technologies are based on liquid substrates (with a dry matter content of up to about 14–15%) and a mesophilic temperature range (from 22 °C to about 40 °C) [9].
Obtaining methane concentrations in the biogas component gas mixture (at levels ranging from 45% v/v to as high as 70% v/v at laboratory and microtechnical scales) requires the fulfilment of basic thermal requirements and an anaerobic environment. If the biogas process is implemented with intermittent nutrient supplementation, this implies methane concentrations closer to its lower limit [10]. However, some problems in the utilisation of biogas for energy purposes are the reduced methane concentration compared to natural gas, the increased moisture content of the gaseous fuel, the presence of gaseous pollutants (hydrogen sulphide), the presence of solid impurities—siloxanes, etc. [11]. Despite technical limitations due to the small scale of prosumer domestic biogas solutions, it is possible to obtain biogas for energy purposes. However, factors such as the small scale of biogas production, the technical simplification of the feedstock system, the limited mixing efficiency, the limited facilities for dehumidification systems, the removal of solid gaseous pollutants (sulphides) and the high variability of the produced volume and methane concentration, all limit access to professional biogas conversion in power generators [12].
Starch bioethanol (a first-generation biofuel) is the most commonly used biofuel in the world. Bioethanol is produced on a technical scale from sugar-containing plants such as sugar cane, maize and sugar beet. Cereals (rye, triticale) and root crops are also popular substrates. On a microtechnical scale, starch bioethanol can be produced from fruit as well as from fruit wastes in the form of low-quality yields and from fruits that are decomposing due to the effects of inappropriate storage. The basic technology for producing bioethanol from starchy materials is the fermentation process. This staged biochemical process requires the pretreatment of biomass. During the process, ethanol and carbon dioxide are formed from carbohydrates under the influence of enzymes produced by yeast. The biomass of the fruit and vegetables is also pre-decomposed by bacteria, and then yeast converts the sugars present in the biomass into alcohol. The alcohol is then distilled and dehydrated. In micro-scale fermentation processes, the alcohol content is subject to significant fluctuations due to technological and technical constraints in the enzymatic conversion, distillation and dehydration phases. Despite the storability of this alcohol-based liquid biofuel and its measurable functional and environmental advantages, the energy input for its production increases as the scale of the process decreases. Ethanol, due to the characteristics of its chemical composition and flash point, is used in spark-ignition engines, mainly due to its good anti-knock properties. However, as a pure fuel rather than a supplementary substrate, ethanol is quite problematic. Alcohol-based fuel causes corrosion of the unprotected metal parts of combustion chambers as well as inlet systems and fuel dosage preparation systems. The main corrosion factor of alcohol-based fuel is its strong hygroscopicity and the water contained in the product [12].
The reason for environmentally friendly activities that have led to the use of biofuels based on methane, alcohol, vegetable and animal oil esters is to reduce the carbon cycle in the environment and to counteract the intensification of adverse climate change.
Anthropogenic changes are causing greenhouse gas emissions from many spheres of human economic activity around the world.
An example of agriculture’s contribution to greenhouse gas emissions is the livestock sector [13]. This sector, in terms of equivalent carbon dioxide (CO2) emissions, emits more than 700 million tonnes of greenhouse gases annually. Many researchers indicate that livestock production and related processes account for 18% of greenhouse gas emissions annually. Methane emissions in this compilation account for a share of more than 37% of total methane emissions. The livestock sector contributes more than 60% of total nitrogen dioxide (NO2) emissions annually [14]. In the compilation of total anthropogenic GHG emissions, significant shares are shown by emissions from feed digestion 11%, milk production 20% and cattle-beef production 41% [15,16]. In relation to efforts to reduce greenhouse gas emissions, emissions from anthropogenic causes, activities include global and local projects [17].
The use of small-scale renewable liquid and gaseous fuel allows for economic savings and autonomy [18]. Economic efficiency depends on the degree of waste substrates used, the degree of use of renewable energy and the efficiency of the technology [19]. Biogas production and alcohol fermentation represent technologies that enable the production of energy-value biofuels regardless of the scale of the production process [20]. The costs and scale of biomass-to-energy conversion technologies for biogas and methanol production can be optimised according to economic or technological criteria and adapted to the requirements of users [21].
The response of the modified system in terms of efficiency and emissions levels usually remains unknown. As a result of the analysis, the possibility of determining the effects of modifying the fuel system of a popular low-power (2 kW) generator in terms of exhaust gas emissions and operation under load was identified. It was assumed that the fuel system would allow the use of gaseous and liquid biofuel without co-combustion.
The aim of this study was to assess the proper functioning of a low-power generator as a possible solution for prosumers. This solution would compensate for the disadvantages of photovoltaic and micro wind installations in terms of intermittent energy production and the need for energy storage. An analysis of such a solution, especially in terms of environmental impact, has not previously been encountered in the literature. The layout of the generator used for the study was adapted to the use of liquid and gaseous fuels. The impact of using conventional fuels (gasoline, natural gas) with renewable fuels (bioethanol, biogas) was investigated and compared. The resulting exhaust emissions were examined as an indicator of both the environmental impact of the individual fuels and of the correct functioning of the generator itself.
Internal combustion engines for stationary applications are mainly used to generate electricity. The drive motors of this type of equipment often operate at a constant rotation speed. Such systems operate within a relatively small range of variability, as the energy receivers are selected according to the levels of maximum power generated.
The magnitude of the energy parameters (electrical power) obtained by the combustion engine and generator set is optimized for a narrow operating area. Many power units are characterized by a constant value of the ignition advance angle. SI (spark-ignition engine) micro engines driving generators have been subject to more stringent emission standards since 2015. The European Commission published the Stage 5 emissions standard in 2014 and implemented it in 2015 [22].
The emission testing of combustion microgenerators working in conjunction with electricity generators is an important contribution to the process of understanding the environmental impact of this type of technology. In this scope are emission tests of microgenerators represents a current research trend [23,24,25]. A novelty in the research field is the combination of four types of fuel in a single low-power system with a division between liquid and gaseous fuels.
2. Materials and Methods
As mentioned above, in order to fulfil the aim of the study, research was undertaken into the use of renewable fuels (liquid and gaseous) to produce electricity using a low-power generator. Conventional fuels were also used for comparison.
The fuels used included:
- -
- Bioethanol (renewable liquid fuel)
- -
- Biogas (renewable gaseous fuel)
- -
- Gasoline (conventional liquid fuel)
- -
- Natural gas—98% methane (conventional gaseous fuel).
Biogas and bioethanol were produced in-house on a laboratory scale at the University of Life Sciences in Poznań. Gasoline (unleaded 95) was supplied from an filling station. Natural gas from the gas grid was used as gas with 98% methane content. Laboratory equipment showed a methane content of at least 98% in this gas. The use of natural gas was intended to demonstrate the feasibility of the presented prosumer solution also in the form of a connection to the gas grid.
The response of the generator’s fuel supply system to the diversification of fuels burned was one of the elements verified in the present study.
2.1. Biogas Preparation and Testing
It was assumed as expedient to consider two modes of the digestion process on the basis of two biomass transport systems in the reaction chamber system. One way of testing this is to adopt the concept of maintaining a periodic fermentation process. After nutrient depletion, information on the biogas production potential is obtained (Figure 1).
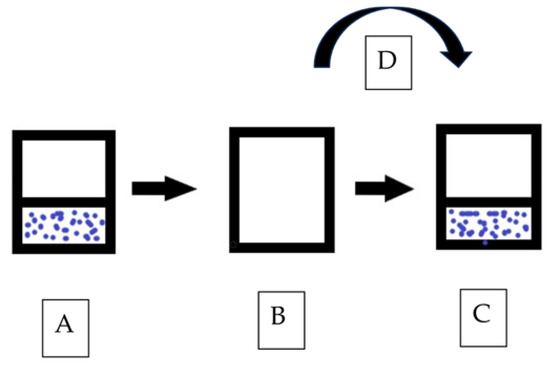
Figure 1.
Discontinuous (periodical) mode of cooperation between fermentation chambers ((A)—pre-tank, (B)—fermentation chamber, (C)—digestate tank, (D)—emptying direction); graphical interpretation based on a review of the state of knowledge. (Prepared by: Adamski and Herkowiak).
Periodic fermentation is also characterised by significant fluctuations in biogas production. At the same time, the characteristics of biogas emission, higher volume at the beginning of the process and lower volume at the end, make it possible to determine the suitability of the substrate mix. In this way, it was possible to work out the components of the mixture and its physical parameters in the study.
In the case of a bioreactor operating in batch mode (Figure 1), it was filled with a mixture of substrates and sealed [17].
No fresh substrate was added to the tank until the retention time had elapsed. The digested material was emptied from the digester into the storage tank (Figure 1D).
After fermentation was completed, the digestate mass was removed from the fermentation tank (Figure 1B). In addition to the substrate mixture, an inoculation from the digestate storage was added to the empty tank. The productivity test can then be repeated after filling the tank with fresh substrates (Figure 1A). Fermentation begins after refilling the reaction tank, inoculation ensures the proper course of the process [26,27,28,29,30].
The semi-continuous (quasi-continuous—Figure 2) mode contributes to constant biogas production; it allows one to obtain biogas at a stabilized level. The semi-continuous mode was adopted to obtain an effect similar to that of an agricultural biogas plant. Obtaining biogas for energy purposes requires supplementing nutrients on a daily basis (every 24 h) [22].
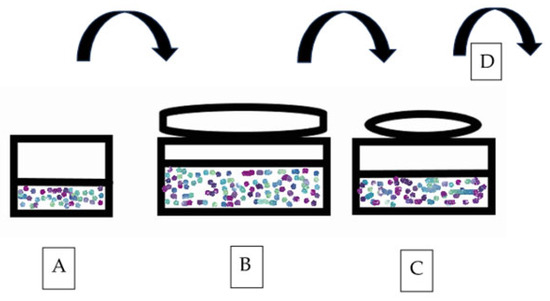
Figure 2.
Continuous mode of cooperation between fermentation chambers, the flow-storage method ((A)—pre-tank, (B)—fermentation chamber, (C)—digestate tank), (D)—direction of digestate transport; graphical interpretation based on a review of the state of knowledge. (Prepared by: Adamski and Herkowiak).
The quasi-continuous mode is most similar to the operation of the organic waste stabilization chamber system on an industrial scale. Food substrates are dosed into the pre-chamber (Figure 2A). After mixing solid and liquid substrates, the mixture is pumped to the fermentation chamber (Figure 2B), where biogas is produced. From the fermentation chamber, the digestate, a substrate with used nutrients, goes to the storage chamber (Figure 2C). This type of energy system, depending on the scale, has an energy surplus, i.e., biogas. The energy-self-sufficient system produces energy chemically accumulated in processed gases [26,27,28,29,30]. In the biogas storage process, a quasi-continuous mode was implemented for testing the fuel system of the power generator (Figure 2).
Biogas yield (biogas productivity) tests were carried out in accordance with DIN 38 414-S8. A system of duplicated reaction chambers was used to obtain repetitions of the research results. (Figure 3). The capacity of the fermenter is 1000 mL. The produced biogas is collected in an ediometric tank for each fermenter. The capacity of the biogas storage tank is 1200 mL [25,26].
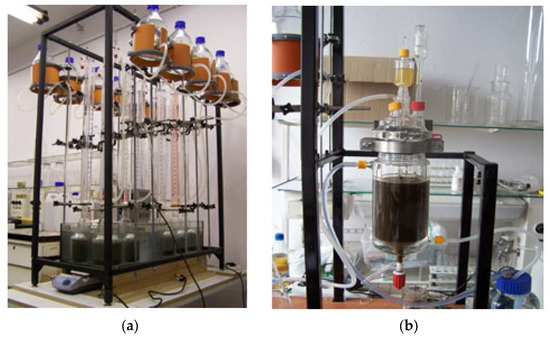
Figure 3.
Research stand (photo by Mariusz Adamski) for the study of biogas productivity of substrates according to: (a) DIN 38414 S.8; (b) inoculum station for quasi-continuous fermentation work.
The concentrations of biogas component gases were measured. The Alter Bio MSMR 16 analytical system analysed the presence of methane, carbon dioxide, hydrogen sulfide, oxygen, ammonia, nitric oxide and nitrogen dioxide in the biogas and provided information on volume concentrations.
The bacterial inoculum was produced in a reaction chamber for quasi-continuous fermentation with a capacity of 1650 mL.
The fermentation station (Figure 3) was equipped with a thermostated tank. In this way, energy was provided for the digestion of nutrients by methanogenic bacteria. The set thermal parameters (35 °C) of the process in the fermentation chambers were maintained.
Eudiometric fermentation tanks and biogas storage tanks were equipped with competition systems and connections for communication and collection of biogas for research purposes. The system also allowed for periodic collection and testing of the produced biogas by the MSMR 16 analyser (Alter Bio MSMR 16)—DIN 38414 S.8.
The measurement of the concentrations of the component gases and the volume of biogas produced was carried out every 24 h to observe the response of the fermentation system to the reaction of the bacterial bed.
Biogas productivity tests were performed in repetitions; three repetitions for one mixture of nutrients, for statistical data processing and validation of results based on literature data.
To measure the concentrations of biogas components, chemoelectric and opto-electric measurement sensors of the MG-72 and MG-73 series were used with a measurement range of 0–100% of the volume and a measurement resolution of 0.1 ppm to 1% of the volume.
Based on laboratory tests and analysis of the state of knowledge [31,32], factors positively and negatively influencing the methane fermentation process were identified for the analysed substrate mixture.
The main factors that influenced the biogas production process of the tested substrate mixture were: dry matter content, organic matter content, sample mass, reaction rate, percentage of individual components in the fermentation mixture and the duration of the experiment. According to the established factors, the composition of the mixture and the conditions of the fermentation process for obtaining biogas were established.
The standards regulating the assessment of factors applied were: PN-74/C-04540/00, PN-75/C-04616/01–04, PN-90 C-04540/01.
During the research, the following types of renewable fuels produced on a laboratory scale were analysed: biomethane and bioethanol. The main emphasis was placed on estimating the impact of the fuel system used and the implementation of individual liquid and gaseous fuels on carbon dioxide emission levels.
During the research, it was decided not to compare the use of diesel engines due to the limited possibility of initiating the combustion of esterified vegetable oil and crude oil in a simplified power system. Analysis of the use of electricity and hydrogen in transport was also omitted due to the properties of the test SI combustion engine.
In the case of biomethane analysis, the results of our own tests at the stand for determining the calorific value of gas fuels were used.
The test bed was prepared using three substations per system for:
- -
- producing biomethane under laboratory conditions;
- -
- collection and pre-compression of biomethane;
- -
- energy utilization of biomethane using a reciprocating engine.
Biogas and biomethane, as components, were produced in a laboratory research stand of a quasi-continuous system (Figure 2). A reaction chamber with an active volume of 80 dm3 was used for the mesophilic fermentation process (Figure 4). The system was prepared to maintain thermal conditions at 35 °C and enabled testing and storage of biogas. The chamber filling level was lowered by 20% to limit the effects of foaming and the transport of hydrated pollutants directly to the biogas storage and analysis system.
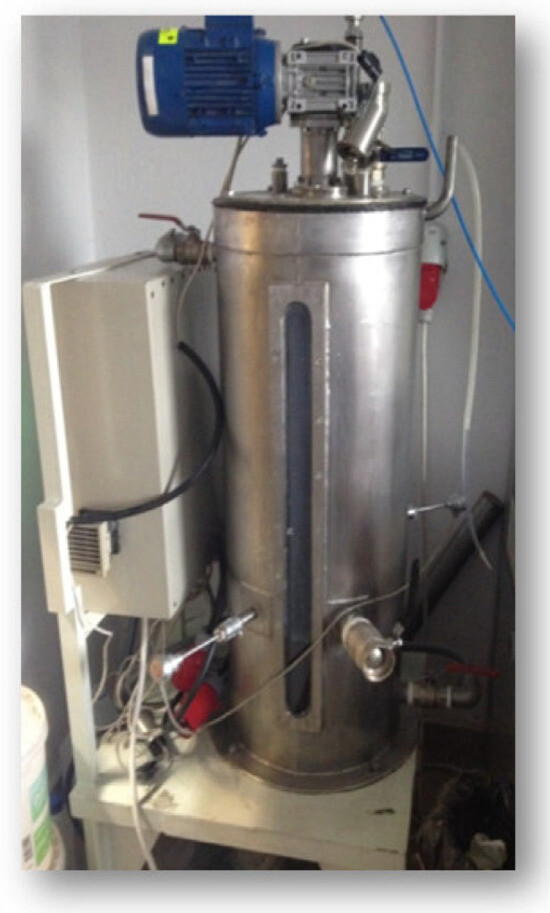
Figure 4.
Reaction chamber after a total volume of 80 dm3 (photo by Mariusz Adamski).
A mixture of organic substrates of agricultural origin was used in the study—Table 1. The composition of the ingredients included pig manure, beet pulp and maize silage. The mixture, with an initial moisture content of 7.8% m/m and a weight of almost 800 g, was scaled up for the active volume of the reaction chamber. The required amount of gaseous fuel for subsequent energy utilization was thus obtained.

Table 1.
Composition and properties of the starting organic substrate mixture for the methanation process [own research].
In order to test the emission levels of the flue gases, it was necessary to determine the chemical composition of the gases from the methane fermentation process. The testing of the concentrations of the constituent gases was carried out using the Alter s.a. GasHunter II 1.3 detector. This analyser enables the concentration of gases such as methane (0–100% v/v), carbon dioxide (0–100% v/v), hydrogen sulphide (0–500 ppm) and oxygen (0–22% v/v) to be measured.
The biogas was produced under laboratory conditions by anaerobic fermentation of agricultural biomass—Figure 5. From the fermenter space, the biogas was transferred via a gas pipe, with a slight overpressure (15 to 18 mbar), to the eudiometric tank. The eudiometric tank (biogas storage) works on the principle of a water trap. Several biogas tanks with a total volume of 7 dm3 were used. This enabled the initial storage of biogas with the possibility of controlling the available volume per time unit. The stored biogas volume was pumped from the eudiometric tank to a flexible tank. Finally, the biogas was stored in a hydrophore tank with a flexible diaphragm. This made it possible to stabilise the supply pressure of the internal combustion engine during its operation on the gaseous fuel stored in the tank. A diagram of the biogas extraction method was shown in the figure below.
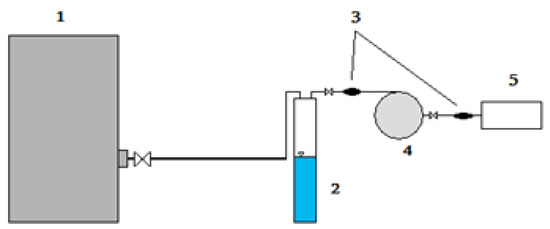
Figure 5.
Biogas extraction and compression stand for the internal combustion engine feed system (elaboration of a scheme by Marcin Herkowiak): 1—fermenter, 2—eudiometric pipe, 3—hand pump, 4—flexible tank, 5—hydrophore tank.
As a result of the fermentation process, biogas was extracted from the batch fermentation process. The gas used was that produced during a period of intensive biogas production, preceding the depletion of nutrients by the microorganisms and a decrease in the release of processed gases.
The biogas obtained at laboratory scale had an average methane content of 58%—Table 2. This was one of the laboratory-scale gases produced, which was selected as having the best parameters for testing with a power generator. The test also showed a carbon dioxide content of 40%. Hydrogen sulphide and ammonia concentrations were 30 ppm and 20 ppm.

Table 2.
Biogas and methane composition [own research].
In the case of biogas fuel, one of the biogas samples obtained was selected as representative for further study. The selection was guided by the highest possible methane content while keeping carbon dioxide and hydrogen sulfide content as low as possible.
2.2. Bioethanol Preparation and Testing
Preparation of bioethanol samples for energy utilization tests was carried out using waste substrate on a laboratory scale. A mixture of apples and potatoes in the form of damaged and waste material after sorting according to size classes and other quality characteristics was used for the study. The characteristics of the substrates are shown in Table 3.

Table 3.
Characterization of the analysed substrates with reference to a 100 g sample [own research].
Ethanol for food, fuel (bioethanol) and industrial purposes is obtained through alcoholic fermentation. After the fermentation process, the mash is distilled to separate the liquid mixture by evaporation and liquefaction of its components, and ethanol is obtained. The equipment chosen to carry out the distillation under laboratory conditions was a cold-finger distiller with a capacity of 30 dm3 (Figure 6). Distillation by means of a distiller equipped with a system of indirect separation of precipitates, so-called “cold fingers”, is the most efficient and effective in terms of the end result (level of impurities and alcohol concentration in the distillate) on a micro scale.
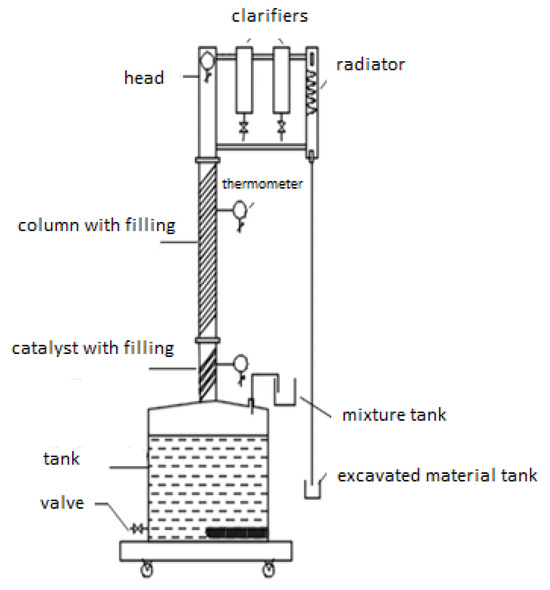
Figure 6.
Scheme of a laboratory scale distillation station [own research].
The mash distillation unit includes: main tank, catalyst, distillation column, head with clarifiers, counter-cooler (Figure 6). The technical characteristics of the cold-finger distiller were shown in Table 4.

Table 4.
Technical parameters of the “cold fingers” distiller [own research].
After testing the alcohol production process on a laboratory scale, samples with an alcohol concentration of more than 97% v/v were obtained. According to the characteristics of the distiller used in the study, a correctly made mash yields a high-quality distillate (more than 97% alcohol concentration in the distillate). The results obtained were treated as samples indicating the energy potential of the waste substrates tested (Table 5).

Table 5.
Comparison of volume of produced distillate and alcohol concentration for individual samples [own research].
2.3. Low-Power Generator Station for Fuel Usage and Emissions Research
The generator used for the tests has a maximum motor output of 2.2 kW. The maximum electrical output of the single-phase generator is 2.0 kWe.
The generator is equipped with a single-cylinder, four-stroke, air-cooled, spark-ignition engine. The generator’s parameters are shown in Table 6. The generator automatically adjusted its operation according to the applied load by selecting the engine speed to ensure smooth and efficient operation.

Table 6.
Selected technical parameters of the generator [own research].
In order to realize the research objective, the power system of the internal combustion engine was modified. A multi-fuel engine concept was realized with both gaseous and liquid fuels.
As a result of the modifications carried out, it became possible to provide the correct gas fuel output and pressure required for engine operation. As part of the feed system conversion, we modified components such as:
- -
- the gas metering stub;
- -
- the register;
- -
- the gas regulator;
- -
- the gas solenoid valve;
- -
- the STAG-2G switch;
- -
- the dirt filter;
- -
- the battery.
The conversion to the gas-fuelled form was proprietary and is not found in low-power generators in the broader range of offerings from manufacturers and distributors. The liquid-fuel–gas-fuel system is an innovative solution. Another example is the conversion of internal combustion engines to run on LPG but taking into account the dual-fuel nature and properties of LPG fuel, which is supplied to the system in liquid form and then converted for the combustion process to gaseous form.
The gaseous fuel metering port was integrated into the air filter to avoid modifications to the liquid fuel (gasoline) supply system—Figure 7. A register was incorporated to allow stepless adjustment of the fuel dose for the engine under load. A gas regulator was used to enable two-stage regulation of the gas pressure. At the same time, it is possible to regulate the fuel flow during changes in engine load. A gas solenoid valve was used for infinitely variable and remote control of the engine supply via generated pulses. The control pulses are generated by the STAG-2G switch, which makes it possible to change the type of fuel efficiently. At the same time, such a system positively influences the system’s operational safety by unambiguously cutting off fuel doses, both gaseous and liquid. The systems are equipped with a filter for solid and liquid impurities in the gas fuel. The operation of the solenoid valve and the switch is powered by a battery.
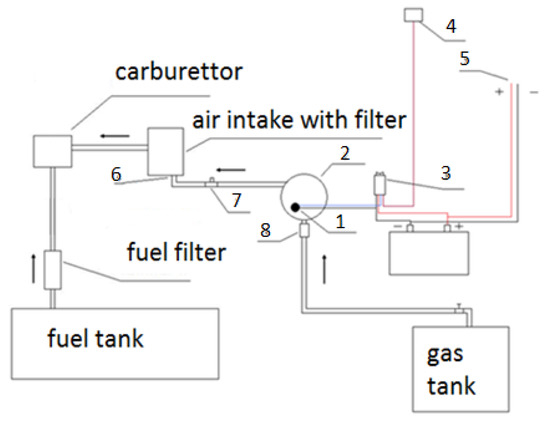
Figure 7.
Diagram of the gas supply system (elaboration of a scheme by Marcin Herkowiak): 1—gas solenoid valve, 2—regulator, 3—STAG2-G switch, 4—brown wire connecting the switch to the spark plug voltage, 5—12V DC intake from the unit, 6—gas spigot, 7—register, 8—gas filter.
The load effect of the generator was realized by connecting an electrical consumer with a continuously adjustable level of electrical consumption from 0 to 2000 W.
3. Results and Discussion
Exhaust emission tests were performed with four fuels, two liquid (gasoline, bioethanol) and two gaseous (biogas, natural gas—98% methane). Tests were conducted using fossil fuels (gasoline, natural gas) to compare them with renewable fuels (biogas, bioethanol).
The emission results are described on the basis of tests carried out using the MRU MGAprime multi-gas exhaust gas analyser. The following gases were analysed: CO, CO2, NOx, O2 and HC—Table 7.

Table 7.
Results of exhaust emission measurements [own research].
Once the genset engine had reached its nominal operating temperature of 90 °C, the measurement procedure began. Measurements were taken for six variants (three variants for each liquid and gaseous fuel):
- (a)
- Gasoline-fuelled engine at:
- -
- idling speed;
- -
- 50% load (1 kWe);
- -
- 100% load (2 kWe).
- (b)
- Biogas-fuelled engine at:
- -
- idling speed;
- -
- 50% load (1 kWe);
- -
- 100% load (2 kWe);
- -
- idling speed.
- (c)
- Bioethanol-fuelled engine at:
- -
- idling speed;
- -
- 50% load (1 kWe);
- -
- 100% load (2 kWe).
- (d)
- Natural gas (98% methane)-fuelled engine at:
- -
- idling speed;
- -
- 50% load (1 kWe);
- -
- 100% load (2 kWe).
For each variant, 10 measurements were taken at intervals of 10 s. The test results obtained were averaged and presented graphically. Only the load on the generator’s alternator was controlled. The generator automatically adjusted the correct fuel mixture and engine speed. In this way, the fuel–air mixture was optimised and was as close as possible to being stoichiometric. The excess lambda coefficient of the exhaust gas was checked during the test. Due to its purely control function, it was decided not to present its results in the paper.
3.1. Emissions at Idling Speed
It was decided to average the results of the test for the volumetric contents of carbon monoxide, carbon dioxide and oxygen in the exhaust gas and to present them in diagrams. In order to better compare the two power systems, the results were divided into three diagrams for the unloaded engine (idling), the 50% loaded engine and the 100% loaded engine. The results of the overall test are shown in Table 7.
In the case of the exhaust gas for the unloaded engine, significant differences can be seen in the content of the individual components of the exhaust gas (Figure 8). Significantly less carbon monoxide was produced in the exhaust gas from the combustion of natural gas and biogas than in the exhaust gas from running the engine on gasoline. This is because the methane contained in these gases burns more easily than the longer hydrocarbon chains present in liquid fuels. The carbon dioxide content was comparable in both cases. The apparent higher proportion of carbon dioxide in the flue gas from biogas combustion is due to the presence of this gas in the biogas fuel. The lowest proportion of oxygen in the flue gas was observed for bioethanol.
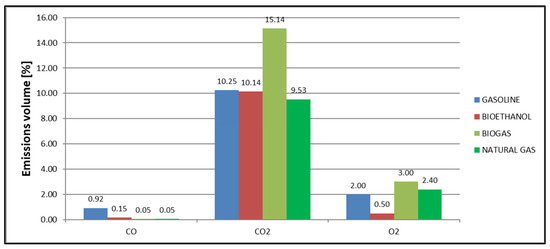
Figure 8.
Selected exhaust gas content for idling engine [own research].
The relatively high values for carbon monoxide and carbon dioxide in the exhaust gas from the combustion of gasoline in the engine can be explained by the fact that the standard power supply system for the generator is a carburettor. This system was used for liquid fuels during the tests. The carburettor is the simplest and most common power system in low-power engines. However, it has the disadvantage of poor fuel/air mixing compared to more modern injection systems.
3.2. Emissions at 50% Load
In the composition of the exhaust gas for an engine under a 1 kWe load, a difference is apparent for carbon monoxide, carbon dioxide and oxygen content. On average, almost five percentage points less carbon monoxide was formed in the exhaust gas from the combustion of bioethanol, biogas and natural gas than in the exhaust gas from the combustion of gasoline. The carbon dioxide content was lowest for the gasoline system (7.28%). This was followed by 9.77% for natural gas and 12.41% CO2 for bioethanol. The highest proportion of carbon dioxide in the exhaust gas was observed for biogas (16.18%). The proportion of oxygen in the exhaust gas resulting from the use of gasoline fuel was 11.00%, which was seven percentage points higher than for biogas. In the other cases, the oxygen content was 1.50% for bioethanol and 2.50% for natural gas, respectively. High values for both carbon monoxide and oxygen are evident in the gasoline engine results. In this case, related to the exhaust gas from gasoline combustion, we observe an anomaly related to the high content of both oxygen and carbon monoxide in the exhaust gas. A high oxygen content in the exhaust gas is indicative of a poor mixture, whereas a high CO content is indicative of incomplete combustion, which can in many cases be caused by an over-rich mixture (an excess of fuel relative to the amount of air). High values for both of these exhaust components indicate insufficient mixing of the fuel–air mixture. These parameters indicate that the carburettor system, despite the correct fuel/air ratios, did not ensure a sufficiently good mixing of these components. The generator automatically selected the throttle opening according to the applied load in such a way that the mixture was as close to stoichiometric as possible while ensuring that the power output was achieved. During additional tests during the ongoing tests at a load of 1 kWe, the results shown were repeated, confirming the theory of insufficient fuel mixing through the generator’s carburettor in the case of an incomplete load. During the checks, the excess lambda coefficient did not exceed a value of 1.20, which indicates that fuel–air mixture depletion was relatively small in this case. The measurement results were shown in Figure 9.
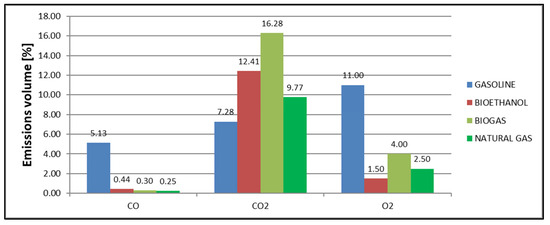
Figure 9.
Selected exhaust gas content for operating the engine at 50% load [own research].
3.3. Emissions at 100% Load
Analysing the concentrations of the constituent gases in the exhaust gas for an engine under a 2 kWe load shows significant differences for carbon monoxide, carbon dioxide and oxygen. The lowest carbon monoxide emissions were observed for natural gas and the highest for gasoline. With each fuel analysed, the content of this gas did not exceed 1.5%. The lowest value was obtained for natural gas—0.25%. The carbon dioxide content when fuelled with gasoline and bioethanol was comparable, at 7.76% and 7.90%, respectively. The lowest value was obtained with natural gas (6.90%) and the highest with biogas (18.30%). Again, as in previous cases, the presence of ballast in the biogas in the form of carbon dioxide is evident. It is also apparent that these emissions increase with load due to the higher fuel demand. The proportion of oxygen in the case of flue gases from the combustion of liquid fuels was comparable, at 3.50% for gasoline and 3.20% for bioethanol, respectively. The highest oxygen content was observed for biogas (5.00%). This is an understandable value due to the presence of carbon dioxide ballast in the biogas, making it difficult for methane to combine with oxygen. Excess oxygen in the flue gas when burning biogas is also characteristic of professional CHP systems. A lower oxygen content was observed in the case of natural gas (1.5%), due to the easy binding of oxygen with methane. The noticeably lower emissions for gasoline at full load on the alternator than at no load or half load indicate that the carburettor system fitted to the generator was designed for engine operation at full electrical load on the generator. The measurement results are shown in Figure 10.
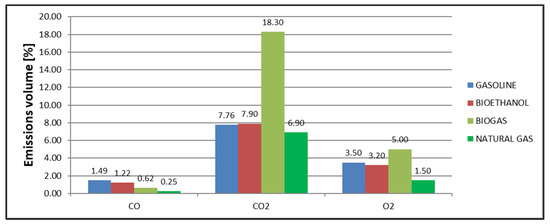
Figure 10.
Selected exhaust gas content for operating the engine at 100% load [own research].
For nitrogen oxide emissions, the highest emissions were observed for gasoline regardless of load. At this point, it should be mentioned that the generator did not have a catalytic converter system. There is a noticeable decrease in carbon monoxide emissions for renewable and gaseous fuels compared to gasoline. The main noticeable reason is most likely the shorter hydrocarbon chains. NOx emissions from natural gas were lower than for biogas. In the graph, it is noticeable that the shorter the hydrocarbon chains, the lower the NOx emissions (Figure 11).
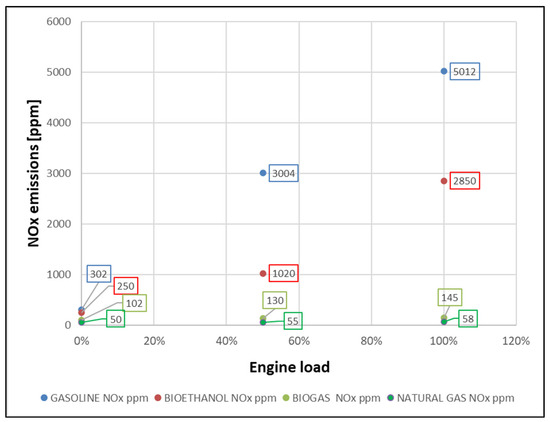
Figure 11.
NOx emissions depending on engine load [own research].
Hydrocarbon emissions indicate incomplete combustion/use of the fuel. Figure 12 shows the results of the test. At idle, the lowest emissions were obtained with natural gas (48 ppm), followed by biogas (55 ppm), then bioethanol (72 ppm), and the highest emissions were with gasoline (83 ppm).
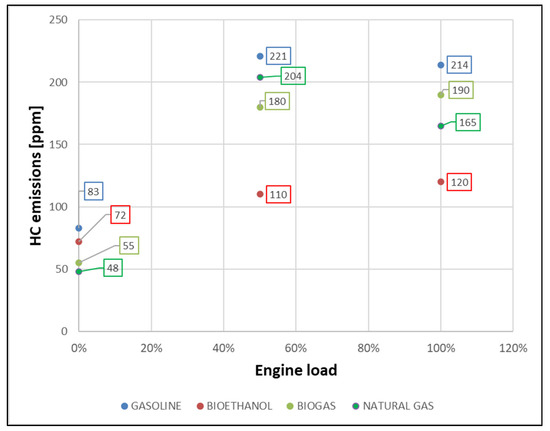
Figure 12.
HC emissions depending on engine load [own research].
It can be observed that the longer the hydrocarbon chains in the fuel, the higher the hydrocarbon emissions. When loading 1kWe for biotanol, the lowest result of 110 ppm was obtained. A similar situation can be observed at full load (120 ppm). The exception is biogas, which, due to its ballast content in the form of carbon dioxide, has properties that hinder the combustion of the fuel. The final state was characterised by quite high emissions at load—180 ppm at 1 kWe load and 190 ppm at 2 kWe load. Natural gas combustion at half load was 204 ppm, while at full load it dropped to 165 ppm. The lowest emissions were obtained for bioethanol fuel. The reason may be that the engine itself is better adapted to burning liquid fuels than gaseous ones. The highest unburned hydrocarbon emissions, irrespective of load, were for gasoline, probably due to the fact that the gasoline was fed through a carburettor system in a generator not equipped with an exhaust catalyst, so higher HC emissions are possible.
4. Discussion
Low- and medium-capacity generators are the usual solution for intermittent energy supply at the time of demand. Thus, the renewable energy produced at the time of demand does not need to be stored and is independent of weather factors.
The use of biofuels in this case could be one kind of solution for the development of renewable energy sources in the small-scale energy production sector.
When the engine was fuelled with gasoline, the standard fuel recommended by the generator’s manufacturer, high levels of both oxygen and carbon monoxide were noted in the exhaust gas during idling and at half load. These results improved significantly during full load of the generator. It is likely that the carburettor system was simply tuned for full engine load ensuring the best mixing of gasoline and air in that case.
A high oxygen content in the exhaust gases indicates a lean mixture, while a high CO content indicates incomplete combustion, which in many cases may be caused by too rich a mixture (excess fuel in relation to the amount of air). High values of both of these exhaust gas components indicates insufficient mixing of the fuel–air mixture. These parameters indicate that the carburettor system, despite the correct fuel/air proportions, did not ensure sufficient mixing of these components. The generator automatically adjusted the throttle opening depending on the applied load in such a way that the mixture was as close to stoichiometric as possible while ensuring the output power was achieved. During additional tests at a load of 1 kWe, the presented results were repeated, confirming the theory of insufficient fuel mixing by the generator’s carburettor in the event of a partial load. During the inspection, the lambda excess coefficient did not exceed 1.20, which proves that the loss of the fuel–air mixture in this case was relatively small. Noticeably lower CO emissions—1.49% for gasoline and 3.50% for oxygen—at full load of the alternator compared to the idle or half-load states indicate that the carburettor system installed in the generator was designed to operate the engine at full electrical load of the generator.
When running on bioethanol, more favourable results were observed than for gasoline in terms of carbon monoxide and oxygen content in the exhaust gas, especially at half load of the engine. Also, for the same reason, lower nitrogen oxide and hydrocarbon contents were noted. Celik [33,34] presented a study comparing the use of bioethanol with gasoline. As a result of the study, he obtained a 53% decrease in CO emissions with bioethanol compared to gasoline. NOx fell by 19%, while CO2 fell by 10% and HC by 12%. The results obtained in this work confirm these parameters with the exception of the CO2 content in the exhaust gas. At the same time, it should be noted that the total CO2 and CO content in the flue gas from the combustion of gasoline significantly exceeded that of bioethanol.
In the case of biogas, it was noticeable that there was a significant carbon dioxide content due to the presence of this gas as a component of this fuel. This component is ballast because it does not participate in the combustion reaction and hinders the combustion of methane. For this reason, the methane contained in the biogas may not be completely combusted. This is noticeable in the results of the oxygen content of the flue gas and the content of unburned hydrocarbons. Excess oxygen in the flue gas during biogas combustion is also observed in the case of larger small- and medium-scale CHP engines. Large CHP systems use advanced fuel mixers to reduce this problem. E. Porpatham et al. [35] studied the effect of increasing oxygen in the intake air on performance and emissions. As oxygen in the intake air increased, thermal efficiency and engine power increased. Unfortunately, the amount of nitrogen oxides also increased with increased oxygen. Also, in the case of the study presented in this thesis, the relationship with the amount of oxygen in the exhaust gas and NOx emissions in the case of biogas is noticeable.
The mentioned carbon dioxide emissions from the combustion of biogas and bioethanol are treated as so-called zero emissions due to the origin of these fuels from biomass processing. This is due to the use of carbon contained in biomass, which is part of the short carbon cycle, i.e., it prevents carbon deposited in fossil fuels from entering the cycle.
When burning natural gas, the lowest emissions were obtained. The reason for this was both the purity of the fuel and the ease of ignition and complete combustion. From the results, it can be seen that the fuel system developed by the authors for gaseous fuels fulfils its function. This is particularly evident in the case of NOx and HC content. In their study, Orhan Akansu et al. [36], among others, carried out exhaust emission tests from the combustion of methane only. They obtained comparable results for nitrogen oxides and slightly higher results for HC content.
The exhaust gas emission trends were compared with the test results of a 1.4 kW SI (spark-ignition engine) drive unit. In the tests, an exhaust gas temperature level of 450 °C was achieved. This level was maintained for all of the fuels analysed. Similar levels were analysed for the generator systems when analysing the fuel expenditure and load levels of the 1.4 kW drive unit. The drive unit’s normative fuel consumption, as claimed by the manufacturer, was 435 g/kWh.
As the load level of the drive unit increased, the CO2 emissions decreased by nearly 30% compared to the idle and 50% load level for gasoline, bioethanol and natural gas.
The CO emissions of the gasoline-fuelled drive unit decreased by nearly 70% as the load level was increased to the nominal level. The level of CO emissions is in line with the response to increasing the load level of the power unit for similar studies of low-power units.
HC emissions showed a decreasing trend for gasoline as load was increased from 50% to 100% of rated power (Figure 12). The best reduction effect was obtained for natural gas. The test results compared to the 1.4 kW SI drive unit showed a converging behaviour to the 2.2 kW drive unit.
NOx emissions of the propulsion unit remained similar for natural gas and biogas combustion as the unit load was increased from 50% to 100%. In this case, the trend of emission changes coincided with the trend recorded for the 1.4 kW SI (spark-ignition engine) drive unit [37].
The carbon dioxide content was lowest for natural gas with the exception of the 50% load case discussed above, where combustion of the gas was incomplete; the carbon dioxide emissions were lowest for gasoline. In this particular case, however, it must be assumed that, in the absence of this anomaly, the value of carbon dioxide emitted by the combustion of gasoline would have been significantly higher. This is to be suspected as a result of the significant carbon monoxide emissions in this case in the gasoline exhaust. Therefore, the lowest CO2 emissions can be presumed for natural gas.
This content made it difficult for the methane contained in the biogas to combine with oxygen, leaving unburned hydrocarbons in the flue gas. The lowest hydrocarbon emissions were observed for bioethanol. The likely reason for this is the better use of liquid fuel in the generator engine. The values for hydrocarbons in the flue gas at idle did not differ significantly from each other. The lowest value in this case was for natural gas (48 ppm) and the highest for gasoline (83 ppm). In the case of a 50% load, a greater range of results was already obtained: from 110 ppm for bioethanol, 180 ppm for biogas, 204 ppm for natural gas and 221 ppm for gasoline. At full load, again the lowest emission result was for bioethanol (120 ppm) and the highest for gasoline (214 ppm). The second highest result was for the HC content of the flue gas from biogas combustion (190 ppm), while the value was lower at 165 ppm for natural gas combustion.
In the case of bioethanol, as mentioned earlier, full utilisation of the fuel and lower emissions were observed than in the case of gasoline power. The CO emissions for bioethanol compared to gasoline were six times lower at idle, 11 times lower at 50% load and 20% lower at full load. For NOx emissions, on the other hand, the values obtained with bioethanol combustion were three times lower at 50% load and 1.75 times lower at full load. In the case of HC emissions, emissions from bioethanol were almost twice as low in both load cases.
For biogas, the emission parameters related to carbon monoxide and oxygen content in the flue gas are comparable to those obtained for natural gas. The exception is carbon dioxide emissions, which are highest due to the presence of this gas in the fuel. However, the carbon dioxide contained in biogas represents so-called zero emissions due to the origin of this gas from biomass and not from fossil fuels. Also, in the case of NOx and HC emissions, the results for biogas and natural gas are comparable. It must be presumed that if biogas is upgraded to biomethane, it will be possible to obtain results that are more similar to those of natural gas, especially in terms of carbon dioxide content.
The result of the tests was that the engine operated correctly with the aforementioned biofuels. It was possible to fully load the generator with each fuel type. The literature shows comparable emissions results and trends in their severity for low-power engines, despite the far-reaching interventions in the power supply system for the tests presented.
5. Conclusions
The following conclusions can be drawn from the results presented:
- (1)
- The possibility of using biofuels efficiently in both gaseous (biogas) and liquid (bioethanol) form was demonstrated. The developed and implemented system for supplying the generator with gaseous fuels based on a special pressure vessel and a demand-dependent pressure reduction system has fulfilled its function. The functionality of the system was also confirmed when natural gas was used. For each fuel tested, the nominal output of the generator could be achieved.
- (2)
- During the tests carried out on gasoline, some anomalies were noted with regard to oxygen and carbon monoxide emissions in the exhaust gas at 50% load (1 kWe). The oxygen content was 11.00%, while the carbon monoxide content was 5.13%, both of which were significant deviations from the rest of the fuels. In this case, related to the exhaust gas from gasoline combustion, we observe an anomaly related to the high content of both oxygen and carbon monoxide in the exhaust gas.
- (3)
- When the engine was fuelled with bioethanol, low carbon monoxide values were noted due to the shorter hydrocarbon chains in the fuel than in the case of gasoline and, most likely, the better adaptation of the generator engine itself to the combustion of liquid fuels, due to the more favourable exhaust results of bioethanol than gaseous fuels. For the engine at idle, CO emissions of 0.15% were obtained, while carbon dioxide emissions were 0.50%, which was the lowest of all fuels. At 50% load, carbon monoxide was 0.44% and oxygen was 1.50%. These values increased at full load to values of 1.22% for Co and 3.20% for O2, respectively. At the same time, with a high carbon dioxide content in the flue gas (second only to biogas), the best, most complete combustion of the fuels tested can be observed without residual oxygen.
- (4)
- The high carbon dioxide content of the exhaust gas when the engine was running on biogas was due to the carbon dioxide content of the fuel. When testing the biogas produced, a carbon dioxide content of 40% was found. When the engine was idling, the carbon dioxide content was 15.14%, at 50% load it was 16.28% and at full load 18.30%. It is apparent that emissions increase with increased fuel demand.
- (5)
- When the engine was fuelled with biogas, a higher proportion of oxygen was recorded than with the other fuels, as a result of inaccurate combustion of the methane contained in the biogas due to the carbon dioxide ballast hindering this. This is a characteristic phenomenon that also occurs on a full technical scale in CHP systems.
- (6)
- In the case of tests using natural gas, the lowest values of carbon monoxide emissions were observed; 0.05% at idle, 0.25% at 50% load, and at full load, respectively. The exhaust of this fuel had a relatively low oxygen content of 2.40% for idle, 2.50% for 50% load, and 1.50% for full load, respectively.
- (7)
- The highest emissions of nitrogen oxides were associated with the use of gasoline, 302 ppm at idle, 3004 ppm at 50% load and 5012 ppm at full load. The generator did not have a catalyst. In addition, the presence of long hydrocarbon chains favours the formation of nitrogen oxides during the combustion process. The lowest emissions of nitrogen oxides were observed for natural gas, 50 ppm at idle, 55 ppm at 50% load and 58 ppm at full load. In contrast, the second highest NOx emissions were obtained for bioethanol, 250 ppm at idle, 1020 ppm at 50% load and 2850 ppm at full load. Low NOx emissions, but higher than natural gas, were obtained for biogas, 102 ppm at idle, 130 ppm at 50% load and 145ppm at full load.
- (8)
- Hydrocarbon emissions were the highest for gasoline. The likely reason for this was that the gasoline supply was via a carburettor system, which has limitations due to the reduced accuracy of fuel/air mixing. Newer fuel systems provide greater accuracy and more satisfactory operating conditions. Slightly lower emissions could be observed for biogas. In this case, the reason was the ballast content of the fuel, in the form of at least carbon dioxide.
- (9)
- The study confirmed both the feasibility of using renewable fuels for low-power generators and their beneficial environmental impact. This includes the feasibility of using these fuels to their full potential found in the study.
Author Contributions
Conceptualization: M.H., M.A. and G.W.; methodology: M.H., M.A. and G.W.; software: M.H., M.A. and G.W.; validation: M.H., M.A., M.K., K.K. and G.W.; formal analysis: M.H., M.A., M.K., K.K. and G.W.; investigation: M.H., M.A., P.M., Z.J. and G.W.; resources: M.K., K.K., M.H., M.A., P.M. and G.W.; data curation: M.H., M.A. and G.W.; roles/writing—original draft preparation: M.H., M.A., P.M. and G.W.; writing—review and editing: G.W.; visualization: M.H., M.A., P.M. and G.W.; supervision: M.H., M.A. and G.W.; project administration: G.W.; funding acquisition: Z.J. All authors have read and agreed to the published version of the manuscript.
Funding
This study was conducted as part of a project financed by the National Center for Research and Development implemented under the BIOSTRATEG program, Contract no. BIOSTRATEG 1/269056/5/NCBR/2015, by (1) the Department of Technology, Poznan Branch, the Institute of Technology and Life Sciences—National Research Institute, Falenty, Poland, and in co-operation with (2) the University of Life Sciences in Lublin, Poland. The APC was funded by the University of Life Sciences in Lublin.
Data Availability Statement
The data presented in this study are available on request from the corresponding author.
Conflicts of Interest
The authors declare no conflict of interest.
References
- Papież, M.; Śmiech, S.; Frodyma, K. Determinants of renewable energy development in the EU countries. A 20-year perspective. Renew. Sustain. Energy Rev. 2018, 91, 918–934. [Google Scholar] [CrossRef]
- Wang, W.; Yuan, B.; Sun, Q.; Wennersten, R. Application of energy storage in integrated energy systems—A solution to fluctuation and uncertainty of renewable energy. J. Energy Storage 2022, 52, 104812. [Google Scholar] [CrossRef]
- Barabás, I.; Todoruţ, A.; Băldean, D. Performance and emission characteristics of an CI engine fueled with diesel–biodiesel–bioethanol blends. Fuel 2010, 89, 3827–3832. [Google Scholar] [CrossRef]
- Mączyńska, J.; Krzywonos, M.; Kupczyk, A.; Tucki, K.; Sikora, M.; Pińkowska, H.; Bączyk, A.; Wielewska, I. Production and use of biofuels for transport in Poland and Brazil—The case of bioethanol. Fuel 2019, 241, 989–996. [Google Scholar] [CrossRef]
- Muhajir, K.; Badrawada, I.G.; Susastriawan, A.A.P. Utilization of biogas for generator set fuel: Performance and emission characteristics. Biomass Convers. Biorefinery 2019, 9, 695–698. [Google Scholar] [CrossRef]
- Jeong, C.; Taesoo, T.; Lee, K.; Song, S.; Chun, K.M. Generating efficiency and emissions of a spark-ignition gas engine generator fuelled with biogas–hydrogen blends. Int. J. Hydrog. Energy 2009, 34, 9620–9627. [Google Scholar] [CrossRef]
- Kazimierowicz, J.; Dzienis, L.; Dębowski, M.; Zieliński, M. Optimisation of methane fermentation as a valorisation method for food waste products. Biomass Bioenergy 2021, 144, 105913. [Google Scholar] [CrossRef]
- Li, C.; He, P.; Peng, W.; Lü, F.; Du, R.; Zhang, H. Exploring available input variables for machine learning models to predict biogas production in industrial-scale biogas plants treating food waste. J. Clean. Prod. 2022, 380, 135074. [Google Scholar] [CrossRef]
- Yang, L.; Chen, L.; Li, H.; Deng, Z.; Liu, J. Lactic acid production from mesophilic and thermophilic fermentation of food waste at different pH. J. Environ. Manag. 2022, 304, 114312. [Google Scholar] [CrossRef]
- Zhang, H.; Wu, J.; Zhao, X.; Yan, O.; Yang, R.; Yan, J.; Yuan, X.; Cui, Z. Improving aerobic stability and methane production of maize stover silage with lactic acid bacteria inoculants: Focus on pentose-fermentation. Ind. Crops Prod. 2023, 201, 116861. [Google Scholar] [CrossRef]
- Gupta, P.; Kurien, C.; Mittal, M. Biogas (a promising bioenergy source): A critical review on the potential of biogas as a sustainable energy source for gaseous fuelled spark ignition engines. Int. J. Hydrog. Energy 2023, 48, 7747–7769. [Google Scholar] [CrossRef]
- Cabello, A.; Mendiara, T.; Abad, A.; Adánez, J. Techno-economic analysis of a chemical looping combustion process for biogas generated from livestock farming and agro-industrial waste. Energy Convers. Manag. 2022, 267, 115865. [Google Scholar] [CrossRef]
- Liu, Z.; Ahmad, M.; Li, G.; Yang, Y.; Liu, Y.; Gao, M.; Luo, Q. Decoupling of Greenhouse Gas Emissions from Livestock Industrial Development: Evidence from China Agricultural Green Development Modern Zone. Front. Environ. Sci. 2022, 10, 1563. [Google Scholar] [CrossRef]
- Zhuang, M.; Lu, X.; Caro, D.; Gao, J.; Zhang, J.; Cullen, B.; Li, Q. Emissions of Non-CO2 Greenhouse Gases from Livestock in China during 2000–2015: Magnitude, Trends and Spatiotemporal Patterns. J. Environ. Manag. 2019, 242, 40–45. [Google Scholar] [CrossRef] [PubMed]
- Llonch, P.; Haskell, M.J.; Dewhurst, R.J.; Turner, S.P. Current available strategies to mitigate greenhouse gas emissions in livestock systems: An animal welfare perspective. Animal 2016, 11, 274–284. [Google Scholar] [CrossRef] [PubMed]
- Tubiello, F.N.; Salvatore, M.; Rossi, S.; Ferrara, A.; Fitton, N.; Smith, P. The FAOSTAT database of greenhouse gas emissions from agriculture. Environ. Res. Lett. 2013, 8, 015009. [Google Scholar] [CrossRef]
- Scholwin, F.; Gattermann, H.; Schattauer, A.; Weiland, P. Installation Technique for Biogas Production, BIOGAS USE PRODUCTION; Institut für Energetik und Umwelt GmbH: Leipzig, Germany, 2008. [Google Scholar]
- Gajdzik, B.; Jaciow, M.; Wolniak, R.; Wolny, R.; Grebski, W.W. Assessment of Energy and Heat Consumption Trends and Forecasting in the Small Consumer Sector in Poland Based on Historical Data. Resources 2023, 12, 111. [Google Scholar] [CrossRef]
- Liu, T.; Zhang, Q.; Kang, X.; Hou, J.; Luo, T.; Zhang, Y. Household Food Waste to Biogas in Västerås, Sweden: A Comprehensive Case Study of Waste Valorization. Sustainability 2022, 14, 11925. [Google Scholar] [CrossRef]
- Thammasittirong, S.N.-R.; Chatwachirawong, P.; Khemdee, K.; Thammasittirong, A. Evaluating the Potential of Newly Developed Energy Cane Clones for First- and Second-Generation Ethanol Production. Fermentation 2023, 9, 267. [Google Scholar] [CrossRef]
- Ushikoshi, K.; Mori, K.; Watanabe, T.; Takeuchi, M. A 50 kg/day class test plant for methanol synthesis from CO2 and H2. Adv. Chem. Convers. Mitigating Carbon Dioxide 1998, 114, 357–362. [Google Scholar]
- European Commission. Non-Road Emissions-Mobile Machinery Emissions, Directives 97/68/EC 2012/46/EU. Available online: http://ec.europa.eu/growth/sectors/automotive/environment-protection/non-road-mobile-machinery/index_en.htm (accessed on 8 April 2015).
- Byun, J.S.; Park, J. Predicting the performance and exhaust NOX emissions of a spark-ignition engine generator fuelled with methane based biogases containing various amounts of CO2. J. Nat. Gas Sci. Eng. 2015, 22, 196–202. [Google Scholar] [CrossRef]
- Wang, L.; Emmerich, S.J.; Persily, A.K.; Lin, C.C. Carbon monoxide generation, dispersion and exposure from indoor operation of gasoline-powered electric generators under actual weather conditions. Build. Environ. 2012, 56, 283–290. [Google Scholar] [CrossRef]
- Newborough, M.; Peacock, A.D. Micro-generation systems and electrolysers for refuelling private bi-fuel cars at home. Int. J. Hydrog. Energy 2009, 34, 4438–4451. [Google Scholar] [CrossRef]
- Adamski MHerkowiak, M.; Mioduszewska, N.; Osuch, E.; Osuch, A.; Niedbała, G.; Magdalena Piekutowska, M.; Przygodziński, P. Analysis of the Possibilities of Using a Hybrid Heating System in the Process of Anaerobic Biomass Decomposition in Mesophilic Conditions. In Renewable Energy Sources: Engineering, Technology, Innovation; Wróbel, M., Jewiarz, M., Szlęk, A., Eds.; Springer Proceedings in Energy; Springer: Cham, Switzerland, 2020. [Google Scholar] [CrossRef]
- Czekała, W.; Pulka, J.; Jasiński, T.; Szewczyk, P.; Bojarski, W.; Jasiński, J. Waste as substrates for agricultural biogas plants: A case study from Poland. J. Water Land Dev. 2023, 56, 45–50. [Google Scholar] [CrossRef]
- Wałowski, G. Development of biogas and biorafinery systems in Polish rural communities. J. Water Land Dev. 2021, 49, 156–168. [Google Scholar] [CrossRef]
- Wałowski, G. Assessment of polydisperse substrate flow in a fermentor for computational fluid dynamics modelling. J. Water Land Dev. 2022. [Google Scholar] [CrossRef]
- KTBL-Heft 84 2009; Schwachstellen an Biogasanlagen Verstehen und Vermeiden. Kuratorium für Technik und Bauwesen in der Landwirtschafte. V. (KTBL): Darmstadt, Germany, 2009; 56p.
- Neri, A.; Bernardi, B.; Zimbalatti, G.; Benalia, S. An Overview of Anaerobic Digestion of Agricultural By-Products and Food Waste for Biomethane Production. Energies 2023, 16, 6851. [Google Scholar] [CrossRef]
- Corigliano, O.; Iannuzzi, M.; Pellegrino, C.; D’Amico, F.; Pagnotta, L.; Fragiacomo, P. Enhancing Energy Processes and Facilities Redesign in an Anaerobic Digestion Plant for Biomethane Production. Energies 2023, 16, 5782. [Google Scholar] [CrossRef]
- Celik, M.B. Experimental determination of suitable ethanol–gasoline blend rate at high compression ratio for gasoline engine. Appl. Therm. Eng. 2008, 28, 396–404. [Google Scholar] [CrossRef]
- Thangavelu, S.K.; Ahmed, A.S.; Ani, F.N. Review on bioethanol as alternative fuel for spark ignition engines. Renew. Sustain. Energy Rev. 2016, 56, 820–835. [Google Scholar] [CrossRef]
- Porpatham, E.; Ramesh, A.; Nagalingam, B. Experimental studies on the effects of enhancing the concentration of oxygen in the inducted charge of a biogas fuelled spark ignition engine. Energy 2018, 142, 303–312. [Google Scholar] [CrossRef]
- Akansu, S.O.; Kahraman, N.; Çeper, B. Experimental study on a spark ignition engine fuelled by methane–hydrogen mixtures. Int. J. Hydrog. Energy 2007, 32, 4279–4284. [Google Scholar] [CrossRef]
- Buchalik, R.; Buczkowski, D.; Przybyła, G. Laboratory tests of small power generator driven by SI engine. Combust. Engines 2015, 162, 752–759. [Google Scholar]
Disclaimer/Publisher’s Note: The statements, opinions and data contained in all publications are solely those of the individual author(s) and contributor(s) and not of MDPI and/or the editor(s). MDPI and/or the editor(s) disclaim responsibility for any injury to people or property resulting from any ideas, methods, instructions or products referred to in the content. |
© 2023 by the authors. Licensee MDPI, Basel, Switzerland. This article is an open access article distributed under the terms and conditions of the Creative Commons Attribution (CC BY) license (https://creativecommons.org/licenses/by/4.0/).