

Environmental External Production Costs of Extracts Derived from Poplar-Containing Bioactive Substances


Abstract
:1. Introduction
2. Materials and Methods
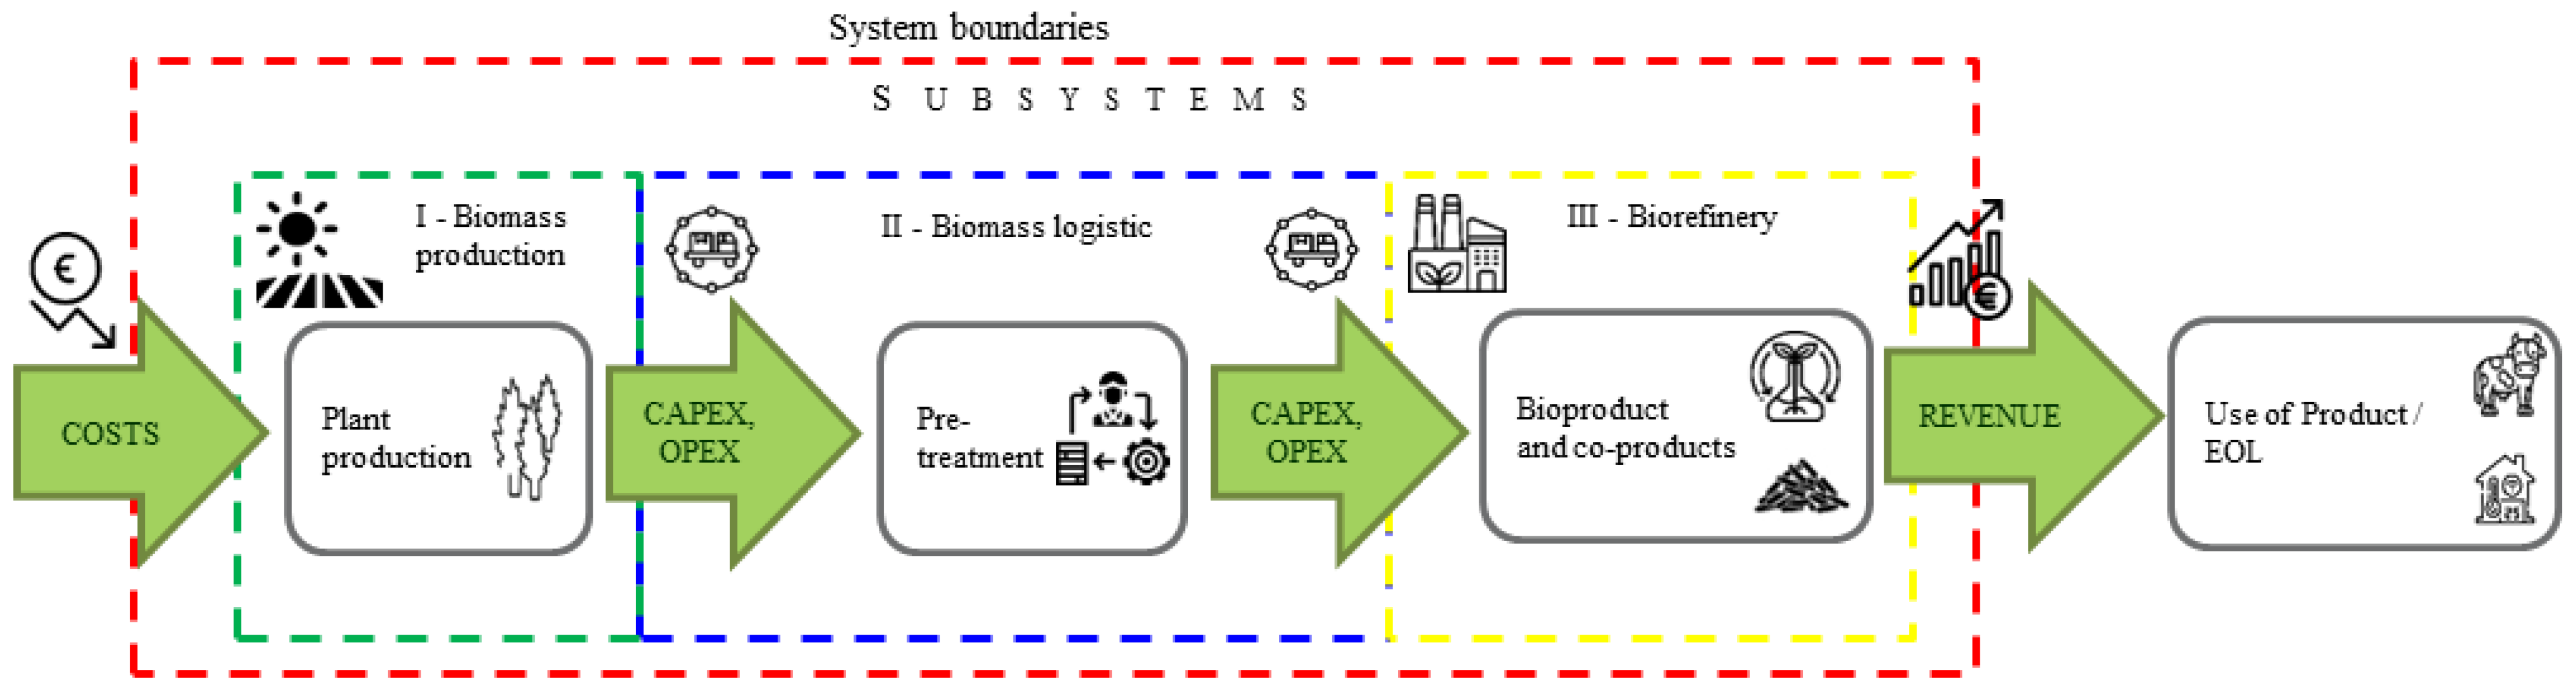
2.1. Scope
2.2. Costs Analysis
2.3. Profitability Analysis
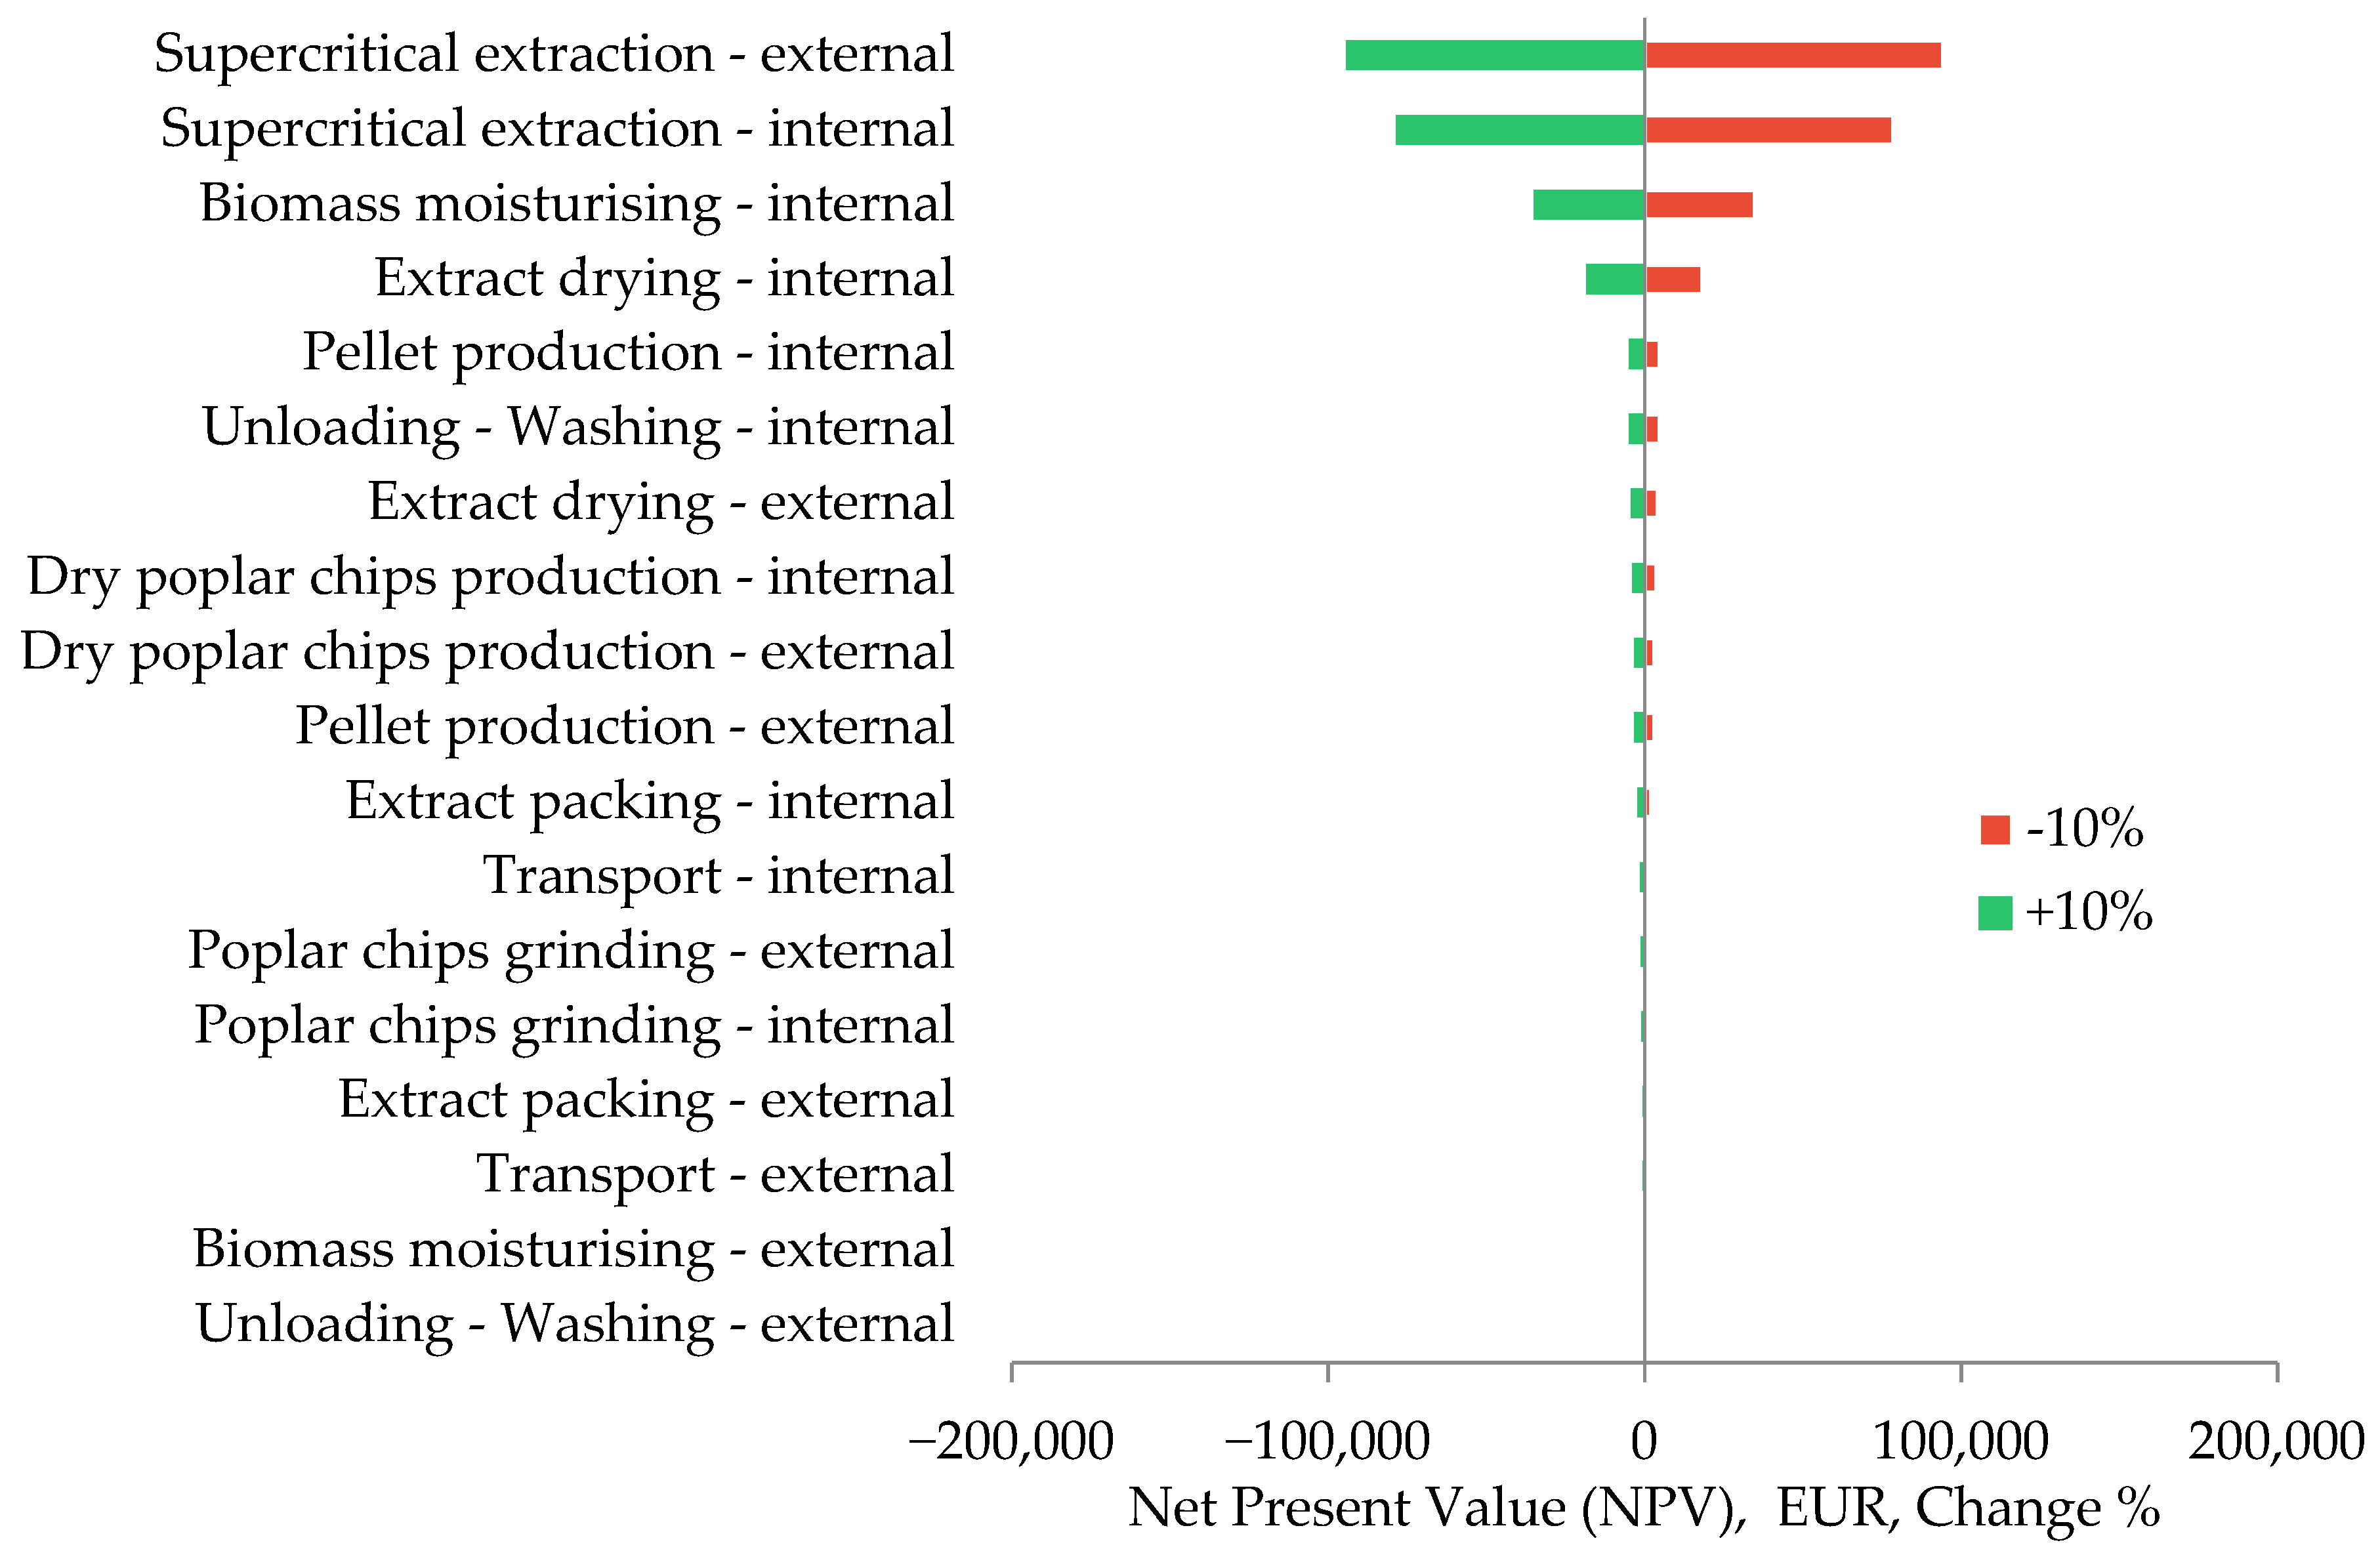
2.4. Sensitivity Analysis
2.5. Statistical Analysis
3. Results and Discussion
3.1. Cost Analysis
3.2. Profitability Analysis
3.3. Sensitivity Analysis
3.4. Statistical Analysis
4. Conclusions
Author Contributions
Funding
Data Availability Statement
Acknowledgments
Conflicts of Interest
References
- Hamelin, L.; Borzęcka, M.; Kozak, M.; Pudełko, R. A spatial approach to bioeconomy: Quantifying the residual biomass potential in the EU-27. Renew. Sustain. Energy Rev. 2019, 100, 127–142. [Google Scholar] [CrossRef]
- Cosentino, S.L.; Testa, G.; Scordia, D.; Alexopoulou, E. Future yields assessment of bioenergy crops in relation to climate change and technological development in Europe. Ital. J. Agron. 2012, 7, 22. [Google Scholar] [CrossRef]
- McKenney, D.W.; Yemshanou, D.; Fraleigh, S.; Allen, D.; Preto, F. An economic assessment of the use of short-rotation coppice woody biomass to heat greenhouses in southern Canada. Biomass Bioenergy 2011, 35, 374–384. [Google Scholar] [CrossRef]
- Olba-Zięty, E.; Stolarski, M.J.; Krzyżaniak, M. Economic evaluation of the production of perennial crops for energy purposes—A review. Energies 2021, 14, 7147. [Google Scholar] [CrossRef]
- Stolarski, M.J.; Rosenqvist, H.; Krzyżaniak, M.; Szczukowski, S.; Tworkowski, J.; Gołaszewski, J.; Olba-Zięty, E. Economic comparison of growing different willow cultivars. Biomass Bioenergy 2015, 81, 210–215. [Google Scholar] [CrossRef]
- Stanton, B.J.; Bourque, A.; Coleman, M.; Eisenbies, M.; Emerson, R.M.; Espinoza, J.; Gantz, C.; Himes, A.; Rodstrom, A.; Shuren, R.; et al. The practice and economics of hybrid poplar biomass production for biofuels and bioproducts in the Pacific Northwest. Bioenergy Res. 2021, 14, 543–560. [Google Scholar] [CrossRef]
- San Miguel, G.; Corona, B.; Ruiz, D.; Landholm, D.; Laina, R.; Tolosana, E.; Sixto, H.; Canellas, I. Environmental, energy and economic analysis of a biomass supp chain based on a poplar short rotation coppice in Spain. Ind. Crop. Prod. 2015, 94, 93–101. [Google Scholar] [CrossRef]
- Acuna, E.; Rubilar, R.; Cancino, J.; Albaugh, T.J.; Maier, C.A. Economic assessment of Eucalyptus globulus short rotation energy crops under contrasting silvicultural intensities on marginal agricultural land. Land Use Policy 2018, 76, 329–337. [Google Scholar] [CrossRef]
- Tyśkiewicz, K.; Konkol, M.; Kowalski, R.; Rój, E.; Warmiński, K.; Krzyżaniak, M.; Gil, Ł.; Stolarski, M.J. Characterization of bioactive compounds in the biomass of black locust, poplar and willow. Trees Struct. Funct. 2019, 33, 1235–1263. [Google Scholar] [CrossRef]
- Peng, W.; Li, D.; Zhang, M.; Mo, S.G.B.; Li, S.; Ohkoshi, M. Characteristics of antibacterial molecular activities in poplar wood extractives. Saudi J. Biol. Sci. 2017, 24, 399–404. [Google Scholar] [CrossRef]
- Ostolski, M.; Adamczak, M.; Brzozowski, B.; Wiczkowski, W. Antioxidant activity and chemical characteristics of supercritical CO2 and water extracts from willow and poplar. Molecules 2021, 26, 545. [Google Scholar] [CrossRef] [PubMed]
- Walter, M.; Brzozowski, B.; Adamczak, M. Effect of supercritical extract from black poplar and basket willow on the quality of natural and probiotic drinkable yogurt. Animals 2021, 11, 2997. [Google Scholar] [CrossRef] [PubMed]
- Devappa, R.K.; Rakshit, S.K.; Dekker, R.F.H. Forest biorefinery: Potential of poplar phytochemicals as value-added co-products. Biotechnol. Adv. 2015, 33, 681–716. [Google Scholar] [CrossRef] [PubMed]
- Kuś, P.; Jerković, I.; Jakovljević, M.; Jokić, S. Extraction of bioactive phenolics from black poplar (Populus nigra L.) buds by supercritical CO2 and its optimization by response surface methodology. J. Pharm. Biomed. 2018, 152, 128–136. [Google Scholar] [CrossRef]
- Kuś, P.M.; Okińczyc, P.; Jakovljević, M.; Jokić, S.; Jerković, I. Development of supercritical CO2 extraction of bioactive phytochemicals from black poplar (Populus nigra L.) buds followed by GC–MS and UHPLC-DAD-QqTOF-MS. J. Pharm. Biomed. 2018, 158, 15–27. [Google Scholar] [CrossRef]
- D’Amato, D.; Gaio, M.; Semenzin, E. A review of LCA assessments of forest-based bioeconomy products and processes under an ecosystem services perspective. Sci. Total Environ. 2020, 706, 135859. [Google Scholar] [CrossRef]
- Degieter, M.; Gellynck, X.; Goyal, S.; Ott, D.; De Steur, H. Life cycle cost analysis of agri-food products: A systematic review. Sci. Total Environ. 2022, 850, 158012. [Google Scholar] [CrossRef]
- Albuquerque, T.L.M.; Mattos, C.A.; Scur, G.; Kissimoto, K. Life cycle costing and externalities to analyze circular economy strategy: Comparison between aluminum packaging and tinplate. J. Clean. Prod. 2019, 234, 477–486. [Google Scholar] [CrossRef]
- Stern, N. The economics of climate change. Am. Econ. Rev. 2008, 98, 1–37. [Google Scholar] [CrossRef]
- Zhang, Q.; Meng, X.; Shi, S.; Kan, L.; Chen, R.; Kan, H. Overview of particulate air pollution and human health in China: Evidence, challenges, and opportunities. Innovation 2022, 3, 100312. [Google Scholar] [CrossRef]
- Ko, U.W.; Kyung, S.Y. Adverse Effects of Air Pollution on Pulmonary Diseases. Tuberc. Respir. Dis. 2022, 85, 313–319. [Google Scholar] [CrossRef]
- Drudi, F.; Moench, E.; Holthausen, C.; Weber, P.-F.; Ferrucci, G.; Setzer, R.; Nino, V.D.; Barbiero, F.; Faccia, D.; Breitenfellner, A. Climate Change and Monetary Policy in the Euro Area; European Central Bank: Frankfurt am Main, Germany, 2021. [Google Scholar]
- He, L.Y.; Ou, J.J. Pollution emissions, environmental policy, and marginal abatement costs. Int. J. Environ. Health Res. 2017, 14, 1509. [Google Scholar] [CrossRef] [PubMed]
- Carlqvist, K.; Wallberg, O.; Lidén, G.; Börjesson, P. Life cycle assessment for identification of critical aspects in emerging technologies for the extraction of phenolic compounds from spruce bark. J. Clean. Prod. 2022, 333, 130093. [Google Scholar] [CrossRef]
- Khoo, H.H.; Eufrasio-Espinosa, R.M.; Koh, L.S.C.; Sharratt, P.N.; Isoni, V. Sustainability assessment of biorefinery production chains: A combined LCA-supply chain approach. J. Clean. Prod. 2019, 235, 1116–1137. [Google Scholar] [CrossRef]
- Canaj, K.; Mehmeti, A.; Berbel, J. The economics of fruit and vegetable production irrigated with reclaimed water incorporating the hidden costs of life cycle environmental impacts. Resources 2021, 10, 90. [Google Scholar] [CrossRef]
- Canaj, K.; Mehmeti, A.; Morrone, D.; Toma, P.; Todorović, M. Life cycle-based evaluation of environmental impacts and external costs of treated wastewater reuse for irrigation: A case study in southern Italy. J. Clean. Prod. 2021, 293, 126142. [Google Scholar] [CrossRef]
- Santoso, A.D. Life Cycle Costing and Externalities of Palm Biodiesel and Algae Biodiesel in Indonesia. Int. J. Sci. Technol. Manag. 2013, 2, 6–15. [Google Scholar]
- Finnveden, G. A Critical Review of Operational Valuation/Weighting Methods for Life Cycle Assessment; Preparation; Påuppdrag av AFN vid Naturvårdsverket; Stockholm 1999. Swedish Environmental Protection Agency. Available online: https://citeseerx.ist.psu.edu/document?repid=rep1&type=pdf&doi=14af1db100de8156498cd151cf73480311c9954f (accessed on 11 February 2023).
- Johansson, J. A Monetary Valuation Weighting Method for Life Cycle Assessment Based on Environmental Taxes and Fees. Master’s Thesis, Department of Systems Ecology, Stockholm University, Stockholm, Sweden, 1999. [Google Scholar]
- Amadei, A.M.; De Laurentiis, V.; Sala, S. A review of monetary valuation in life cycle assessment: State of the art and future needs. J. Clean. Prod. 2021, 329, 129668. [Google Scholar] [CrossRef]
- Finnveden, G.; Eldh, P.; Johansson, J. Weighting in LCA based on ecotaxes: Development of a mid-point method and experiences from case studies. Int. J. LCA 2006, 11, 81–88. [Google Scholar] [CrossRef]
- Finnveden, G.; Håkansson, C.; Noring, M. A new set of valuation factors for LCA and LCC based on damage costs: Ecovalue 2012. In Perspectives on Managing Life Cycles: Proceedings of the 6th International Conference on Life Cycle Management, Gothenburg, Sweden, 25–28 August 2013; Association LCM: Lambersart, France, 2013; pp. 197–200. [Google Scholar]
- Vogtländer, J.G.; Brezet, H.C.; Hendriks, C.F. The virtual eco-costs ‘99 A single LCA-based indicator for sustainability and the eco-costs-value ratio (EVR) model for economic allocation. Int. J. LCA 2001, 6, 157–166. [Google Scholar] [CrossRef]
- Steen, B. A systematic approach to environmental priority strategies in product development (EPS). In Version 2000—Models and Data of Default Method; Chalmers Tekniska Högsk: Gothenburg, Sweden, 1999; p. 67. [Google Scholar]
- De Bruyn, S.; Bijleveld, M.; de Graaff, L.; Schep, E.; Schroten, A.; Vergeer, R.; Ahdour, S. Environmental Prices Handbook Eu28 Version—Methods and Numbers for Valuation of Environmental Impacts; CE Delft: Delft, The Netherlands, 2018. [Google Scholar]
- Ferreira, S.; Cabral, M.; da Cruz, N.F.; Marques, R.C. Economic and environmental impacts of the recycling system in Portugal. J. Clean. Prod. 2014, 79, 219–230. [Google Scholar] [CrossRef]
- Itsubo, N.; Murakami, K.; Kuriyama, K.; Yoshida, K.; Tokimatsu, K.; Inaba, A. Development of weighting factors for G20 countries—Explore the difference in environmental awareness between developed and emerging countries. Int. J. LCA 2018, 23, 2311–2326. [Google Scholar] [CrossRef]
- Itsubo, N.; Sakagami, M.; Kuriyama, K.; Inaba, A. Statistical analysis for the development of national average weighting factors-visualization of the variability between each individual’s environmental thought. Int. J. LCA 2012, 17, 488–498. [Google Scholar] [CrossRef]
- Jolliet, O.; Margni, M.; Charles, R.; Humbert, S.; Payet, J.; Rebitzer, G.; Rosenbaum, R. IMPACT 2002+: A new life cycle impact assessment methodology. Int. J. LCA 2003, 8, 324–330. [Google Scholar] [CrossRef]
- Bickel, P.; Friedrich, R. ExternE Externalities of Energy: Methodology 2005 Update (9279004239); European Communities: Brussels, Belgium, 2005. [Google Scholar]
- Weidema, B.P. Using the budget constraint to monetarise impact assessment results. Ecol. Econ. 2009, 68, 1591–1598. [Google Scholar] [CrossRef]
- Rosenbaum, R.K.; Bachmann, T.M.; Gold, L.S.; Huijbregts, M.A.; Jolliet, O.; Juraske, R.; Koehler, A.; Larsen, H.F.; MacLeod, M.; Margni, M.; et al. USEtox—The UNEP-SETAC toxicity model: Recommended characterisation factors for human toxicity and freshwater ecotoxicity in life cycle impact assessment. Int. J. LCA 2008, 13, 532–546. [Google Scholar] [CrossRef]
- Pizzol, M.; Weidema, B.; Brandão, M.; Osset, P. Monetary valuation in Life Cycle Assessment: A review. J. Clean. Prod. 2015, 86, 170–179. [Google Scholar] [CrossRef]
- Arendt, R.; Bachmann, T.M.; Motoshita, M.; Bach, V.; Finkbeiner, M. Comparison of different monetization methods in LCA: A review. Sustainability 2020, 12, 10493. [Google Scholar] [CrossRef]
- Jorli, M.; Van Passel, S.; Sadeghi Saghdel, H. External costs from fossil electricity generation: A review of the applied impact pathway approach. Energy Environ. 2018, 29, 635–648. [Google Scholar] [CrossRef]
- Sovacool, B.K.; Kim, J.; Yang, M. The hidden costs of energy and mobility: A global meta-analysis and research synthesis of electricity and transport externalities. Energy Res. Soc. Sci. 2021, 72, 101885. [Google Scholar] [CrossRef]
- Fersi, S.; Chtourou, N. Internalizing the external costs of renewable energy projects through stepwise method—A comparative study. J. Clean. Prod. 2022, 371, 133607. [Google Scholar] [CrossRef]
- Olba-Zięty, E.; Stolarski, M.J.; Krzyżaniak, M.; Gołaszewski, J. Environmental external cost of poplar wood chips sustainable production. J. Clean. Prod. 2020, 252, 119854. [Google Scholar] [CrossRef]
- Olba-Zięty, E.; Stolarski, M.J.; Krzyżaniak, M.; Warmiński, K. Willow Cultivation as Feedstock for Bioenergy-External Production Cost. Energies 2020, 13, 4799. [Google Scholar] [CrossRef]
- Saosee, P.; Sajjakulnukit, B.; Gheewala, S.H. Environmental externalities of wood pellets from fast-growing and para-rubber trees for sustainable energy production: A case in Thailand. Energy Convers. Manag. 2022, 14, 100183. [Google Scholar] [CrossRef]
- Rodríguez-Vallejo, D.F.; Guillén-Gosálbez, G.; Chachuat, B. What Is the True Cost of Producing Propylene from Methanol? The Role of Externalities. ACS Sustain. Chem. Eng. 2020, 8, 3072–3081. [Google Scholar] [CrossRef]
- Tobiszewski, M.; Bystrzanowska, M. Monetary values estimates of solvent emissions. Green Chem. 2020, 22, 7983–7988. [Google Scholar] [CrossRef]
- Eidelwein, F.; Collatto, D.C.; Rodrigues, L.H.; Lacerda, D.P.; Piran, F.S. Internalization of environmental externalities: Development of a method for elaborating the statement of economic and environmental results. J. Clean. Prod. 2018, 170, 1316–1327. [Google Scholar] [CrossRef]
- Olba-Zięty, E.; Stolarski, M.J.; Krzyżaniak, M.; Rój, E.; Tyśkiewicz, K.; Łuczyński, M.K. Supercritical production of extract from poplar containing bioactive substances—An economic analysis. Ind. Crops Prod. 2022, 184, 115094. [Google Scholar] [CrossRef]
- Ponsioen, T.; Nuhoff-Isakhanyan, G.; Vellinga, T.; Baltussen, W.; Boone, K.; Woltjer, G. Monetisation of Sustainability Impacts of Food Production and Consumption; Wageningen Economic Research: The Hague, The Netherlands, 2020. [Google Scholar] [CrossRef]
- Viganó, J.; Zabot, G.L.; Martínez, J. Supercritical fluid and pressurized liquid extractions of phytonutrients from passion fruit by-products: Economic evaluation of sequential multi-stage and single-stage processes. J. Supercrit. Fluids. 2017, 122, 88–98. [Google Scholar] [CrossRef]
- Bryła, P. Marketing Regionalnych i Ekologicznych Produktów Żywnościowych. Perspektywa Sprzedawcy i Konsumenta (Marketing of Regional and Organic Food Products. Seller and Consumer Perspective); Wydawnictwo Uniwersytetu Łódzkiego: Łódź, Poland, 2015. [Google Scholar]
- Lu, K.; Jiang, X.; Yu, J.; Tam VW, Y.; Skitmore, M. Integration of life cycle assessment and life cycle cost using building information modeling: A critical review. J. Clean. Prod. 2021, 285, 125438. [Google Scholar] [CrossRef]
- Eurostat. Share of RES in Electricity Generation from all Sources. 2023. Available online: https://ec.europa.eu/eurostat/web/energy/data/shares (accessed on 11 February 2023).
- Saosee, P.; Sajjakulnukit, B.; Gheewala, S.H. Environmental and socio-economic assessment of wood pellet production from fast growing trees in Thailand. IOP Conf. Ser. Earth Environ. Sci. 2020, 463, 012049. [Google Scholar] [CrossRef]
- Stolarski, M.J.; Krzyżaniak, M.; Szczukowski, S.; Tworkowski, J.; Załuski, D.; Bieniek, A.; Gołaszewski, J. Effect of increased soil fertility on the yield and energy value of short-rotation woody crops. Bioenergy Res. 2015, 8, 1136–1147. [Google Scholar] [CrossRef]
- Epstein, P.R.; Buonocore, J.J.; Eckerle, K.; Hendryx, M.; Stout Iii, B.M.; Heinberg, R.; Clapp, R.W.; May, B.; Reinhart, N.L.; Ahern, M.M. Full cost accounting for the life cycle of coal. Ann. N. Y. Acad. 2011, 1219, 73–98. [Google Scholar] [CrossRef] [PubMed]
- Treyer, K.; Bauer, C.; Simons, A. Human health impacts in the life cycle of future European electricity generation. Energy Policy 2014, 74, S31–S44. [Google Scholar] [CrossRef]
- De Marco, I.; Riemma, S.; Iannone, R. Life cycle assessment of supercritical CO2 extraction of caffeine from coffee beans. J. Supercrit. Fluids 2018, 133, 393–400. [Google Scholar] [CrossRef]
- Panzella, L.; Moccia, F.; Nasti, R.; Marzorati, S.; Verotta, L.; Napolitano, A. Bioactive Phenolic Compounds From Agri-Food Wastes: An Update on Green and Sustainable Extraction Methodologies. Front. Nutr. 2020, 7, 60. [Google Scholar] [CrossRef]
- Albuquerque, C.L.C.; Meireles, M.A.A. Defatting of annatto seeds using supercritical carbon dioxide as a pretreatment for the production of bixin: Experimental, modeling and economic evaluation of the process. J. Supercr. Fluids 2012, 66, 86–95. [Google Scholar] [CrossRef]
- Todd, R.; Baroutian, S. A techno-economic comparison of subcritical water, supercritical CO2 and organic solvent extraction of bioactives from grape marc. J. Clean. Prod. 2017, 158, 349–358. [Google Scholar] [CrossRef]
- Canabarro, N.I.; Veggi, P.C.; Vardanega, R.; Mazutti, M.A.; Ferreira, M.D.C. Techno-economic evaluation and mathematical modeling of supercritical CO2 extraction from Eugenia uniflora L. leaves. J. Appl. Res. Med. Aromat. Plants. 2020, 18, 100261. [Google Scholar] [CrossRef]
- Liu, W.; Wang, J.; Richard, T.L.; Hartley, D.S.; Spatari, S.; Volk, T.A. Economic and life cycle assessments of biomass utilization for bioenergy products. Biofuel Bioprod. Biorefin. 2017, 11, 633–647. [Google Scholar] [CrossRef]
- Miškolci, S. Consumer preferences and willingness to pay for the health aspects of food. Acta Univ. Agric. Silvic. Mendel. Brun. 2011, 59, 167–176. [Google Scholar] [CrossRef]


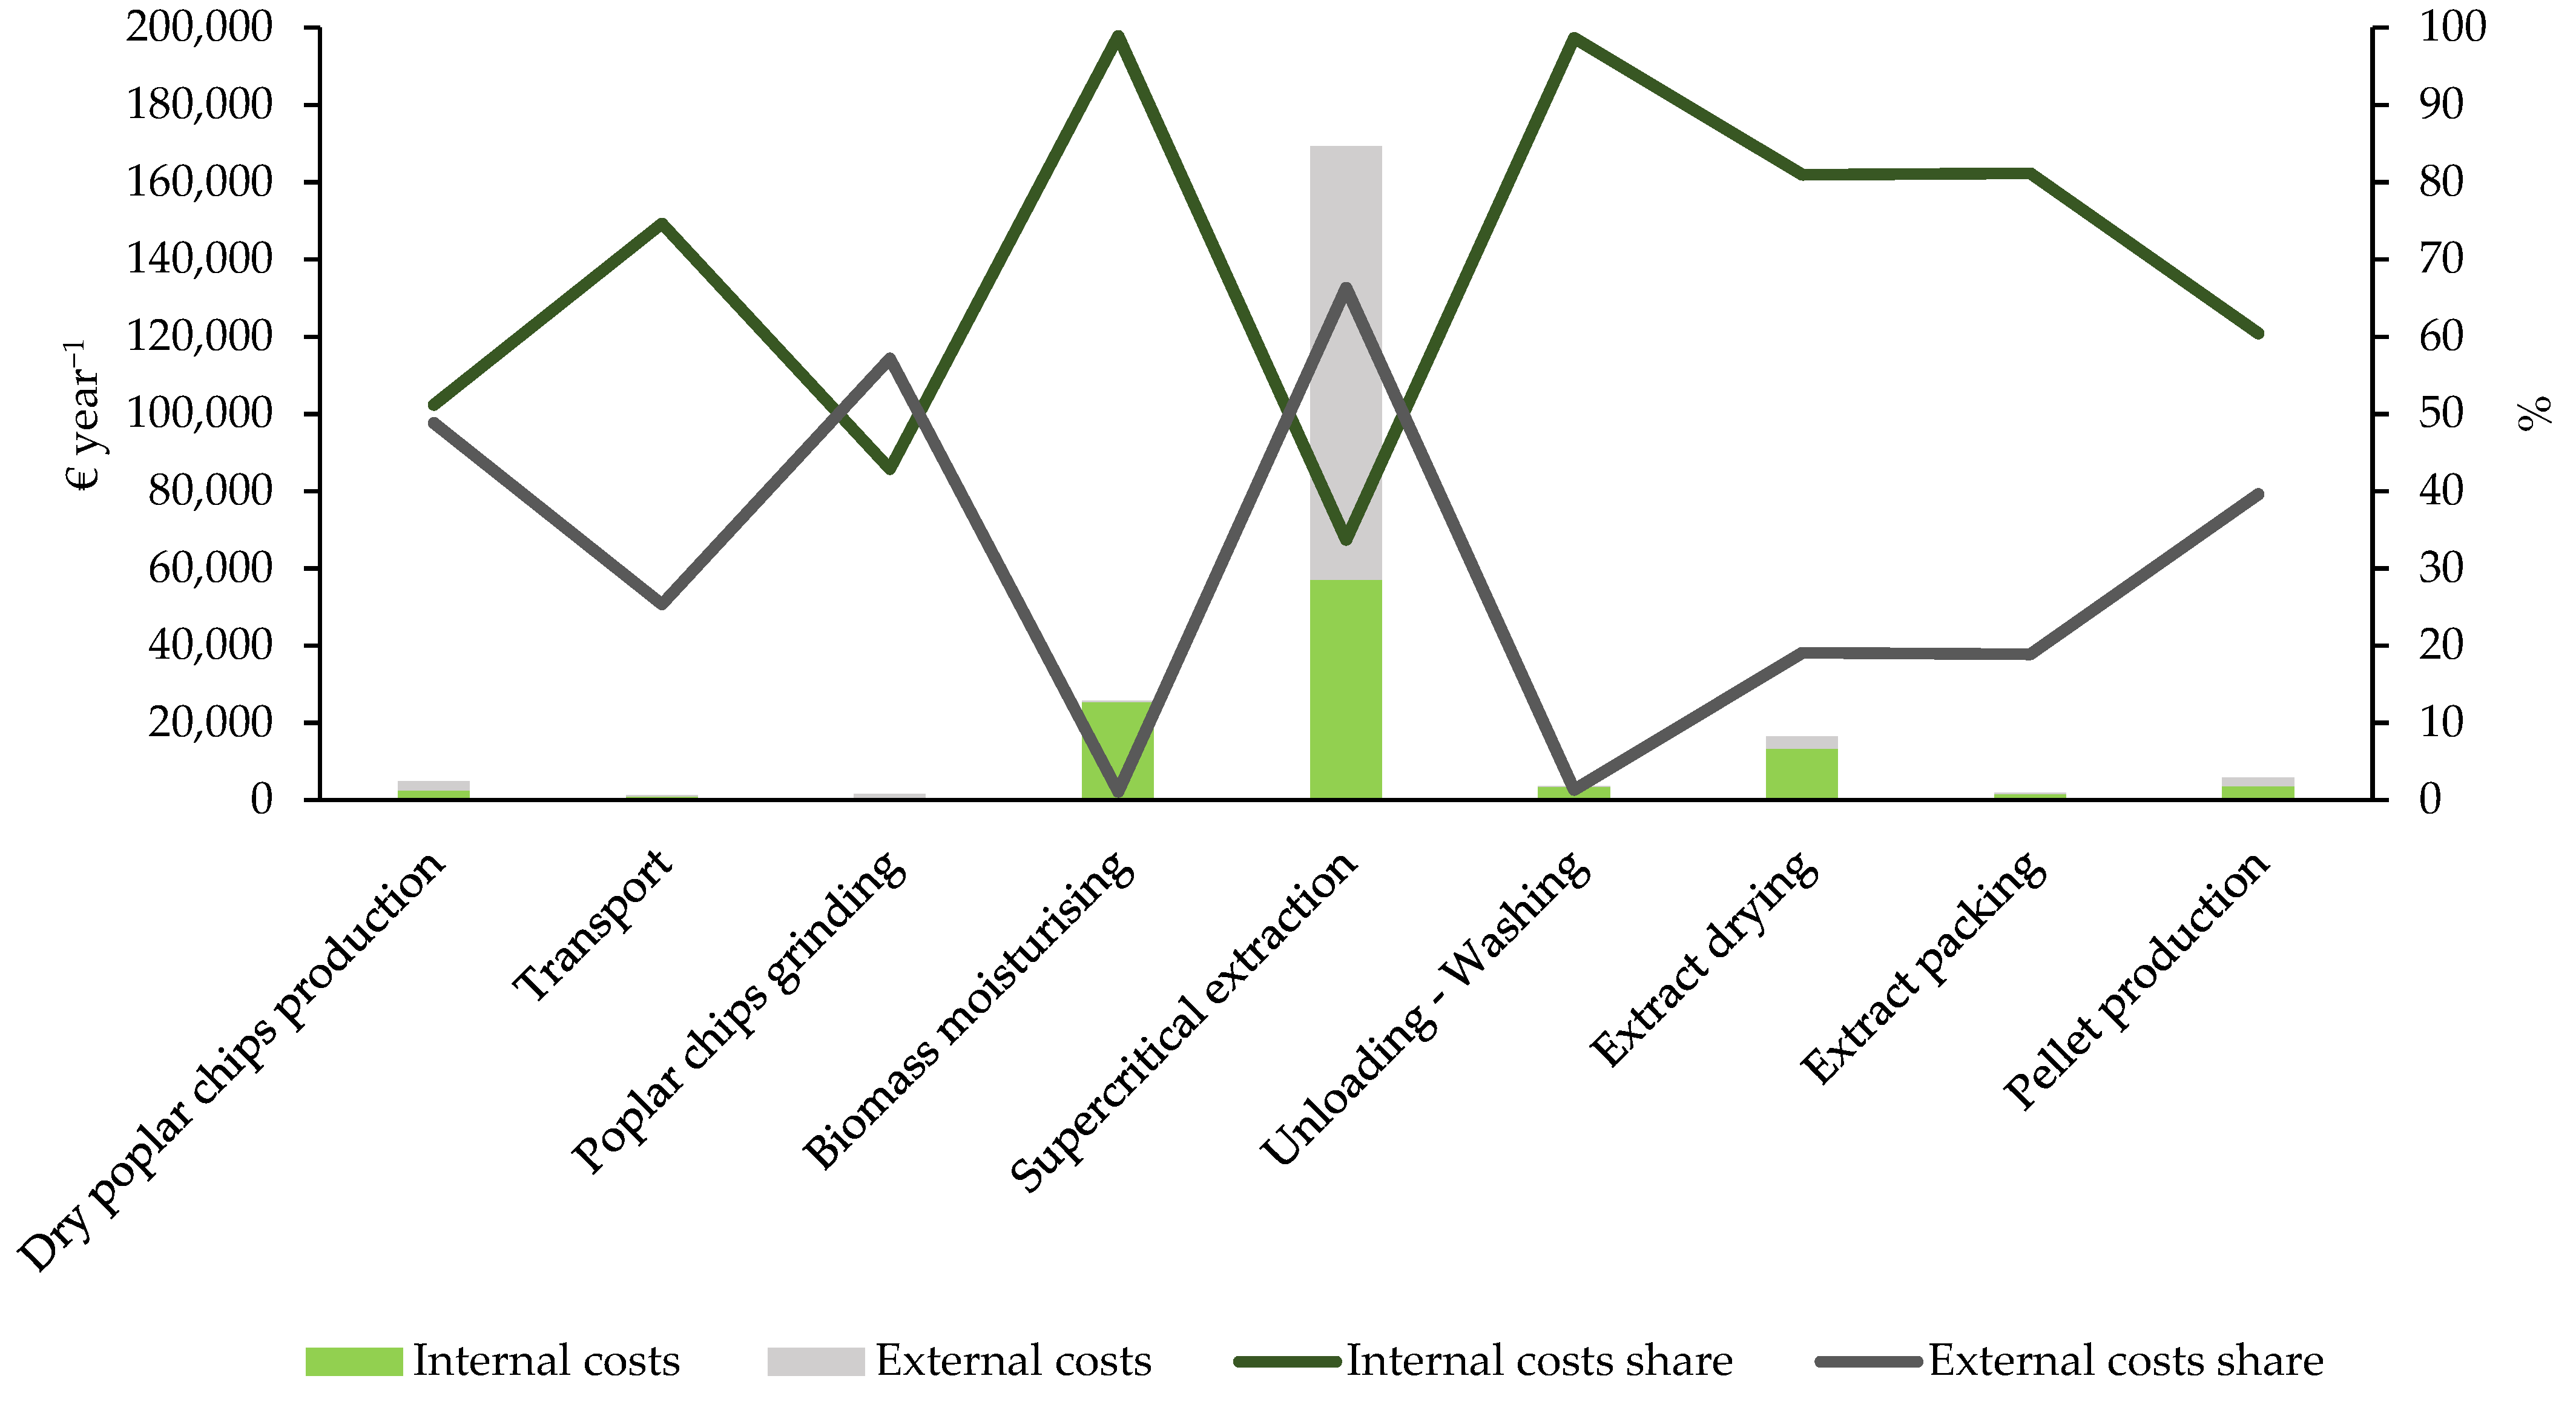
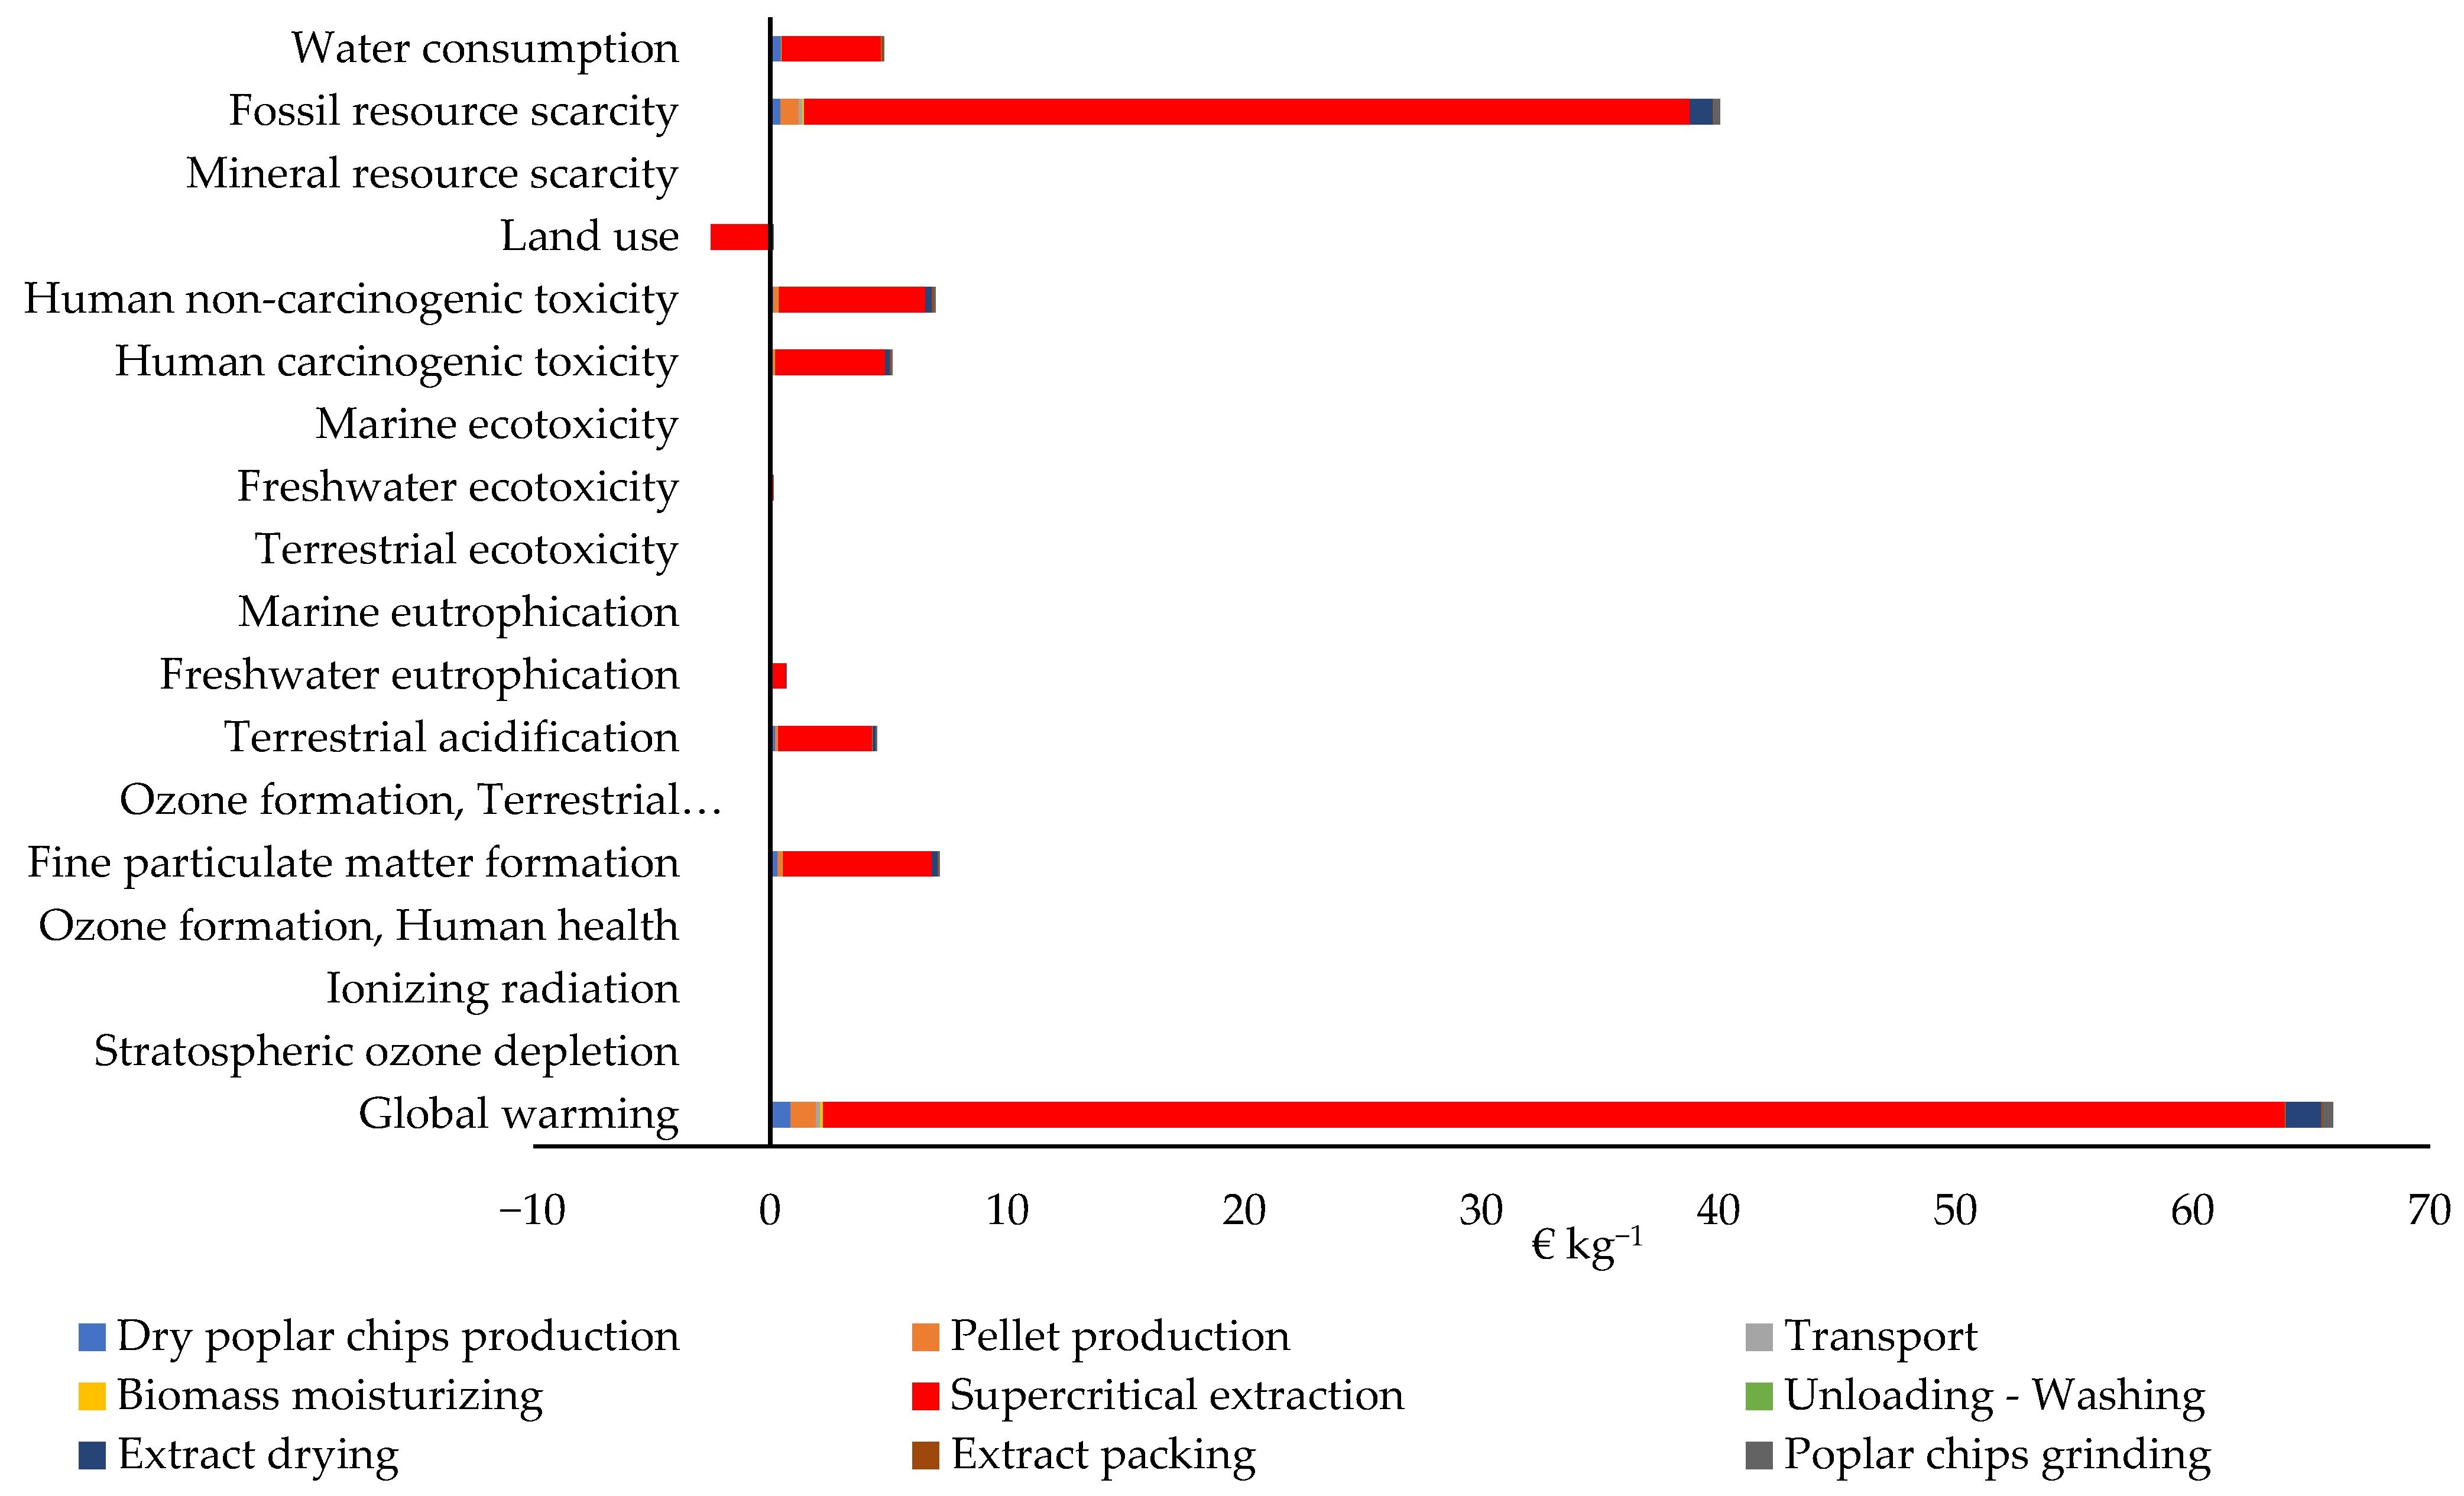
| Impact Category | Poplar Chip Production | Transport | Poplar Chip Grinding | Biomass Moisturization | Supercritical Extraction 1 | Supercritical Extraction 2 | Unloading–Washing | Extract Drying | Extract Packing | Pellet Production |
|---|---|---|---|---|---|---|---|---|---|---|
| Global warming | 0.8568 | 0.1662 | 0.4254 | 0.1305 | 61.6528 | 63.7162 | 0.0181 | 1.5099 | 0.0802 | 1.0865 |
| Stratospheric ozone depletion | 0.0062 | 0.0000 | 0.0000 | 0.0000 | 0.0013 | 0.0035 | 0.0001 | 0.0001 | 0.0000 | 0.0001 |
| Ionizing radiation | 0.0006 | 0.0000 | 0.0000 | 0.0000 | 0.0068 | 0.0092 | 0.0000 | 0.0001 | 0.0000 | 0.0001 |
| Ozone formation, Human health | 0.0035 | 0.0002 | 0.0004 | 0.0001 | 0.0321 | 0.0428 | 0.0000 | 0.0013 | 0.0001 | 0.0010 |
| Fine particulate matter formation | 0.3256 | 0.0170 | 0.0703 | 0.0214 | 6.2667 | 7.4585 | 0.0030 | 0.2494 | 0.0136 | 0.1810 |
| Ozone formation, Terrestrial ecosystems | 0.0005 | 0.0000 | 0.0001 | 0.0000 | 0.0046 | 0.0061 | 0.0000 | 0.0002 | 0.0000 | 0.0001 |
| Terrestrial acidification | 0.2215 | 0.0075 | 0.0400 | 0.0122 | 3.9716 | 4.2524 | 0.0031 | 0.1421 | 0.0059 | 0.1046 |
| Freshwater eutrophication | 0.0052 | 0.0002 | 0.0073 | 0.0022 | 0.6340 | 0.6487 | 0.0001 | 0.0257 | 0.0007 | 0.0168 |
| Marine eutrophication | 0.0006 | 0.0000 | 0.0007 | 0.0002 | 0.0601 | 0.0638 | 0.0018 | 0.0025 | 0.0001 | 0.0030 |
| Terrestrial ecotoxicity | 0.0038 | 0.0026 | 0.0005 | 0.0002 | 0.0661 | 0.0914 | 0.0001 | 0.0018 | 0.0012 | 0.0019 |
| Freshwater ecotoxicity | 0.0028 | 0.0002 | 0.0015 | 0.0005 | 0.1251 | 0.1321 | 0.0000 | 0.0054 | 0.0011 | 0.0033 |
| Marine ecotoxicity | 0.0005 | 0.0001 | 0.0003 | 0.0001 | 0.0246 | 0.0261 | 0.0000 | 0.0011 | 0.0002 | 0.0006 |
| Human carcinogenic toxicity | 0.0673 | 0.0056 | 0.0524 | 0.0161 | 4.6468 | 4.8414 | 0.0007 | 0.1860 | 0.0625 | 0.1261 |
| Human non-carcinogenic toxicity | 0.1546 | 0.0130 | 0.0766 | 0.0229 | 6.1530 | 6.7379 | 0.0084 | 0.2718 | 0.0809 | 0.1849 |
| Land use | 0.0486 | 0.0047 | 0.0086 | 0.0026 | −2.5122 | 0.8514 | 0.0002 | 0.0304 | 0.0019 | 0.0480 |
| Mineral resource scarcity | 0.0121 | 0.0008 | 0.0004 | 0.0001 | 0.0306 | 0.0420 | 0.0000 | 0.0015 | 0.0424 | 0.0026 |
| Fossil resource scarcity | 0.4482 | 0.1486 | 0.2745 | 0.0819 | 37.3313 | 38.7412 | 0.0000 | 0.9744 | 0.0317 | 0.7646 |
| Water consumption | 0.4640 | 0.0001 | 0.0038 | 0.0127 | 4.2008 | 4.2095 | 0.0160 | 0.0134 | 0.0677 | 0.0090 |
| Total | 2.622 | 0.367 | 0.963 | 0.304 | 122.696 | 131.874 | 0.052 | 3.417 | 0.390 | 2.534 |
| Price (€ kg−1) | BM I | BM II | BM I EU | BM II EU |
|---|---|---|---|---|
| Minimum | 159 | 158 | 159 | 159 |
| Expected Value | 359 | 313 | 267 | 265 |
| Maximum | 500 | 500 | 500 | 500 |
| Standard Deviation | 58.2 | 50.7 | 43.3 | 42.9 |
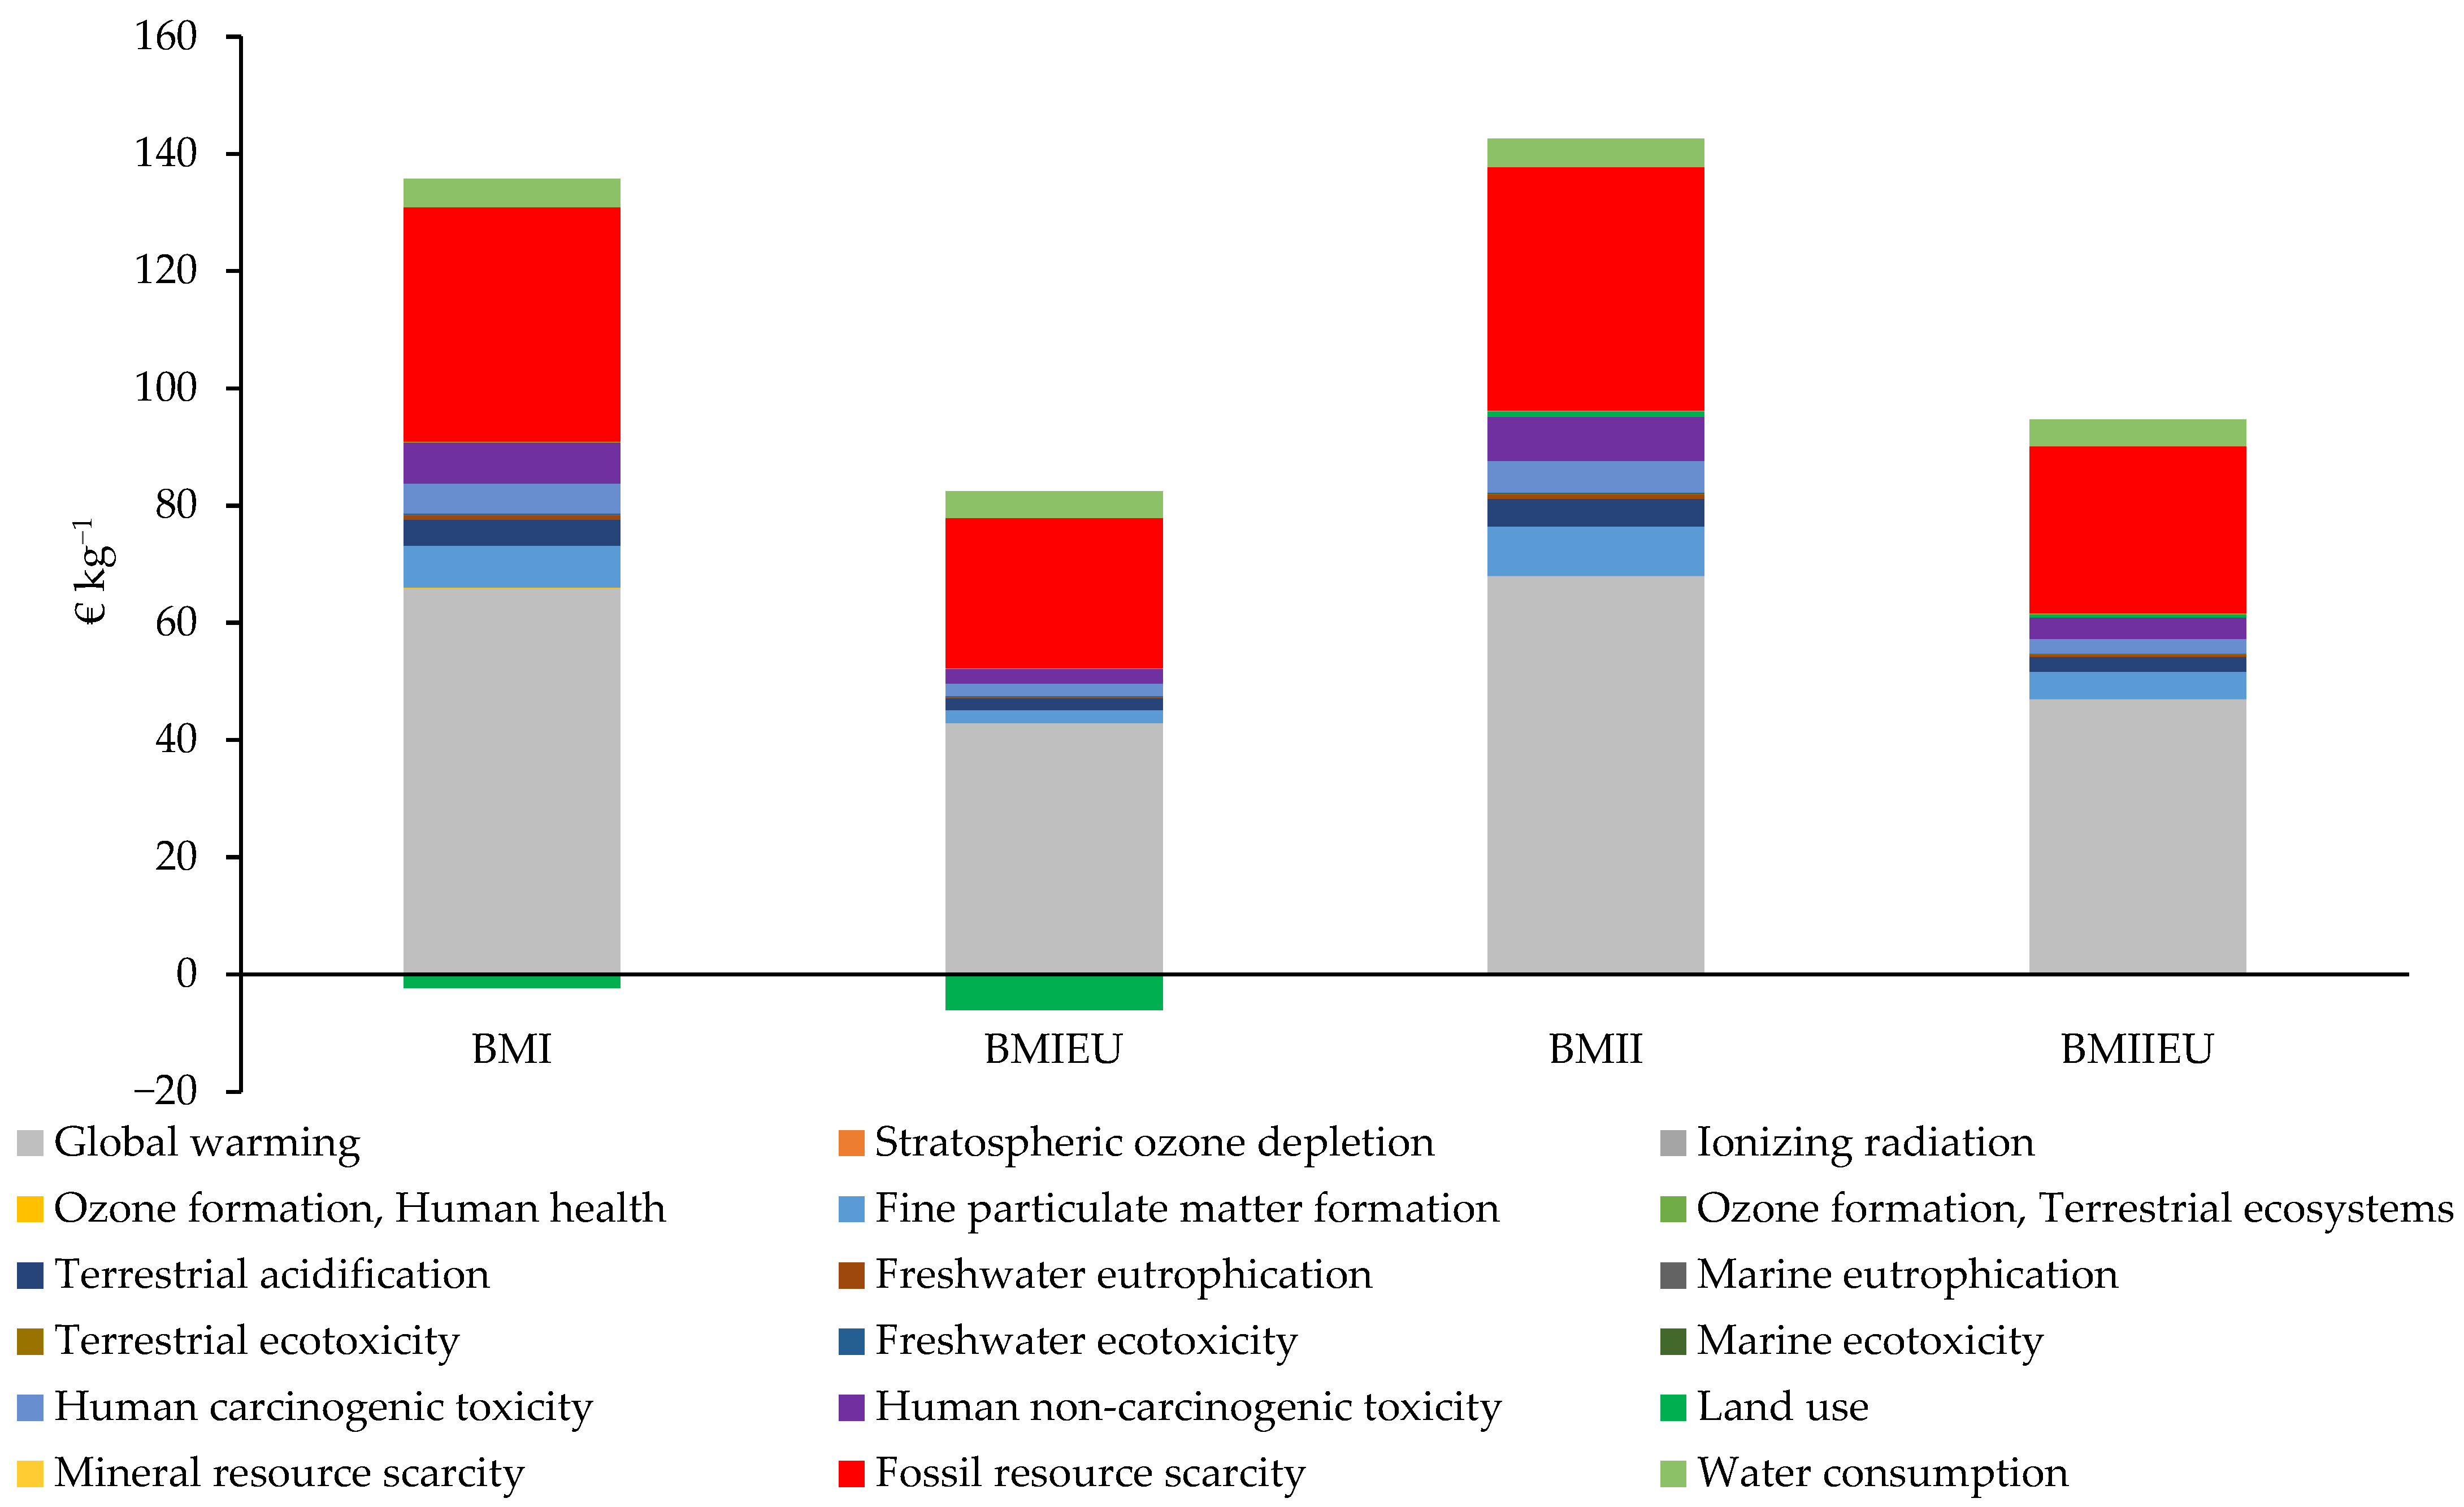
| Cost Estimates | Unit | BM I | BM II | BM I EU | BM II EU |
|---|---|---|---|---|---|
| Internal cost | € year−1 | 105,300 | 105,300 | 105,300 | 105,300 |
| External cost | € year−1 | 122,011 | 130,408 | 78,231 | 86,629 |
| Total cost | € year−1 | 227,311 | 235,708 | 183,531 | 191,929 |
| Internal cost—subsystem I | € year−1 | 2515 | 2515 | 2515 | 2515 |
| External cost—subsystem I | € year−1 | 2399 | 2399 | 2399 | 2399 |
| Total cost—subsystem I | € year−1 | 4914 | 4914 | 4914 | 4914 |
| Internal cost—subsystem II | € year−1 | 1649 | 1649 | 1649 | 1649 |
| External cost—subsystem II | € year−1 | 1217 | 1217 | 1217 | 1217 |
| Total cost—subsystem II | € year−1 | 2866 | 2866 | 2866 | 2866 |
| Internal cost—subsystem III | € year−1 | 101,136 | 101,136 | 101,136 | 101,136 |
| External cost—subsystem III | € year−1 | 118,395 | 126,793 | 74,615 | 83,013 |
| Total cost—subsystem III | € year−1 | 222,676 | 231,074 | 178,897 | 187,295 |
| LCC internal cost | € kg−1 | 146 | 144 | 146 | 144 |
| LCC external cost | € kg−1 | 113 | 123 | 73 | 82 |
| LCC total cost | € kg−1 | 259 | 267 | 219 | 226 |
| Region | 2018 | 2019 | 2020 | 2021 |
|---|---|---|---|---|
| Poland | 13.03 | 14.36 | 16.24 | 17.17 |
| European Union | 32.13 | 34.09 | 37.41 | 37.51 |
| Items | Net Present Value (€) | |||||
|---|---|---|---|---|---|---|
| Changing, % | −20 | −10 | 0 | 10 | 20 | |
| Change in discount rate | BM I | 76,796 | 37,148 | 0 | −34,834 | −67,525 |
| Change in income | −857,492 | −393,353 | 0 | 392,836 | 785,673 | |
| Change in CAPEX | 159,082 | 79,541 | 0 | −79,541 | −159,082 | |
| Change in OPEX | 635,363 | 317,682 | 0 | −317,682 | −683,949 | |
| Change in discount rate | BM II | 76,780 | 37,140 | 0 | −34,827 | −67,511 |
| Change in income | −896,334 | −409,988 | 0 | 408 785 | 817,569 | |
| Change in CAPEX | 159,082 | 79,541 | 0 | −79,541 | −159,082 | |
| Change in OPEX | 626,591 | 313,296 | 0 | −313,296 | −663,817 | |
| Change in discount rate | BM I EU | 76,780 | 37,140 | 0 | −34,827 | −67,511 |
| Change in income | −721,404 | −336,947 | 0 | 336,947 | 673,893 | |
| Change in CAPEX | 159,082 | 79,541 | 0 | −79,541 | −159,082 | |
| Change in OPEX | 514,812 | 257,406 | 0 | −257,406 | −528,056 | |
| Change in discount rate | BM II EU | 76,780 | 37,140 | 0 | −34,827 | −67,511 |
| Change in income | −749,559 | −348,509 | 0 | 348,509 | 697,018 | |
| Change in CAPEX | 159,082 | 79,541 | 0 | −79,541 | −159,082 | |
| Change in OPEX | 537,936 | 268,968 | 0 | −268,968 | −555,885 | |
| NPV (€) | BM I | BM II | BM I EU | BM II EU | ||||
|---|---|---|---|---|---|---|---|---|
| Expected Mean | −3823 | −114,895 | −73,281 | 209 | ||||
| 68% Confidence Interval | −57,750 | 50,105 | −770,309 | 540,519 | −641,641 | 495,079 | −568,084 | 568,502 |
| 95% Confidence Interval | −111,677 | 104,032 | −1,425,724 | 1,195,934 | −1,210,000 | 1,063,798 | −1,135,376 | 1,136,794 |
Disclaimer/Publisher’s Note: The statements, opinions and data contained in all publications are solely those of the individual author(s) and contributor(s) and not of MDPI and/or the editor(s). MDPI and/or the editor(s) disclaim responsibility for any injury to people or property resulting from any ideas, methods, instructions or products referred to in the content. |
© 2023 by the authors. Licensee MDPI, Basel, Switzerland. This article is an open access article distributed under the terms and conditions of the Creative Commons Attribution (CC BY) license (https://creativecommons.org/licenses/by/4.0/).
Share and Cite
Olba-Zięty, E.; Krzyżaniak, M.; Stolarski, M.J. Environmental External Production Costs of Extracts Derived from Poplar-Containing Bioactive Substances. Energies 2023, 16, 7544. https://doi.org/10.3390/en16227544
Olba-Zięty E, Krzyżaniak M, Stolarski MJ. Environmental External Production Costs of Extracts Derived from Poplar-Containing Bioactive Substances. Energies. 2023; 16(22):7544. https://doi.org/10.3390/en16227544
Chicago/Turabian StyleOlba-Zięty, Ewelina, Michał Krzyżaniak, and Mariusz Jerzy Stolarski. 2023. "Environmental External Production Costs of Extracts Derived from Poplar-Containing Bioactive Substances" Energies 16, no. 22: 7544. https://doi.org/10.3390/en16227544
APA StyleOlba-Zięty, E., Krzyżaniak, M., & Stolarski, M. J. (2023). Environmental External Production Costs of Extracts Derived from Poplar-Containing Bioactive Substances. Energies, 16(22), 7544. https://doi.org/10.3390/en16227544