1. Introduction
Worldwide, the use of traditional biomass for residential water heating and food cooking represents 26% of the total final energy consumption [
1]. The energy progress report [
2] estimates that around 2.6 billion people, mainly in low- and middle-income countries, use traditional biomass—firewood, charcoal, crop residues, livestock dung—to meet their cooking energy needs. The consumption of this type of solid biofuel is a subject of concern and study due to the following aspects: (i) environmental impact, (ii) health, (iii) energy poverty, and (iv) gender.
Environmental concerns stem from the unsustainable production and use of firewood, placing pressures on the regional and global environment. The unsustainable extraction of firewood has resulted in deforestation, soil erosion, and the loss of biodiversity [
3,
4], while the combustion of firewood in traditional stoves, such as the three-stone fires (TSF), emits a high level of pollutants, such as carbon monoxide (CO), methane (CH
4), nonmethane hydrocarbons (NMHCS), nitrous oxide (N
2O), nitrogen oxide (NO
x), particulate matter (PM), black carbon (BC), elemental carbon (EC), organic carbon (OC) and organic matter (OM). The CO
2, CH
4, N
2O, BC, and other aerosol particles increase the concentration of greenhouse gases (GHG) [
5], contributing to climate change and air pollution.
Concerns about negative effects on human health are related to the exposure to air pollutants—called criteria pollutants—resulting from indoor firewood burning in which PM and CO emissions are found; these gases and compounds present a high risk of respiratory illness—including respiratory infection, lung cancer and asthma—and cardiovascular ailments [
6,
7]. The WHO estimated that in 2016, 3.8 million deaths were reported annually due to air pollution in households that cook with some form of solid fuel, mainly traditional biomass [
8].
The concern to achieve the alleviation of energy poverty is that it is part of global goals to eradicate poverty, protect the planet, and ensure world prosperity [
9]. It was established as a goal in the 2030 Sustainable Development Goal (SDG) number 7, “Affordable and clean energy”, to increase the proportion of the population that uses clean fuels and technologies. In addition, concerns about the consequences for climate change on energy poverty have gained prominence in recent years [
10].
Another very important concern, which is seldom made visible, is the gender perspective, because it is mainly women are who cook at home, exposing themselves to the TSF exhaust gases [
11,
12,
13]. Therefore, women suffer the most from the health impact mentioned in the previous paragraph. Flores et al. [
14] documented that women, accompanied by children, traditionally collect firewood in some places. According to Pérez et al. [
15], between 21% and 29% of Mexican households’ women are heads of family, so there is also family economic vulnerability when the women’s health is affected.
Most of the population who are traditional biomass users live in sub-Sahara Africa, central and southern Asia [
2], and in some rural areas of Latin America, such as Bolivia and Nicaragua; the use of firewood is carried out in almost 100% of the households [
16]. In Honduras, it is 88% [
14], while in Panama and Guatemala, more than 50% of the population uses firewood [
1], and in Mexico, 26%, more than a quarter of the population, use firewood for cooking [
15].
Traditional biomass, when produced and used sustainably, represents a significant source of reliable, accessible, affordable, and resilient energy because it supplies energy in places where there is no or limited access to conventional fuels and technologies [
17].
In order to attain a sustainable production and use of firewood, different strategies have been proposed, such as forest codes and certification programs [
18,
19,
20]. Currently, biofuels and clean cooking technologies are new options for traditional biomass cooking, such as biogas, bioalcohols, pellets, and briquettes, as well as improved firewood cookstoves (ICS), gasifying stoves, and stoves that use biogas and bioalcohol [
21,
22].
ICS have significant international acceptance as a clean cooking technology option for a transition from TSF, because the ICS can reduce negative environmental impacts as well as those related to health, while ensuring reliable and affordable access to cooking fuels [
4,
23,
24].
According to Nerini et al. [
25], the transition to clean fuels such as liquid petroleum gas (LPG) and electricity is complex, as it could result in a high cost for the end user. Furthermore, the study by Fuentes-Cortes et al. [
26] reached a similar conclusion, showing that diversification of the supply of primary energy sources can generate conflicts on the performance of the water–energy–environment nexus which have profound economic implications. Additionally, it has been identified that there is a segment of the population that, due to economic limitations, attachment to traditional cooking practices, or the fuel availability, will not change the use of biomass for clean fuels [
27]. It has been observed that the energy transition is not unidirectional since people can return to traditional biomass in the case of rising modern energy prices, LPG, electricity, or natural gas [
28]. There are also households that do not fully replace firewood with modern fuels, but rather can use multiple fuels and technologies for cooking [
29].
In the study [
15], three types of firewood users were identified in Mexico: exclusive users of firewood (EFU), mixed users of firewood who utilize firewood as their primary fuel source (MPU), and mixed users of firewood who utilize firewood as a secondary fuel source (MSU). The most significant number of fuelwood users is found in the southeastern Mexican states, which belong to the tropical climate region. In addition, it was identified that fuelwood consumption varies by climatic region; it also varies depending on the location of houses in rural or urban areas and the socioeconomic level of its inhabitants.
Thus, despite promoting modern fuel consumption and using clean technologies, firewood consumption will continue to be essential for a significant proportion of the population. For this reason, it is imperative to incorporate solutions to make firewood consumption sustainable through technologies that perform efficient firewood consumption, such as ICS, to satisfy energy needs while reducing the negative impacts on the environment and the health of the population that depends on this biofuel.
The objective of this article is to carry out an original evaluation of the large-scale implementation of ICS in tropical Mexican households in terms of firewood consumption, CO2e emissions, criterion pollutants, and socioeconomic aspects, disaggregating the information by type of firewood users, socioeconomic level (SL), and size of population centers (SP).
The authors of the present study conducted this assessment by constructing scenarios from 2018 through 2050, contributing in this way to the transition towards the use of clean technologies in cooking for firewood users, which addresses environmental, health, energy poverty, and gender implications related to the use of this traditional biofuel. For this reason, the article answers the following questions: (1) What is the future trend of firewood consumption, CO2e emissions, and criteria pollutants in the forms and devices in which firewood is currently consumed in the climatic region with the highest firewood consumption in Mexico? (2) What energy, environmental, health, and socioeconomic advantages are obtained from implementing ICS in this climate region by type of fuelwood users, socioeconomic level, and population size? (3) How does implementing ICS impact the poorest population in this region? (4) What economic benefits and mitigation costs are obtained in the alternative scenario when distinguishing between those who pay and those who do not purchase fuelwood?
This study is structured as follows:
Section 2 presents the state-of-the-art analysis of ICS implementation at the global and national level through scenario building.
Section 3 presents the context of fuelwood consumption in the tropical region of Mexico.
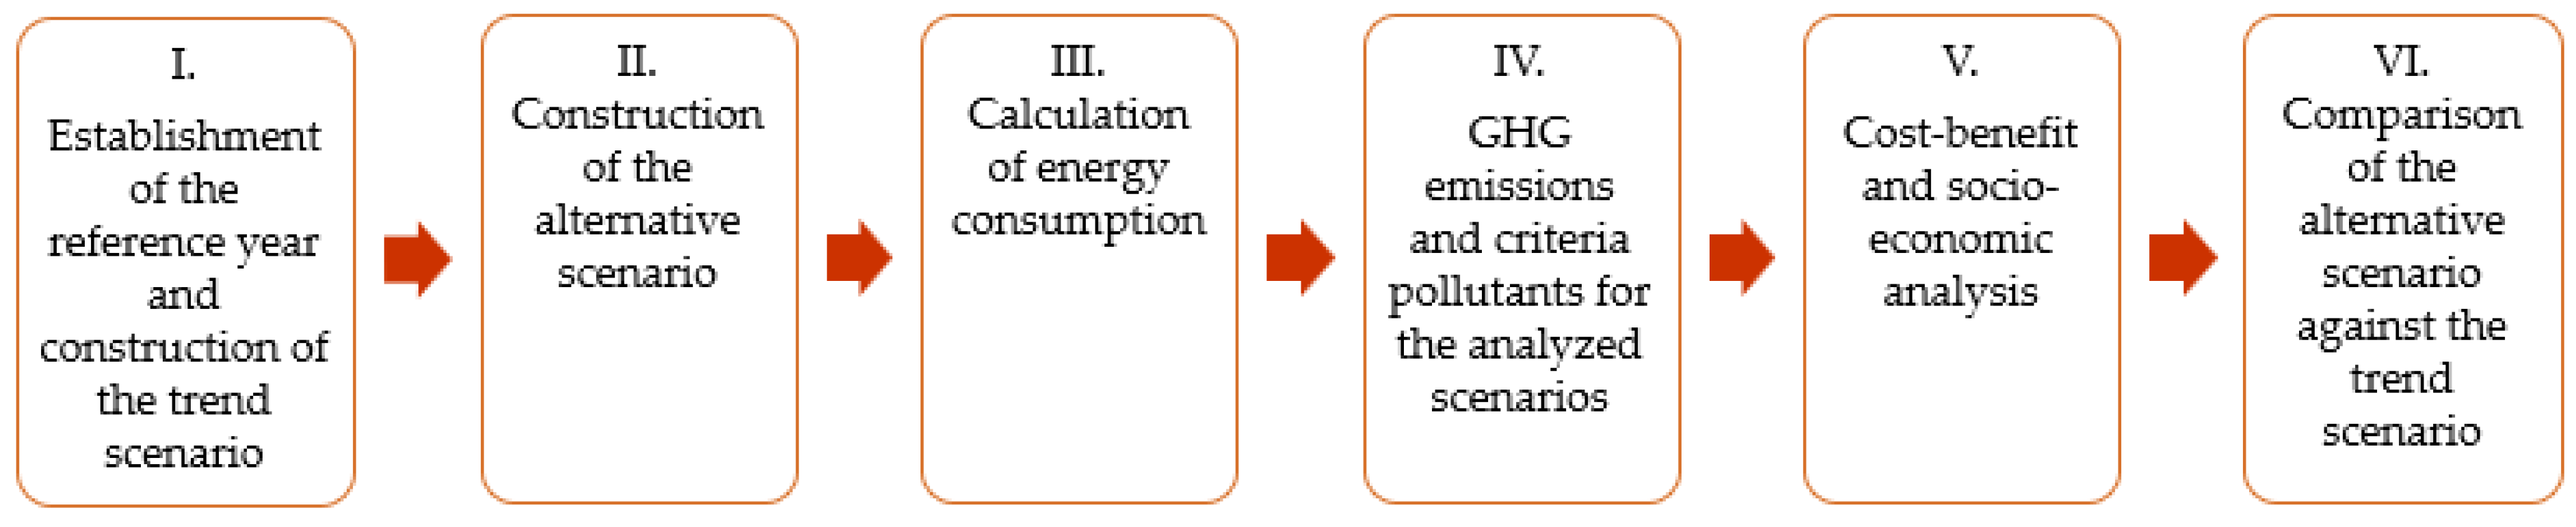
Section 4 describes the methodology used to build and analyze two firewood consumption scenarios: (i) trend scenario where TSF continues to be employed, and (ii) alternative scenario where ICS is implemented.
Section 5 presents the comparison between these two scenarios, the differences in CO
2e and criteria pollutants—CO and PM
2.5—emissions, cost-benefit, mitigation costs and a finance efficiency analysis. All the above is presented in a disaggregated manner considering exclusive user of firewood (EFU), mixed users of firewood who utilize firewood as their primary fuel source (MPU) and mixed users of firewood who utilize firewood as a secondary fuel source (MSU); also, at the end of this section we present a sensitivity analysis performed on the main parameters: energy consumption and CO
2e, CO and PM
2.5 emissions.
Section 6 presents a discussion of the results and limitations of the study. Finally,
Section 7 presents the main findings and energy policy recommendations, as future research to improve knowledge on energy transition of firewood users.
2. State of the Art Analysis of ICS Implementation Evaluation through Scenario Construction Approach
At a global level, different studies have been developed to build alternative scenarios that evaluate clean cooking options employing the various biofuels and clean technologies available for the use of biomass. These studies [
4,
14,
15,
25,
27,
30,
31,
32,
33] have been carried out in countries such as Kenya, Ethiopia, Nigeria, China, Honduras, and Mexico in which the aspects of GHG emissions, air pollutant emissions, health impacts, energy saving, and economic benefits are evaluated.
In the study by Winijkul and Bond [
27], the implementation of ICS and the clean fuels is analyzed, such as electricity and LPG worldwide, and estimated the effects to reduce energy consumption and emissions gases that have a local and global impact such as PM, BC, OC, CO, CO
2, NO
x, CH
4, NMHC. Their results indicated that in Latin America, Africa, and Asia, a greater reduction in energy consumption and emissions is achieved in the ICS implementation scenario, achieving a reduction of 72% of PM, 39% of CO
2, 28% of NO
x and 39% to 76% in other contaminants related to the BAU (business as usual) scenario.
At the regional level, Dagnachew et al. [
4] analyze a scenario to achieve SDG 7 in the Sub-Saharan Africa region by 2030, considering the implementation of ICS and the complete elimination of conventional biomass stoves. The results showed that in the final year, half of the population would cook in ICS or advanced biomass stoves, a quarter with LPG, and the rest of the population with a mix of biogas, natural gas, and electricity, showing a rapid transition to the use of modern fuels and clean technologies. In this way, the health impacts of infant mortality are reduced by 50% and GHG emissions are reduced by up to 64%.
In the study conducted in Kenya [
33], the implementation of ICS replacing all stoves that use traditional fuels in the period 2015–2035 was analyzed. The results showed that, relating to the BAU scenario, in the ICS implementation scenario, energy consumption decreases by 9.3% and consequently GHG emissions decreases by 26.5%, CO by 54%, CH
4 by 67%, N
2O by 52%, PM
2.5 and BC by 41.9% and 13.7%, respectively; nevertheless, there is an increase of 127.3% in NO
x emissions.
Another study from Kenya [
25] showed that the cost of cooking a meal is reduced when using ICS compared to cooking with TSF. Also, the study showed that the implementation of LPG and electricity has a higher cost than an ICS implementation scenario, which was analyzed towards the year 2030. This study highlights that the use of the forest area must be sustainable to achieve these benefits.
The study conducted in Nigeria [
31] shows the analysis of the environmental impacts and costs of cooking in the analysis period from 2003 to 2030. The results showed that when there is a high penetration of ICS, a greater reduction in environmental impacts and a better cost that is 32% lower than the BAU scenario costs with TSF are achieved.
In Honduras [
14], the ICS implementation scenario in the period from 2016 to 2030 presented low energy consumption compared to the BAU scenario, making firewood consumption more efficient and with lower GHG emissions. In the ICS and LPG implementation scenario, an increase in LPG is observed in urban and peri-urban areas while firewood consumption persists in rural areas.
The studies that have been carried out in Mexico on the implementation of ICS have reached similar conclusions to the studies carried out in other countries. Islas et al. [
30] show that in the analysis period from 2005 to 2030, the large-scale implementation of ICS represents a high reduction in the demand for firewood with an average mitigation of 0.5 tC per ICS per year, thus achieving an emission reduction of 6.23 million CO
2e and 58.6 PJ energy savings by 2030, all in a high penetration scenario. This study considers the effects of unsustainable firewood consumption that causes deforestation and forest degradation.
García et al. [
34] analyzed the mitigation and investment cost of replacing TSF with ICS from 2015 to 2035, thereby achieving a decrease in firewood consumption due to an increase in efficiency of the ICS, a mitigation of 23 million tons of carbon dioxide equivalent (MtCO
2e), and an investment cost of 162.4 million USD (MUSD) and a mitigation cost of 7 USD per tCO
2e.
The study made in 2018 [
32] shows the GHG mitigation and BC emissions associated with the transition from TSF to clean fuels and ICS over a period from 2014 to 2030. The results show that in the BAU scenario, a small reduction of firewood consumption at the end of the analysis period, an increase in the mixed users of firewood (MU), and a decrease in exclusive firewood users (EFU). This resulted in a firewood consumption reduction of 18.4 million tons (Mt) of dry matter and GHG emissions of 364.3 MtCO
2. In the alternative scenario, where both ICS and LPG stoves replace the TSF, firewood consumption decreases by 36% and lower GHG emissions are achieved, accounting for 238 MtCO
2 compared to a scenario in which only ICS are disseminated where firewood consumption decreases 28% and GHG emissions of 257.5 MtCO
2.
Finally, Grande-Acosta and Islas-Samperio [
35] show scenarios from 2011 to 2035 in which the implementation of ICS in the rural residential sector was considered with the installation of 4 million ICS. The results presented a significant reduction in the mitigation scenario compared to the BAU scenario: 43 MtCO
2e were avoided, and a mitigation cost of −5 USD/tCO
2 was achieved; thus, instead of costs, economic benefits were obtained by ICS implementation.
In general, studies carried out for Mexico show a general vision of the benefits of ICS implementation; however, there is no consensus on the results due to the different assumptions established in each of them. Also, the variability of firewood user types and their consumption patterns were not considered. Two assumptions of critical relevance in the studies mentioned above where there are large differences are the number of users and the total firewood consumption in México. Pérez et al. [
15] have noted that estimates of firewood consumption in Mexico have been based on limited case studies that do not reflect accurately the current state of firewood consumption. These same authors recently reported detailed information on firewood consumption patterns for households according to three types of users (EFU, MPU and MSU), three climate regions (extreme heat, mild and tropical), and two socioeconomic levels (moderate low (ML) and low (L)) according to what we consider the best and most representative survey on firewood consumption in Mexico, which is titled National Survey of Consumption of Energy in Private Housing Units (ENCEVI, for its acronym in Spanish) [
36] carried out by the Mexican National Institute for Statistics and Geography (INEGI, for its acronym in Spanish).
Pérez et al. [
15] found that the highest concentration of households that use firewood is in the tropical climate region (CR-TR), coinciding with Contreras et al. [
37] which reached similar conclusions. This represents Mexico’s tropical climate region which faces significant challenges in addressing the problems caused by the high dependence on firewood consumption, therefore it deserves attention in order to analyze sustainable solutions that help reduce the problem that firewood consumption implies in this climate region to the most vulnerable households.
3. Context of the Study Site: Types of Firewood Users by Socioeconomic Level and Size of Population Centers, and Evolution of the Growth of the Tropical Climate Region
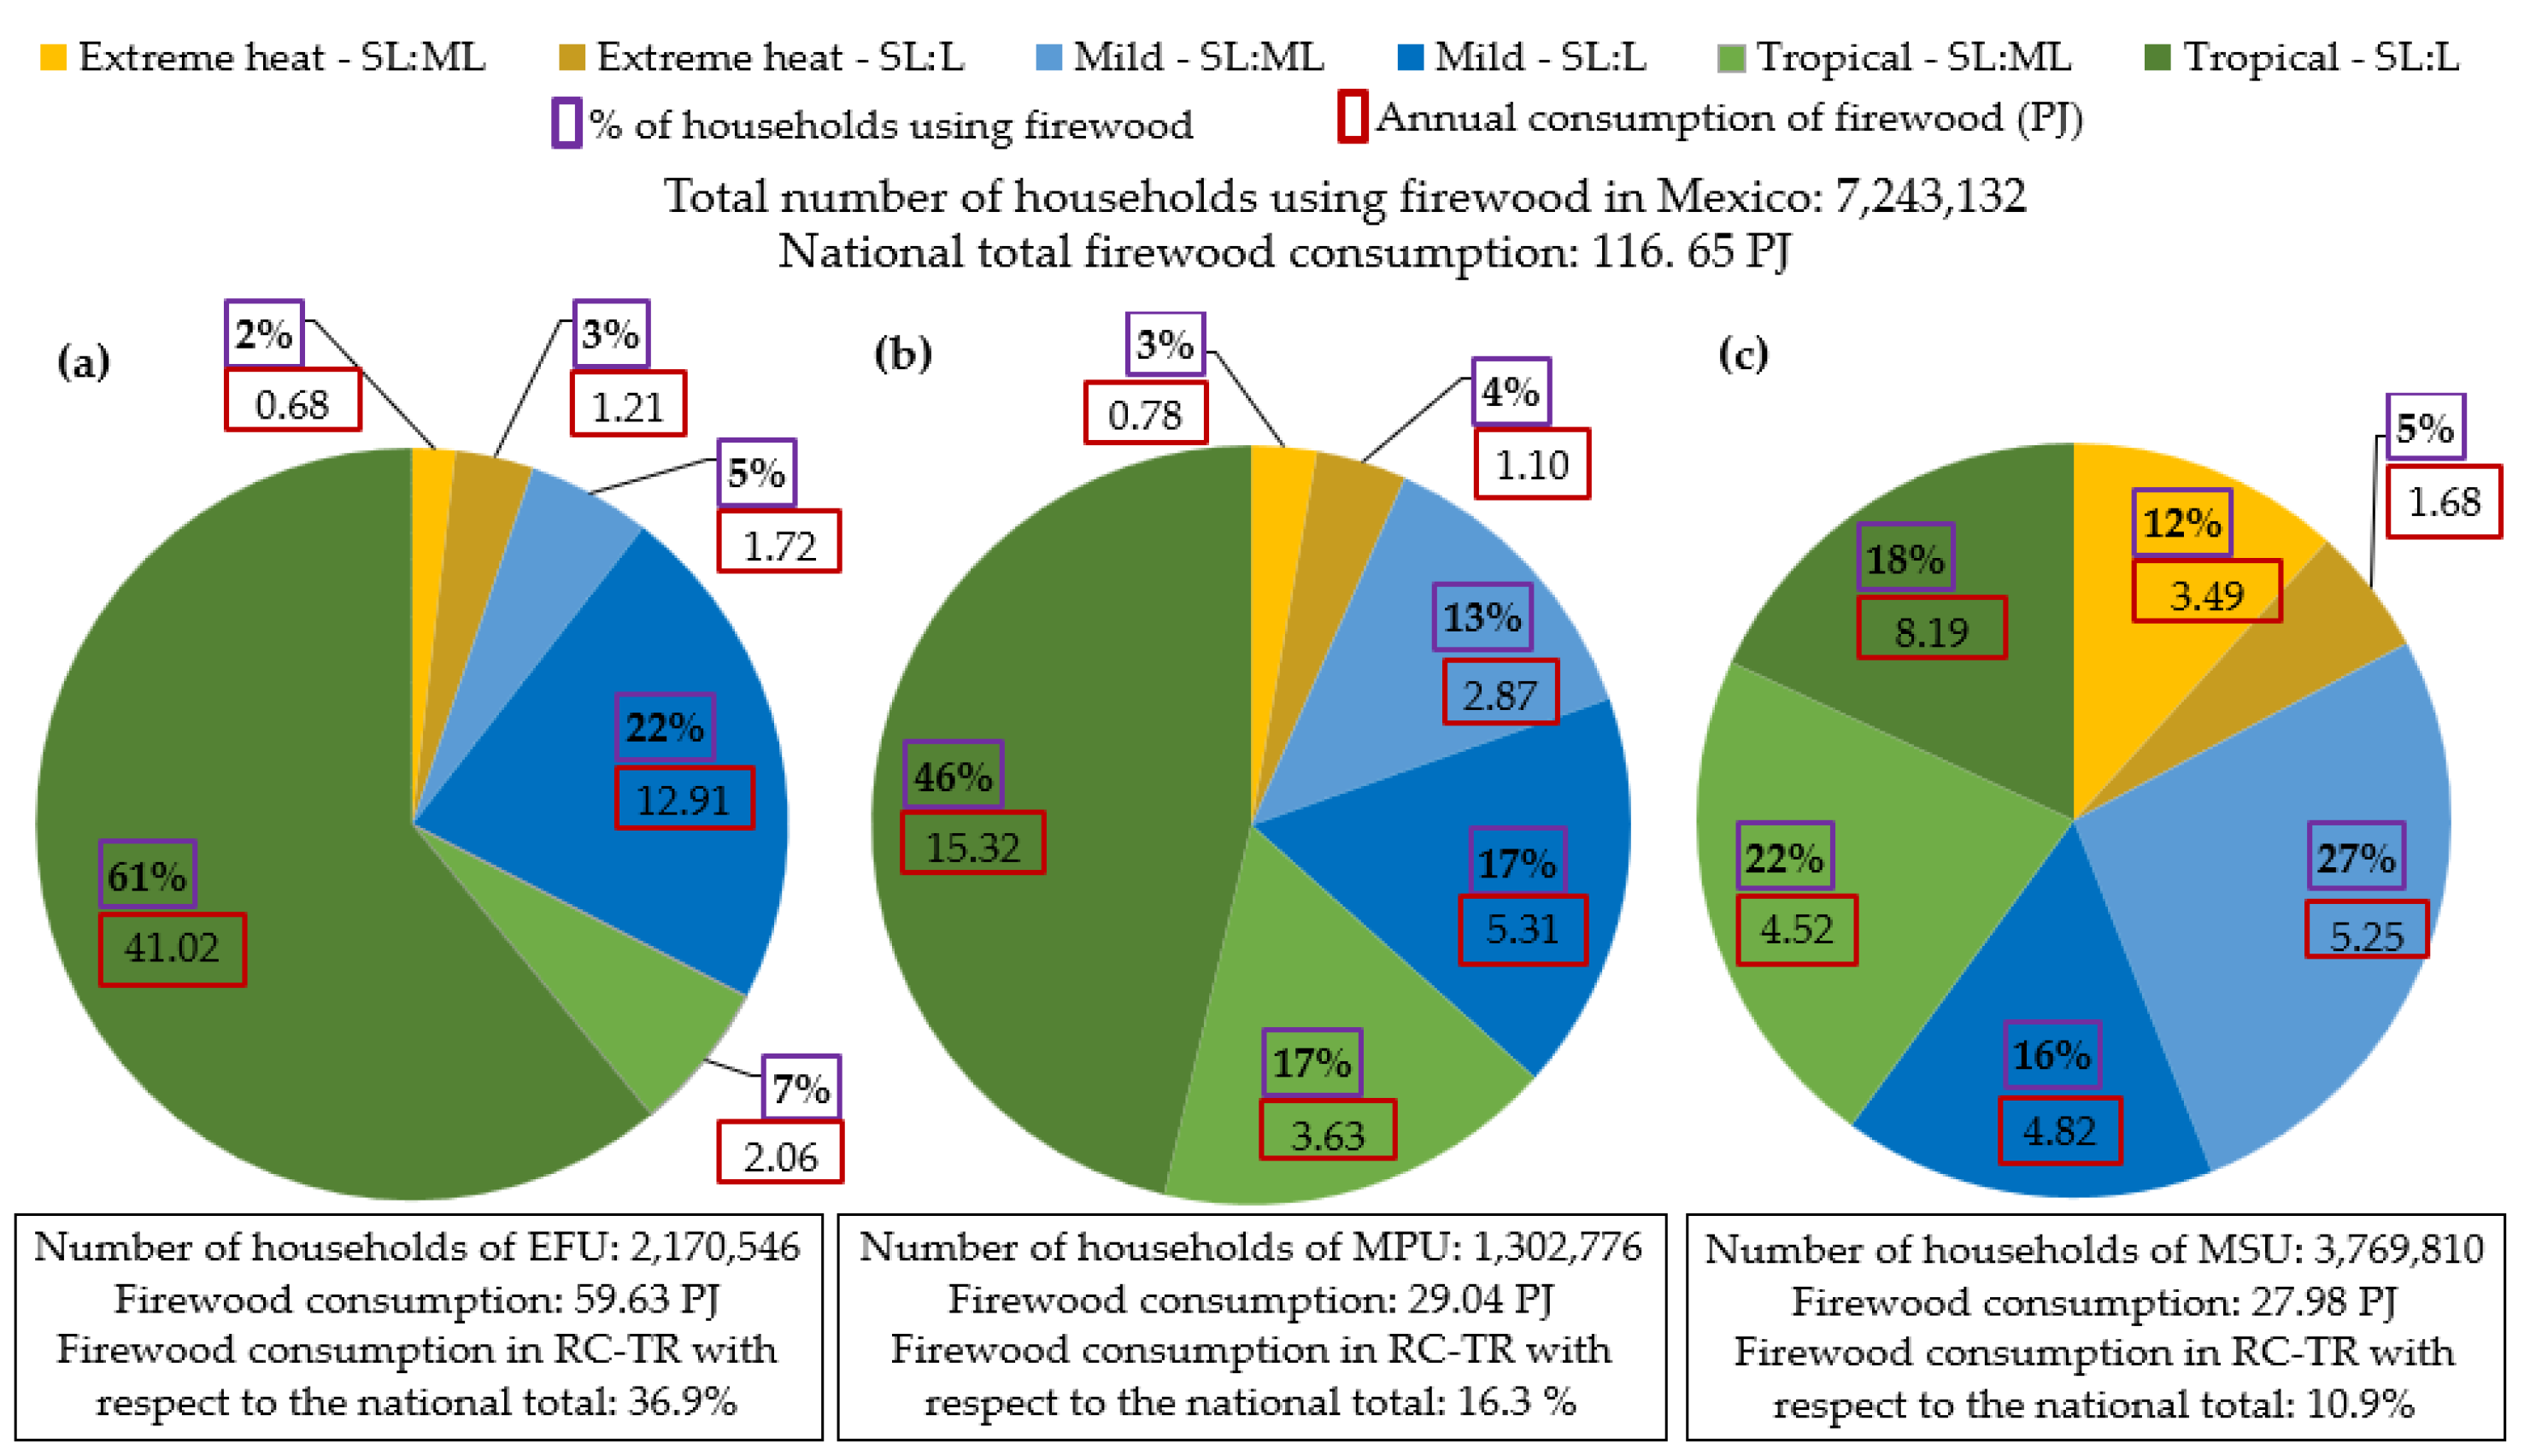
The distribution of firewood users in Mexico by type user, by CR, and by SL is shown in
Figure 1; in the CR-TR, 52.2% of the total firewood users are concentrated, and the majority of users are households that have a low socioeconomic level (SL-L).
As
Figure 1 show, the tropical region has the highest firewood consumption in the country, representing 64.1% of the total firewood consumption, of which the EFU consume 43.08 PJ, the MPU, 18.95 PJ, and the MSU, 12.71 PJ.
In this article, the consumption of firewood was disaggregated by SP: (i) rural, villages with a population under 2500; (ii) peri-urban, towns with a population ranging between 2500 and 14,999; (iii) urban, towns/cities with a population of 15,000 or greater following the methodology reported by Pérez et al. [
15]. In the same way, the number of households that pay for acquiring firewood by SP was calculated.
3.1. Number of Users and Three Stone Fires in the Tropical Region
The number of firewood users is variable among the different types of users, according to the SL and SP to which such users belong.
Table 1 shows the number of users and estimated number of TSF for each type of user.
The EFUs are approximately 6.49 million (M), of which the SL-ML are 537,827 users using 0.14 M TSF, while the SL-L users are 5.95 M and the amount of TSF is almost 10 times more than in the SL-ML.
In the MPU, there are a total of 3.49 M users and the number of TSF is 43.5% less than in EFU. SL-ML users use 0.22 M TSF, almost double that of EFU of the same SL. In the SL-L, the number of TSF is reduced by almost half compared to the EFU of the same SL.
The number of MSU is almost 6.04 M users which use a slightly larger amount of TSF than in the EFU, estimated at 1.5 M TSF. The majority of TSF is used in the SL-ML (54.6%) and the rest in SL-L.
Table 2 breaks down the number of firewood users and number of TSF per SP for each of the user types. The EFU of the SL-ML were almost in the same proportion between peri-urban and urban areas with 40% and 38% of the total households, respectively, while in rural areas it was 22%.
In the SL-L of the EFUs, the highest concentration was in rural areas with 85% of the total, while 14% were found in peri-urban areas and the remaining 2% were from urban areas.
Unlike EFU, in the MPU the highest concentration of users of SL-ML and TSF users were in urban areas with 40% of the total, followed by users in peri-urban areas with 33%, and rural areas with 27%. In the SL-L, the proportion was similar to the EFU of SL-L where the highest concentration was in rural areas with 79%, followed by peri-urban areas with 18%, and the remaining 3% are in urban areas.
In the MSU of the SL-ML, half of the users were in urban areas (50%), followed by peri-urban areas (31%) and rural areas (19%). The SL-L showed the same trend as EFU and MPU, where the majority were found in rural areas (67%), followed by peri-urban areas (22%) and urban areas (10%), although this percentage is higher than of the EFU and MPU.
Of the total households, 34% that use firewood pay for this solid biofuel. The users with the highest proportion of households that pay for the acquisition of firewood, between 51.7% and 86.5%, were found in the EFUs of urban and peri-urban areas of SL, ML and L. In the MPU were in the SL-ML of urban areas and of the SL-L of peri-urban areas and, for the MSU were in the SL-L of urban and peri-urban areas.
In contrast, the highest percentage of households that do not pay for the acquisition of firewood, between 61.7% and 82.8%, were the MPU and MSU of SL-ML in peri-urban and rural areas, as well as the rural areas of the SL-L and the urban areas of the SL-ML of EFUs and, finally, the rural areas of the SL-L of the MSU.
3.2. Population Projection of the Tropical Climate Region in Mexico
Due to the lack of information on population projection disaggregated by SP (rural, peri-urban, and urban) the population projection was calculated using, as its basis, historical data the population reported in the population censuses from 1980 to 2020 by INEGI [
38]. with a simple linear regression shown in Equation (1).
where
Pt is the projection of the population in year
t,
a and
b are the regression coefficients and
Pt−1 is a previous period of
Pt, assuming that the population
Pt depends on population of the previous period.
In the CR-TR, in 2018, just over 16 M Inh (inhabitants) were users of firewood and a global AAGT (average annual growth rate) of 0.5% was estimated, which means that in 2050, firewood users will increase to 18.8 M Inh.
Disaggregating the number of firewood users by SP,
Figure 2 shows that the rural population continues to be the most important, although its proportion decreases from 61% in 2018 to 58% in 2050. These users of firewood in rural areas grow with a small AAGR of 0.32%, going from 9.8 M users in 2018 to increasing by just 1 M users more in 2050, reaching 10.8 million users. In the case of the population of firewood users in peri-urban areas, the proportion went from 21% (3.4 M) in 2018 to 22% in 2050 (4.2 M), which means an AAGR of 0.66%. Finally, in the case of firewood users in urban areas, it had highest AAGR (0.89%) going from representing 18% in 2018 with 2.8 M users to 20% in 2050 with 3.7 M users.
5. Results
5.1. BAU Scenario of Exclusive Firewood Users
The total number of EFU in 2018 was 6,490,259 distributes across 1,463,666 households.
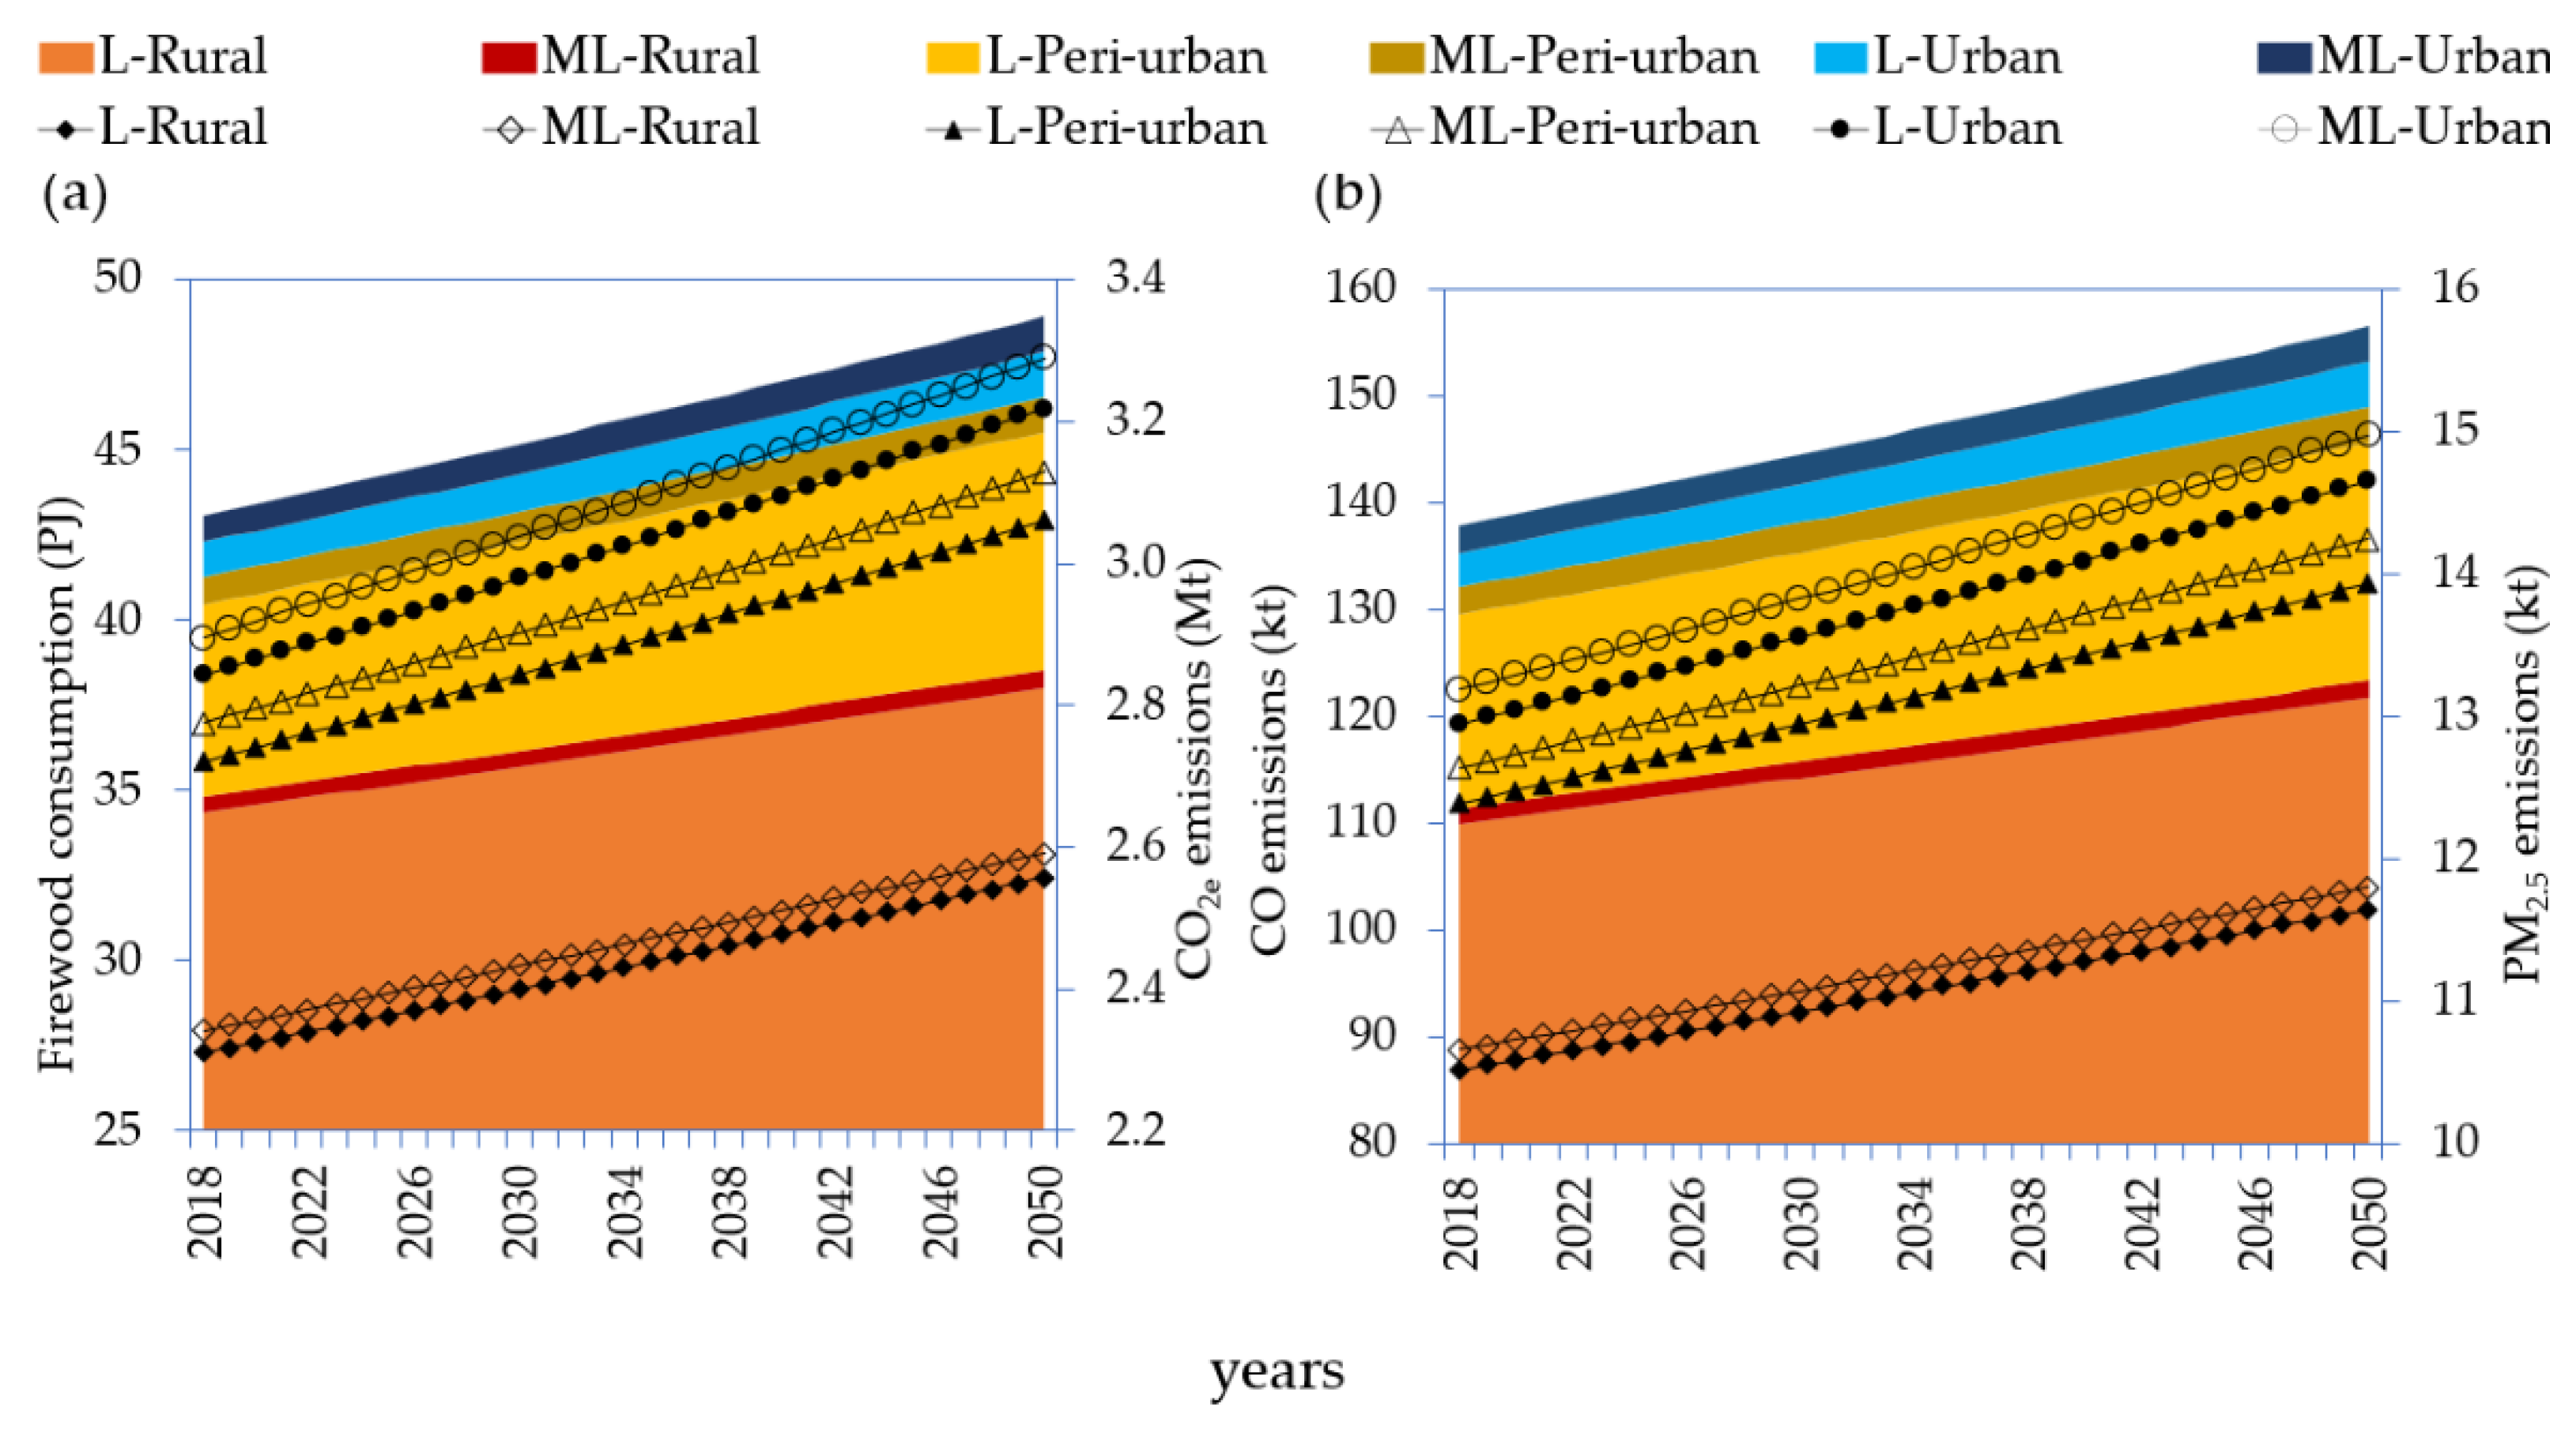
Figure 4 shows the energy consumption and emissions of the trend scenario by SL and SP. According to the results, in 2018, the EFU consumed 43.1 PJ of firewood in TSF generating 2.9 MtCO
2e, 137.8 thousands of tons (kt) of CO, and 13.2 kt of PM
2.5.
The largest number of households belong to the SL-L found in rural areas (76%), which consequently are those with the highest firewood consumption, CO2e emissions, and criterion pollutants at proportion of 80% of the total.
Following the trend to the year 2050, the total number of households increases to 1,669,992 where rural areas represent 73% and peri-urban areas, 13%. In this way, total firewood consumption increases by 2050 to 48.9 PJ and emissions to 3.3 MtCO2e, 156.5 kt of CO and 15 kt of PM2.5, where rural areas contribute 78% and peri-urban areas with 14%.
In this scenario, it is observed that EFU households will continue to increase with high firewood consumption and therefore with high CO2e emissions and criteria pollutants, especially in rural areas and those that belong to the SL-L which will continue, in this scenario, depending on firewood with its consequent environmental, health, and socioeconomic problems.
5.2. BAU Scenario for Mixed Users of Firewood Who Utilize Firewood as Their Primary Fuel Source
The number of MPU households was 3,492,312 distributed in 826,210 households in 2018, which represents close to half of the EFU households. Like the EFU users, in these MPU the majority belongs to the SL-L who are found in rural areas (57%) and in peri-urban areas (13%), although a significant 11% was also found in the urban areas of the SL-ML.
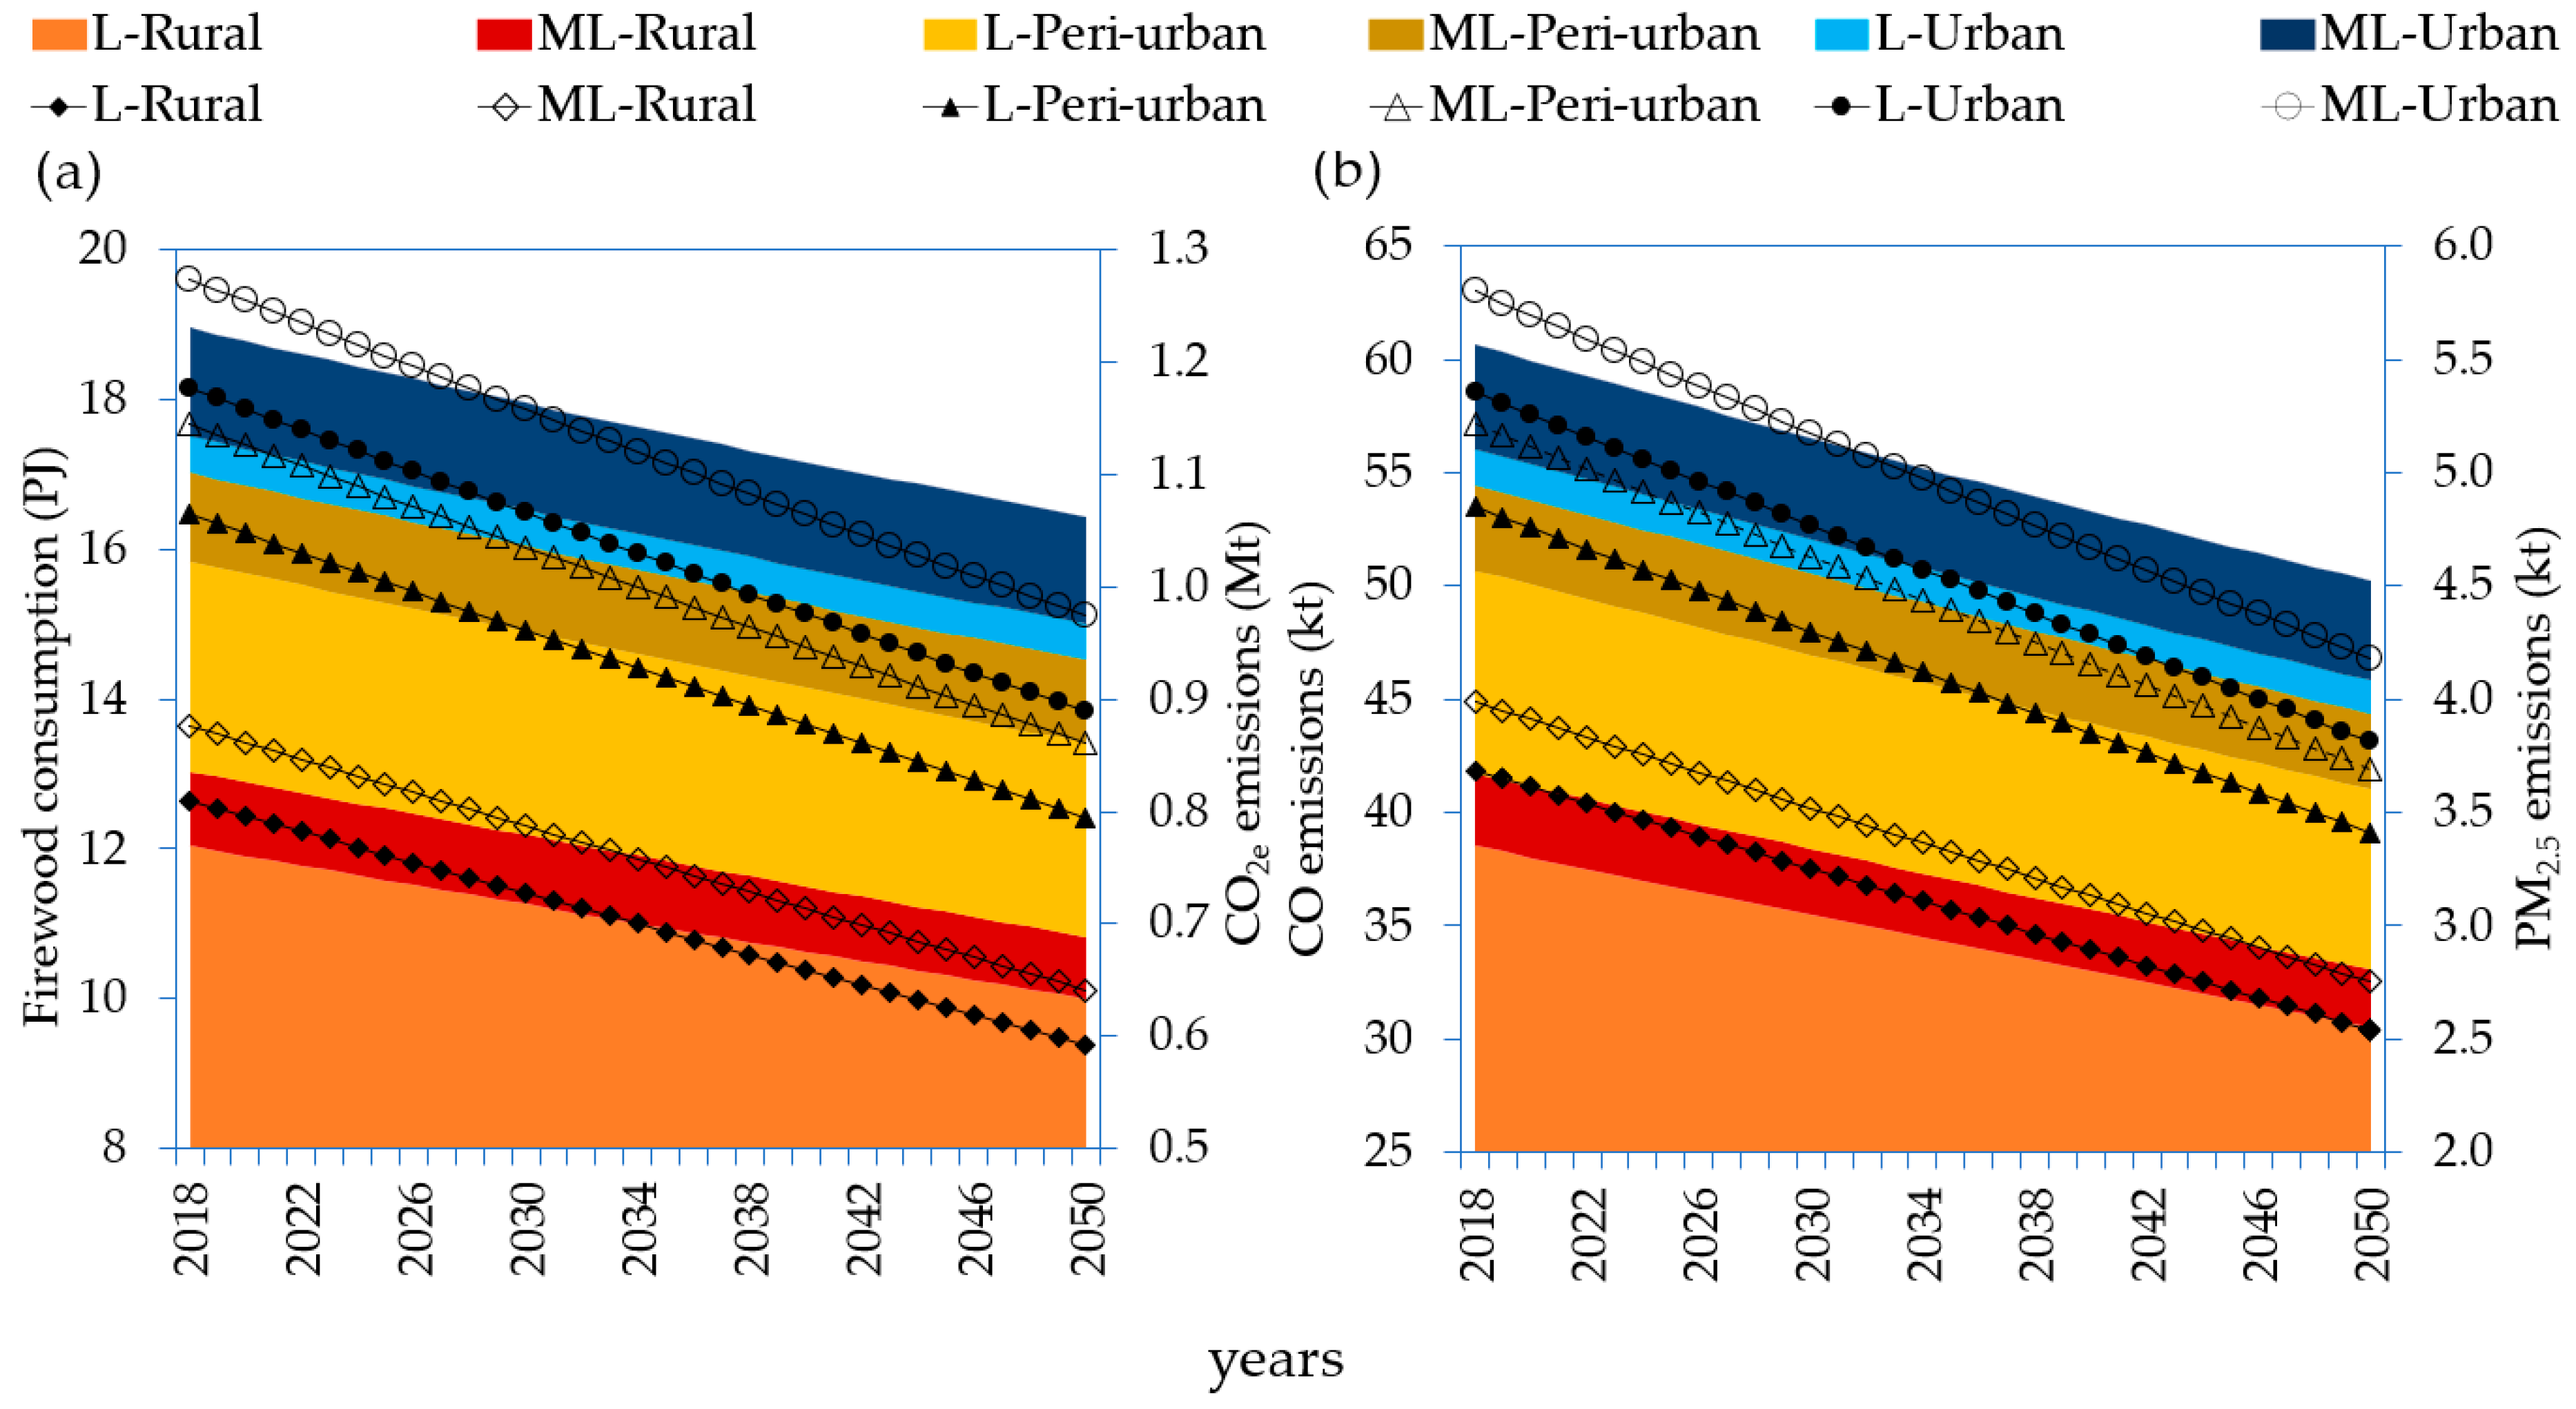
Figure 5 presents the BAU scenario for firewood consumption with its respective CO
2e emissions and criterion pollutants for MPU by 2050. In 2018, the total consumption of firewood is 19 PJ with emissions of 1.3 MtCO
2e, 60 kt of CO and 5.8 kt of PM
2.5, which SL-L households in rural areas contribute 64% and peri-urban areas with 15%, while SL-ML households in urban areas contribute 8%.
In the trend to year 2050, the number of households increases by 14% reaching 962,131 households where the SL-L in rural areas represents 55%, peri-urban areas, 14% and urban areas, 3%, while the SL-ML of rural areas represents 7% and peri-urban areas and urban areas, 9% and 12%, respectively. In this way, firewood consumption by 2050 is estimated at 21.9 PJ with emissions of 1.5 MtCO2e, 70.1 kt of CO and 6.7 kt of PM2.5, of which SL-L households in rural areas contribute 61% and peri-urban and urban areas with 16% and 3%, respectively. While SL-ML households in urban areas contribute 8%, peri-urban areas, 7% and rural areas 5%.
5.3. BAU Scenario for Mixed Users of Firewood Who Utilize Firewood as a Secondary Fuel Source
The number of MSU in 2018 is 6,043,987 distributed across 1,506,281 households, which is a slightly larger number than EFU. Of these households, although the majority are located in SL-L of rural areas (31%), a considerable proportion are found in the SL-ML of urban (27%) and peri-urban (17%) areas. In a smaller proportion, this type of user was found in rural areas (11%) of the SL-ML as well as in peri-urban areas (10%) and urban areas of the SL-L with 5%.
In 2018, as seen in
Figure 6, firewood consumption was 12.7 PJ with emissions of 0.9 MtCO
2e, 40.7 kt of CO, and 3.9 kt of PM
2.5, of which SL-L households in rural areas contribute 43% of CO
2e emissions and peri-urban areas with 14%, while SL-ML households in urban areas contribute 18% and peri-urban areas with 11%; this proportion is similar for CO and PM
2.5 emissions.
In the year 2050, the number of households will increase to 1,826,757 where the majority of households will be concentrated in the urban areas of SL-ML with 30% followed by households in rural areas of SL-L with 28%, the households from the SL-ML of peri-urban areas with 17%, the rural areas of SL-ML and peri-urban areas of SL-L with 10%, and the remaining 5% from the urban areas of SL-L. For this same year, firewood consumption at the end of the analysis period is estimated at 152.2 PJ with emissions of 1.0 MtCO2e, 48.6 kt of CO, and 4.6 kt of PM2.5, of which the CO2e contribution from households of SL-L in rural areas will represent 40% and SL-ML households in urban areas represent 20%, while the peri-urban areas of SL-L and ML will contribute 15% and 11%, respectively. The rural areas of SL-ML and urban areas of SL-L will contribute 6% and 7%, respectively. The contribution of CO and PM2.5 show similar percentages.
In this BAU scenario, both types of MPU and MSU users are observed to increase the number of households that consume firewood in urban and peri-urban areas. Although the consumption of firewood is lower than in the EFU, mixed users of firewood will continue to have a significant dependence on the use of firewood and its respective consequences of CO2e emissions and criteria pollutants.
5.4. Alternative Scenario of Exclusive Firewood Users
With the implementation of ICS that replaces the TSF, a significant reduction in firewood consumption and its corresponding emissions of CO
2e and criteria pollutants are shown.
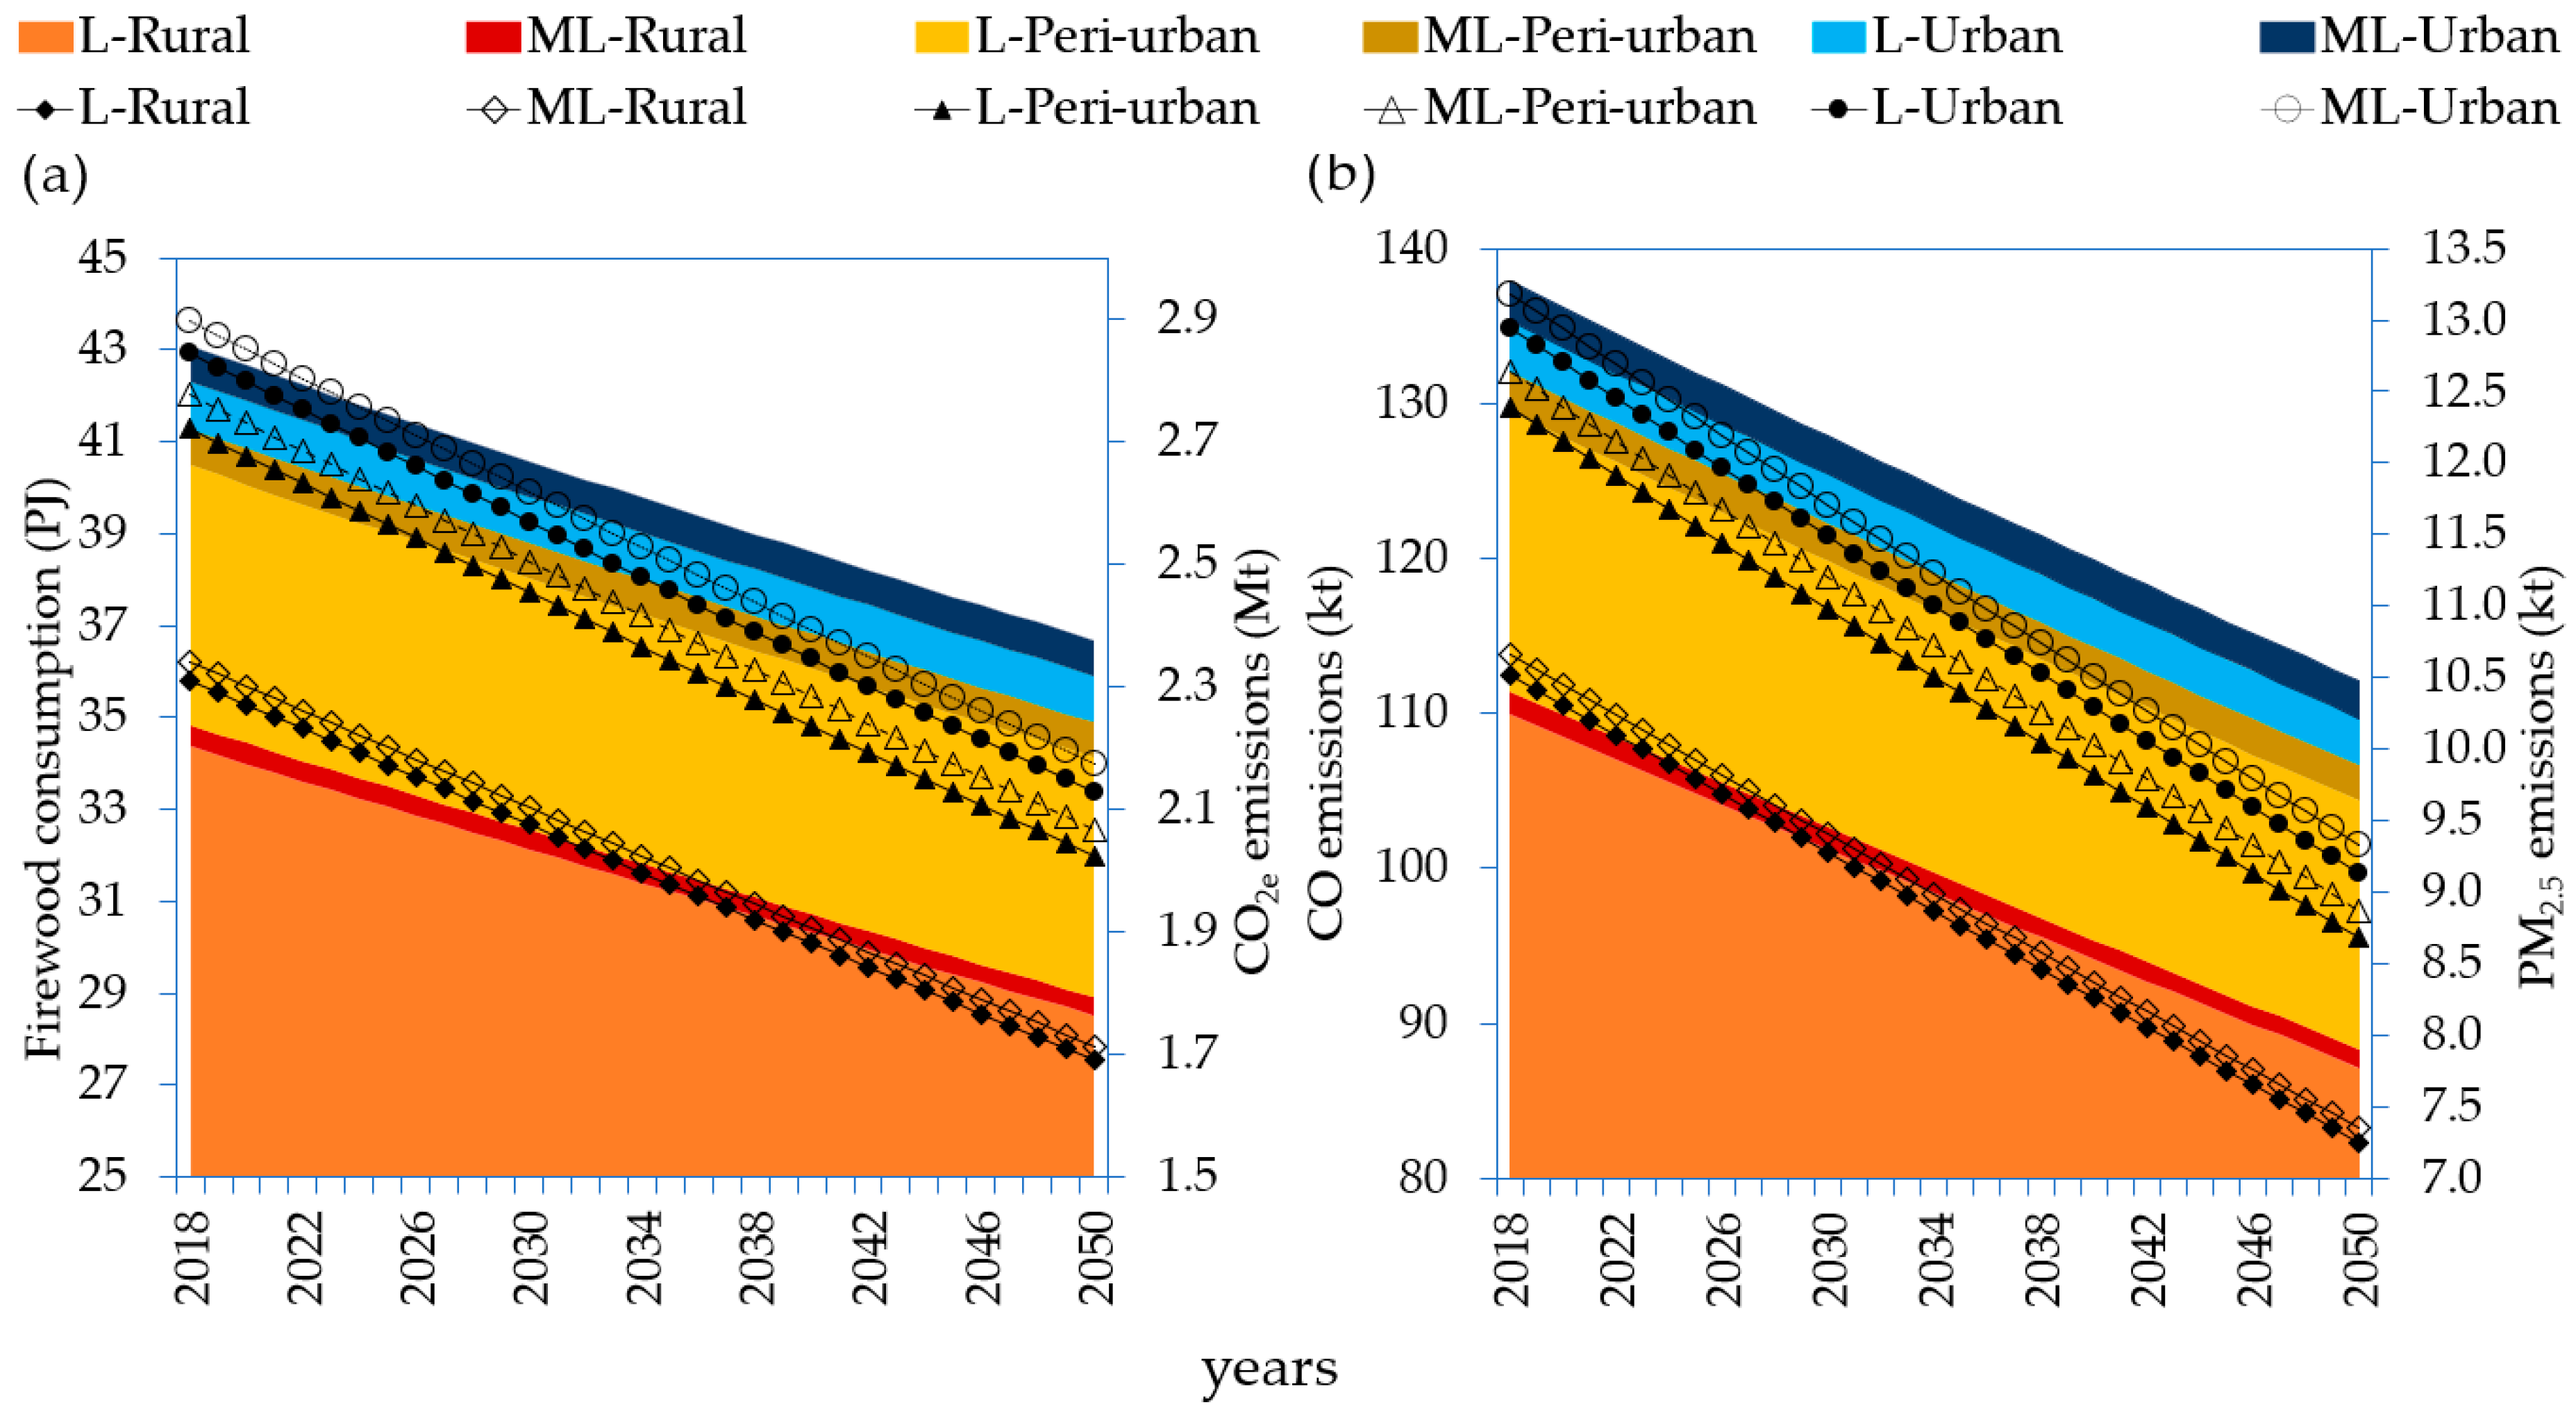
Figure 7 presents the alternative EFU scenario where 100% of TSF is replaced by ICS in the analyzed period.
The EFUs recorded the highest consumption of firewood in 2018. By 2050 with the implementation of ICS firewood consumption reduces to 36.7 PJ, emissions of CO2e reduces to 2.2 MtCO2e, and emissions of CO and PM2.5 reduces to 112.1 kt and 9.3 kt, respectively. This represents a global reduction, related to the initial year, of 17% in firewood consumption, 33% in CO2e emissions, 23% in CO emissions, and 41% in PM2.5 emissions, respectively. In this way, compared to the base scenario, the consumption of 12.2 PJ of firewood is avoided and, consequently, 1.1 MtCO2e, 44.4 kt of CO, and 5.6 kt of PM2.5 are avoided.
The greatest reduction occurs in rural areas, especially in SL-L which is the group with the greatest implementation of ICS avoiding the consumption of 9.51 PJ of firewood, 0.87 MtCO2e, 34.54 kt of CO, and 4.38 kt of PM2.5; this means that 77.7% of firewood consumption and emissions are avoided.
In peri-urban areas, SL-L households are the second group that has the highest firewood consumption and avoided emissions with approximately 14.3% of the total.
5.5. Alternative Scenario for Mixed Users of Firewood Who Utilize Firewood as Their Primary Fuel Source
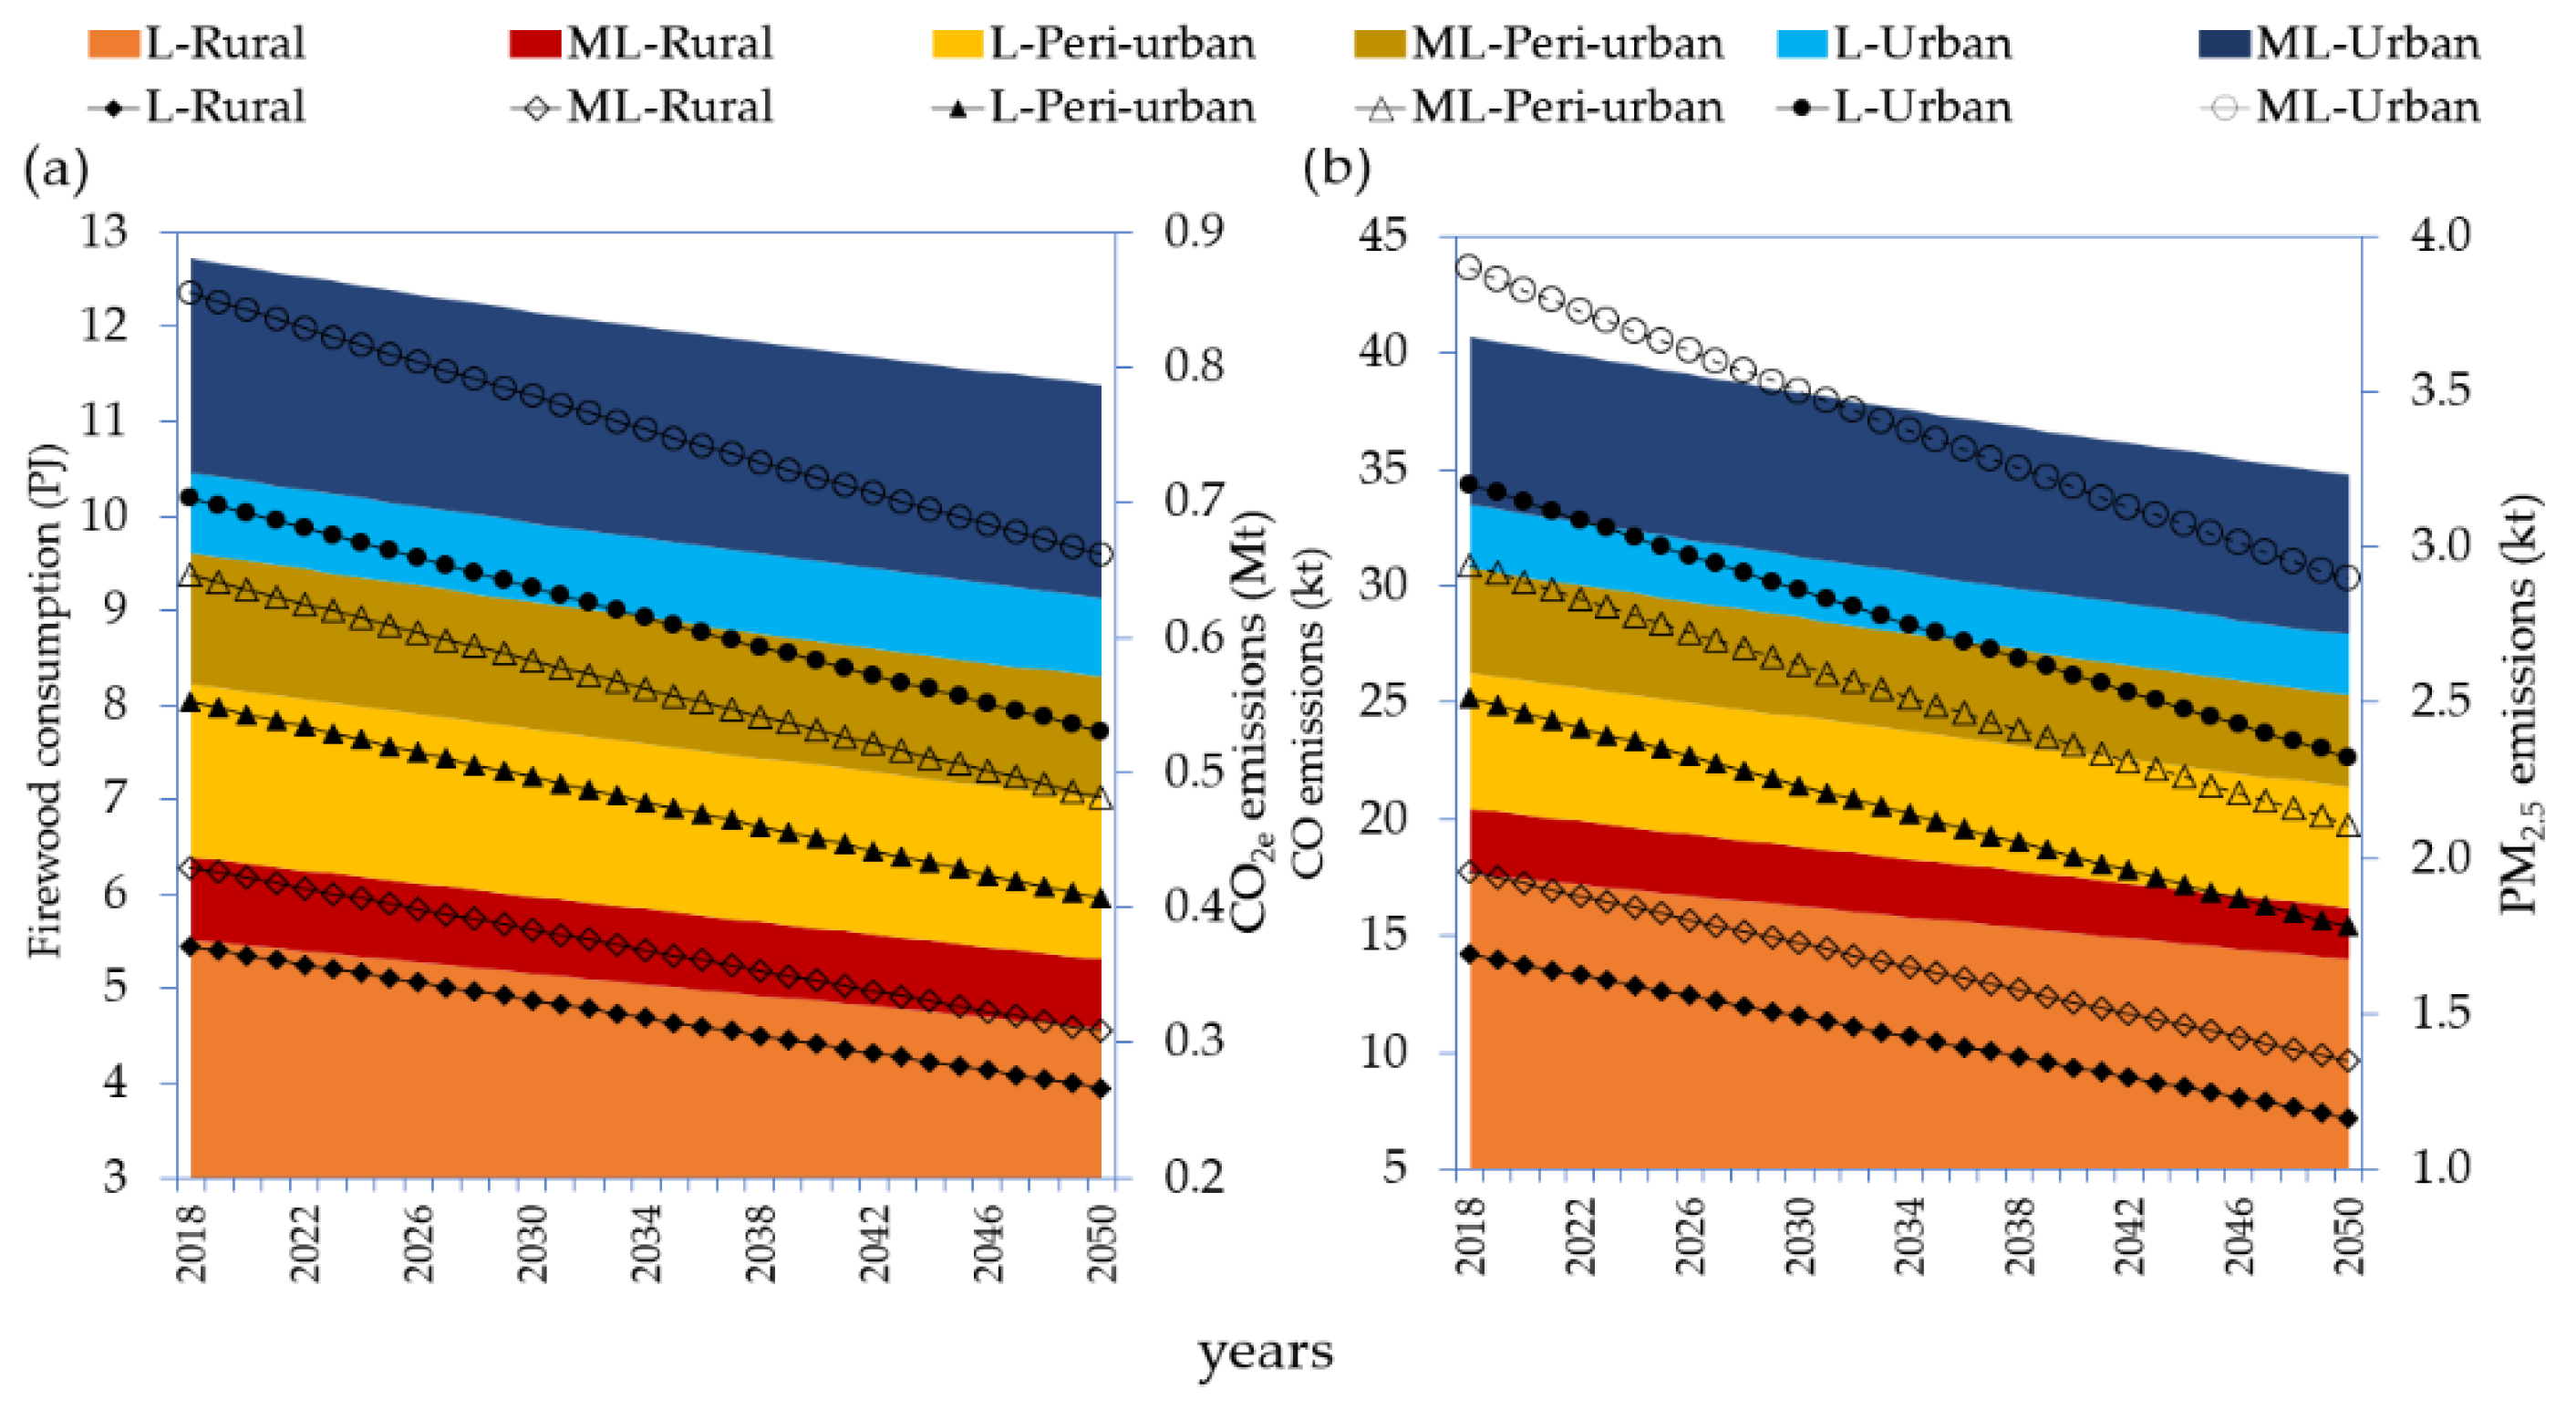
The consumption of firewood and its corresponding emissions, CO
2e and criteria pollutants, in alternative scenario of the MPU is presented in
Figure 8, where it is observed that, like the EFU, the users of SL-L have the greatest potential to reduce firewood consumption and its respective emissions with the implementation of ICS.
The MPU had a global reduction related to the initial year of 15.2% of firewood consumption, 30.8% of CO2e emissions, 20.7% of CO emissions, and 38.7% of PM2.5 emissions. This means that by 2050, firewood consumption in this type of user will be reduced to 16.4 PJ, CO2e emissions to 1.0 MtCO2e, CO emissions to 50.2 kt, and PM2.5 emissions to 4.2 kt. In this way, compared to the trend scenario, the consumption of 5.5 PJ of firewood, 0.5 MtCO2e, 19.9 kt of CO, and 2.5 kt of PM2.5 is avoided.
The greatest reduction occurs in rural areas in the SL-L where 3.33 PJ of firewood, 0.3 MtCO2e, 12.1 kt of CO, and 1.53 kt of PM2.5 are avoided. This means that with the implementation of ICS in this group, it is possible to avoid 60.8% of firewood consumption as well as CO2e emissions and the criteria pollutants of CO and PM2.5.
SL-L users in peri-urban areas are the second group that have the highest firewood consumption and highest avoided emissions, with 15.8% of the total, while in urban areas the avoided emissions are 11.7%.
5.6. Alternative Scenario for Mixed Users of Firewood Who Utilize Firewood as a Secondary Fuel Source
The consumption of firewood and emissions of CO
2e and criteria pollutants in the alternative scenario of the MSU is presented in
Figure 9, in which it is observed that the SL-L, as in the EFU and the MPU, has the greatest potential to avoid the consumption of firewood and its respective emissions with the implementation of ICS.
For the MSU global reduction related to the initial year are estimated, 11.6% in firewood consumption, 29.3% in CO2eemissions, 16.9% in CO, and 34.4% in PM2.5. In this way by 2050, firewood consumption is reduced to 11.4 PJ, CO2e emissions to 0.7 MtCO2e, CO to 34.8 kt, and PM2.5 to 2.9 kt. Compared to the trend scenario, 3.8 PJ of firewood to 0.4 MtCO2e, 13.8 kt of CO and 1.8 kt of PM2.5 are avoided.
The greatest reduction occurs in rural areas in the SL-L: 1.52 PJ of firewood, 0.14 MtCO2e, 5.54 kt of CO, and 0.70 kt of PM2.5. In this way, approximately 40% of firewood consumption and emissions are generally reduced.
In users in peri-urban areas in the SL-L and SL-ML, there is also a present significance of firewood consumption and avoided emissions, being 14.9% for SL-L and 11.4% for SL-ML. It is also notable to highlight that in urban areas the SL-ML achieves 19.8% of avoided emissions.
5.7. Cost-Benefit, Financial and Socioeconomic Analysis Results
This section presents the results of the cost benefit, financial and socioeconomic analysis of the implementation of the ICS in the tropical region of Mexico. These results are disaggregated by type of user, SL and SP, considering households who pay a monetary amount for the acquisition of firewood and those who do not.
5.7.1. Households That Pay for the Acquisition of Firewood
The case of households that pay to obtain firewood is shown in
Table 6. It is observed that all households of the SL of EFU and MPU present significant avoided costs due to the implementation of ICS.
In the EFU, SL-L households in rural areas have the highest cost for purchasing firewood in the BAU scenario, with a value of 327.84 million dollar (MUSD) followed by peri-urban areas with a value of 146.78 MUSD. These high costs are mainly due to the fact that these are the areas where the highest concentration of users is found. The highest investment cost to implement the ICS are found in urban areas with an investment cost of 14.29 MUSD, followed by peri-urban areas with an investment cost of 7.02 MUSD.
Our results also show that users in rural and peri-urban areas have the highest firewood avoided cost of 25.89 MUSD and 12.51 MUSD, respectively. If these avoided costs and the investment costs to implement ICS are considered. This mitigation measure represents a total benefit for the EFU of 11.60 MUSD in rural areas and 5.94 MUSD in peri-urban areas.
Given the benefits found for these EFU, the mitigation cost is consequently negative. The group of EFU from the SL-ML is shown to have −13.36 USD for each tCO2e avoided, while it is −6.05 to −6.29 for users in rural and urban areas that belong to the SL-L.
In the trend scenario of the MPU, households that belong to the SL-L in rural areas have the highest cost of firewood with a value of 162.79 MUSD, followed by SL-ML users in urban areas with 77.25 MUSD. On the other hand, the investment cost of implementing ICS in users who belong to the SL-L in rural areas is 8.77 MUSD, while in households in the SL-ML in urban areas, it is almost half (4.25 MUSD). Considering that the implementation of ICS translates into avoided firewood costs, −12.85 MUSD for MPU users in rural areas of SL-L and −6.93 MUSD in urban areas of SL-ML; a total benefit of 4.08 MUSD is achieved in the rural areas of SL-L and 2.68 MUSD in the urban areas of SL-ML.
The mitigation cost is negative in all MPU groups that pay for firewood as well as in the EFU, although these are slightly lower. Users of the SL-ML have a value of −9.27 USD for each tCO2e avoided. For users who belong to the SL-L in rural and urban areas, this value is −4.40 USD/tCO2e each, while for peri-urban areas, a value of −10.43 USD/tCO2e is reached.
The results in MSU behave very differently from the case of MPU. In the trend scenario, MSU belonging to the SL-ML in urban areas have the highest cost of firewood with a value of 137.50 MUSD, followed by users from the SL-L in rural areas with a value of 102.49 USD. In the alternative scenario, the investment cost of implementing ICS in SL-ML households in urban areas is 15.31 MUSD, while in SL-L households in rural areas this cost is 7.80 MUSD. Due to the existence of an avoided firewood cost when implementing ICS (−2.33 MUSD in urban areas of SL-ML and −8.09 MUSD in rural areas of SL-B), benefits of 2.98 MUSD are achieved in the urban areas of SL-ML and 0.30 MUSD in the rural areas of the SL-L.
It is important to note that the mitigation cost is positive only for the MSU of the SL-ML for all SP, at 8.03 USD/tCO2e, while for the SL-L users, these costs are negative; in peri-urban areas the mitigation cost is −13.52 USD/tCO2e while in rural and urban areas the mitigation cost is −0.72 USD/tCO2e.
Regarding the financial efficiency of ICS investments, we chose the IRR to evaluate users who pay when purchasing firewood. See the last column of
Table 6, where the highest profitability is found in the MPU users of the SL-L of peri-urban areas with an IRR of 50.19%, five times the discount rate used in this article. Also showing high rentabilities of between 26.72% and 39% were all EFUs in the SL-ML, MPUs of all SPs, SL-L of rural and urban areas, and the SL-L MSUs of peri-urban areas. These users who showed the highest profitability would be the priority when establishing financial programs for ICS implementation.
On the contrary, the MSU in the SL-ML for all SP show IRR with negative values because these groups have lower per capita consumption of firewood, so the implementation of ICS are not high and sufficient to cover the initial cost of the ICS. In this case, the ICS implementation is not profitable and will require the support of some other financial mechanism.
5.7.2. Households Who Do Not Pay for Firewood Acquisition
In the case of users who do not pay for the acquisition of firewood, the cost-benefit analysis includes only the investment cost of implementing ICS in the alternative scenario.
Table 7 presents these costs as well as the mitigation cost for each type of user, SL and SP.
All types of firewood users present positive mitigation cost for each tCO2e avoided. In the EFU, all SL-ML households have the highest mitigation cost with a value of 16.33 USD/tCO2e, while for SL-L households in rural areas, its value is 7.74 USD/tCO2e and, in fact, this group have the lowest mitigation costs of all types of users who do not pay for acquisition of firewood. This is because in this socioeconomic level, rural areas have the largest number of users but, at the same time, this group has the highest consumption of firewood per household. Although this group has the highest investment cost in ICS of all user types (58.45 MUSD), each of the ICSs reduce more CO2e emissions per household. Consequently, this results in lower costs related to the rest of the users that do not pay for firewood acquisition.
The trend is similar in MPU and MSU, where the mitigation cost is higher in the SL-ML level than in SL-L. The mitigation cost for MSU belonging to the SL-ML is 14.73 USD/tCO2e and 9.45 USD/tCO2e for SL-L users, 35% lower than SL-ML. The MSU users belonging to the SL-ML have the highest mitigation cost of all types of users (41.23 USD/tCO2e) because this group have the lowest firewood consumption per household of all user types. In users belonging to the SL-L, the mitigation cost is 54% lower than the SL-ML (18.90 USD/tCO2e).
Among all users, those that pay for firewood and those who do not, other social benefits that until now have not been analyzed must be taken into account, such as the reduction in respiratory diseases due to the reduction of CO and PM2.5 indoor emissions, as well as the corresponding avoided health services cost of the exposed population. Also, the avoided cost related to the reduction of the number of labor days lost must be considered.
Additionally, and taking into account that mostly women are those who have the greatest direct contact with cooking devices and that a considerable percentage of women are heads of family, the social benefits that result from reducing firewood consumption would contribute to improving aspects of gender equity and energy poverty.
5.8. Regional Results
At a regional level in Mexico in 2018, firewood consumption was 74.77 PJ and emissions were 5.03 MtCO2e, 239.87 kt of CO, and 22.88 kt of PM2.5. By the year 2050 in the trend scenario, which is characterized by the use of TSF for cooking, firewood consumption increases up to 86.04 PJ, and emissions to 5.78 MtCO2e, 275.27 kt of CO, and 26.33 kt of PM2.5. These relatively mild increases are due to a decrease in the growth rate of the firewood user population in this region, especially in the rural areas where most of the firewood users are located.
By the year 2050, the alternative scenario, with the implementation of ICS, firewood consumption will decrease to 64.54 PJ when compared to the year 2018, and, consequently, CO2e emissions will decrease to 3.81 MtCO2e, CO to 197.12 kt, and PM2.5 to 6.47 kt, which corresponds to decreases of 14%, 24%, 18%, and 28% in energy, CO2e emission and criteria pollutants, respectively, compared to the base year.
When comparing the base scenario and the alternative scenario in the analysis period, results of 21.51 PJ of firewood consumption were avoided, and we achieved reductions of 1.8 MtCO2e, 78.14 kt of CO, and 9.93 kt of PM2.5 are avoided for year 2050. This means reductions of 25% in firewood consumption, 34% in CO2e emissions, 28% in CO and 38% in PM2.5. For the entire period, results of 354.95 PJ of accumulated firewood consumption were avoided, and the implementation of alternative scenario achieves accumulated reductions of 36.6 MtCO2e, 1.29 Mt of CO, and 163.78 kt of PM2.5 are avoided cumulatively.
For users who pay for the acquisition of firewood, there is a total avoided cost of 123.61 MUSD for acquiring firewood and a total investment cost for implementing the ICS of 88.65 MUSD, which translates into an average mitigation cost equal to −3.35 USD for each tCO2e avoided. For users who do not pay for the acquisition of firewood, the investment cost of implementing the ICS is 175.67 MUSD; this translates into a mitigation cost of 11.73 USD/tCO2e.
5.9. Sensitivity Analysis
We performed a sensitivity analysis to identify the effects of three parameters on avoided energy consumption and avoided CO2e, CO, and PM2.5 emissions by type of user (EFU, MPU, and MSU). These parameters are (1) fuelwood non-renewability factor (NRF), (2) the improvement in the efficiency of the ICS, and (3) the calorific value of fuelwood. The following subsections show the resulting sensitivity analysis.
5.9.1. Impacts on Avoided Energy Consumption
We analyzed the avoided energy consumption due to variations in the NRF ranging from −10% to 10%; when the percentage is negative, it means that there is an improvement in the renewability of firewood, and when it is positive, it means the opposite, i.e., that the use of non-renewable firewood increases. For this parameter, we found no sensitivity in avoided energy consumption for the three firewood user types because there is no distinction between renewable and non-renewable firewood during firewood consumption.
Regarding variations in improving the efficiency of ICS compared to TSF, the results show that, for the EFU, if there is a variation of −10%, the avoided energy consumption has the same variation. If it varies by 10%, the analysis shows it has the same variation (10%) in avoided energy. Our results show the same effect for the other two types of users (MPU and MSU). According to these results, the avoided energy consumption is highly sensitive to improving the ICS efficiency.
Finally, when the firewood calorific value varies (from −10% to 10%), as in the case of NRF, it was also found that there is no sensitivity in the avoided energy consumption of firewood, so only the volumes of this biofuel will vary.
5.9.2. Impacts on Avoided Emissions of CO2e, CO, and PM2.5
The results of the impact of FNR variations on avoided CO
2e, CO, and PM
2.5 emissions show that this parameter only impacts avoided CO
2e emissions for the three types of users (EFU, MPU, and MSU) (see
Table 8). Indeed, for EFU, a −10% variation in NRF causes a −4.69% variation in avoided CO
2e emissions, while for MPU and MSU, we see variations of −4.17% and −4.02%, respectively
Concerning the impact of the variations of ICS energy efficiency, we found that for the EFU, if this parameter is varied by −10%, the avoided CO emissions are reduced by 8.40%; for PM2.5 and CO2e, these decreases are 5.51%, and 5.70%, respectively. On the contrary, if this parameter improves by 10%, these values improve with the same variations, increasing the avoided emissions.
In the case of the MPUs, when the improvement in the ICS efficiency varies −10%, the variations for avoided CO and PM2.5 emissions are very similar to those found for the EFU, while for avoided CO2e emissions, the reduction is less than in the EFU and equal to 4.17%. For these same users, if the improvement parameter in the efficiency of the ICS were to vary by 10%, the results would be symmetrical to those already mentioned for a variation of −10%.
In the case of the MSU, concerning avoided CO and PM2.5 emissions, the same variations are reported for the MPU; however, for avoided CO2e emissions, the variation is more significant than for the other two types of users, reaching 6.13%. Given these values, modifications in this parameter contribute significantly to increased avoided emissions of climate change and criteria pollutants.
Regarding the impact of variations of firewood heat value, from −10% to 10%, the results show that for a variation of −10% of this parameter, regarding EFU, the avoided emissions of CO and PM2.5 have an increase of 11.11% in both pollutants. While avoided emissions of CO2e have an increase of 9.03%. On the other hand, if the firewood heat value increases by 10%, there is a reduction in avoided CO and PM2.5 emissions of 9.09% each, and for avoided CO2e emissions, the reduction is 7.39%.
Concerning the MPU, when the variation is −10%, the avoided emissions of CO2e, CO, and PM2.5 have a reduction of 11.11% each. On the contrary, when the firewood calorific value. For the opposite case, a 10% variation produces a 9.09% decrease in avoided emissions of the three pollutants (CO2e, CO, and PM2.5). Finally, for the MSU, results equal to those of the MPU were found when this parameter varied from −10% to 10%. According to these results, the avoided CO2e, CO, and PM2.5 emissions are very sensitive to this parameter.
The sensitivity analysis results show that improving the ICS energy efficiency is relevant for reducing energy consumption. For avoided CO2e, PM2.5, and CO emissions, our results show that the most relevant parameter is the firewood calorific value, followed by the improvement in ICS efficiency, while the NRF has a significant impact on CO2e emissions.
6. Discussion
The ICS implementation shows that firewood consumption can be avoided without compromising the satisfaction of the cooking in homes that depend on firewood, as well as avoiding CO
2e emission and criterion pollutants. These reductions are in agreement with previous studies reported for countries with high firewood consumption in which the ICS implementation has been analyzed [
14,
25,
31].
In Kenya, the study of ICS implementation from 2015–2035 performance by Carvalho et al. [
33] obtained a reduction in firewood consumption of up to 9.3% in an alternative scenario related to a BAU scenario. Concerning emission reductions, CO
2e was reduced by 26.5%, CO by 54%, and PM
2.5 by 41.9%.
Our results showed that in Mexican RC-TR, the resulting reduction of fuelwood consumption to the year 2035 is 14%, 5 points higher than Kenya study. Regarding CO2e, CO, and PM2.5 emissions in our study, we found reductions of 19%, 16%, and 21%, respectively, when comparing the alternative scenario to the BAU scenario, where the reductions in CO2e emissions are lower by 7.5 points than those reported for Kenya. At the same time, the reductions in CO y PM2.5 are 38 points and 21 points lower, respectively. These differences could originate from the different biomass types, ICS efficiency and firewood renewability factor considered in both studies, which affect the estimates of CO2e, CO, and PM2.5 emissions.
Previous studies in Mexico have been carried out at a national level, where the analyzed projection period has been 2030 and 2035 and has only the analysis of fuelwood consumption and CO
2e emissions was covered. In the study by [
30], they proposed a national ICS implementation in the period 2005–2030, and obtained a reduction of 15.87% in firewood consumption and 8.28% in the reduction of CO
2e emissions related to a BAU scenario. On the other hand, the study by [
32], whose period of analysis is from 2014 to 2030 in the scenario of implementation only of ICS, the reduction in firewood consumption is 28% and 29.3% in the CO
2e emissions. The variation in these results between the latter two authors is due to the different assumptions considered, especially those related to structural changes from exclusive firewood users to mixed firewood and LPG users in the study by [
32].
Compared to study [
30], our results show a percentage reduction in the year 2030 of firewood consumption of 5 points, mainly because the assumption was that all users were EFU, resulting in higher per capita consumption. Compared to the study [
32], their results show a reduction in firewood consumption towards 2030, 18 points higher than in the present article. This difference lies in the assumption of a structural change from EFU to mixed users from firewood to LPG, in addition to improving the efficiency of the ICS 50%, the double of the considered value in the present article. These considerations also explain the differences between the CO
2e reduction percentages, we obtained a 14% reduction by 2030.
Concerning the analysis of CO and PM2.5 criteria pollutants emissions from the use of firewood for cooking, our study contributes, unlike the authors mentioned, knowledge about the magnitude of these pollutants that have negative impacts on the human health of users. We recommend further studies in this area.
Concerning the cost-benefit analysis, the present study shows for the first time a distinction between households that pay for firewood and those that do not pay.
Regarding mitigation cost compared to other studies conducted in Mexico, our results show, at a regional level, that the case of users who pay for the acquisition of firewood have no mitigation cost (−3.35 USD/tCO
2) compared to those reported by [
35] which is at the national level, with a value of 6.55 USD/tCO
2e, and those reported by [
34] of 7 USD/tCO
2e. In the case of users who do not pay for the acquisition of firewood, this mitigation cost is higher in the present article (11.73 USD/tCO
2e).
This article also presents for the first time the trend of firewood consumption disaggregated by user type, socioeconomic level, and size population centers, identifying a diversity of benefits that are detailed in the article, when moving towards clean cooking technologies. Thus, obtaining an integral vision to provide solutions to problems derived from the use of firewood in cooking that have an impact on health, energy poverty, and gender equity.
The limits of this study include the lack of specific data for CR-TR on the type of firewood used in that region, the location of the TSF—inside or outside the dwellings—and the efficiency of ICS with field values. In the absence of such information, we used a homogeneous composition and calorific value of firewood, and a homogeneous ICS efficiency value. Also, we considered that the TSF was used and located indoors.
Another significant limitation is the absence of other historical surveys, such as the ENCEVI, in order to have data that would provide greater certainty in constructing the baseline scenario. As far as we know, it is impossible to define whether the users who pay for the acquisition of firewood do so in its entirety or only as a part of their consumption due to the absence of historical data.
Finally, there is the limitation that this study does not consider other technological options such LPG and electricity for cooking, it only focuses on devices that consume firewood.
7. Conclusions
The analysis of firewood consumption scenarios carried out in the CR-TR, where, in 2018, there was the most significant number of firewood users (16,026,258 Inh.) and the highest consumption of firewood for cooking in Mexico (74.77 PJ), shows the possibility of making important reductions in firewood consumption and consequently in CO2e, CO and PM2.5 emissions with the implementation of ICS.
Most of the firewood users in this region, 11.05 M Inh., are of low socioeconomical level, the poorest in Mexico, of which 5.95 M Inh. are EFU, 2.6 M Inh. are MPU, and 2.08 M Inh. are MSU. Our results show that, particularly in rural areas of Mexico, where 8,894,281 Inh. are concentrated, a government program to promote ICS would have the best and broadest impacts of reducing firewood consumption, mitigating CO2e, and criteria pollutants. Furthermore, promoting ICS in the aforementioned areas would have the greatest socioeconomic, health, energy poverty-positive effects, and would also achieve the incorporation of gender equity criteria.
More than one-third of firewood users (34%) pay to acquire this traditional biofuel and mostly live in peri-urban, urban areas and, to a lesser extent, in rural areas. According to our results since the beginning of the ICS implementation, these users retain high economic benefits per household, the most significant being for the EFU and MPU, and, consequently, this group has, in general, no mitigation costs and a high financial return. These results suggest that a governmental ICS implementation program would be successful in urban and peri-urban environments, where a high percentage of firewood users pay for this biofuel. Its social cost would be null and void and it would have potential positive impacts on energy poverty, health aspects, due to respiratory diseases reduction, and the consequent decrease in labor absences that can represent important costs. Gender aspects would also see an improvement because of a reduction of CO and PM2.5 pollutants, due to ICS implementation, have a more significant impact on the health of women, who are primarily in charge of cooking. Financially, there would be an alleviation on the purchasing power aspects of these firewood users due to the savings compared to firewood from ICS, which will allow these users to have more resources to satisfy other social needs.
These users who pay for firewood also reveal the existence of numerous local firewood markets that are primarily informal and where firewood can be related to forest deforestation, for which there is no institutional regulation. Based on the results of this article, it is estimated that by 2050, these users would pay a cumulative total of 1475 MUSD for firewood. This indicates that these local firewood markets are not a minor matter and are very likely to grow in the future, thus having a negative impact on the income of users, and an impact on the issue of energy poverty and deforestation. Therefore, we suggest developing national legislation to regulate them with sustainable development criteria, combating climate change; this could be done, on the one hand, by identifying, registering, and regulating the aforementioned firewood markets as well as their commercial scale. On the other hand, requiring that all firewood sold in these already formalized markets be certified through a standard from the Environment Ministry of Mexico (SEMARNAT, for its acronym in Spanish), in terms of whether its origin is from a forest with management or from an equivalent use of biomass.
The sensitivity analysis shows that improving the ICS’s efficiency is relevant to reducing energy consumption from solid biofuels. At the same time, the calorific value of biomass is relevant for avoided emissions of CO2e, PM2.5, and CO. This leads us to consider that a policy to promote the use of solid biofuels should encourage the use of ICS with condensed biofuels that have a higher calorific value, such as pellets and briquettes, as a better option to combat climate change, the health problems associated with firewood, and the deforestation of forests associated with this consumption.
The authors consider that the issues of barriers to financing ICS implementation, health impact, gender equity, energy poverty, and deforestation associated with firewood consumption in Mexico are relevant and require future research.


