

Factors Influencing Electricity Consumption in Rural Households
 , , and
Abstract
1. Introduction
2. Review of Related Literature
- Community 1—Socio-Demographic Dynamics: income (1), occupation (0.64), age (0.57), biological sex (0.43), education (0.40);
- Community 2—Economic and Housing Profile: expenditure (0.97), housing (0.83), household size (0.64), social classes (0.42);
- Community 3—Energy Use and Accessibility: number of appliances (0.86), hours of use (0.58), technology (0.58), power supply (0.39), affordability (0.25), reliability (0.24).
Sustainable Rural Electrification Programs—PERS
3. Data and Methodology
4. Results
5. Discussion
6. Conclusions
Author Contributions
Funding
Data Availability Statement
Acknowledgments
Conflicts of Interest
Abbreviations
| CFL | Compact Fluorescent Light Bulb |
| CRT | Cathode-Ray Tube |
| DANE | Departamento administrativo nacional de estadística (National Administrative Department of Statistics) |
| HH | Households |
| IPSE | Instituto de Planificación y Promoción de Soluciones Energéticas para Zonas No Interconectadas (Institute for Planning and Promotion of Energy Solutions for Non-Interconnected Zones) |
| m.a.s.l. | Meters above sea level |
| MCA | Multiple correspondence analysis |
| PERS | Programa de Electrificacion Rural Sostenible (Sustainable Rural Electrification Programs) |
| PSU | Primary sampling unit |
| SDG | Sustainable Development Goals |
| SDG7 | Sustainable Development Goal 7 (Ensure universal access to affordable, reliable, sustainable, and modern energy) |
| TV/ppl | TVs/people |
| UPME | Unidad de Planeación Minero Energética (Mining and Energy Planning Unit) |
References
- Twumasi, M.A.; Jiang, Y.; Addai, B.; Asante, D.; Liu, D.; Ding, Z. Determinants of household choice of cooking energy and the effect of clean cooking energy consumption on household members’ health status: The case of rural Ghana. Sustain. Prod. Consum. 2021, 28, 484–495. [Google Scholar] [CrossRef]
- Gherhes, V.; Alina, M. Sustainable Behavior among Romanian Students: A Perspective on Electricity Consumption in Households. Sustainability 2021, 13, 9357. [Google Scholar] [CrossRef]
- World Bank; World Health Organization. Measuring Energy Access: A Guide to Collecting Data Using ‘The Core Questions on Household Energy Use; WHO: Geneva, Switzerland, 2021. [Google Scholar]
- Xia, X.; Sun, H.; Yang, Z.; Yuan, W.; Ma, D. Decoupling Analysis of Rural Population Change and Rural Electricity Consumption Change in China. Int. J. Environ. Res. Public Health 2022, 19, 6676. [Google Scholar] [CrossRef]
- Siemiński, P.; Hadyński, J.; Lira, J.; Rosa, A. Regional diversification of electricity consumption in rural areas of Poland. Energies 2021, 14, 8532. [Google Scholar] [CrossRef]
- Share of Electricity in Total Final Energy Consumption. Available online: https://yearbook.enerdata.net/electricity/share-electricity-final-consumption.html (accessed on 8 March 2024).
- Final Consumption—Key World Energy Statistics 2021—Analysis—IEA. Available online: https://www.iea.org/reports/key-world-energy-statistics-2021/final-consumption (accessed on 8 March 2024).
- Distribution of Final Electricity Consumption Worldwide in 2018, by Sector. Available online: https://www.statista.com/statistics/859150/world-electricity-consumption-share-by-sector/#:~:text= (accessed on 1 March 2024).
- Proedrou, E. A Comprehensive Review of Residential Electricity Load Profile Models. IEEE Access 2021, 9, 12114–12133. [Google Scholar] [CrossRef]
- UPME. Actualización Plan Energético Nacional (PEN) 2022–2052. 2023. Available online: https://www1.upme.gov.co/DemandayEficiencia/Documents/PEN_2020_2050/Actualizacion_PEN_2022-2052_VF.pdf (accessed on 1 March 2024).
- Groh, S. The Role of Access to Electricity in Development Processes: Approaching Energy Poverty through Innovation. Ph.D. Thesis, Department of Development and Planning, Aalborg University, Aalborg, Denmark, 2015; p. 174. [Google Scholar]
- Louie, H. Off-Grid Electrical Systems in Developing Countries; Springer: Berlin/Heidelberg, Germany, 2018. [Google Scholar]
- Kaygusuz, K. Energy services and energy poverty for sustainable rural development. Renew. Sustain. Energy Rev. 2011, 15, 936–947. [Google Scholar] [CrossRef]
- Zi, C.; Qian, M.; Baozhong, G. The consumption patterns and determining factors of rural household energy: A case study of Henan Province in China. Renew. Sustain. Energy Rev. 2021, 146, 111142. [Google Scholar] [CrossRef]
- Van Der Kroon, B.; Brouwer, R.; Beukering, P. The energy ladder:Theoretical myth or empirical truth? Results from a meta-analysis. Renew. Sustain. Energy Rev. 2013, 20, 504–513. [Google Scholar] [CrossRef]
- Yohanis, Y.G. Domestic energy use and householders’ energy behaviour. Energy Policy 2012, 41, 654–665. [Google Scholar] [CrossRef]
- Dergiades, T.; Tsoulfidis, L. Estimating Residential Demand for Electricity in the United States, 1965–2006 Revisiting Residential Demand for Electricity in Greece: New Evidence from the ARDL Approach to Cointegration; Springer: Berlin/Heidelberg, Germany, 2008. [Google Scholar] [CrossRef]
- Anable, J. Energy 2050—WG1 Energy Demand Lifestyle and Energy Consumption Working Paper; UK Energy Research Center: London, UK, 2011. [Google Scholar]
- Hayn, M.; Bertsch, V.; Fichtner, W. Electricity load profiles in Europe: The importance of household segmentation. Energy Res. Soc. Sci. 2014, 3, 30–45. [Google Scholar] [CrossRef]
- Mutumbi, U.; Thondhlana, G.; Ruwanza, S. Reported Behavioural Patterns of Electricity Use among Low-Income Households in Makhanda, South Africa. Sustainability 2021, 13, 7271. [Google Scholar] [CrossRef]
- Rahut, D.B.; Behera, B.; Ali, A.; Marenya, P. A ladder within a ladder: Understanding the factors influencing a household’s domestic use of electricity in four African countries. Energy Econ. 2017, 66, 167–181. [Google Scholar] [CrossRef]
- McVeigh, J.C.; Mordue, J.G. Energy Demand and Planning; E & FN Spon: London, UK, 1999. [Google Scholar]
- Alvial-Palavicino, C.; Garrido-Echeverría, N.; Jiménez-Estévez, G.; Reyes, L.; Palma-Behnke, R. A methodology for community engagement in the introduction of renewable based smart microgrid. Energy Sustain. Dev. 2011, 15, 314–323. [Google Scholar] [CrossRef]
- Jones, R.V.; Fuertes, A.; Lomas, K.J. The socio-economic, dwelling and appliance related factors affecting electricity consumption in domestic buildings. Renew. Sustain. Energy Rev. 2015, 43, 901–917. [Google Scholar] [CrossRef]
- Li, Z.; Lv, L.; Zhang, Z. Research on the Characteristics and Influencing Factors of Chinese Urban Households’ Electricity Consumption Efficiency. Energies 2022, 15, 7748. [Google Scholar] [CrossRef]
- Soares, R.S.; Weiss, M.; Lampis, A.; Bermann, C.; Hallack, M. La Pobreza Energética en Los Hogares y Su Relación con Otras Vulnerabilidades en América Latina: El Caso de Argentina, Brasil, Colombia, Perú y Uruguay; Banco Interamericano de Desarrollo: New York, NY, USA, 2023; pp. 1–80. [Google Scholar]
- Wu, S.; Zheng, X.; You, C.; Wei, C. Household energy consumption in rural China: Historical development, present pattern and policy implication. J. Clean. Prod. 2019, 211, 981–991. [Google Scholar] [CrossRef]
- Anvari, M.; Proedrou, E.; Schäfer, B.; Beck, C.; Kantz, H.; Timme, M. Data-driven load profiles and the dynamics of residential electricity consumption. Nat. Commun. 2022, 13, 1–12. [Google Scholar] [CrossRef] [PubMed]
- Oparaocha, S.; Ibrekk, H.O. Accelerating Sdg7 Achievement Policy Briefs in Support of the First Sdg7 Review at the Un High-Level Political Forum 2018; United Nations: New York, NY, USA, 2018.
- Alloisio, I.; Zucca, A. SDG 7 as the enabling factor for sustainable development: The role of technology innovation in the electricity sector. In Proceedings of the International Conference on Sustainable Development, New York, NY, USA, 23–24 September 2015; pp. 1–28. [Google Scholar]
- Eras, J.J.C.; Fandiño, J.M.M.; Gutiérrez, A.S.; Bayona, J.G.R.; German, S.J.S. The inequality of electricity consumption in Colombia. Projections and implications. Energy 2022, 249, 123711. [Google Scholar] [CrossRef]
- Igawa, M.; Managi, S. Energy poverty and income inequality: An economic analysis of 37 countries. Appl. Energy 2022, 306, 118076. [Google Scholar] [CrossRef]
- Xie, Q.; Bai, D.; Cong, X. Modeling the dynamic influences of economic growth and financial development on energy consumption in emerging economies: Insights from dynamic nonlinear approaches. Energy Econ. 2022, 116, 106404. [Google Scholar] [CrossRef]
- Carvalho, A, Drivers of reported electricity service satisfaction in transition economies. Energy Policy 2017, 107, 151–157. [CrossRef]
- Nathan, H.S.K.; Hari, L. Towards a new approach in measuring energy poverty: Household level analysis of urban India. Energy Policy 2020, 140, 111397. [Google Scholar] [CrossRef]
- Che, X.; Zhu, B.; Wang, P. Assessing global energy poverty: An integrated approach. Energy Policy 2021, 149, 112099. [Google Scholar] [CrossRef]
- Day, R.; Walker, G.; Simcock, N. Conceptualising energy use and energy poverty using a capabilities framework. Energy Policy 2016, 93, 255–264. [Google Scholar] [CrossRef]
- Kowsari, R.; Zerriffi, H. Three dimensional energy profile: A conceptual framework for assessing household energy use. Energy Policy 2011, 39, 7505–7517. [Google Scholar] [CrossRef]
- Frederiks, E.R.; Stenner, K.; Hobman, E.V. The socio-demographic and psychological predictors of residential energy consumption: A comprehensive review. Energies 2015, 8, 573–609. [Google Scholar] [CrossRef]
- van Raaij, W.F.; Verhallen, T.M.M. A behavioral model of residential energy use. J. Econ. Psychol. 1983, 3, 39–63. [Google Scholar] [CrossRef]
- Costanzo, M.; Archer, D.; Aronson, E.; Pettigrew, T. Energy Conservation Behavior. The Difficult Path From Information to Action. Am. Psychol. 1986, 41, 521–528. [Google Scholar] [CrossRef]
- Abrahamse, W.; Steg, L.; Vlek, C.; Rothengatter, T. A review of intervention studies aimed at household energy conservation. J. Environ. Psychol. 2005, 25, 273–291. [Google Scholar] [CrossRef]
- Gouveia, J.P.; Seixas, J. Unraveling electricity consumption profiles in households through clusters: Combining smart meters and door-to-door surveys. Energy Build. 2016, 116, 666–676. [Google Scholar] [CrossRef]
- Buys, L.; Vine, D.; Ledwich, G.; Bell, J.; Mengersen, K.; Morris, P.; Lewis, J. A framework for understanding and generating integrated solutions for residential peak energy demand. PLoS ONE 2015, 10, e0121195. [Google Scholar] [CrossRef] [PubMed]
- Pachauri, S.; Rao, N.; Nagai, Y.; Riahi, K. Access to Modern Energy: Assessment and Outlook for Developing and Emerging Regions; IIASA: Laxenburg, Austria, 2012. [Google Scholar]
- UPME. Inicio—PERS Cundinamarca. Available online: https://sig.upme.gov.co/SIPERS (accessed on 1 March 2024).
- Rodriguez, C.L.T.; Roa, C.M.; Aldana, A.; Jacome, E. Plan de Energizacion Rural del Departamento de Cundinamarca PERS; Diagnostico Energetico del Departamento de Cundinamarca: Bogotá, Colombia, 2017; p. 96.
- Gamba, W.D. Caracterización Socioeconómica del Departamento de Cundinamarca—PERS Cundinamarca; Universidad Distrital Francisco José de Caldas: Bogotá, Colombia, 2017.
- Provincias de Cundinamarca|Provincias de Cundinamarca|Mapas y Estadísticas de Cundinamarca. Available online: https://mapas.cundinamarca.gov.co/datasets/37c336fd508e4025ba924d759d2c2984_0/explore?location=3.606568%2C-74.008879%2C7.78 (accessed on 14 February 2024).
- Perez, C.A.; Valles, C.F. UPME Documentos PERS. Available online: https://sig.upme.gov.co/SIPERS/Files/Index/1055 (accessed on 28 January 2024).
- Portafolio. Colombia se Inundó de Bombillos Obsoletos en 2018|Empresas|Negocios|Portafolio. Available online: https://www.portafolio.co/negocios/empresas/colombia-se-inundo-de-bombillos-obsoletos-en-2018-528377 (accessed on 28 January 2024).
- Alcott, B. Jevons’ paradox. Ecol. Econ. 2005, 54, 9–21. [Google Scholar] [CrossRef]


| Categories | Relationships with Variables |
|---|---|
| Incomes | A growing income is related to higher electricity consumption due to the possession of more household appliances and a bigger house. In addition, income is directly related to the following variables: expenses, housing (type of housing, walls, and floor materials), age, biological sex; education; occupation; public services; affordability; and more efficient technologies. Simultaneously, income is inversely correlated with the time spent seeking traditional or modern fuels, implying that people with lower incomes must search for fuel in more distant locations. |
| Energy expenditure | Higher expenses correlate with higher electricity consumption due to the possession of more household appliances, diversity of energy sources (traditional or modern) for housing and their substitutes, household size, age (older children and adolescents watch more television, use personal computers, and are frequent users of electronic devices for games; likewise, the presence of people over 65 years old at home causes an increase in consumption, because they stay at home longer than young people, although the power of the devices they use is lower), user habits and routines, geographical location and altitude, housing (type of housing, wall and floor materials), energy sources and availability, more efficient technologies.In addition, expenses are directly related to the following variables: income, number of rooms, rated power, and occupation. At the same time, expenses show an inverse relationship with energy expenditure. This is because a reliable service within a centralized system is more expensive due to infrastructure. |
| Homeownership | There is a notable energy consumption disparity between privately owned and rented homes. Moreover, when utility bills are integrated into rent payments, they tend to be significantly higher than those of tenants who pay separately. Tenants tend to consume more energy when utility costs are included in their rent, possibly due to less of a need for awareness about energy conservation. It is assumed that engaging in income-generating activities leads to higher energy consumption. |
| Number of electrical appliances | The number and use of electrical appliances are affected by household size and lifestyle (hours of service), which is strongly related to household electricity consumption. The purchase or acquisition of these appliances refers to income, expenses, device characteristics, technology, and electrical power supply. |
| Categories | Relationships with Variables |
|---|---|
| Hours of use | The mere existence of electrical appliances does not necessarily imply electricity consumption; user routines constitute a significant factor affecting household electricity consumption. In addition, it is necessary to consider the frequency of use of the appliances. There are direct relationships between electricity supply, energy costs, number of computers, and number of people. |
| Traditional fuels | There is a relationship between poverty and the use of traditional fuels, especially the use of firewood for cooking food, which causes health problems and pollution. |
| Modern fuels | According to policies promoting efficient energy use, modern fuels should be used for cooking activities, and other services should be utilized that are suitable substitutes for electricity, with the least significant environmental impact. |
| Categories | Relationships with Variables |
|---|---|
| Housing | Electrical energy consumption increases according to the separation of the dwelling, which suggests that single-family homes consume more electrical energy than semi-detached houses and apartments. As the number of rooms increases, more electricity is used; bedrooms are mainly used for sleeping and do not contain as many appliances as other rooms. The energy used for heating depends on the house’s wall and floor material. |
| Household composition | As the number of cohabitants increases, the total electrical energy use rises while per capita consumption decreases. Furthermore, the likelihood of individuals remaining at home during the day and utilizing household appliances increases consumption, impacting the load profile.Energy consumption correlates with age; older children and adolescents tend to engage more with television, laptops, and gaming devices, thus contributing to higher home energy use. Additionally, the presence of individuals over 65, who typically spend more hours at home, further contributes to increased energy consumption.The division of domestic labor, predominantly assigned to women, places the responsibility on them for acquiring fuel sources such as firewood or energy resources for cooking and heating purposes. Collecting firewood or other traditional energy sources is estimated to require an average of 2 to 20 h per week.Single-parent households demonstrate a notably higher electricity consumption compared to two-parent families. |
| Occupation | Occupation affects the time spent at home, allowing the use of appliances. Long periods of absence during the day, for example, due to full-time employment, shift loads to off-peak hours of the day. Additionally, a higher-ranking professional consumes more electricity than a lower-level professional because the former probably has a larger home and more appliances. In addition, occupation is related to education and income. |
| Education | Electricity consumption decreases with education level. In addition, education is related to occupation and income. |
| Utilities | These are related to social classes, housing, expenses, and income. |
| Categories | Relationships with Variables |
|---|---|
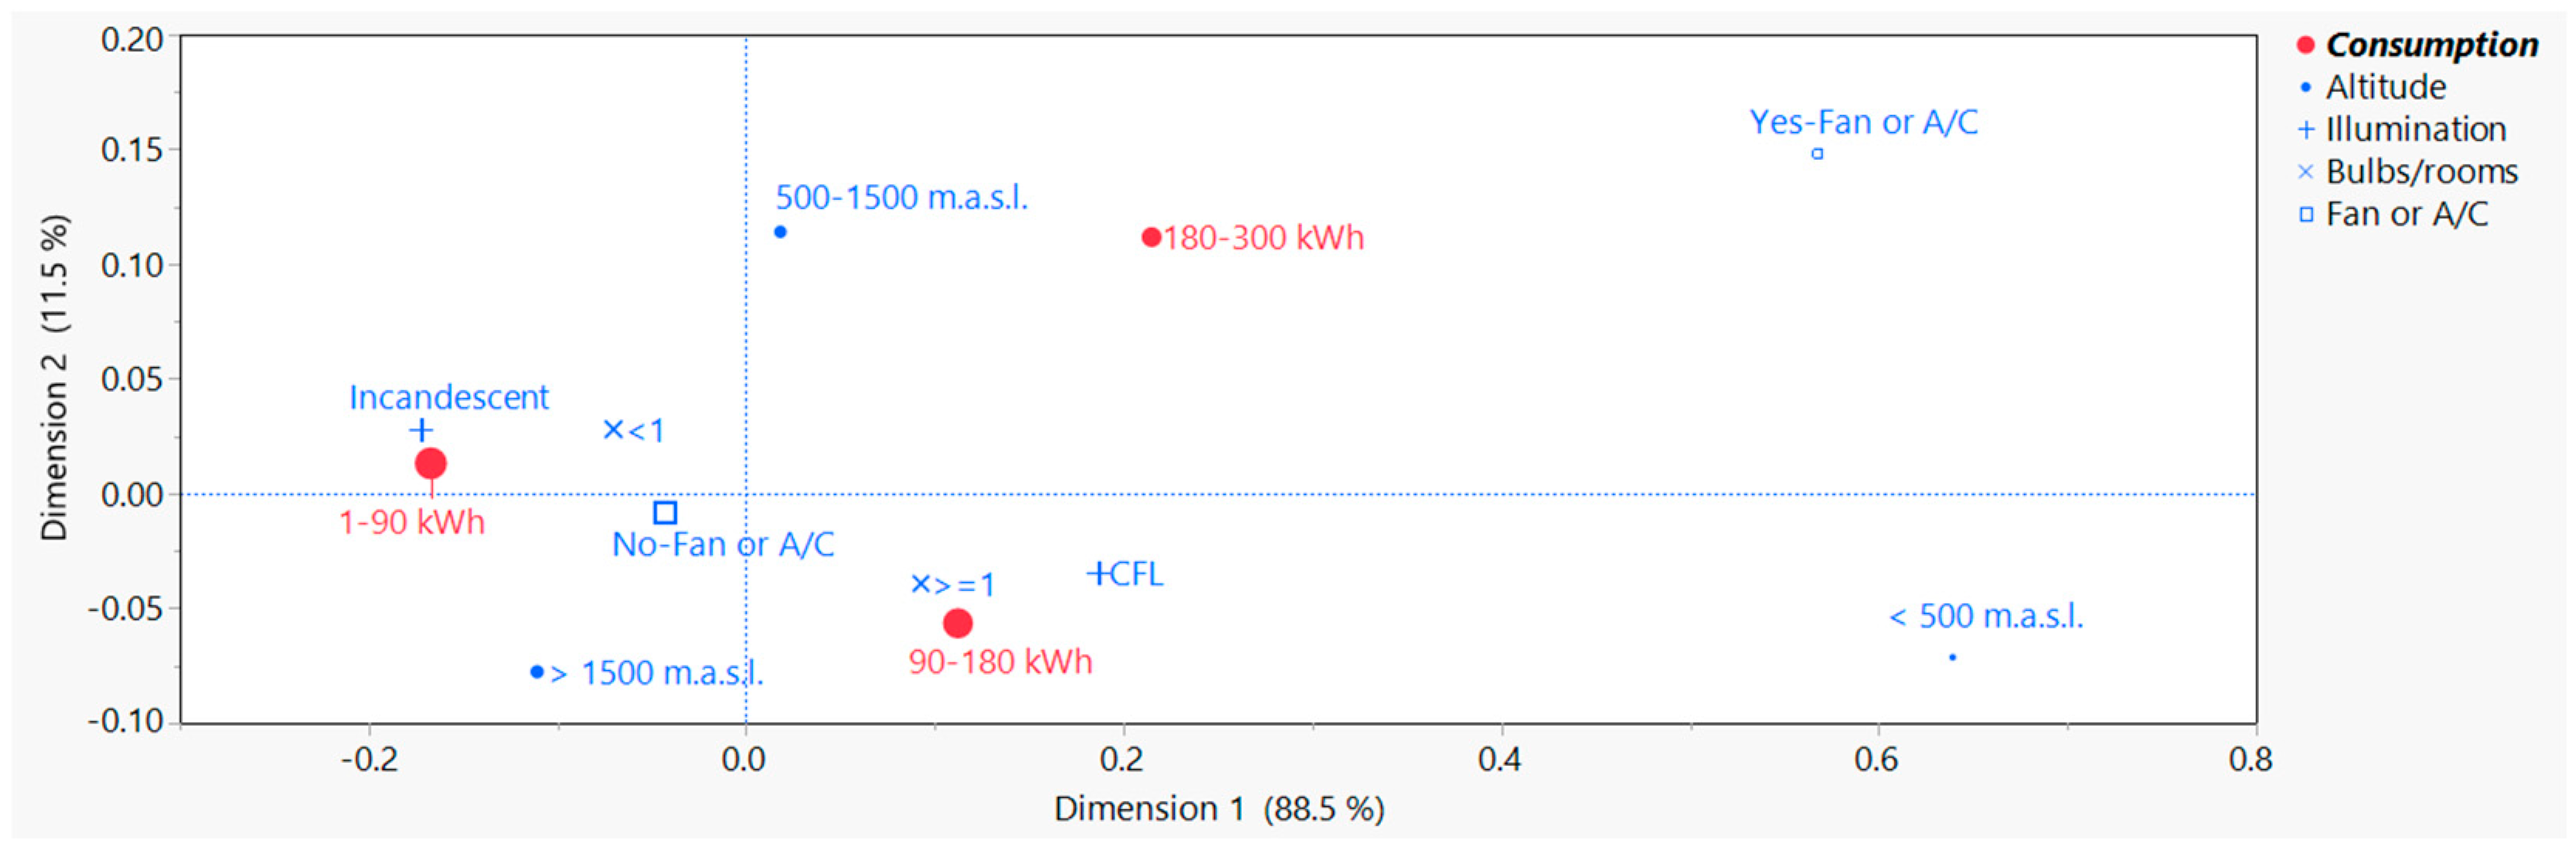
| Geographical location and altitude | Users will have fans, air conditioning, or heating according to the thermal floors or climatic zones. The house’s construction materials may be different; in addition, the characteristics of the refrigerator will have different features. |
| Socio-economic level | Socio-economic level positively affects total electricity consumption due to the greater number of household appliances. It also has a relationship with utilities and housing. In certain countries, subsidies and contributions are related to the socio-economic level. |
| Associations or groupings | The characteristic is related to groups with the same occupation or who are looking for complementary jobs to improve their income. |
| Climate change issues | Using traditional fuels causes environmental problems due to the generation of CO2. |
| Categories | Relationships with Variables |
|---|---|
| Energy sources and availability | Having a source of electricity does not guarantee universal electricity access, and access to electricity does not guarantee the capacity to pay for that service. In addition, a poor-quality service can deteriorate the user’s perception about the socio-economic benefits that the electricity service can provide. Energy availability creates new opportunities for the provision of essential services, the diversification of business activities, and the perception of social welfare.These aspects also relate to income, expenses, number of appliances, device characteristics, hours of use, and utilities. |
| Affordability | |
| Accessibility | |
| Reliability |
| Categories | Relationships with Variables |
|---|---|
| Technology | Due to new technologies, there is a “rebound effect”; higher appliance efficiency results in increased use and, therefore, an increase in total energy consumption. There are relationships with income, expenses, and the number of electric devices. |
| Replacement with substitutes | The cost of these devices depends on the availability and reliability of the power supply. |
| Rated power | New appliances or the replacement of inefficient appliances results in reduced electricity consumption. |
| TVs/People | Low Consumption (45.76%) | Medium Consumption (39.55%) | High Consumption (14.69%) |
|---|---|---|---|
| 0 | 20.68% | 10.00% | 7.69% |
| <0.5 | 13.89% | 14.29% | 12.50% |
| 0.5–1 | 22.22% | 27.86% | 23.08% |
| 1–1.5 | 20.37% | 27.50% | 32.69% |
| 1.5–2 | 16.67% | 12.86% | 14.42% |
| >2 | 6.17% | 7.50% | 9.62% |
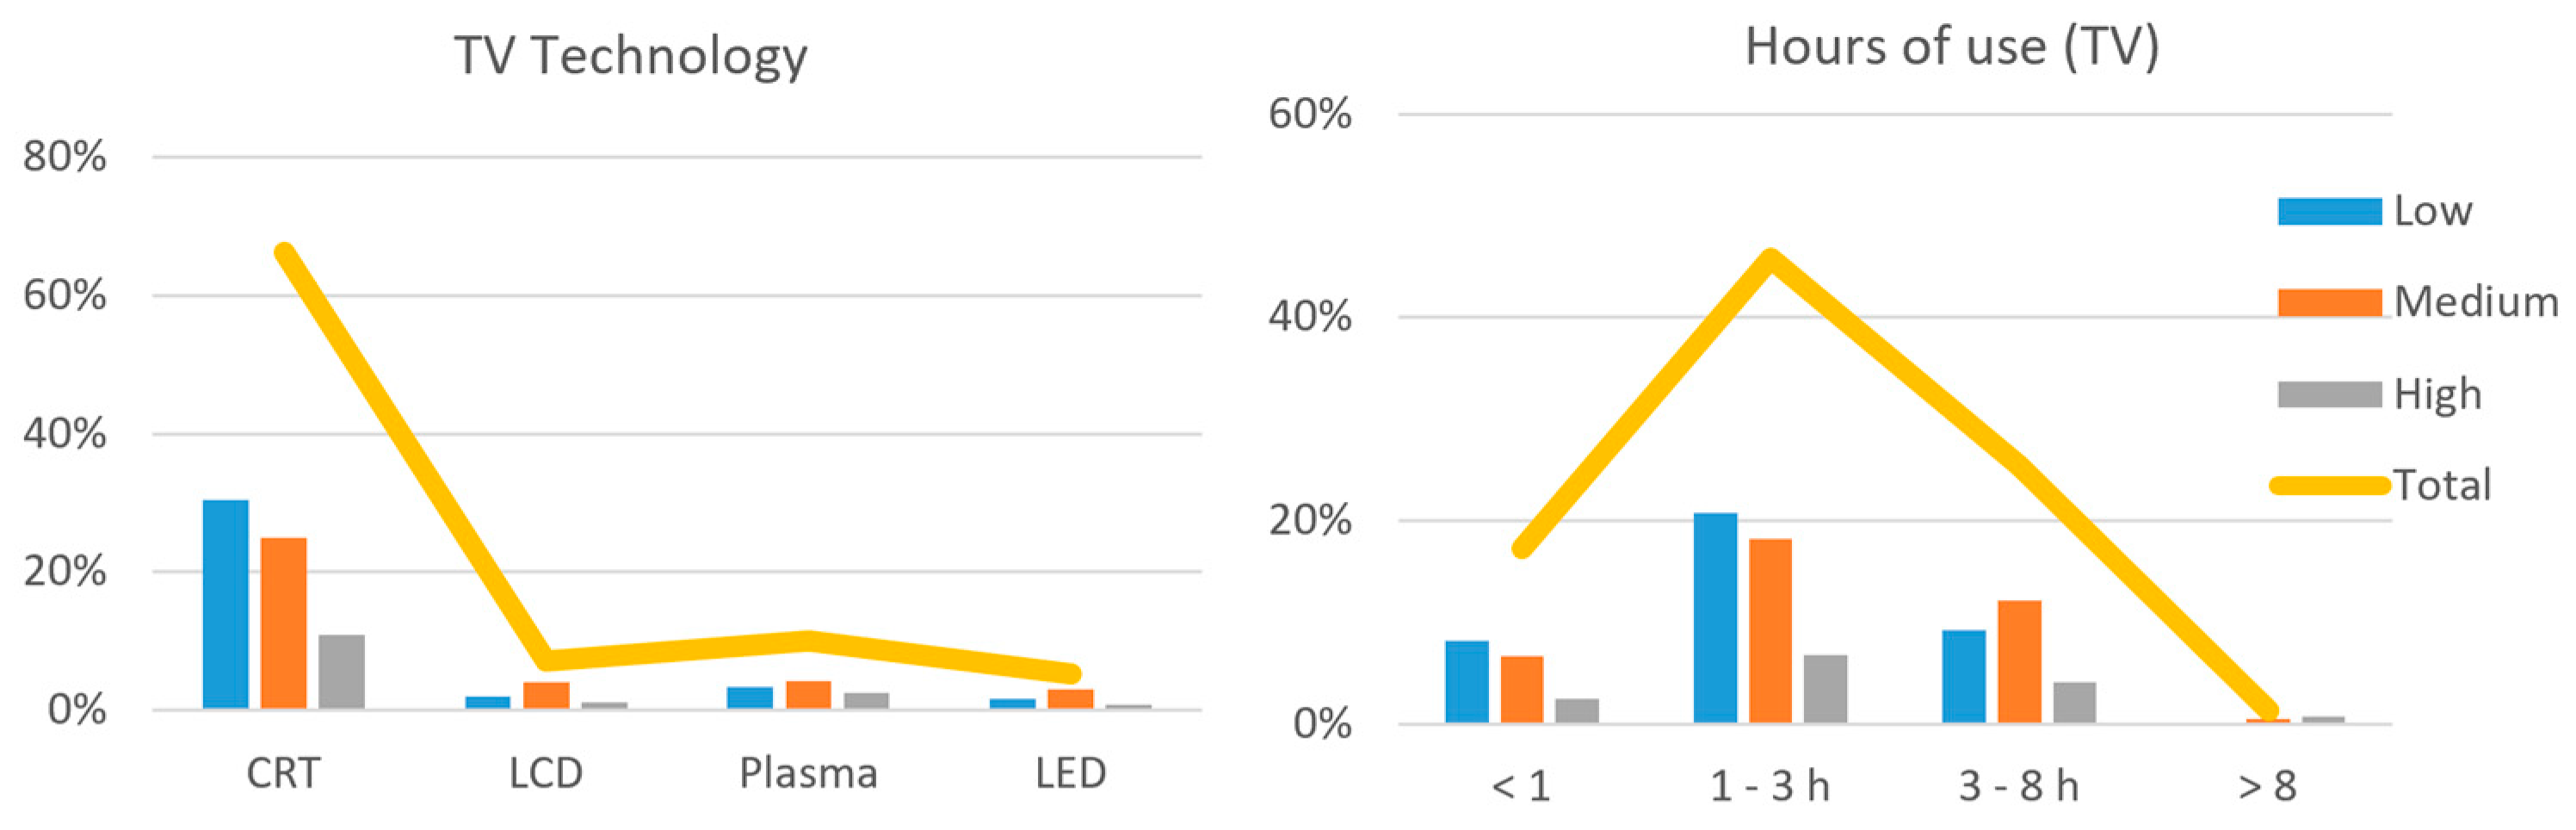
| Hours | Low | Medium | High | |||||||||
|---|---|---|---|---|---|---|---|---|---|---|---|---|
| CRT | LCD | Plasma | LED | CRT | LCD | Plasma | LED | CRT | LCD | Plasma | LED | |
| <1 | 15.43% | 0.93% | 0.62% | 0.62% | 10.00% | 0.71% | 1.43% | 1.43% | 12.50% | 0.96% | 0.96% | 0.96% |
| 1–3 h | 36.11% | 2.16% | 1.85% | 1.85% | 32.14% | 5.36% | 2.50% | 2.50% | 34.62% | 2.88% | 1.92% | 1.92% |
| 3–8 h | 14.51% | 1.23% | 0.93% | 0.93% | 20.36% | 3.93% | 3.21% | 3.21% | 23.08% | 1.92% | 0.96% | 0.96% |
| >8 | 0.31% | 0.00% | 0.00% | 0.00% | 0.71% | 0.00% | 0.36% | 0.36% | 3.85% | 1.92% | 0.96% | 0.96% |
| Income (USD) | Low Consumption | Medium Consumption | High Consumption |
|---|---|---|---|
| <32 | 13.89% | 4.64% | 3.85% |
| 32–48 | 13.89% | 5.36% | 4.81% |
| 48–64 | 9.88% | 7.50% | 6.73% |
| 64–159 | 28.70% | 27.86% | 27.88% |
| 159–239 | 19.14% | 28.57% | 25.00% |
| 239–318 | 7.41% | 13.57% | 15.38% |
| 318–476 | 2.16% | 5.36% | 2.88% |
| 476–636 | 1.23% | 1.43% | 4.81% |
| 636–953 | 0.31% | 2.50% | 2.88% |
| >953 | 0.31% | 1.07% | 2.88% |
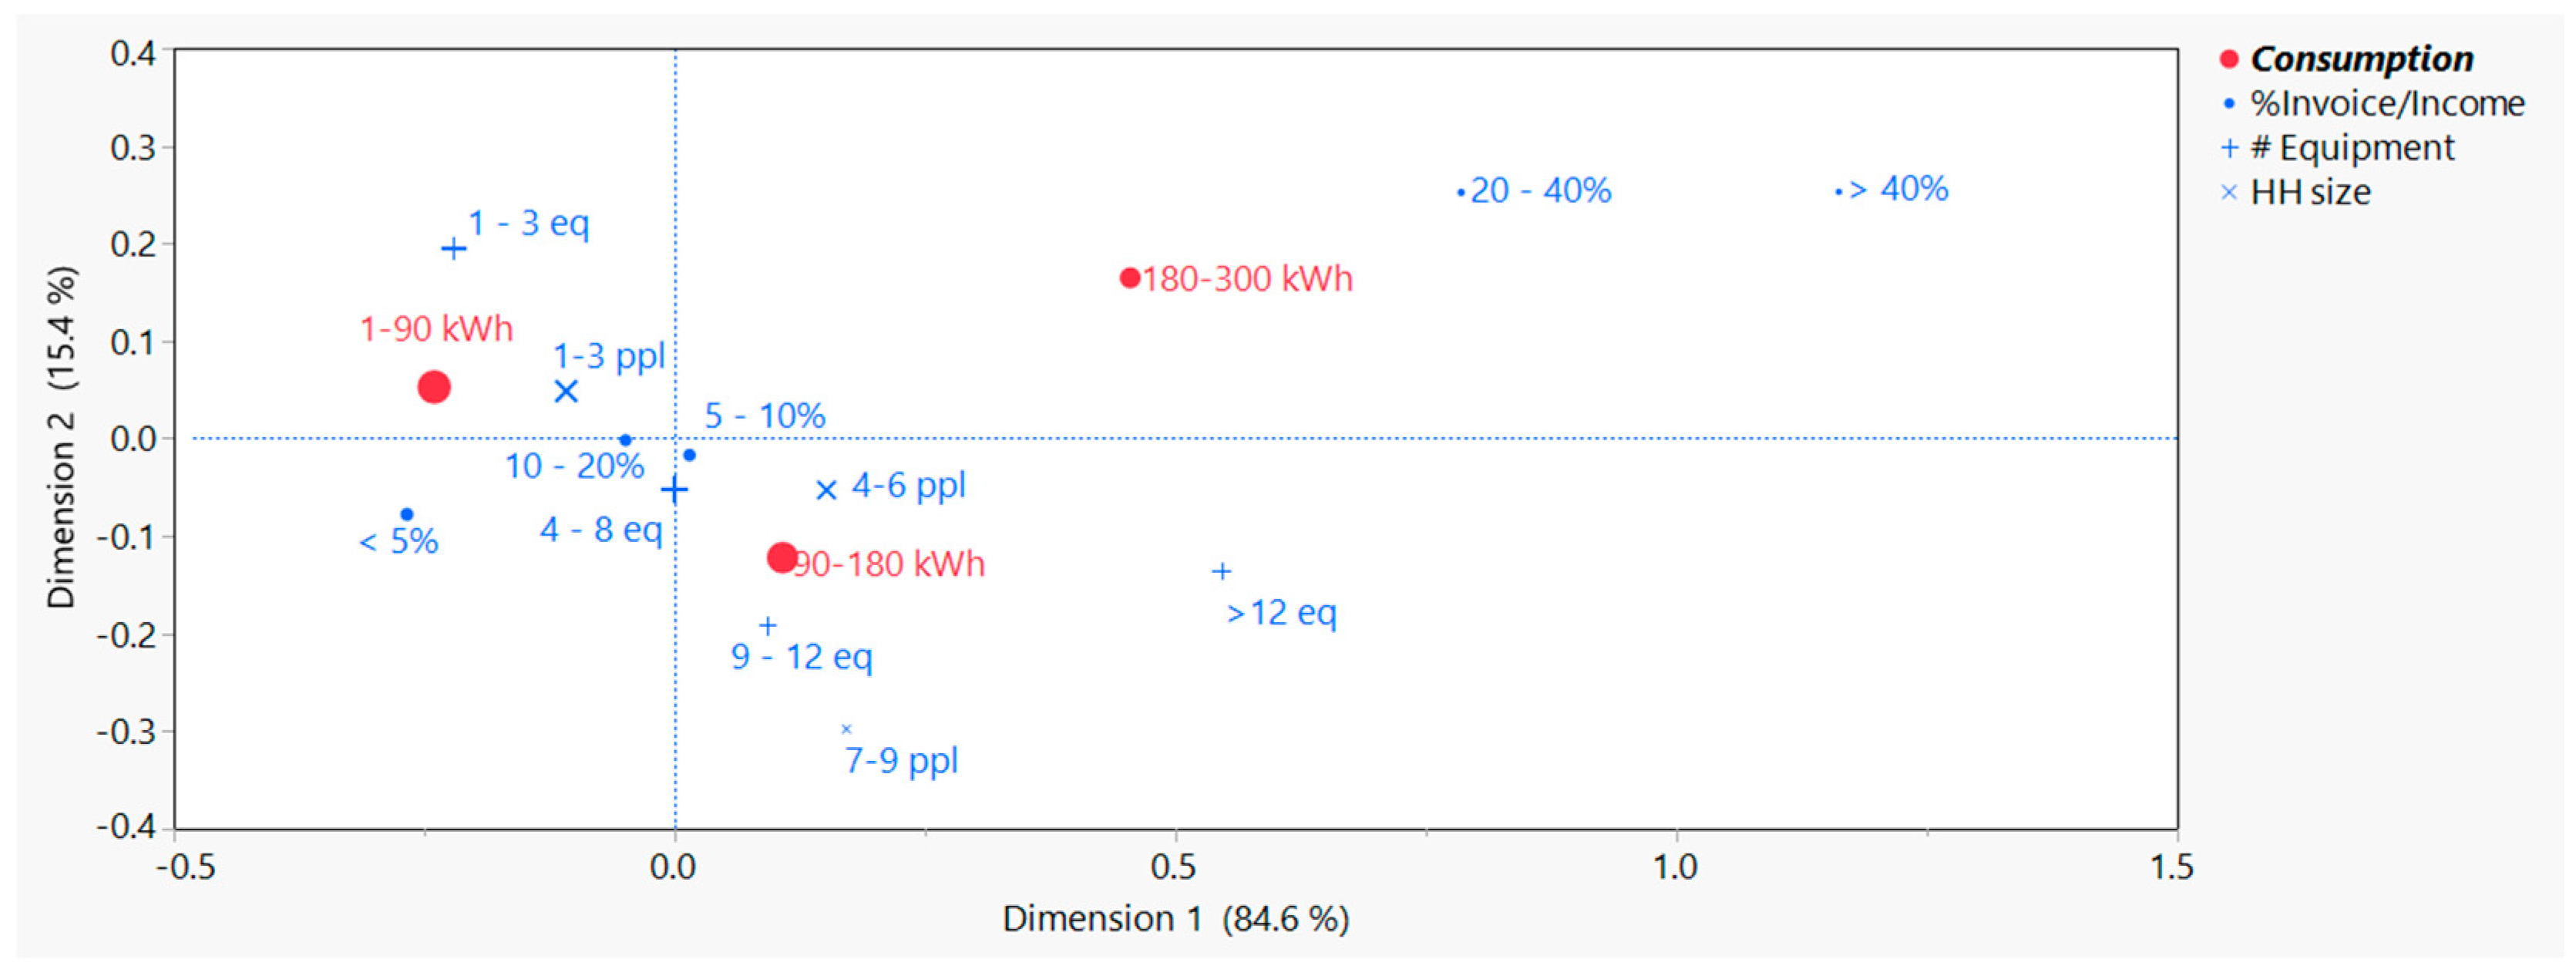
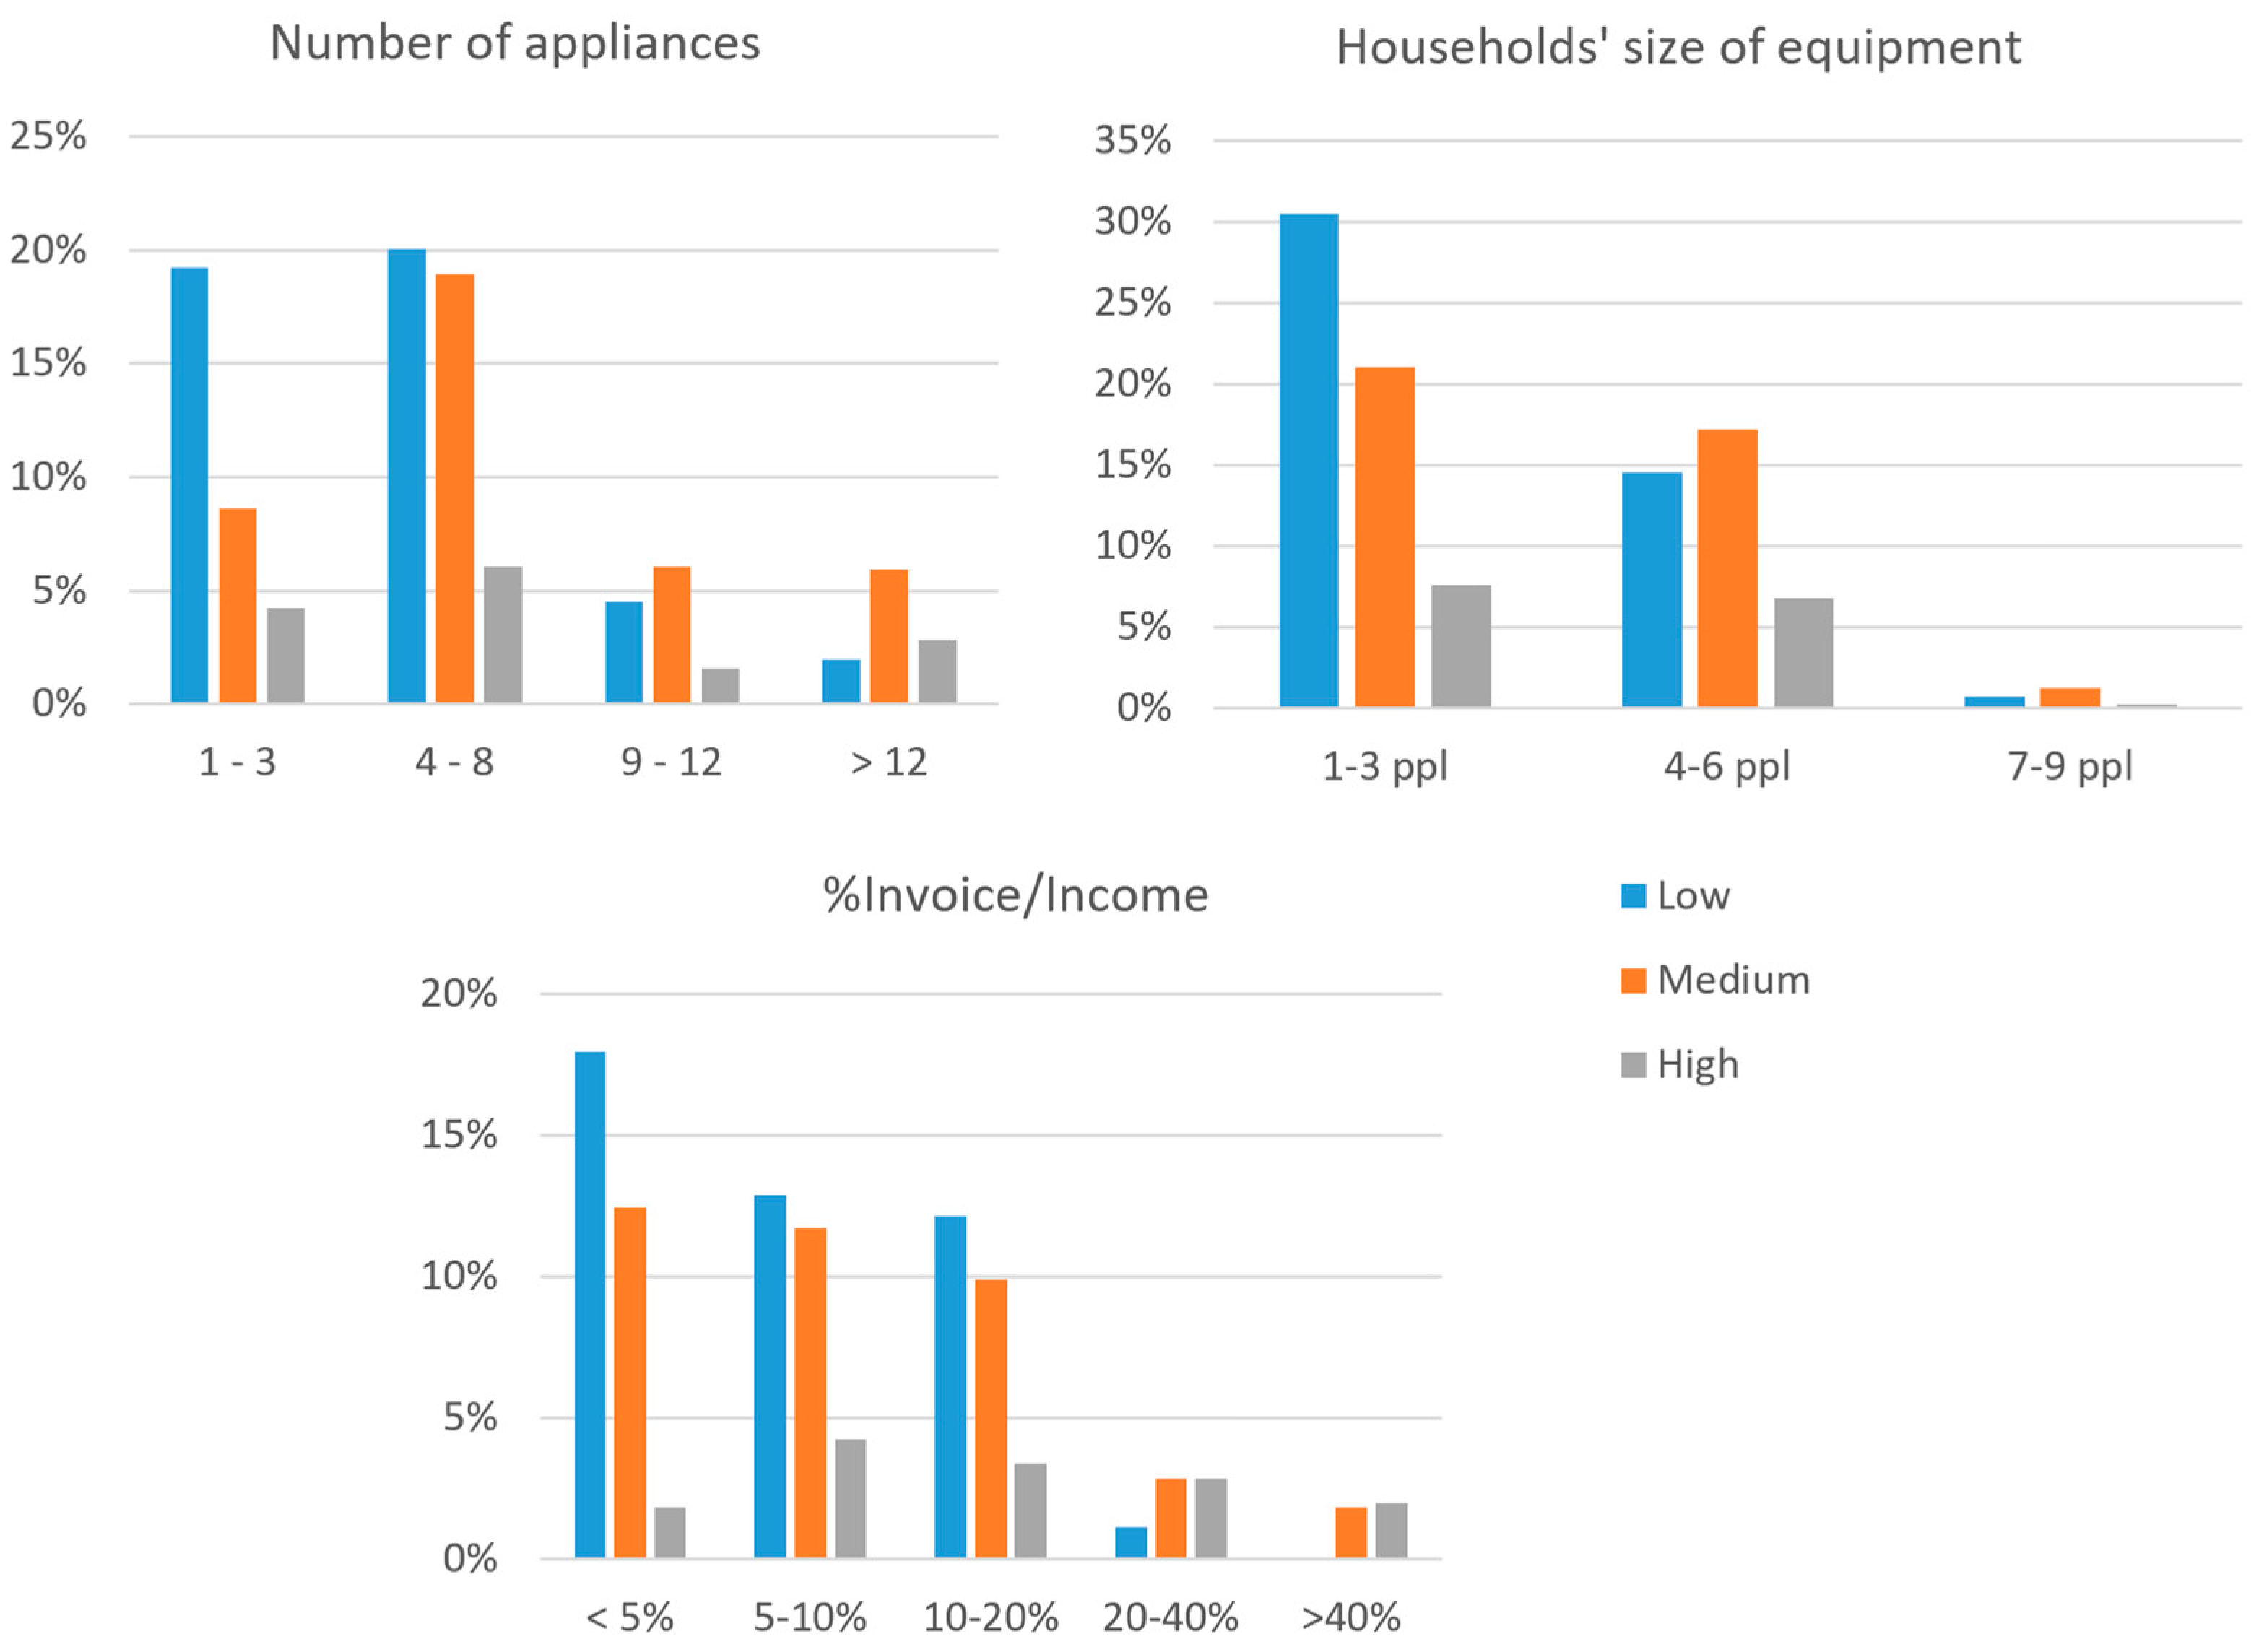
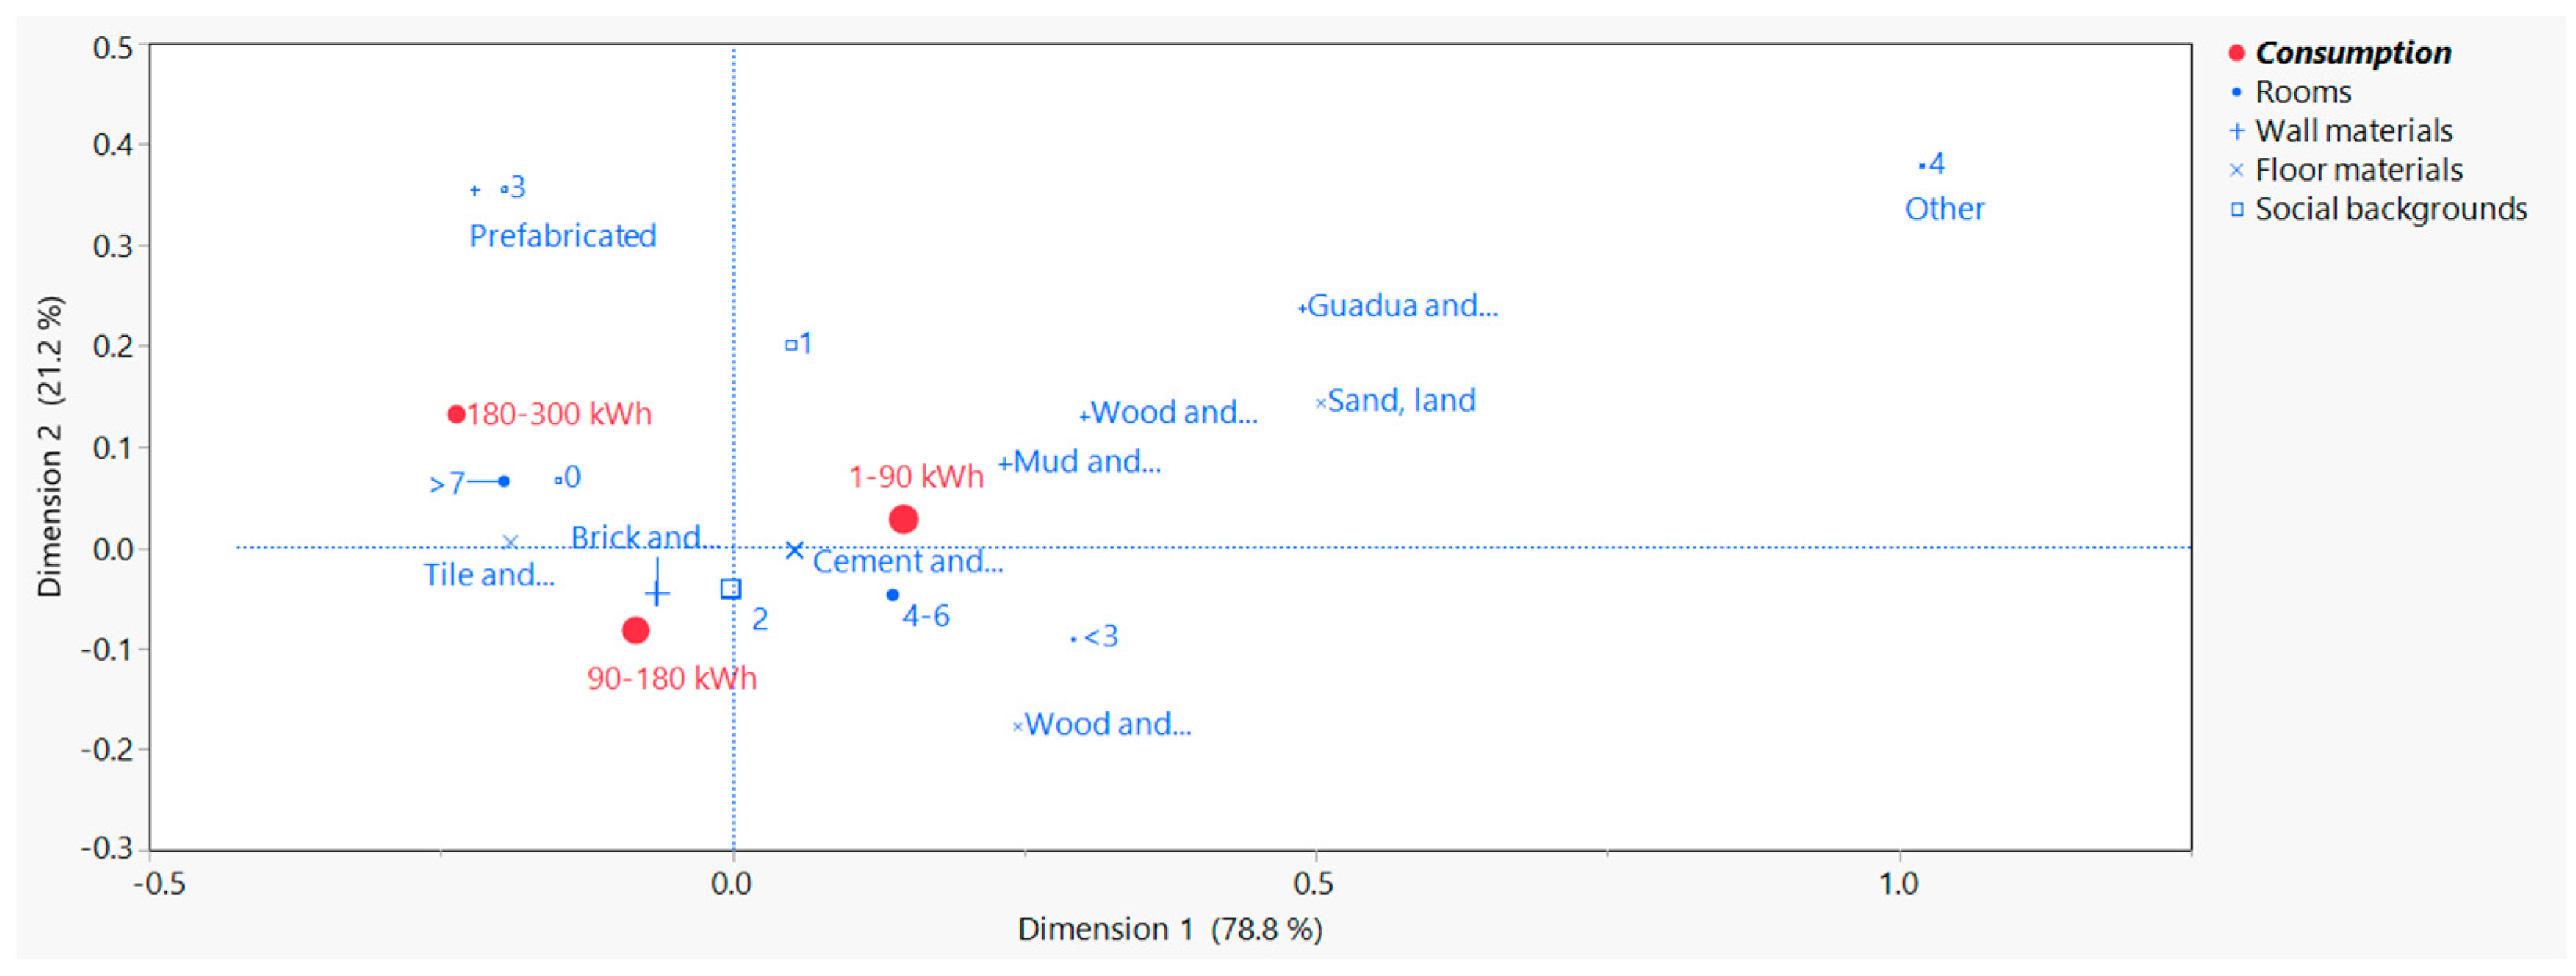
| Characteristic | Low Consumption | Medium Consumption | High Consumption |
|---|---|---|---|
| Income | Lower income | Medium income | High income |
| % Invoice/income | Low ratios (<5%) | Medium ratios (5–10%, 10–20%) | High ratios (20–40%, >40%) |
| Household size | 1–3 people | 4–6 people and 7–9 people | |
| Rooms | <3 rooms, 4–6 rooms | >7 rooms | |
| # Appliances | 1–3 | 4–8 9–12 | >12 |
| Main appliances | Small appliances or no appliances They have TV | Fridge, blender, iron, washing machine, stereo or radio, TV | Fridge, blender, iron, washing machine, stereo or radio, TV, PC, air conditioning or fans (places less than 500 m above sea level) |
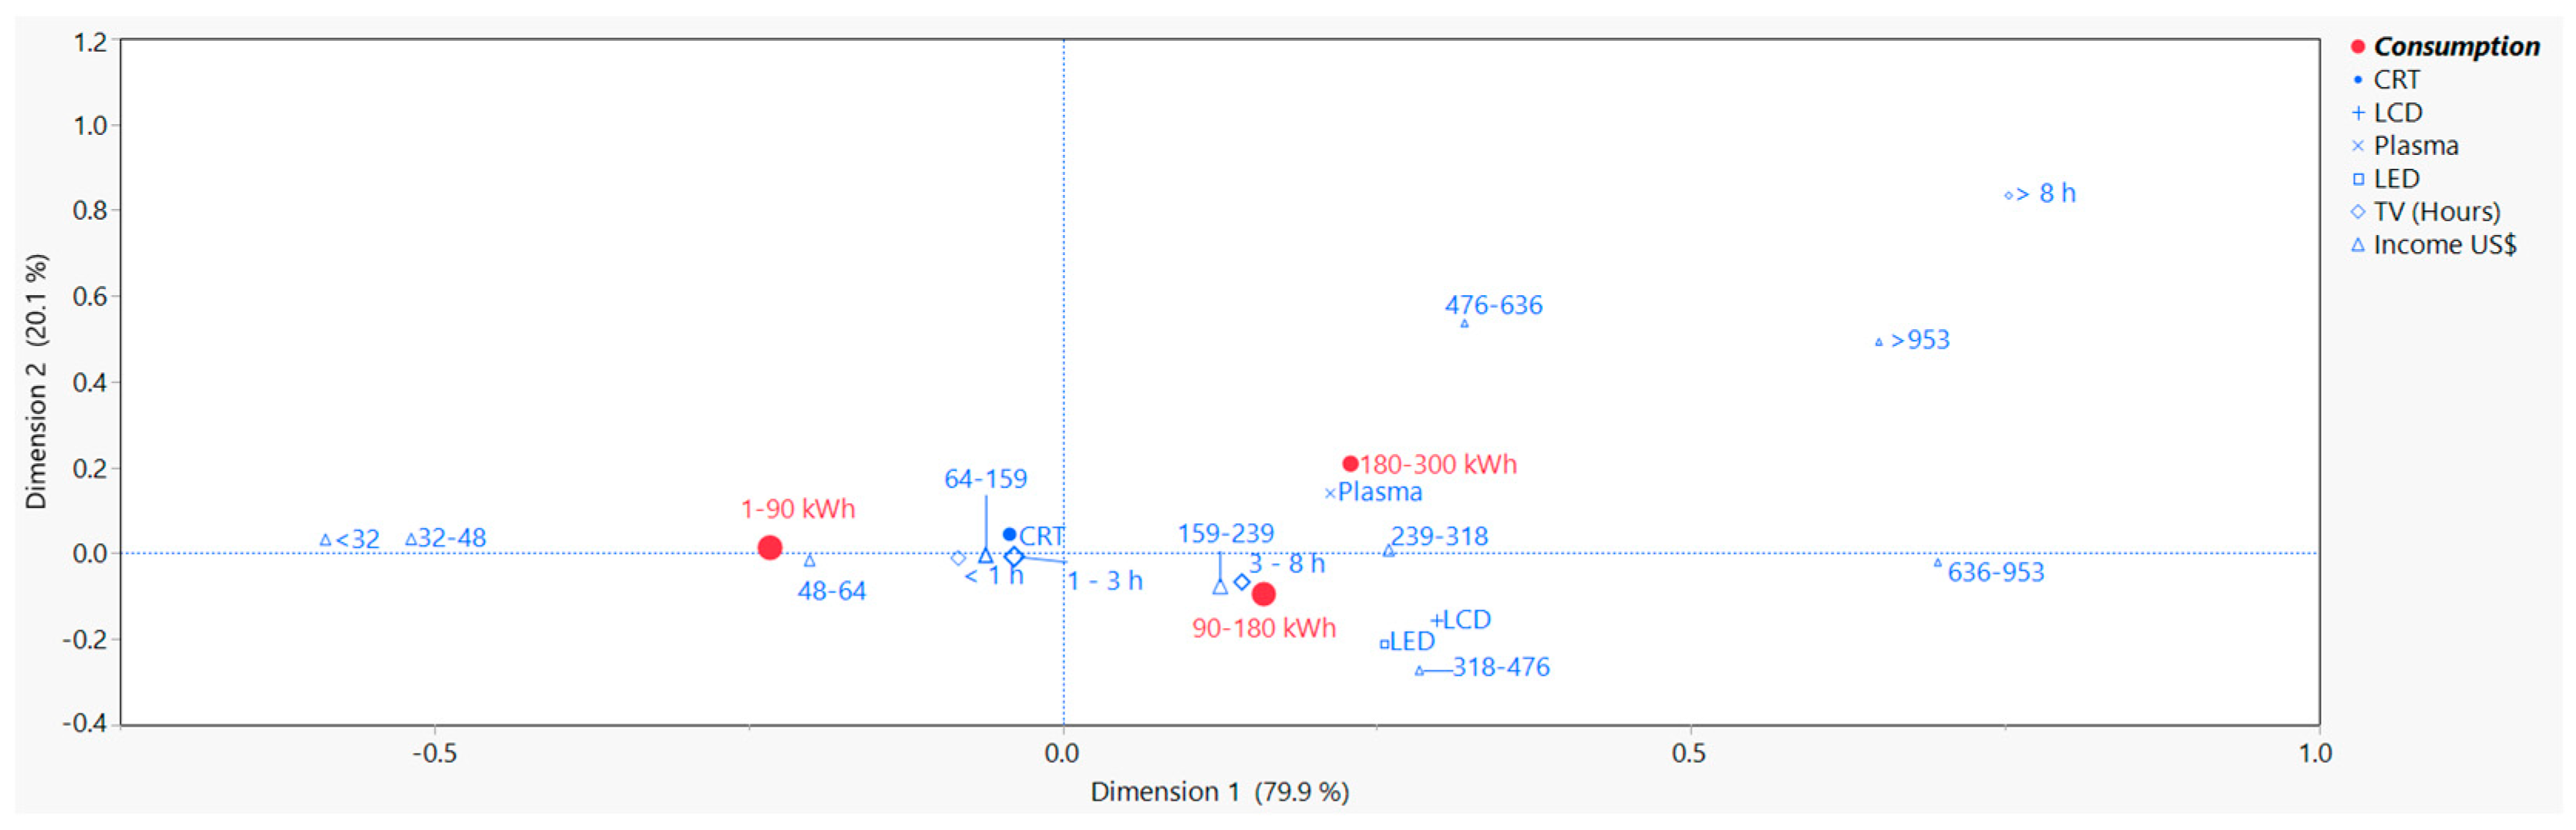
| TV technology | CRT | CRT, LED, and LCD | CRT, LED, LCD, and plasma More TV sets than people |
| Hours TV (per day) | <3 h | 3–8 h | >8 h |
| Light bulbs | Incandescent Less than one bulb per room | CFL At least one bulb per room | CFL At least one bulb per room |
| Predominant walls | Bamboo, rush mat, other vegetables, mud, adobe, clay, rough wood plank | Brick, block, stone, polished wood, and precast materials | Brick, block, stone, polished wood, and precast materials |
| Predominant floors | Sand, land, cement, gravel, rough wood, board, plank | Tile, brick | Tile, brick |
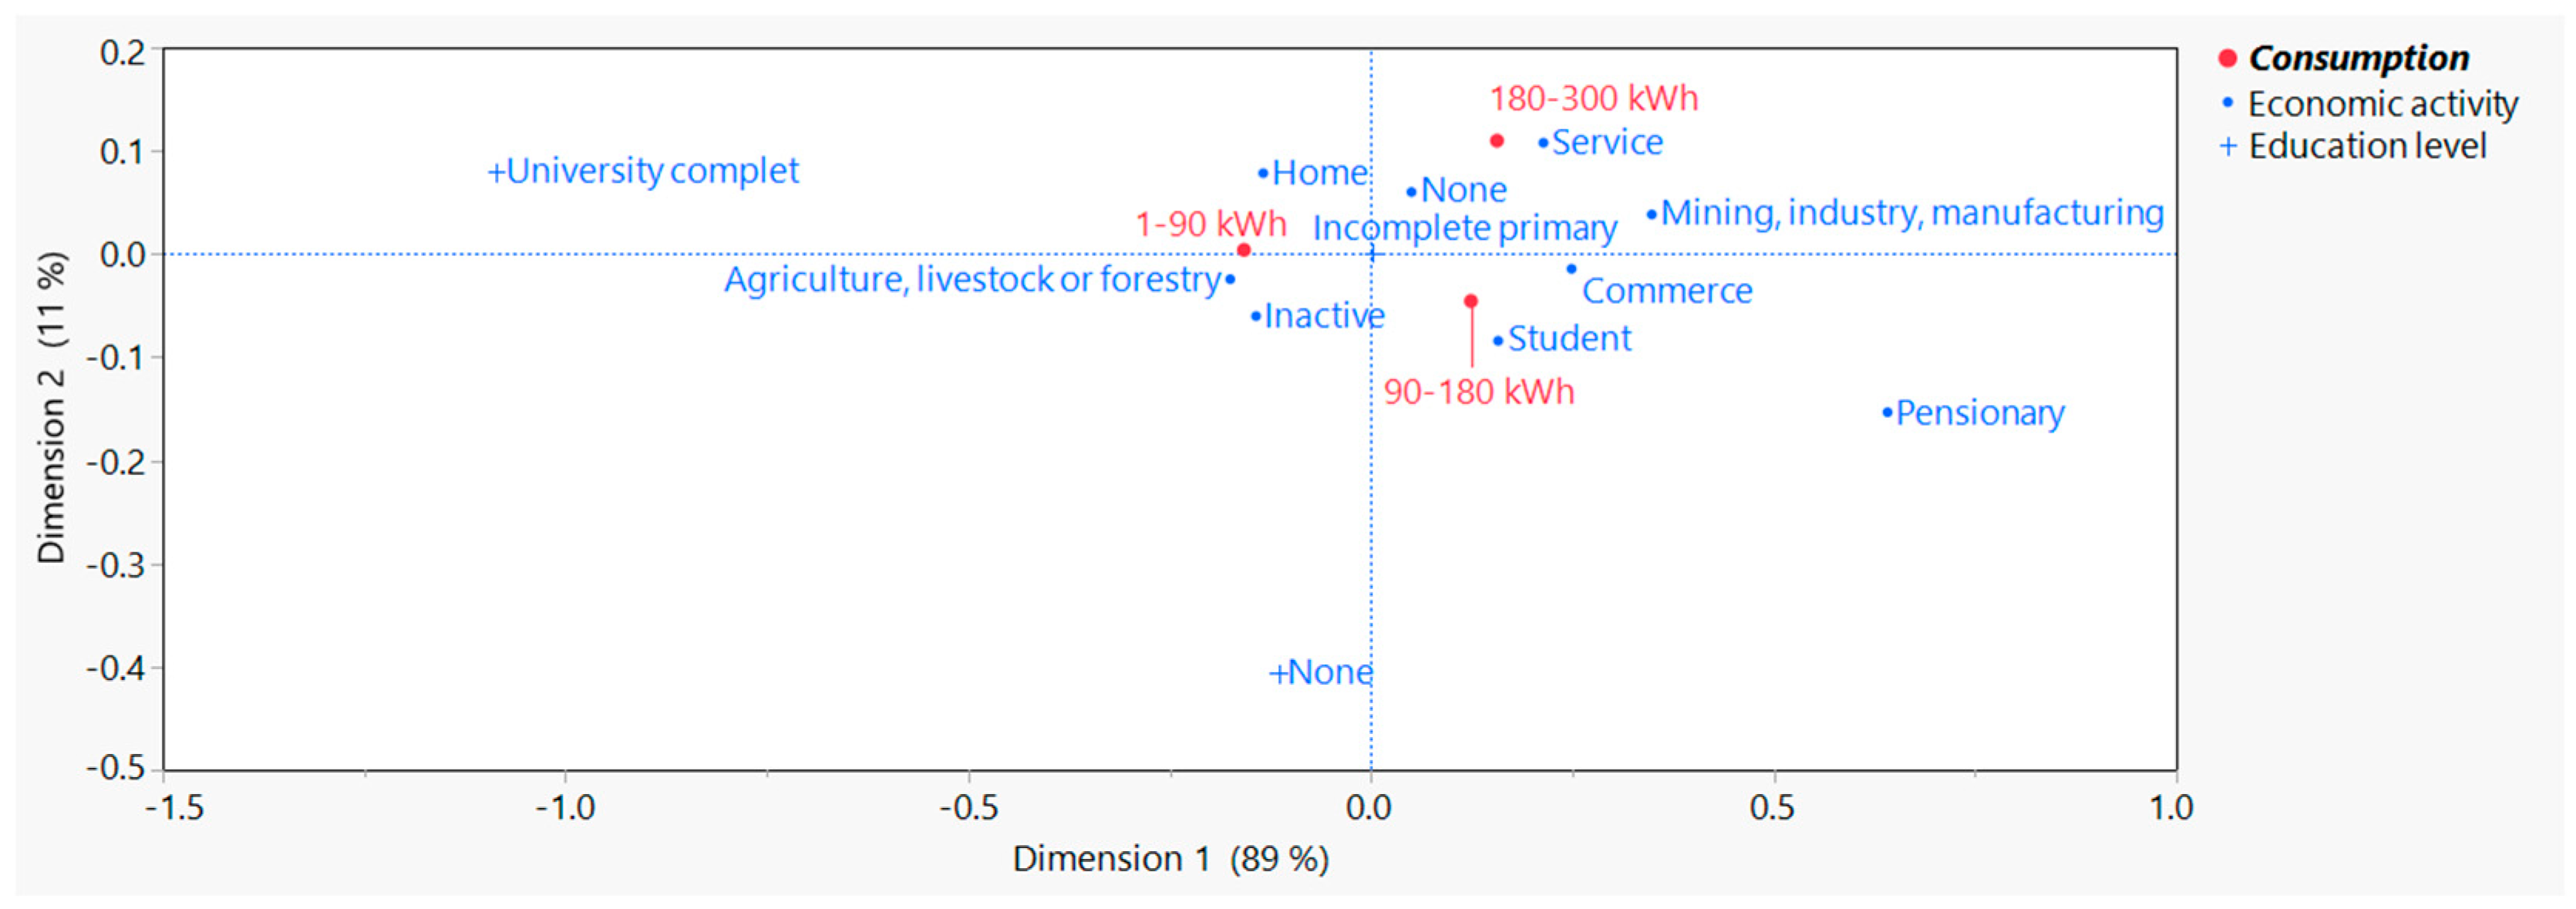
| Economic activity | Household, farming, livestock, or forestry | Students, businesspeople, and pensioners | Services, mining, industry, manufacturing |
Disclaimer/Publisher’s Note: The statements, opinions and data contained in all publications are solely those of the individual author(s) and contributor(s) and not of MDPI and/or the editor(s). MDPI and/or the editor(s) disclaim responsibility for any injury to people or property resulting from any ideas, methods, instructions or products referred to in the content. |
© 2024 by the authors. Licensee MDPI, Basel, Switzerland. This article is an open access article distributed under the terms and conditions of the Creative Commons Attribution (CC BY) license (https://creativecommons.org/licenses/by/4.0/).
Share and Cite
Garcia-Miranda, D.S.; Santamaria, F.; Trujillo, C.L.; Rojas-Cubides, H.E.; Riaño, W.A. Factors Influencing Electricity Consumption in Rural Households. Energies 2024, 17, 1392. https://doi.org/10.3390/en17061392
Garcia-Miranda DS, Santamaria F, Trujillo CL, Rojas-Cubides HE, Riaño WA. Factors Influencing Electricity Consumption in Rural Households. Energies. 2024; 17(6):1392. https://doi.org/10.3390/en17061392
Chicago/Turabian StyleGarcia-Miranda, Diana Stella, Francisco Santamaria, Cesar Leonardo Trujillo, Herbert Enrique Rojas-Cubides, and William Alfonso Riaño. 2024. "Factors Influencing Electricity Consumption in Rural Households" Energies 17, no. 6: 1392. https://doi.org/10.3390/en17061392
APA StyleGarcia-Miranda, D. S., Santamaria, F., Trujillo, C. L., Rojas-Cubides, H. E., & Riaño, W. A. (2024). Factors Influencing Electricity Consumption in Rural Households. Energies, 17(6), 1392. https://doi.org/10.3390/en17061392