Article

Cyclic Appearance and Disappearance of Aerosol Nucleation in the Boundary Layer of Drops of Volatile Liquid

1
Department of Engineering and Economics, South Westphalia University of Applied Sciences, Lindenstr. 53, 59872 Meschede, Germany
2
Department of Mechanical Engineering, University of Canterbury, Christchurch 8041, New Zealand
*
Author to whom correspondence should be addressed.
Energies 2023, 16(22), 7491; https://doi.org/10.3390/en16227491
Submission received: 20 September 2023 / Revised: 25 October 2023 / Accepted: 2 November 2023 / Published: 8 November 2023
(This article belongs to the Special Issue Research on Fluid Mechanics and Heat Transfer)

Abstract

:
The cyclic appearance and disappearance of nucleation was observed in the boundary layer of drops of 1,3-propanediol, 1,2-propanediol, and glycerol, close to the boiling point and exposed to a cooler airflow. Although continuous nucleation has previously been widely observed, the cyclic nature of the phenomenon observed here is unusual. It was observed in experiments with free-falling drops and fixed drops in an upflow of air. To investigate this unexpected phenomenon further, the phenomenon was reproduced in two finite volume models. The first model used 1D potential flow solutions to approximate the airflow around the spherical windward face of the droplet. The second model used CFD to model the airflow. Both models used classical nucleation theory, the Stefan–Fuchs model of droplet growth by condensation, mass transfer by evaporation, diffusion, convection, and heat transfer by diffusion and convection. Despite several simplifications, the most important being the assumption that the drop has a uniform temperature, both models predict the frequency of nucleation to be better than the order of magnitude. These models also predict the experimentally observed power law dependence of nucleation frequency on air speed. It is proposed that the cyclic nature of the phenomenon is caused by the following process: the depletion of condensable vapour around the freshly nucleated aerosol due to condensation onto the aerosol results in reduced supersaturation, which stops further nucleation, and then the replenishment of this vapour by diffusion and convection from the parent drop, with nucleation of aerosol recommencing when the supersaturation has recovered sufficiently—then, the repetition of these steps in a cycle. It is proposed that the process depends mostly on the maximum saturation ratio in the boundary layer, which itself is determined by four key dimensionless numbers: the Lewis number, the Peclet number, the Reynolds number, and the ratio of the vapour pressure of the condensable compound at drop surface temperature to the vapour pressure of the same species at ambient temperature. A practical application of the phenomenon may be as a means of validation of thermo-fluid models, which include nucleation.

1. Introduction

Nucleation is the formation of droplets from a supersaturated vapour [1]. Nucleation is important in the formation of clouds, mist, and fog [2], as well as in the formation of droplets in e-cigarettes [3]. Nucleation may be heterogeneous (initiated by condensation onto pre-existing particles such as dust) or homogenous (by spontaneous condensation from vapour). Nucleation is usually a continuous process, i.e., it begins and continues at varying rates but is unbroken until the concentration of the condensable phase in the vapour is depleted and nucleation ceases. For example, Rebelo et al. [4] show aerosol forming in the wake of a falling drop of liquid nitrogen (in their Figure 4a). The aerosol is formed from the nitrogen evaporated from the main drop. In this paper, we use the term ‘drop’ or ‘parent drop’ to mean an initial body of liquid of a few millimetres in diameter, which evaporates to create a supersaturated vapour field, and ‘aerosol’ to mean the collection of smaller droplets of a few microns in diameter formed from this supersaturated vapour. In [4] the formation of aerosol is continuous. However, Scheunemann et al. [5] discovered that under certain conditions, nucleation can have a self-sustained cyclic oscillation, starting and stopping cyclically at a distinct frequency. This phenomenon was observed in the boundary layer of free-falling parent drops of volatile liquids (1,3-propanediol, 1-2-propanediol, and glycerol) a few millimetres in diameter. The liquid in the parent drop evaporated to form a supersaturated vapour in the boundary layer. Nucleation commenced in this vapour-rich boundary layer, creating smaller droplets (aerosol). This nucleation commenced, ceased, and then commenced again, leaving a striped pattern with bands of aerosol separated by clear vapour (Figure 1 and Figure 2). The nucleation/cessation cycle occurred at a stable frequency, which rose as the speed of the droplet increased. Cyclic nucleation was also observed in a jet of 1,3 propanediol vapour in a cross flow of cooler air [5] and by the same authors in new experiments with drops of 1,3-propanediol suspended on a heated copper finger in an upwards flow provided by a wind tunnel [6]. The latter paper reports measurements of nucleation frequency, which was shown to increase as the air approaching the parent drop increased in speed and to increase with rising drop temperature. The cyclic phenomenon was observed with 1,3-propanediol, 1,2 propanediol, and glycerol. The liquid had to be near but not exceeding its boiling point. Flow in the boundary layer had to be laminar. If turbulent, nucleation still occurred but was not cyclic.
In this paper, we describe experimental measurements of the nucleation frequency and two numerical models which successfully reproduced the cyclic nucleation phenomenon. A hypothesis which explains the phenomenon and the conditions required to cause it is proposed. An analogy is drawn with Liesegang patterns [7], which are formed by liquid-phase chemical reactions which result in precipitation, and for which explanations based on supersaturation have been offered [8,9,10,11].

2. Experimental Observations

In this paper, we refer to the parent drop as the initial drop of a few millimetres, which releases the vapour, and the aerosol consisting of droplets of a few microns in diameter, which form from this vapour.

2.1. Free-Falling Parent Drop

Parent drops of a few millimetres in diameter 10–20 K below the boiling point were allowed to form by feeding the volatile liquid slowly through vertical copper nozzles of 2, 4, and 5 mm diameter with plane lower-end faces. Once large enough, the drop fell through quiescent air. At the speeds observed here, there is no turbulence in the boundary layer. The volatile liquids used were 1,3-propanediol (purity 98% w/w), 1,2-propanediol (99.7% w/w), and glycerol (99.5% w/w). All results in this paper are for pure liquids (i.e., single components), except Figure 1, which is a mixture. Good repeatability was observed with pure 1,3-propanediol and with pure 1,2-propanediol, although cyclic nucleation formed over a narrower range of conditions for the latter. Poor repeatability was observed for pure glycerol. This may be due to thermal decomposition close to the normal boiling point. Drop sizes were determined from photos. The 5 mm diameter nozzle usually produced diameters of 3.7 ± 0.1 mm with 1,3-propanediol; 1,2-propanediol and glycerol produced slightly different drop sizes.
High-speed video was recorded using a PHANTOM v1210 monochrome camera (Vision Research, Wayne, NJ, USA), with a 65 mm macro lens (1–5× magnification). The frequency of cyclic nucleation was measured from the image sequences. The pixel pitch of the sensor is 30 µm, delivering a spatial resolution of between 6 and 30 µm, which was, in most cases, insufficient to resolve single droplets in the aerosol. Videos were acquired with a manual post-trigger. The drops were either laterally lit or backlit. Exposure time was typically 0.5 µs. Fall velocity was measured from successive images.
Additional single-frame images were taken using a Sony α7R-II camera (42.4 megapixels, 4.5 µm pixel pitch) with a Laowa 25 mm 2.5–5× macro lens triggered by a light barrier. Images were backlit with an LED flash (Cree CXB3590, 6500 K white) with a purpose-built driver delivering durations between 0.25 and 2 µs to avoid motion blur.
The highest contrast images were obtained with direct backlighting (shadowgraphy) at f/2.8 and magnification between 2.5 and 4×. The depth of field was 28 to 16 mm, respectively (based on a spatial resolution of twice the pixel pitch). Experiments with out-of-focus test structures suggest that droplets of a few microns in diameter are imperceptible outside a depth of field of 50 to 100 µm in extent. This shallow depth of field effectively delivers a cross-sectional image of the aerosol, and in many situations, single droplets could be distinguished. The sensor’s pixel pitch translates to a theoretical object space resolution of 1.8 µm to 1.1 µm, not allowing droplet diameters to be accurately measured but allowing larger and smaller droplets to be distinguished.
As the parent drop fell, aerosol was nucleated and grew in the boundary layer. Two classes of aerosol patterns were observed:
1. Cyclic nucleation on the downward-facing side of the drop, resulting in striped patterns of nucleated aerosol (Figure 1 and Figure 2). Nucleation starts in a thin layer at a certain distance away from the drop’s downward-facing surface, around the stagnation point, quickly expanding to the sides, creating a thin aerosol layer in the shape of a spherical cap. This cap moves closer to the drop surface and stretches laterally, following the flow in the vicinity of the stagnation point. Another layer of nucleation begins around the stagnation point. The process repeats cyclically, with multiple parallel layers of aerosol being formed on the downward-facing side of the drop (Figure 2).
2. Non-cyclic nucleation on the downward-facing side of the drop, closer to the drop’s surface and potentially extending along the lateral flow, resulting in a single aerosol layer encapsulating the drop, with neither parallel layers nor cyclicity (Figure 3).
Both cyclic and non-cyclic nucleation could be observed with nominally the same conditions. Cyclic nucleation is observed over a narrower range of conditions (drop size, drop composition, drop temperature, and air speed) than non-cyclic nucleation. Sometimes, both cyclic and non-cyclic nucleation were observed in a series of experiments with nominally the same conditions. We infer that there are circumstances which can disrupt the cyclic nucleation. Instability in the boundary layer flow appears to be one such circumstance.
The parent drops oscillated in shape from oblate to prolate and back to oblate. The frequency of these shape oscillations was 37–45 Hz, an order of magnitude lower than the frequency of nucleation cyclicity, which always exceeded 250 Hz.
In the wake of the parent drop, the aerosol droplets can grow significantly larger than in the other parts of the boundary layer (>20 µm diameter), while droplets in the lateral and frontal boundary layers were a few microns in diameter. This is too small to be measured accurately. However, each droplet was separately visible.
The parent drop cools as it falls. Drop temperature was not measured during the fall, and the temperature assumed for modelling was that of the nozzle. Thermal imaging of hot drops suspended from the nozzle before they fell indicated that sometimes, large temperature gradients develop within the drop with a much colder lower tip. This might be linked to internal flow in the drop. Differences in temperature distribution, and hence evaporation rate, may explain the occurrence of cyclic and non-cyclic nucleation with nominally the same initial drop conditions.

2.2. Suspended Drop

The free-falling drop suffers from some complications: (1) cooling of the liquid, (2) shape oscillations, and (3) droplet–air relative speed increasing with time. To simplify conditions, a suspended drop method was developed. A heated copper nozzle was exposed to upwards airflow from a small vertical open wind tunnel with a 32 mm × 32 mm square outlet (Figure 4) with the air at 20 °C. The copper nozzle had a copper finger protruding into the drop, which reduced the non-uniformity of the liquid temperature (Figure 5). The shape of the finger matched the contours of the droplet, leaving a liquid layer 0.2 to 0.6 mm thick. The nozzle base diameter was 4.1 mm. The windward tip of the suspended drop had a radius of 1.53 mm. The core of the nozzle was maintained within ±0.5 °C of the target temperature. Air speed was measured using a hot wire anemometer (Kimo VT-100, Kimo Electronics, Mumbai, India, measurement position same as nozzle). Using the base diameter as the length scale with air speeds of up to 1.85 m/s gives Reynolds numbers up to 505.
Using this apparatus, aerosol generation patterns similar to the free-falling drop were seen. Both cyclic and non-cyclic nucleation were seen (Figure 5 and Figure 6 show a cyclic example). Droplets in aerosol layers closer to the wetted surface were visibly larger than those in layers farther away (Figure 6). The Electronic Supplementary Material is a video of a suspended hot drop of 1,3-propanediol with 4.1 mm base diameter, 190 °C core temperature, and approaching airflow at 0.34 m/s, recorded at 10,000 fps and 99 ms exposure time, with default video playback speed 30 fps.
Of the liquids tested, cyclic nucleation was most stable for 1,3-propanediol. Where stable, the frequency of the cyclic appearance and cessation cycle, f N , was measured via analysis of the high-speed video sequences for 1,3-propanediol with nozzle temperatures of 180 and 190 °C. f N was weakly dependent on nozzle temperature and strongly dependent on the drop–air relative speed u (Figure 7). A power law of f N = A u B fitted well with A = 619 and B = 1.002 for 180 °C (R2 = 0.999) and A = 684 and B = 1.08 for 190 °C (R2 = 0.987) (the fit uses f N in Hz and u in m/s).

3. Modelling

Two models, one simple 1D and one more complicated 2D axis-symmetric CFD model, were constructed in an attempt to reproduce the phenomenon. The models mimic suspended drops; in that, there is neither shape oscillation nor temporal increase in air speed.

3.1. Theory Common to Both Models

Liquid evaporates from the parent drop, and vapour is transported by diffusion and convection. Where this vapour reaches sufficiently high supersaturation, critical nuclei form. Critical nuclei are assemblages of molecules of the condensing compound, which are just large enough that the vapour pressure adjacent to their surface is smaller than that in the surrounding vapour. It is thus thermodynamically favourable for these nuclei to grow via condensation. As the concentration of dust and other heterogeneous nucleation sites are sufficiently low in the experiments, only homogenous nucleation is considered. Classical nucleation theory (CNT) [12] is used to determine nucleation rate and critical nucleus size. CNT has known flaws [13], including predicting non-zero formation energy for a single vapour molecule, which is theoretically impossible [12]. CNT is also known to underpredict the nucleation rate of alcohols [14,15]. However, CNT is simple, widely used, and, as will be seen, produces satisfactory results. The inadequacies of CNT are noted, but the main goal of these models was simply to see if the cyclic phenomenon could be reproduced with a limited set of physics.
In CNT, the radius r c of a critical nucleus is given by Equation (1):
r c = 2 σ ρ v L R T ln S
where σ is the surface tension, ρ v L is the liquid density, R is the specific gas constant, T is the local gas-phase temperature, and S is the saturation ratio, given by Equation (2):
S = p v p v s T
where p v is the partial pressure of the volatile compound in the bulk vapour and p v s is the vapour pressure of a saturated mixture of that compound at the local gas temperature.
The nucleation rate J   (number of critical nuclei formed per second per unit volume) is given by Equation (3):
J = 8 π r c 2 p v 2 S k B T M V N A k B T Z exp 4 π r c 2 σ 3 k B T
In this implementation, J includes a factor of 1 / S in accordance with [12]. k B is Boltzmann’s constant, M V is the molar mass of the volatile compound, N A is Avogadro’s constant, and Z is the Zeldovich factor given by Equation (4) [16]:
Z = M v 2 π N A ρ v L r c 2 σ k B T
In the present model, a single pure volatile species (1,3-propanediol) is considered. It is assumed that air is insoluble in the liquid and both air and liquid are free of water. Humidity is present in the experiments and affects the final droplet size due to hygroscopic growth but it is neglected here since the effect is slight, and the models are only concerned with the early stage of growth. It is thus assumed that the vapour phase consists only of 1,3-propanediol and air and is treated as an ideal gas. Instantaneous adiabatic mixing is assumed. Laminar flow is assumed, as the experiments suggest that spatial and temporal aerosol patterns need laminar conditions at the nucleation zone, and that turbulence quickly destroys cyclic nucleation patterns.
The rate of change in the number of droplets in each finite volume cell (of volume Δ V ) is given by Equation (5):
d N D d t = J Δ V
Once the critical nuclei are formed, vapour molecules diffuse to the surface of these nuclei, causing them to grow by condensation into droplets, which continue to grow until the vapour is sufficiently depleted that the vapour density adjacent to the curved droplet surfaces, p v D , equals that in the bulk vapour. p v D over an aerosol droplet of radius r is given using the Kelvin equation (Equation (6)):
p = p s a t exp 2 σ ρ v l R T
This is used to determine the mass fraction of volatile compound in the vapour above the droplet surface, and thus the mass flux due to diffusion.
The rate of change in liquid mass in a cell containing aerosol is given by Equation (7):
d m V L d t = 4 π r c 3 ρ V L T 3 J Δ V + N D m D ˙
where, on the right-hand side, the first term is the rate of mass gain due to nucleation, and the second is the rate of mass gain due to droplet growth.
Mass and heat flux between parent drop and vapour, and nucleated aerosol droplets and vapour, are modelled as quasi-steady, spherically symmetric diffusion between the liquid surface and an infinite, homogeneous far field (far field properties indicated by the subscript ). The aerosol droplets are assumed to be travelling at the same velocity as the vapour immediately surrounding them (no slip). This is reasonable since the droplets are formed from that vapour. Therefore, there is no convective heat or mass transfer.
Mass diffusion is unimolar since the inert compound (air) does not diffuse towards or away from the droplet. The mass flow rate of the volatile compound from far field to the droplet equals the mass gain rate of the droplet m D ˙ is given by Equation (8):
m D ˙ = 4 π D V , A r D ρ ¯ G ln 1 w V , D 1 w V ,
where D V , A is the diffusion coefficient of the volatile compound in air, ρ ¯ G the mean gas phase density, w V , D the mass fraction of volatile compound at the droplet surface, and w V , the mass fraction of the volatile compound in the far field. This constitutes the Stefan–Fuchs droplet growth model [17], in the special case that there is no slip between the droplet and surrounding gas. This special case is identical to the Maxwell model [18].
The droplet is assumed to be of uniform temperature throughout. The droplet surface gas phase is in vapour–liquid equilibrium with the droplet’s liquid. Radiative heat loss is assumed negligible due to the low temperature difference with the surroundings.
The steady-state rate of heat flow Q D ˙ from a single droplet to the far field is given by Equation (9):
Q D ˙ = 4 π λ G r D L V c p V , G ln 1 + c p V , G L V T T D
where λ G is the gas-phase heat conductivity; r D is the droplet radius; L V is the latent heat; c p V , G is the specific heat of the volatile compound in its vapour state at constant pressure; T D is the droplet temperature (assumed uniform); and T is the local gas-phase temperature.
Latent heat released upon condensation was deposited into the liquid and in the vapour in the surrounding cell in proportion to their heat capacities.
When the droplet is at a quasi-steady equilibrium temperature, the rate of release of latent heat is equal to the heat flow (Equation (10)):
m D ˙ L V Q D ˙ = 0
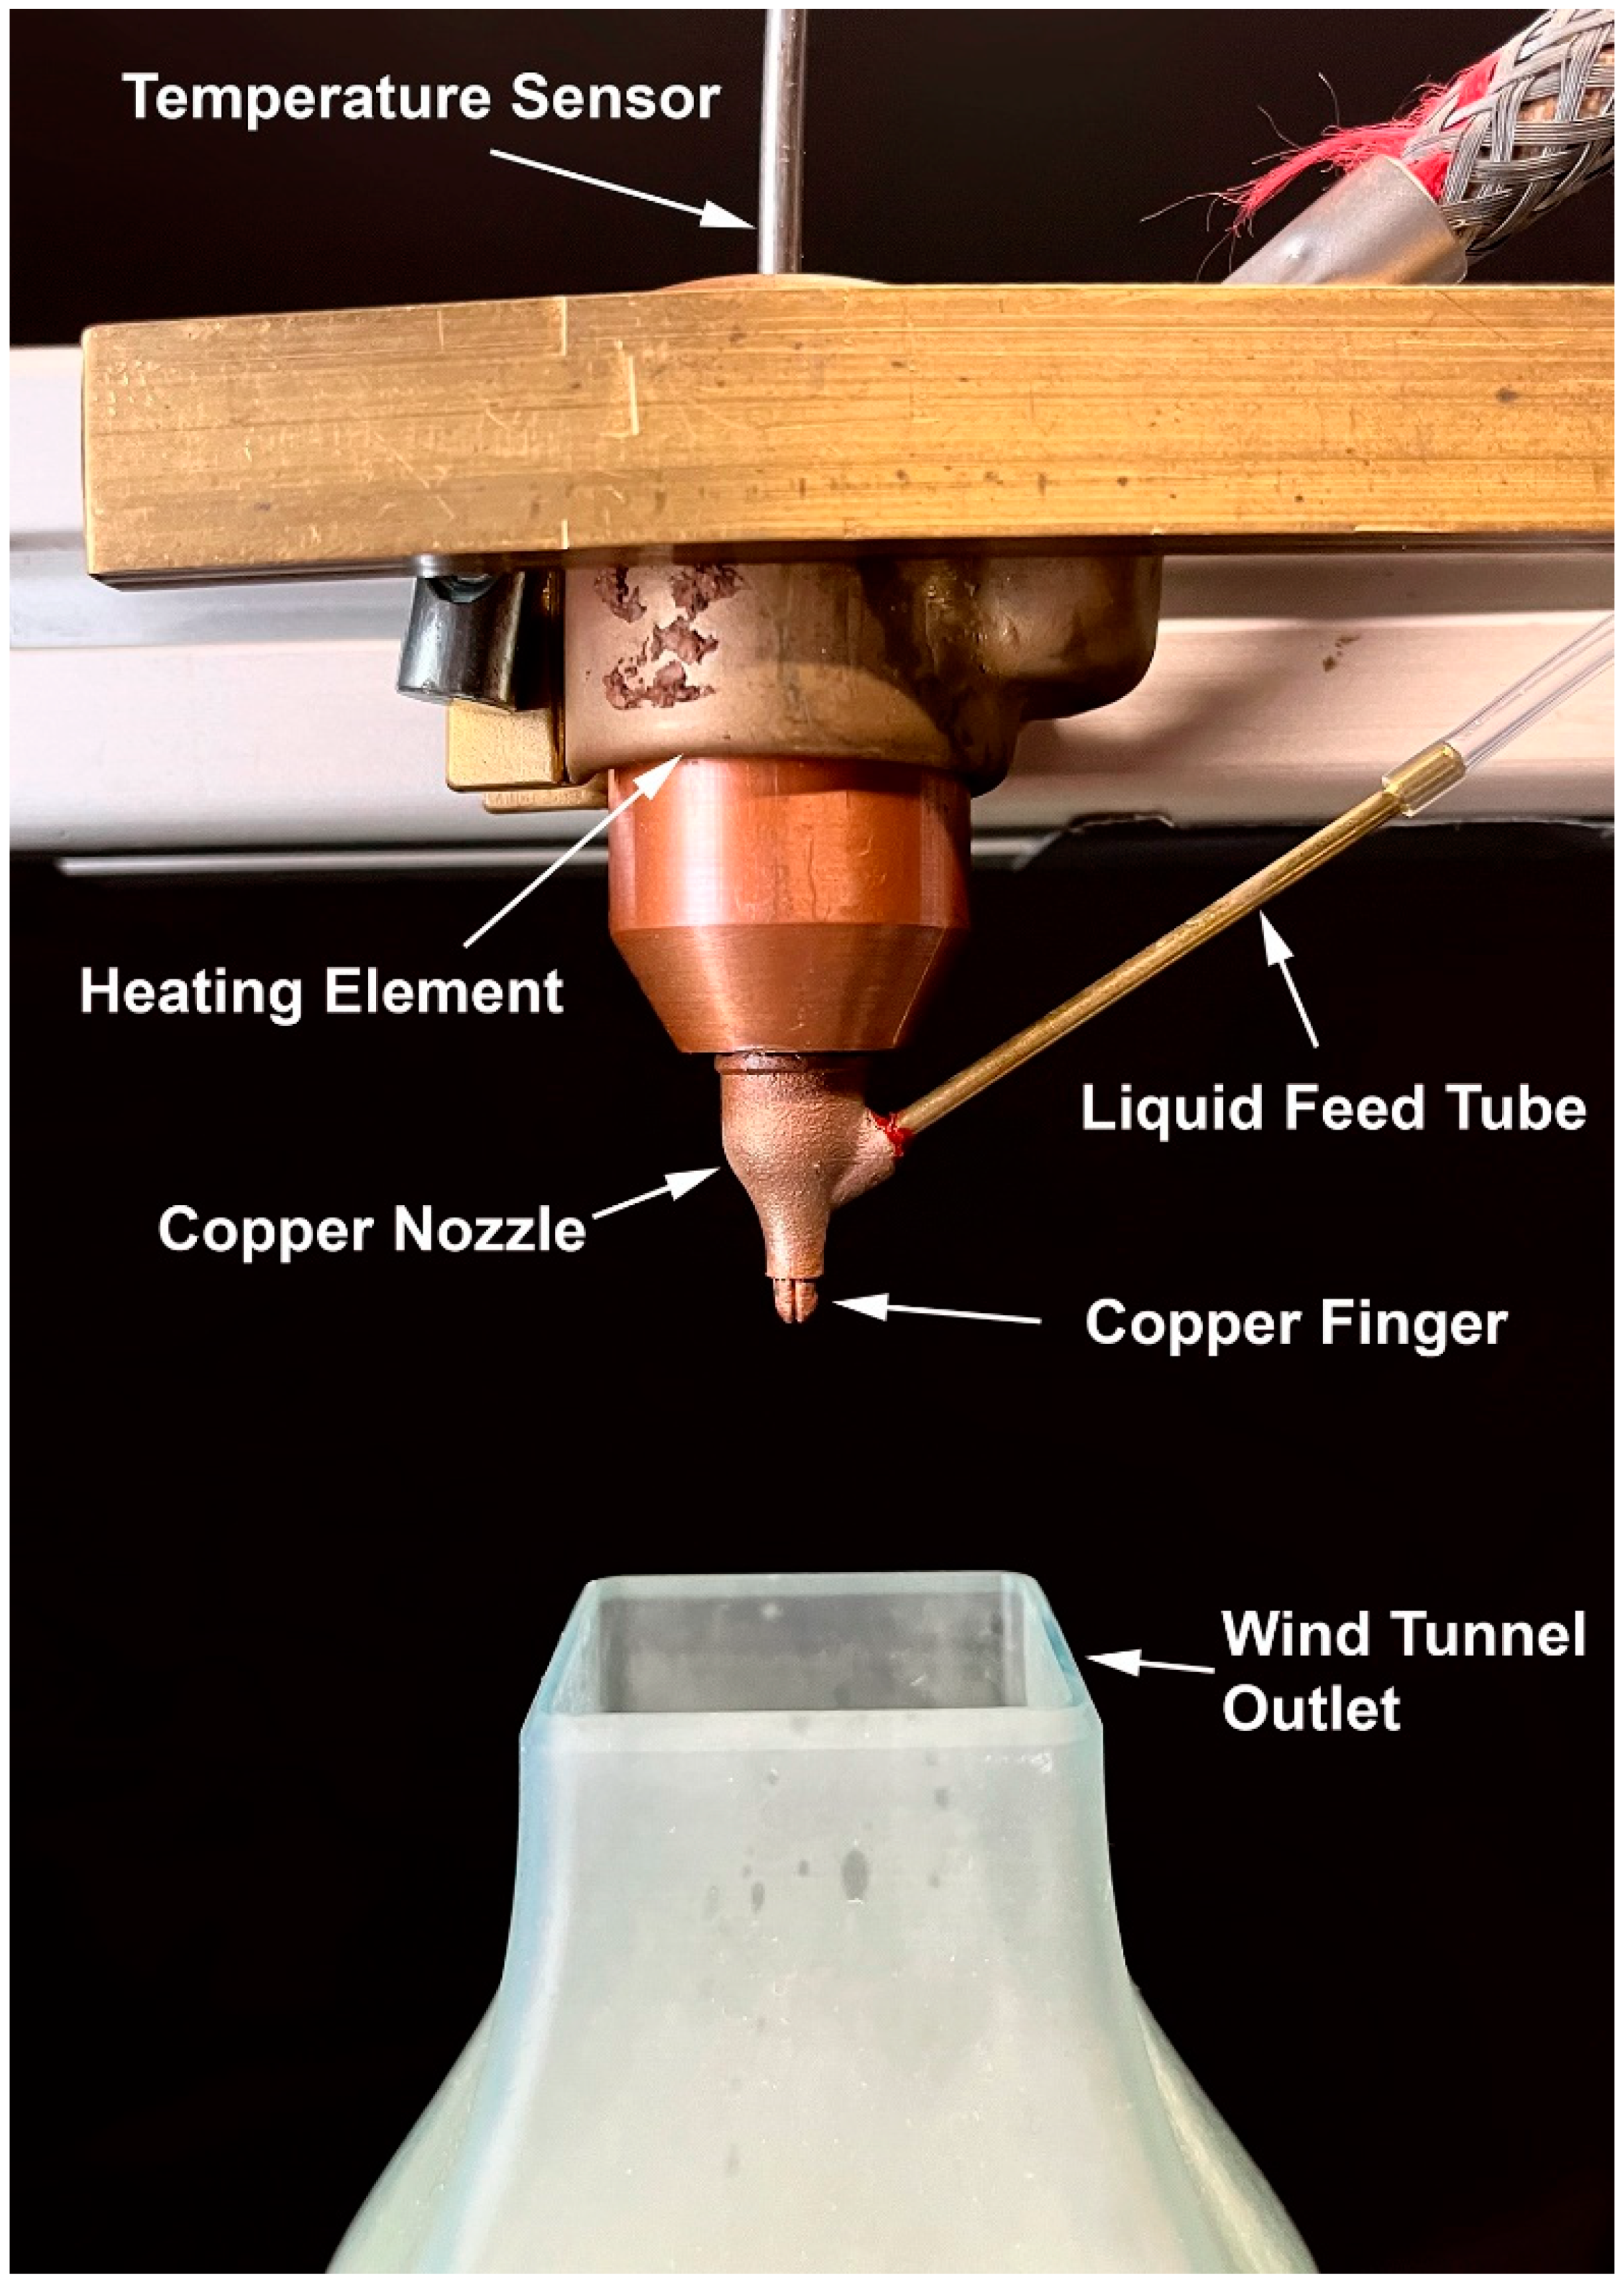
For a suspended parent drop, as the liquid temperature is close to the boiling point, the enthalpy flux at the liquid/vapour interface can be very high, and this can lead to a non-negligible temperature difference between the heated copper core T c o r e and the liquid/vapour interface temperature T s u r f . A simple model of heat transfer via a liquid layer of constant thickness δ L L was introduced, assuming heat transfer by heat conduction and evaporation only, with conduction only perpendicular to the surface. With known mass flux j V of the evaporating volatile compound, and to the gas phase q ˙ G calculated from a previous estimate of the temperature gradient, the temperature difference across the liquid layer is given by Equation (11):
T c o r e T s u r f = L + q G ˙ / j V c p , L 1 exp j V c p , L δ L L λ L  
where λ L is the thermal conductivity of the liquid. This approach was only used in the 1D model as the suspended drop was not modelled with CFD. The model assumes a single value of layer thickness δ L L 
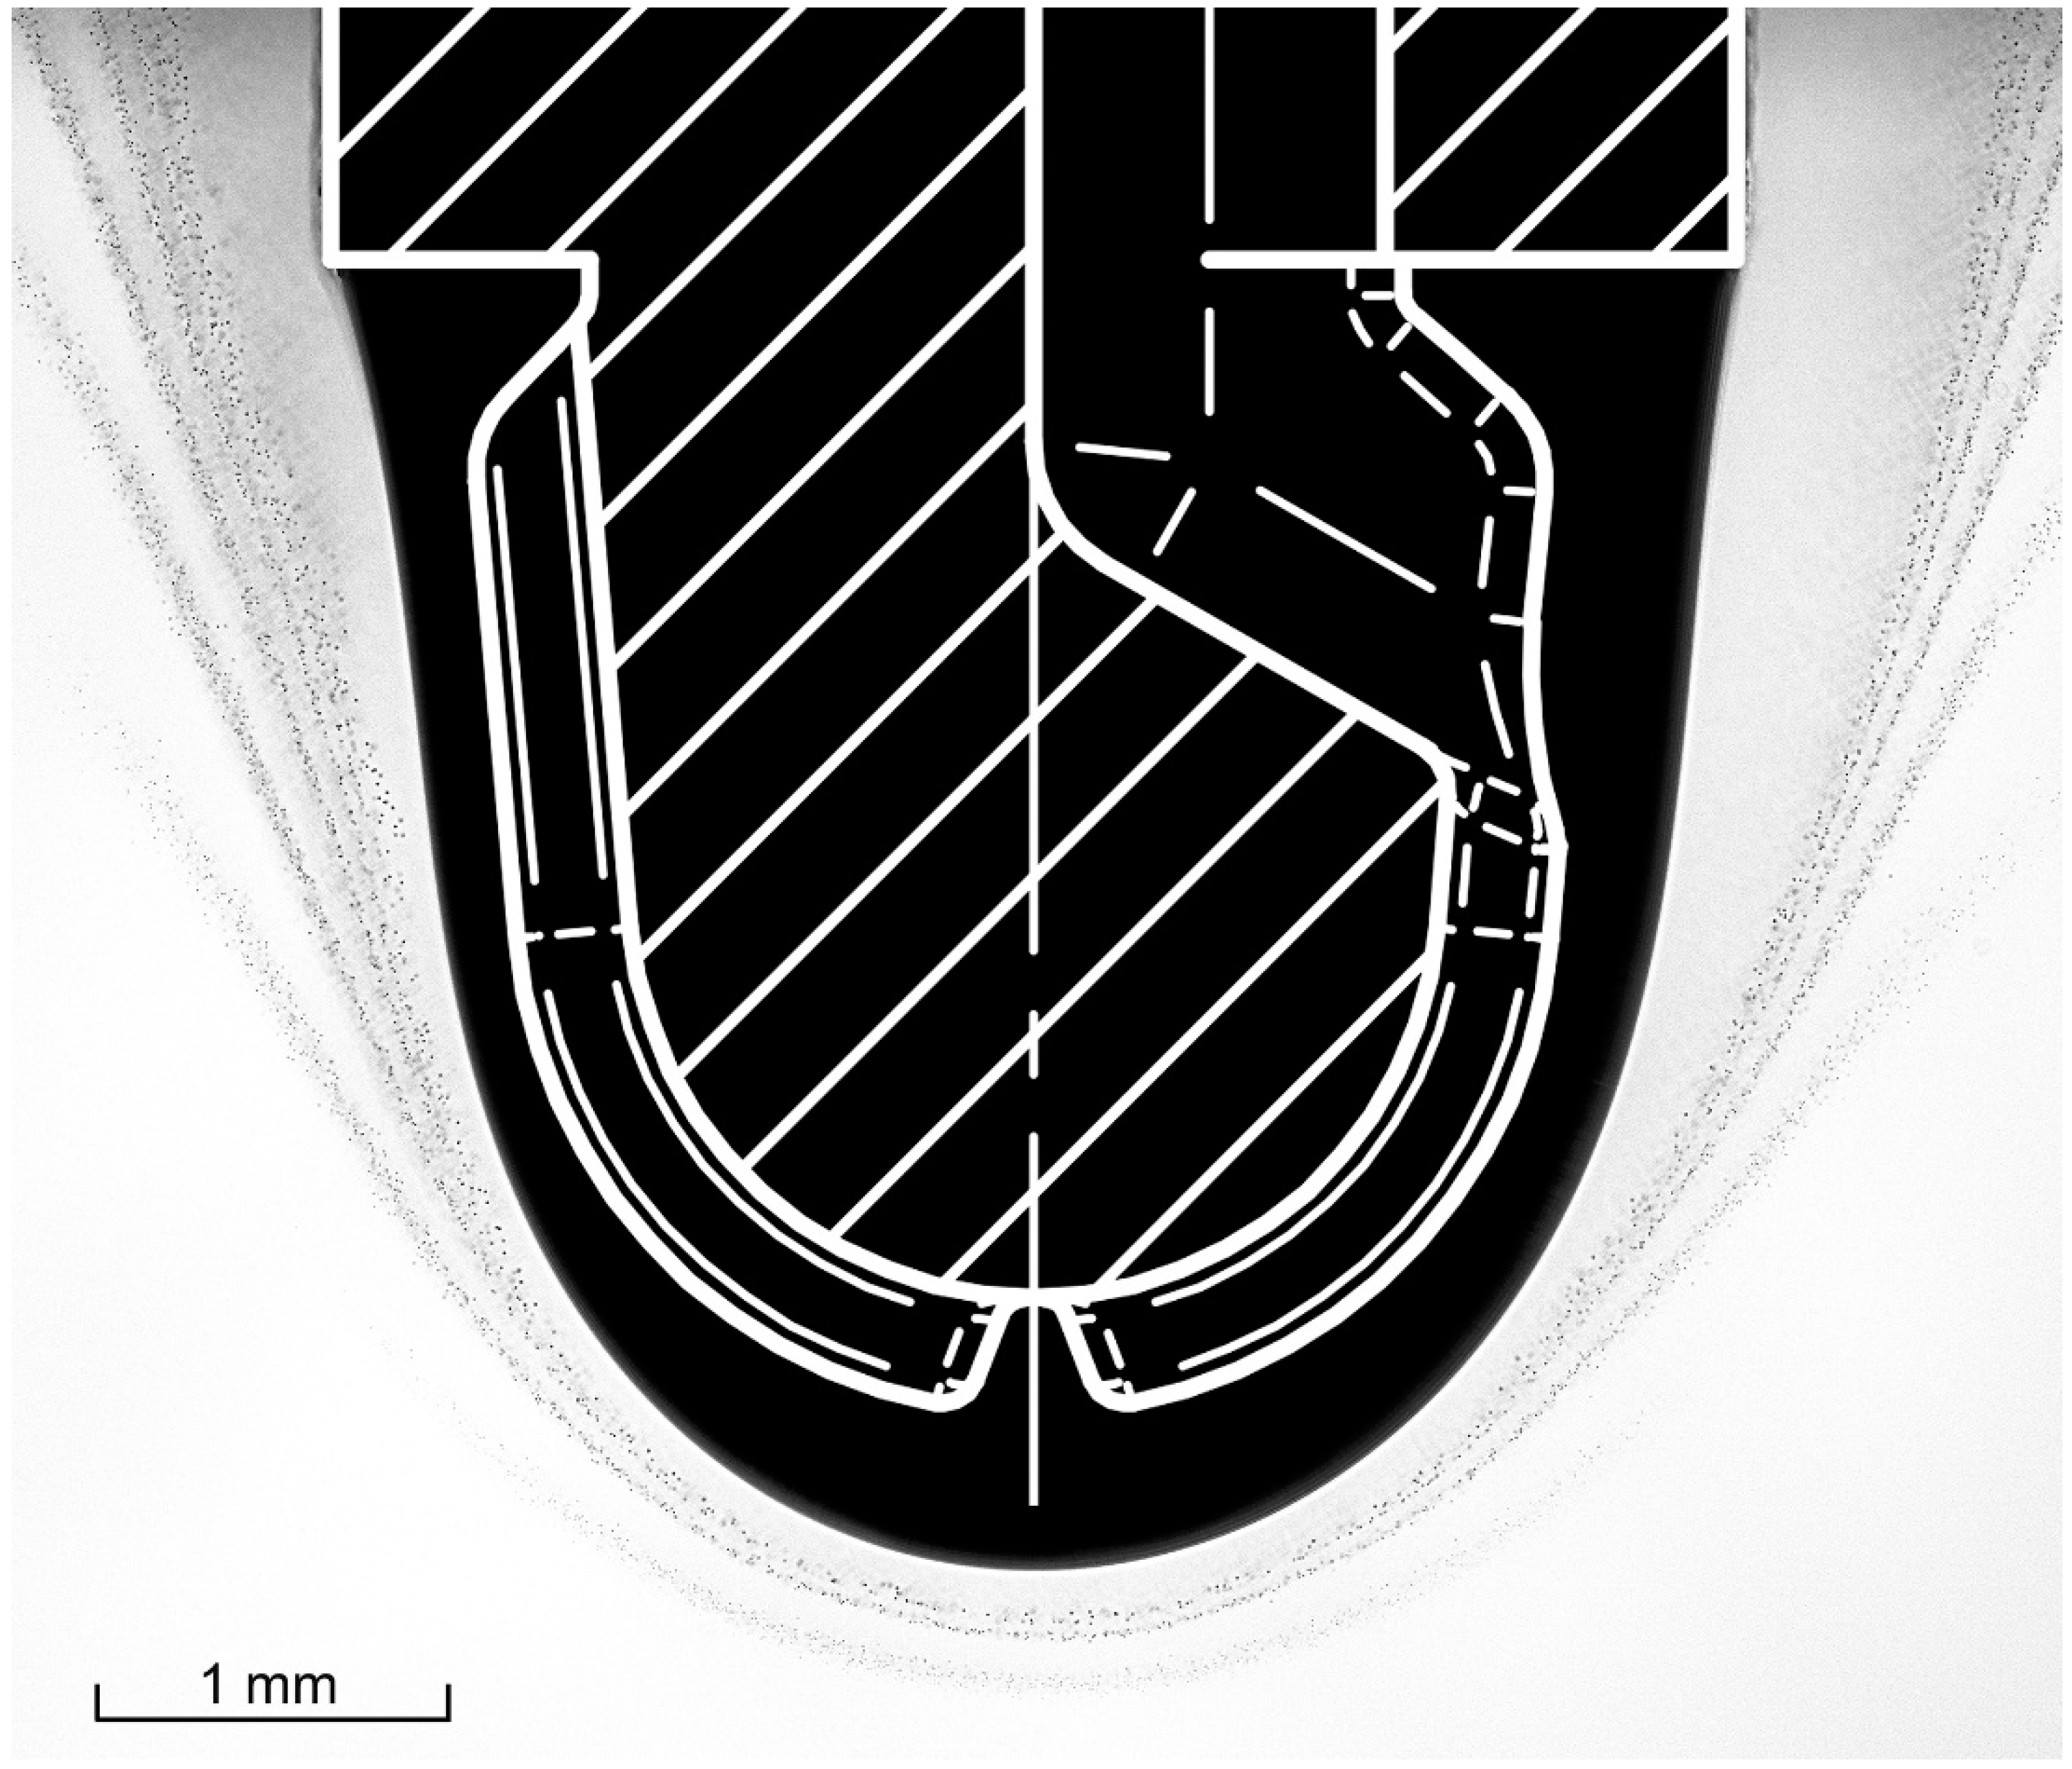
, but in the experiments, it varied with a position on the tip (Figure 5) from 0.2 to 0.6 mm. Simulations were carried out with δ L L = 0 (i.e., the surface of the liquid at core temperature), and with δ L L = 0.3, 0.4, and 0.5 mm. These results are presented later.
The surface temperature of the parent drop is an additional state variable which is adjusted in order to meet the balance of heat flux via the liquid layer and the heat flux transmitted to the gas phase. A time constant in the millisecond range was arbitrarily chosen for the dynamic thermal behaviour of the liquid layer, assuming that—once the surface temperature has reached equilibrium—this time constant is of little further impact. Heat flux via the liquid layer leads to liquid/air surface temperatures up to 55 K below the temperature of the heated core for the range of u used here.
The value of the latent heat is determined at the drop surface temperature. Other properties are determined at an intermediate temperature T i and volatile compound mass fraction w V , i , both of which lie between that of the droplet and far field. Following [19], the 1/3 rule is used (Equations (12) and (13)):
T i = 2 T D + T 3
w V , i = 2 w V , D + w V , 3
The mass fraction of volatile compound at the droplet’s surface is given by a partial pressure rule (Equation (14)):
w V , D = p V , D M V p V , D M V + p p V , D M A
where M V and M A are the molar masses of the volatile compound and air, respectively.
The diffusion coefficient of vapour in air D V , A was estimated using the method of Fuller, Schettler, and Giddings [20]. The special atomic diffusion volume used by this method was found by fitting the method to data for the diffusion of propanediol in air at 25 °C [21]. The Fuller, Schettler, and Giddings method [20] was then used to calculate the diffusivity at other temperatures. For the thermal conductivity λ G of the air/propanediol gas phase, the mixing rule of [22] and [23] was applied. Other properties were taken from the VDI Heat Atlas [24].
The droplets in a single control volume are assumed to all be the same size, as well as spherical, so their diameter can be calculated from the droplet mass density and number density.
Aerosol is, of course, not a continuum on a microscopic scale. A threshold is applied to the nucleation rate, which prevents droplets from forming if there is less than a given threshold. A similar threshold could be applied to the droplet number density instead of the nucleation rate, but the nucleation rate was chosen as it was considered to be less prone to historical effects. The threshold model proved necessary to predict spatially stratified aerosol and stable temporally cyclic nucleation. Otherwise, only single poorly defined aerosol layers developed, or cyclic nucleation decayed within a few periods after the start of the simulation. The threshold value could be varied over a wide range, showing only moderate impact on nucleation frequency and thickness of layers.

3.2. Simple 1D Numerical Model

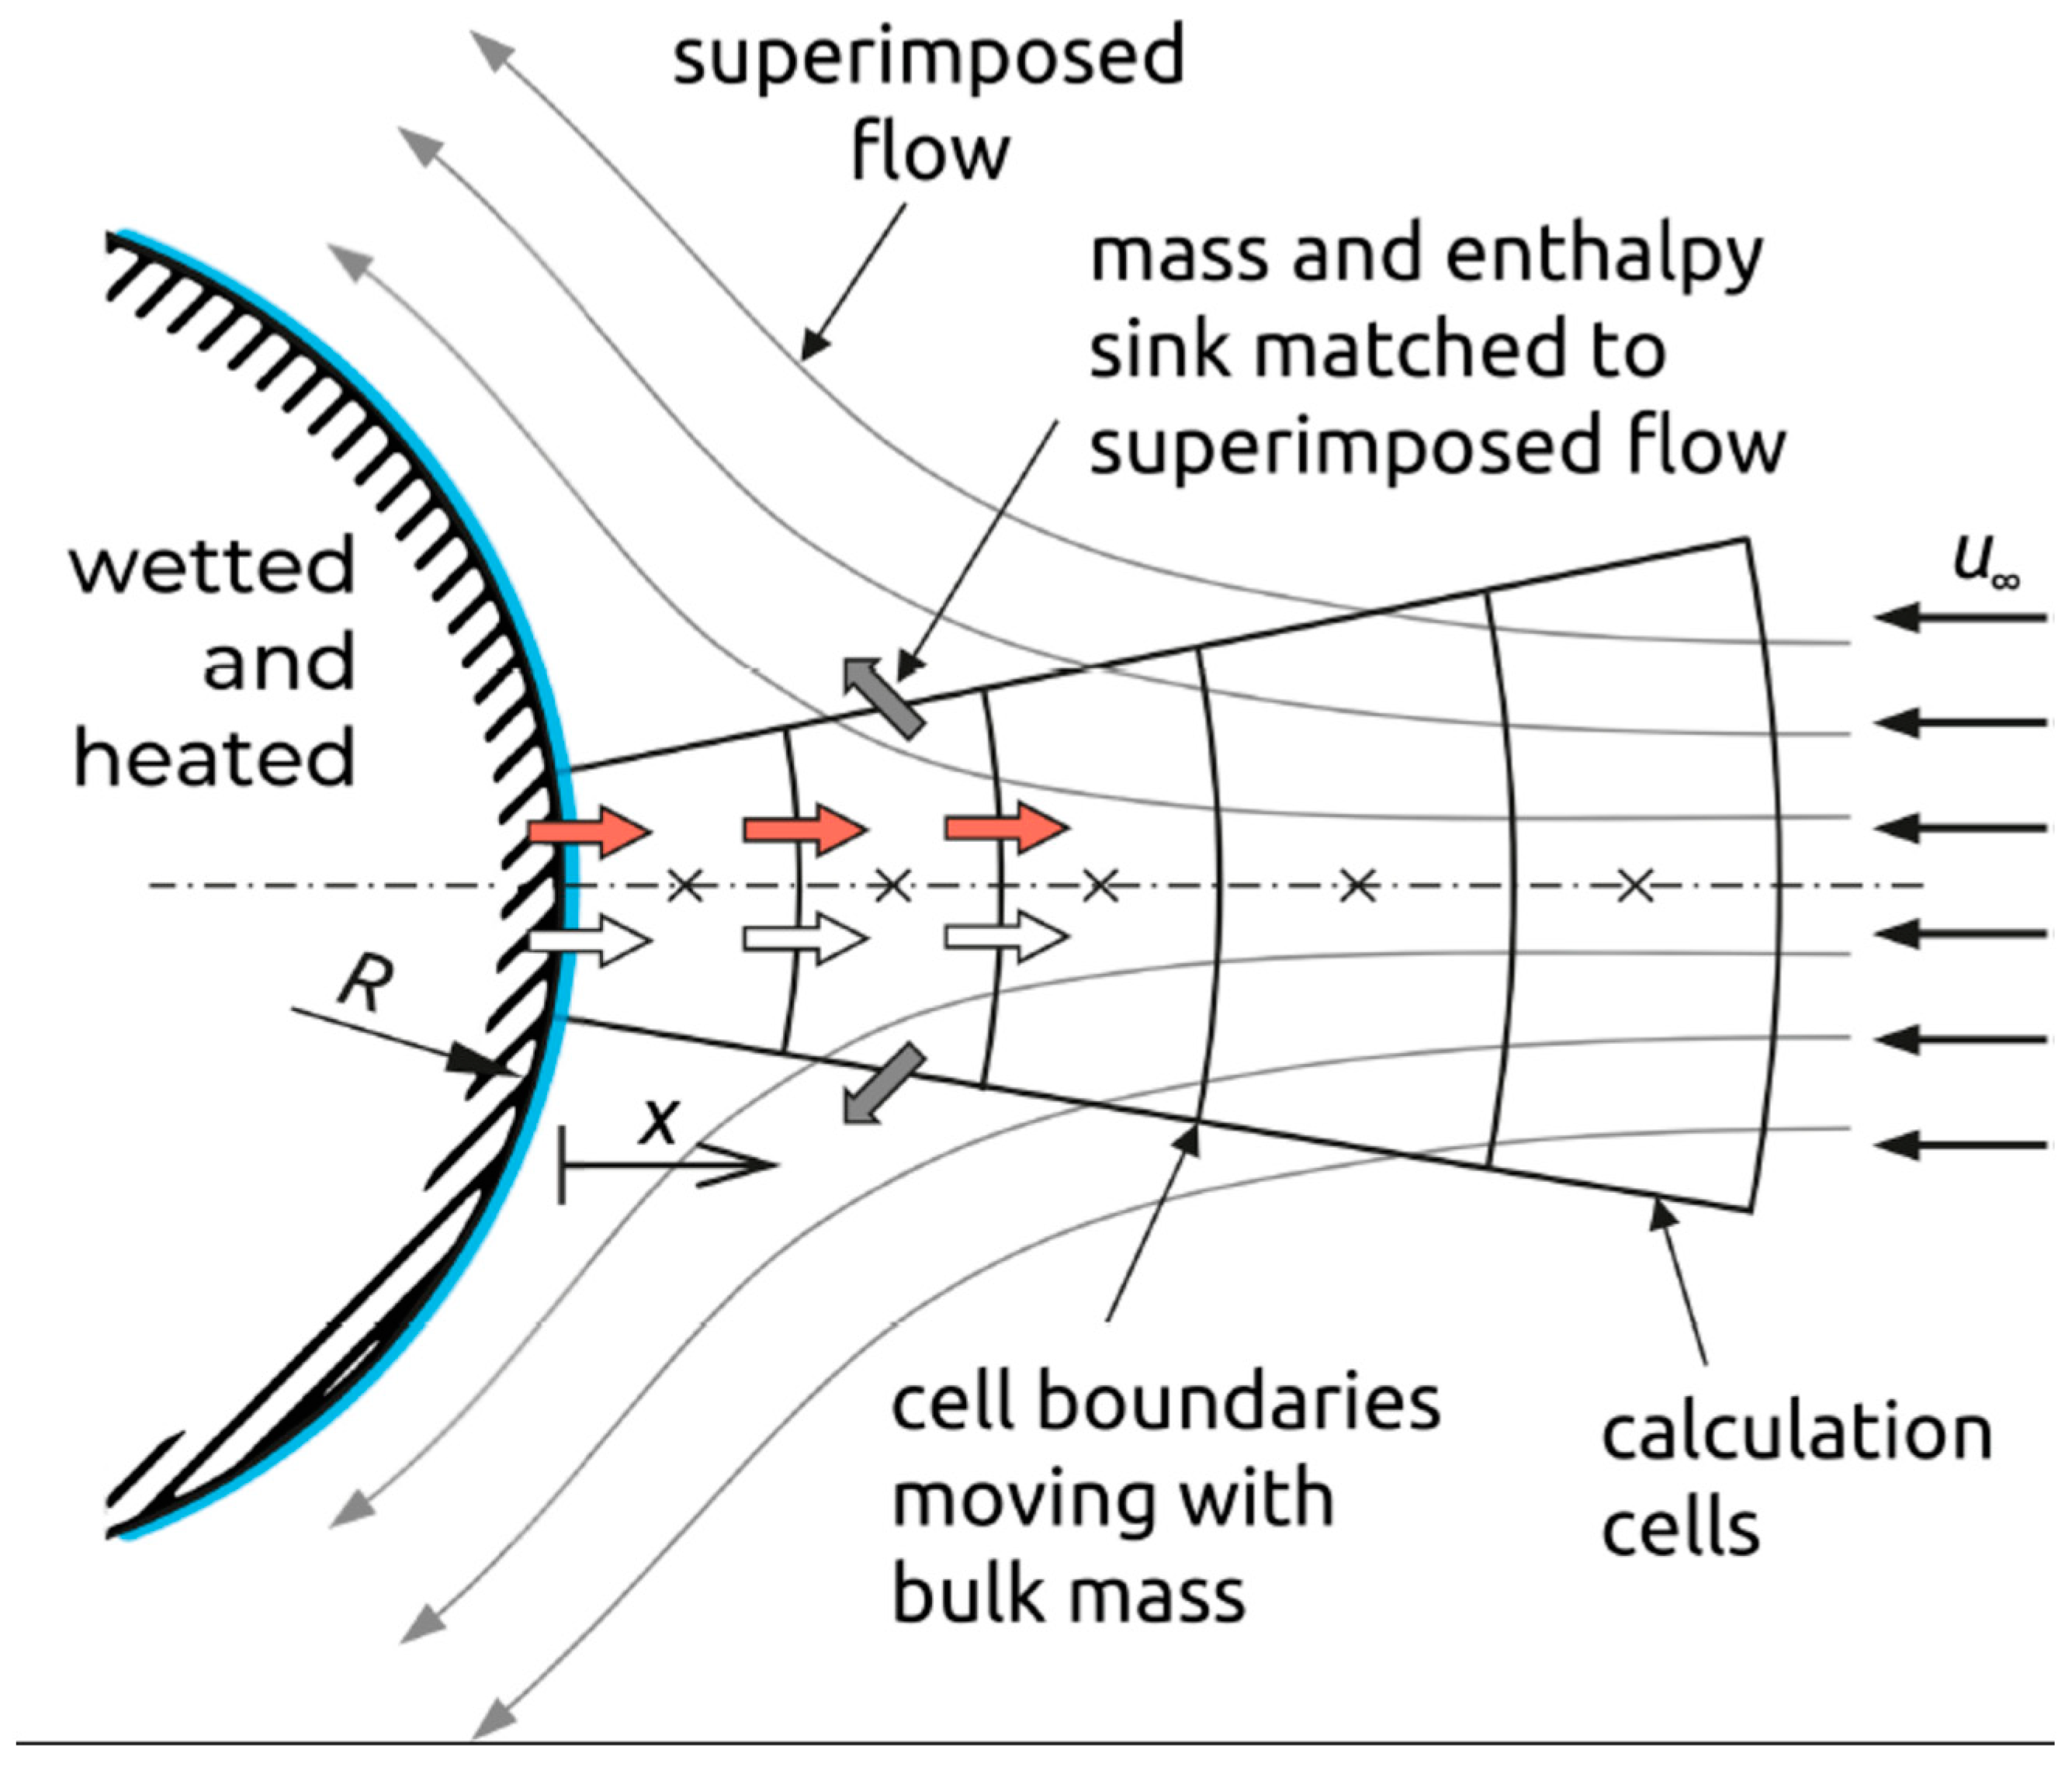
A simple finite volume model of cyclic nucleation was constructed using axis-symmetric potential flow solutions for the velocity field of the suspended drop. The coordinate system is spherical for the approaching flow, with the origin at the centre of curvature of the body’s windward face. Only the flow along the stagnation line is modelled, as this sets the nucleation frequency. Nucleation, growth, and heat transfer to the aerosol droplets were solved using a finite volume approach. Nucleation rate, droplet growth, and droplet-vapour heat transfer are computed in each cell. The computational cells move with the bulk mass (Figure 8). Thus, no convectional transport across the boundaries needs to be calculated, only diffusion. As the cell boundary at the surface is the only one not moving with bulk mass, the transfer of heat and the volatile compound’s mass is calculated according to unimolar transfer from the surface to the first cell’s centre. It is assumed that heat and mass transport within the boundary layer are dominant in the one coordinate which is used for discretization. Cells are split or merged to keep their size within 0.4 to 1.5 times their initial width. Splitting occurs in the cell closest to the evaporating surface as it constantly gains mass. Merging occurs in the approaching flow simulation due to the mass and enthalpy sinks, which are used to generate the flow pattern.
The velocity field is generated using a potential flow solution. For a suspended drop with vapour approaching at speed u , the local vapour velocity u x can be estimated from the superposition of a parallel flow and n discrete point sources of strength Q i placed at positions x i on the x-axis according to Equation (15):
u x = u + u 4 π u * i = 1 n Q i x x i 2   for   x 0
The factor u / u * is used to keep the contour constant at different approach velocities. The suspended drop contour used for the simulations (Figure 5) can be approximated by n = 8 sources with the values given in Table 1. The values of Q i and x i were determined to approximate the desired body contour, by finding optimal values using the MATLABTM (MathWorks, Natick, MA, USA) release R2022a multidimensional minimization algorithm fminsearch.
The superposition of the velocity field was carried out implicitly by mass and enthalpy sinks in each calculation cell in a way that without unimolar diffusion from the surface, the cell boundaries move with the given velocities u x according to Equations (16) and (17):
m ˙ cell = m cell · d u x d x + 2 x + r u x
H ˙ cell = H cell · d u x d x + 2 x + r u x
where x is the corresponding cell’s centre location and r is the radius of the tip. Cell locations are determined by masses and cell volumes. Therefore, this step requires the calculation of cell volumes and locations from the actual state variables first, as follows.
In each cell, the model solves for the state variable’s total enthalpy H (including liquid and vapour), mass of air m A , mass of volatile compound in the vapour phase m v , G , mass of volatile compound in the liquid state m v , L (in the form of aerosol droplets), and number of droplets n D . The temperatures of the gas phase T and droplets T D are found using a numerical search for values which satisfying the quasi-steady-state temperature model and the enthalpy sum. Once the temperatures are known, cell volumes and locations of the cell centres can be calculated and used for discretization of the heat and mass diffusion between cells. Droplet diameters and vapour phase composition are then calculated, followed by nucleation rates and mass condensation rates of the volatile compound, and the above-mentioned mass and enthalpy sink rates (Equations (16) and (17)).
All derivatives at cell boundaries are calculated to be first order. The model was solved in MATLAB as an ordinary differential equation (ODE), using the ODE113-solver with variable order method and variable timestep. The splitting and merging of cells were triggered by event handling, which required intermission of the solution at each event since the state vector had to be adjusted to the change in cell number and according to state variables numbers.
At the surface of the droplet, or the wetted parts of the suspended drop apparatus, the boundary conditions are that the surface temperature is the bulk temperature, the partial pressure of the volatile compound is equal to the saturation vapour pressure at this temperature, and the mass flux of air is zero.
The nucleation rate threshold was one droplet per cube of side 100 or 30 μm per 10 μs. This was chosen based on observed droplet–droplet distances in the order of 10 μm. Cell sizes were 2 to 5 μm, although stable simulations could be carried out up to 40 μm for the 2.8 mm diameter drop.
Each cell is initialized with air at 20 °C, with no volatile compound and no droplets present.
In order to reduce computation time, the model uses constant material properties over the whole boundary layer, except for the latent heat L V and vapour pressure p v s of the volatile compound. For the latter, temperature dependency was modelled using Equation (18):
p v s T = 10 A B T
with constants A and B fitted across the temperature range from ambient air to bulk liquid.
With constant specific heat capacities c p , G and c p , L of the volatile compound in the vapour and liquid phase, the latent heat is linear with temperature (Equation (19)):
L T = L T i + c p , G c p , L T T i
Equations (9) and (10) are used to determine droplet temperature T D .

Results from the Simple 1D Model

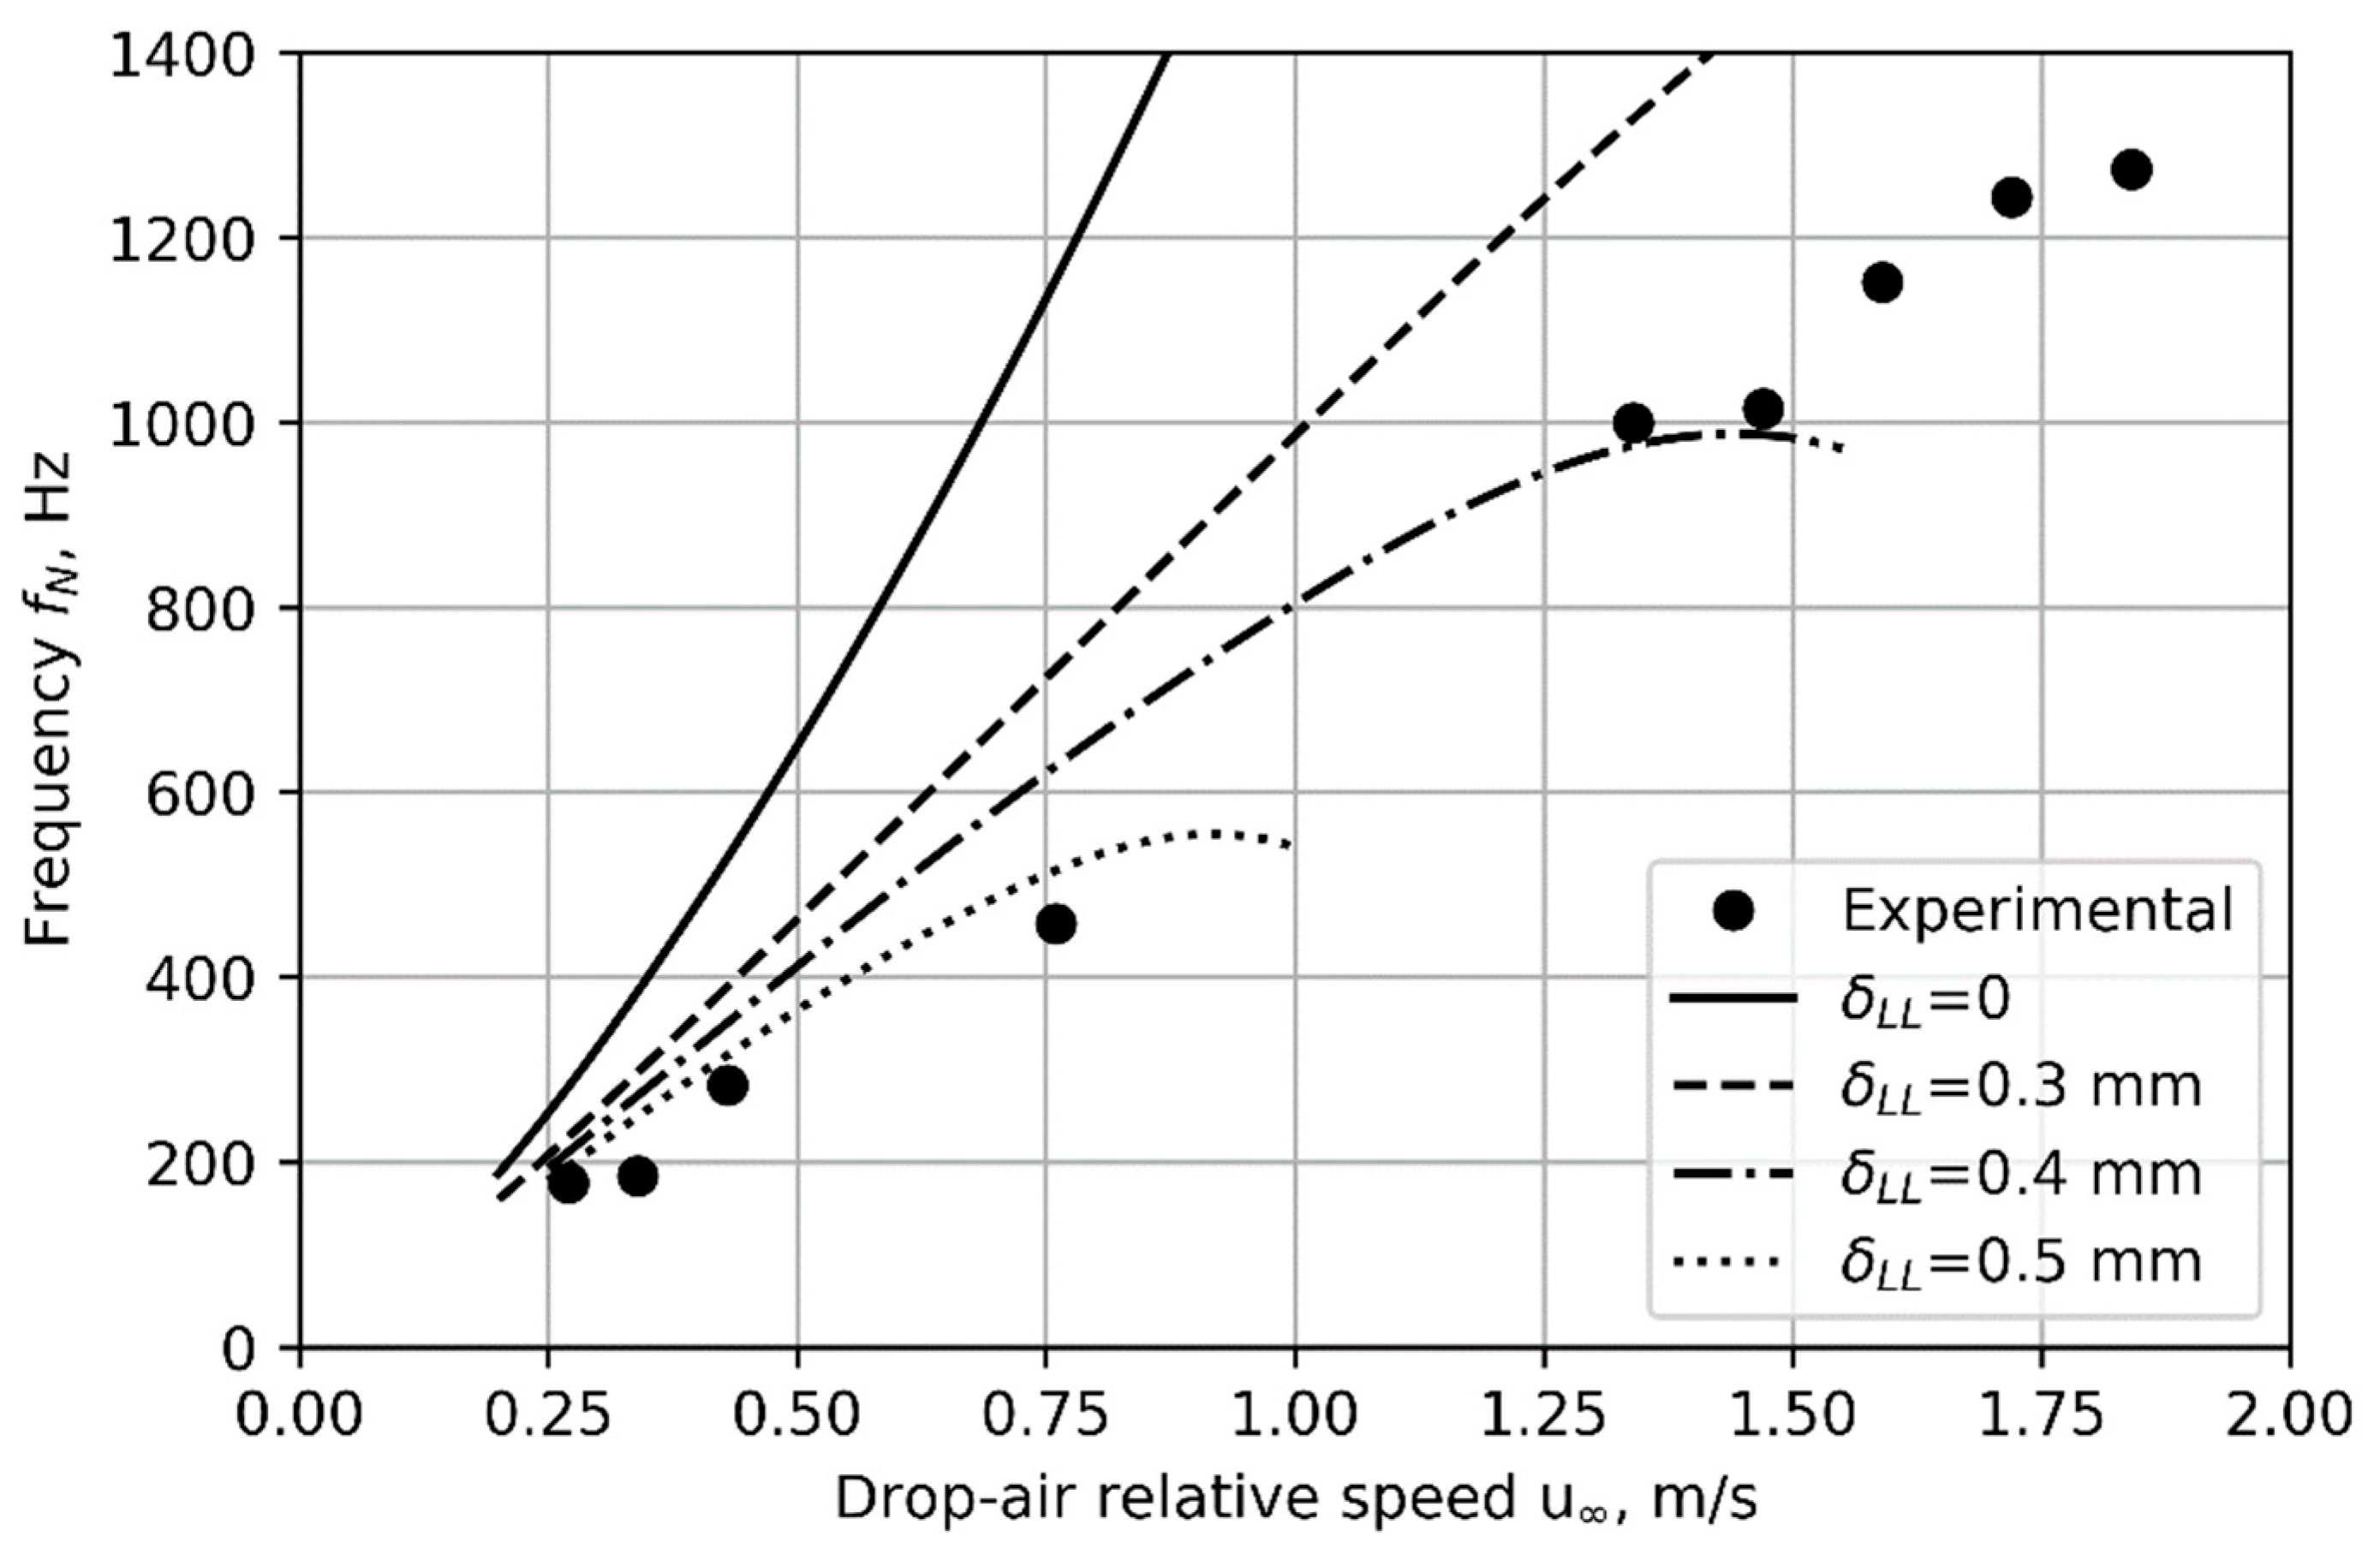
The frequency of nucleation predicted by the model, for a nozzle core temperature of 190 °C, and for liquid layer thicknesses of δ L L = 0 (liquid/air interface at nozzle core temperature) and δ L L = 0.3, 0.4, and 0.5 mm are compared to experimental results in Figure 9. A liquid layer thickness δ L L between 0.3 and 0.5 mm fits the experimental data best. The model is imperfect. No single value of δ L L predicts the nucleation frequency correctly across the whole range of air speeds. The model predicts a drop in frequency (at u > 1.3 m/s for δ L L = 0.4 mm), which is not seen in the experiment. Nevertheless, the most important observation is that the model does predict cyclic nucleation, indicating that it includes the physics necessary to explain the phenomenon. Further, it predicts nucleation frequency to better than order-of-magnitude accuracy.

3.3. CFD Model

Transient flow, nucleation, vapour transport, and growth were modelled using ANSYS Fluent 2020 R2 (ANSYS, Canonsburg, PA, USA) for spherical parent drops at a fixed speed, replicating the windward conditions of a suspended drop. ANSYS Fluent is a general-purpose code for solving computational fluid dynamics and heat transfer calculations, suitable for problems involving evaporation and condensation, as illustrated in [25]. The parent drop was 2.8 mm in diameter, with liquid surface temperatures of 180 °C, chosen to compare with the 190 °C nozzle core temperature, allowing for a reduced surface temperature due to heat loss to the surrounding air.
Two-dimensional axis-symmetric meshes were created with ANSYS Meshing using quad- and tri-elements. Mesh convergence was checked by monitoring nucleation frequency. Meshes of 104,242 elements, 350,755 elements, and 581,913 elements were chosen with the finest mesh selected for generating the results shown here. The finest mesh produced nucleation frequencies within 15% of the intermediate mesh. Further refinement was not carried out due to limitations in computing resources. This mesh had a minimum cell volume of 2.4 × 10⁻¹¹ m3, a maximum cell volume of 1.8 × 10⁻¹⁰ m3, and a minimum orthogonal quality of 0.398.
Dry air at 20 °C approaching the drop was set at a velocity from 0.2 to 0.8 m/s (Re = 37 to 150) using a velocity inlet boundary. All other external boundaries were outflow. The boundary of the droplet had a specified temperature of 180 °C and a 1,3-propanediol vapour mass fraction of 0.343.
Two user-defined scalars were defined to model the aerosol population: one to model the droplet number and one to model the droplet mass. These scalars were modified using two user-defined functions within Fluent.
The timestep was fixed at 10−6 s, which produced nucleation at the same times and locations as runs with adaptive timestep. Residuals were converged to 10−3 at each timestep. The calculation ran until five oscillations of nucleation were completed.
The second-order implicit transient scheme was used with the coupled solver. Pressure–velocity coupling used the ‘coupled’ option. No turbulence model was used, i.e., the flow was forced to be laminar. Gradient spatial discretization was least-squares and cell-based. Pressure, momentum, species, energy, and scalar droplet number density were discretized using second-order schemes. Aerosol mass density was discretized using the first-order scheme.
The nucleation rate threshold was one droplet in a volume equivalent to a cube of sides 40 µm, per 10−6 s.
The workstation used had an Intel i7-10700 CPU running at 2.9 GHz with eight cores and 64 GB RAM. Computation took 1–3 weeks depending on the inlet velocity, as a lower velocity produced a lower nucleation frequency.

Results from the CFD

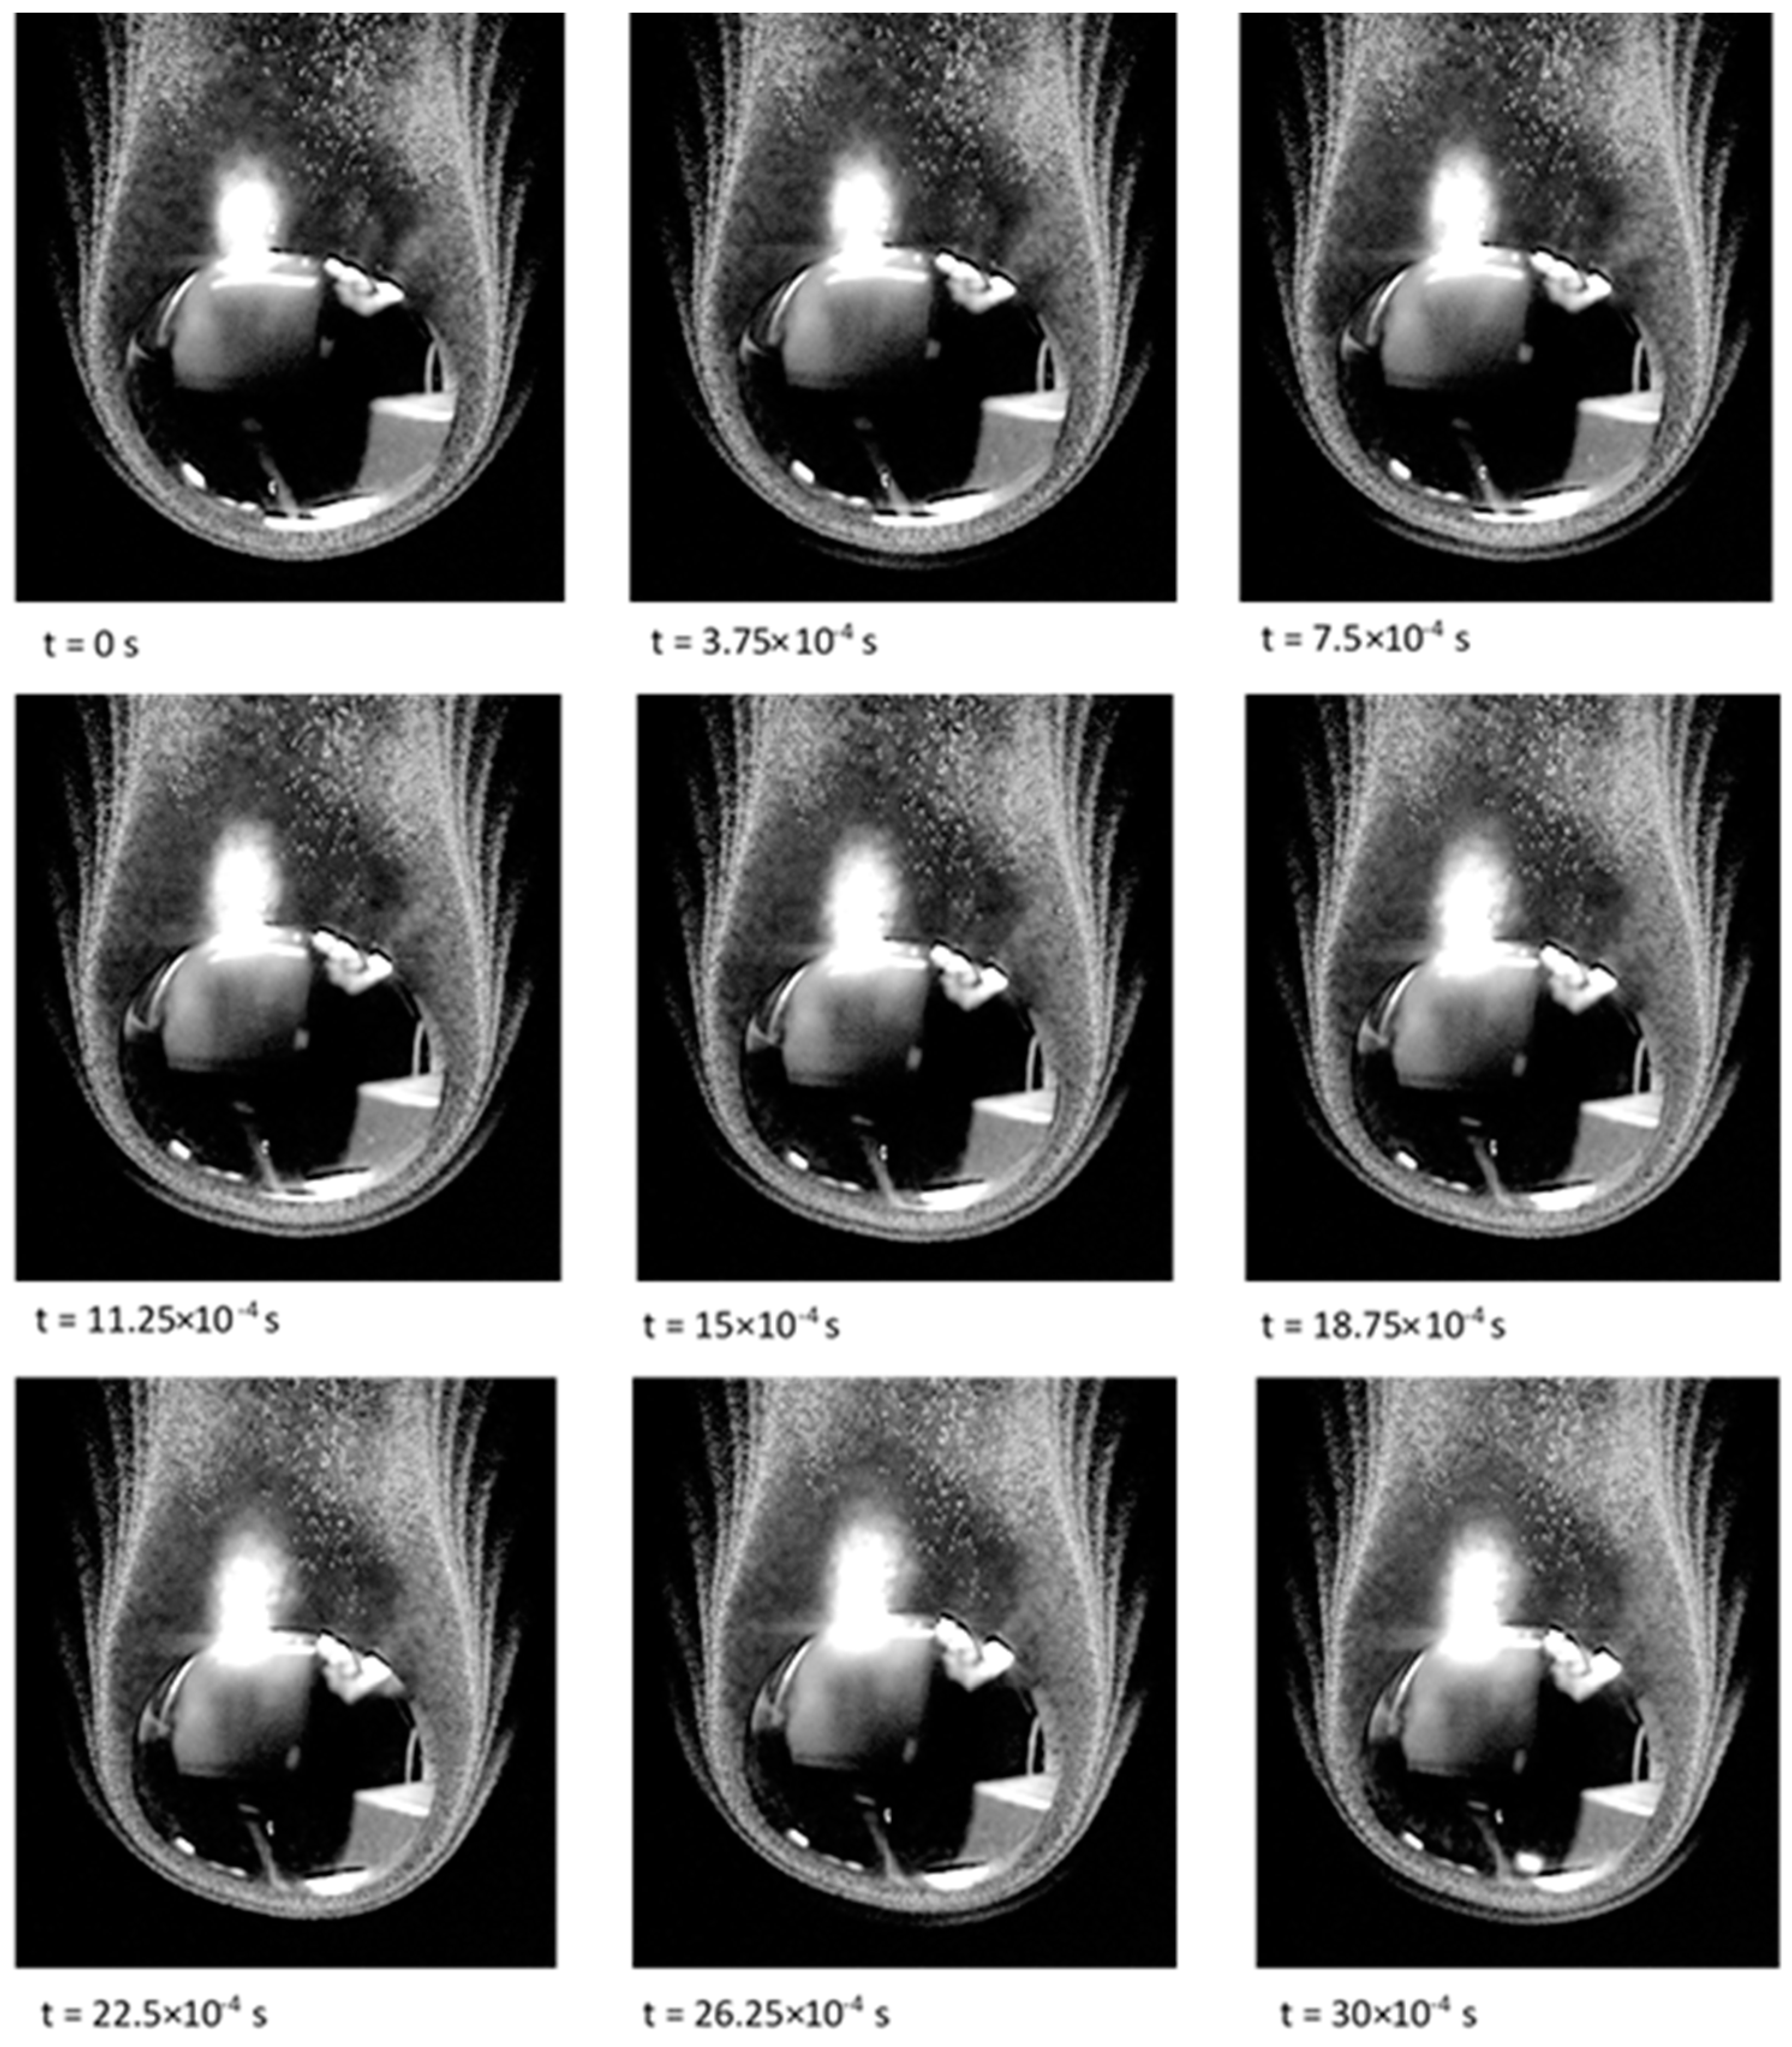
The model successfully reproduced the cyclic nucleation phenomenon at all three speeds. 
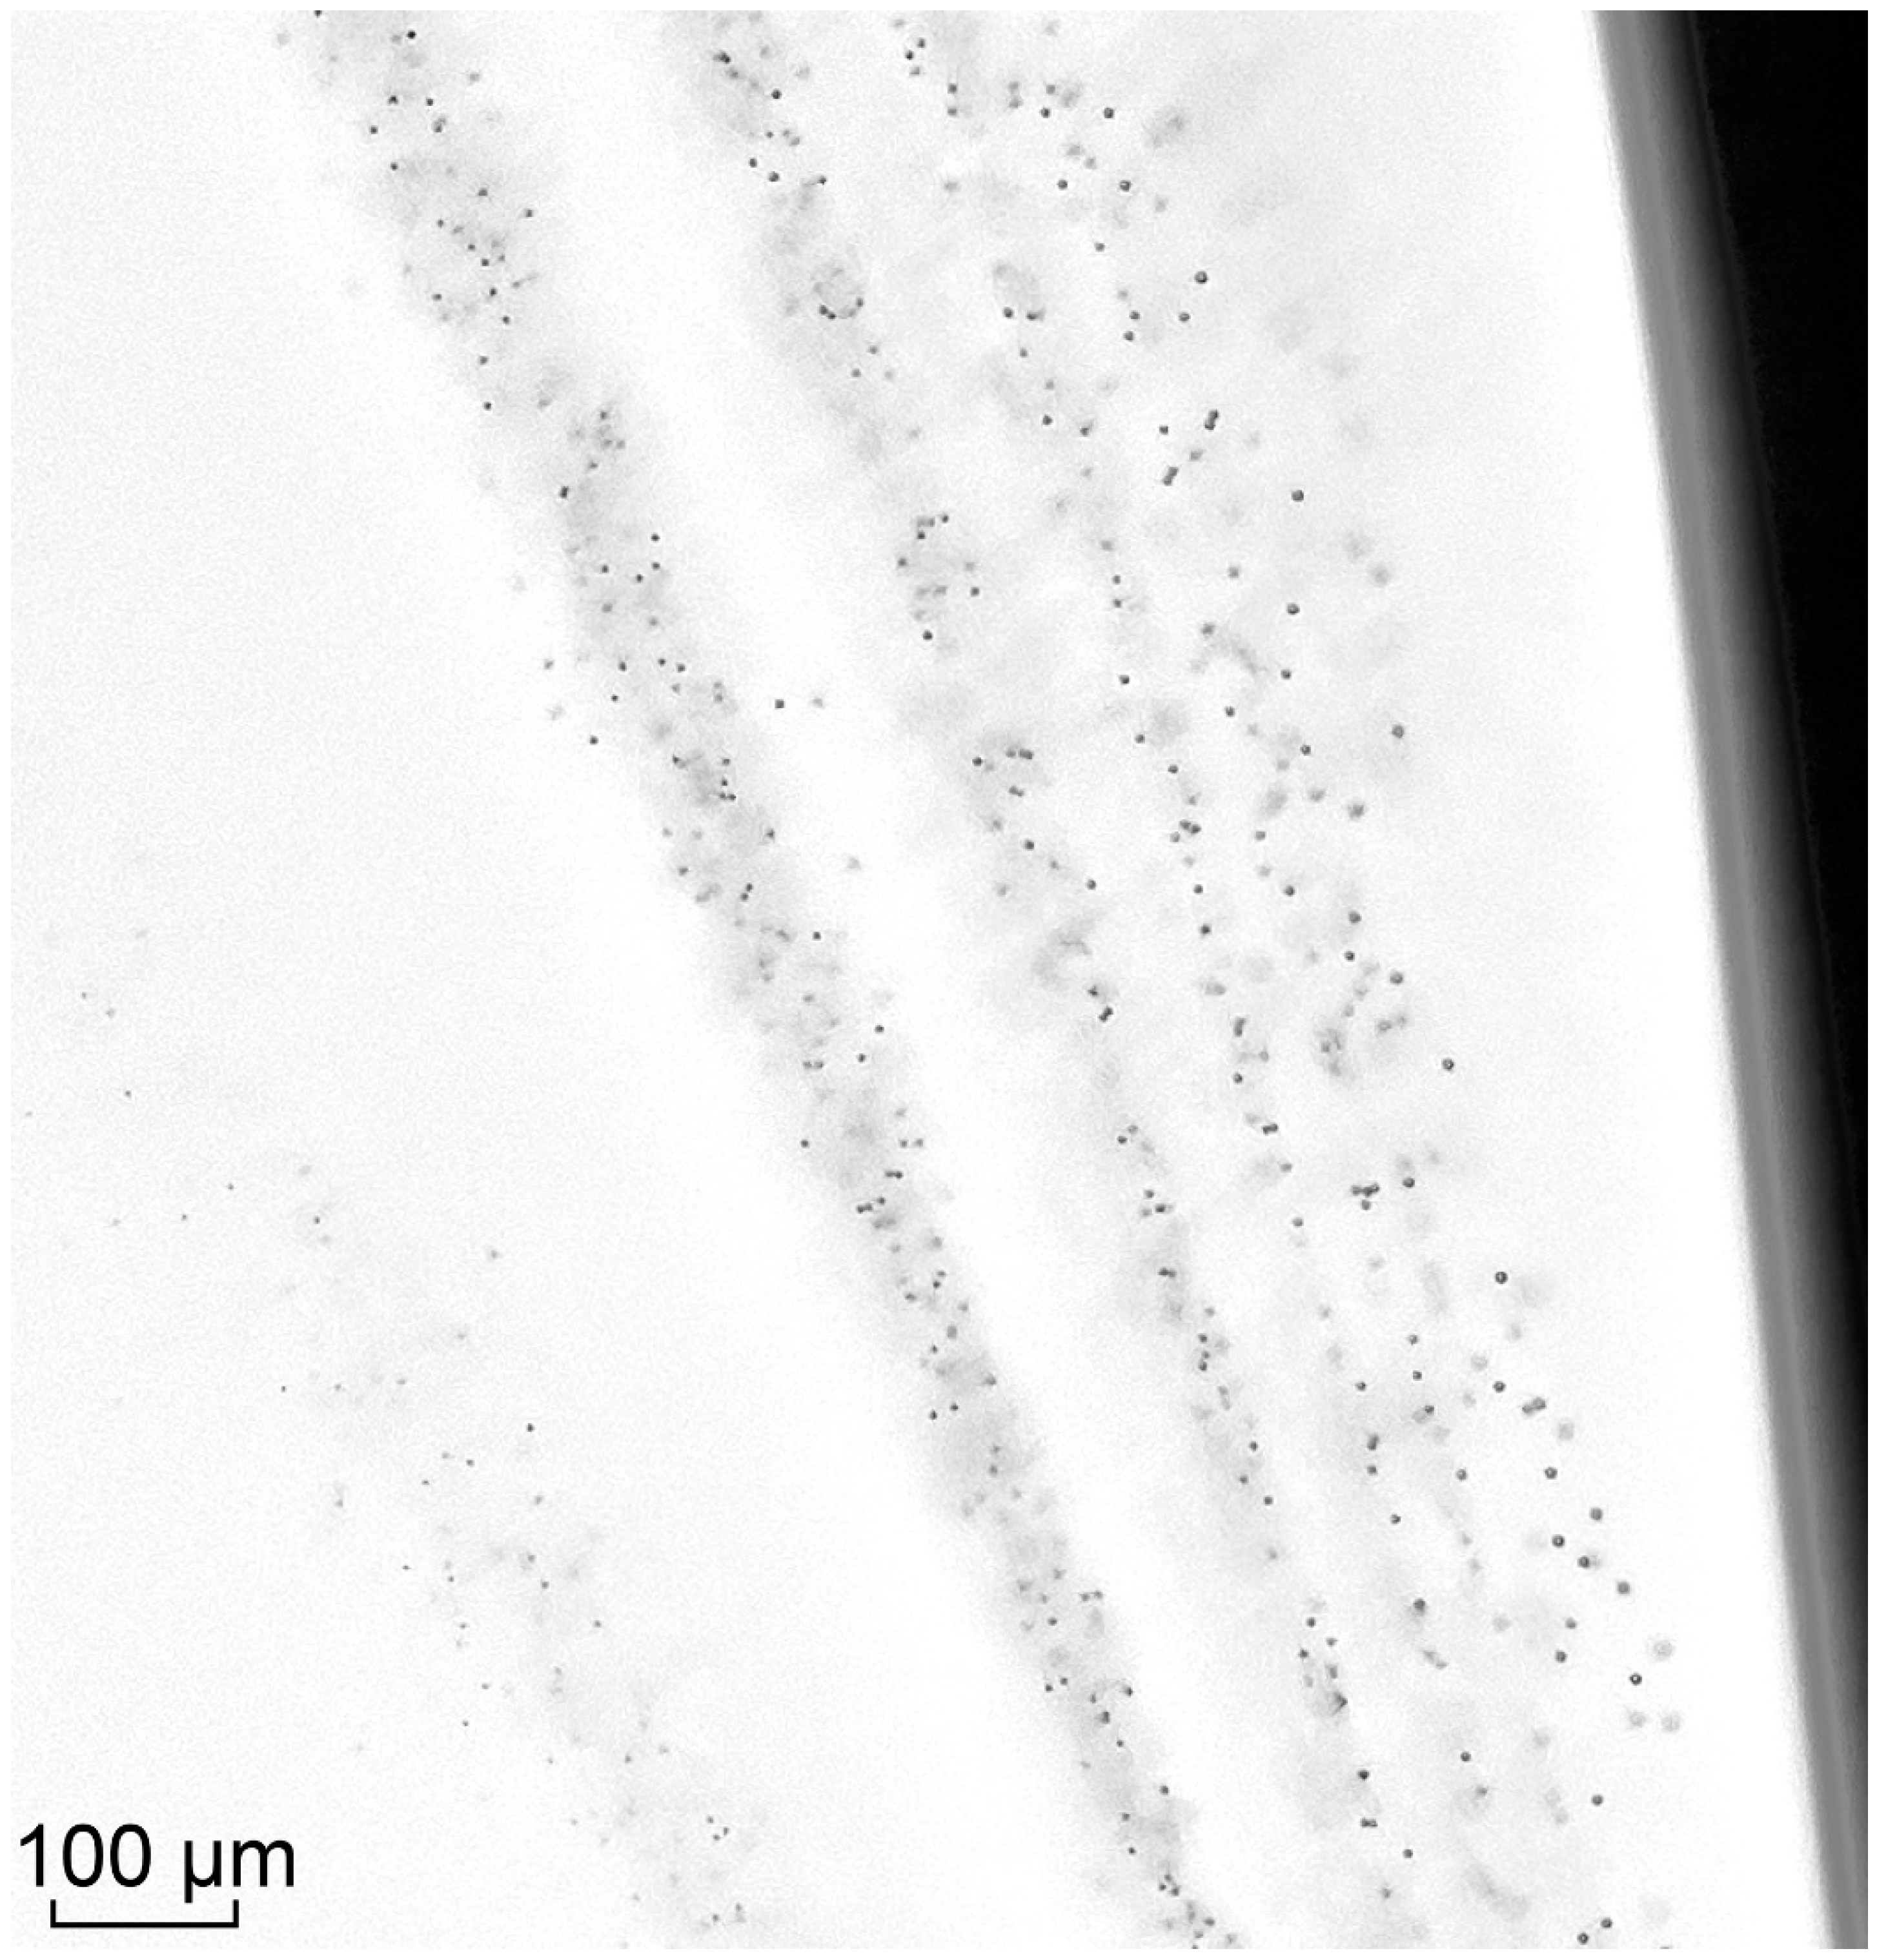
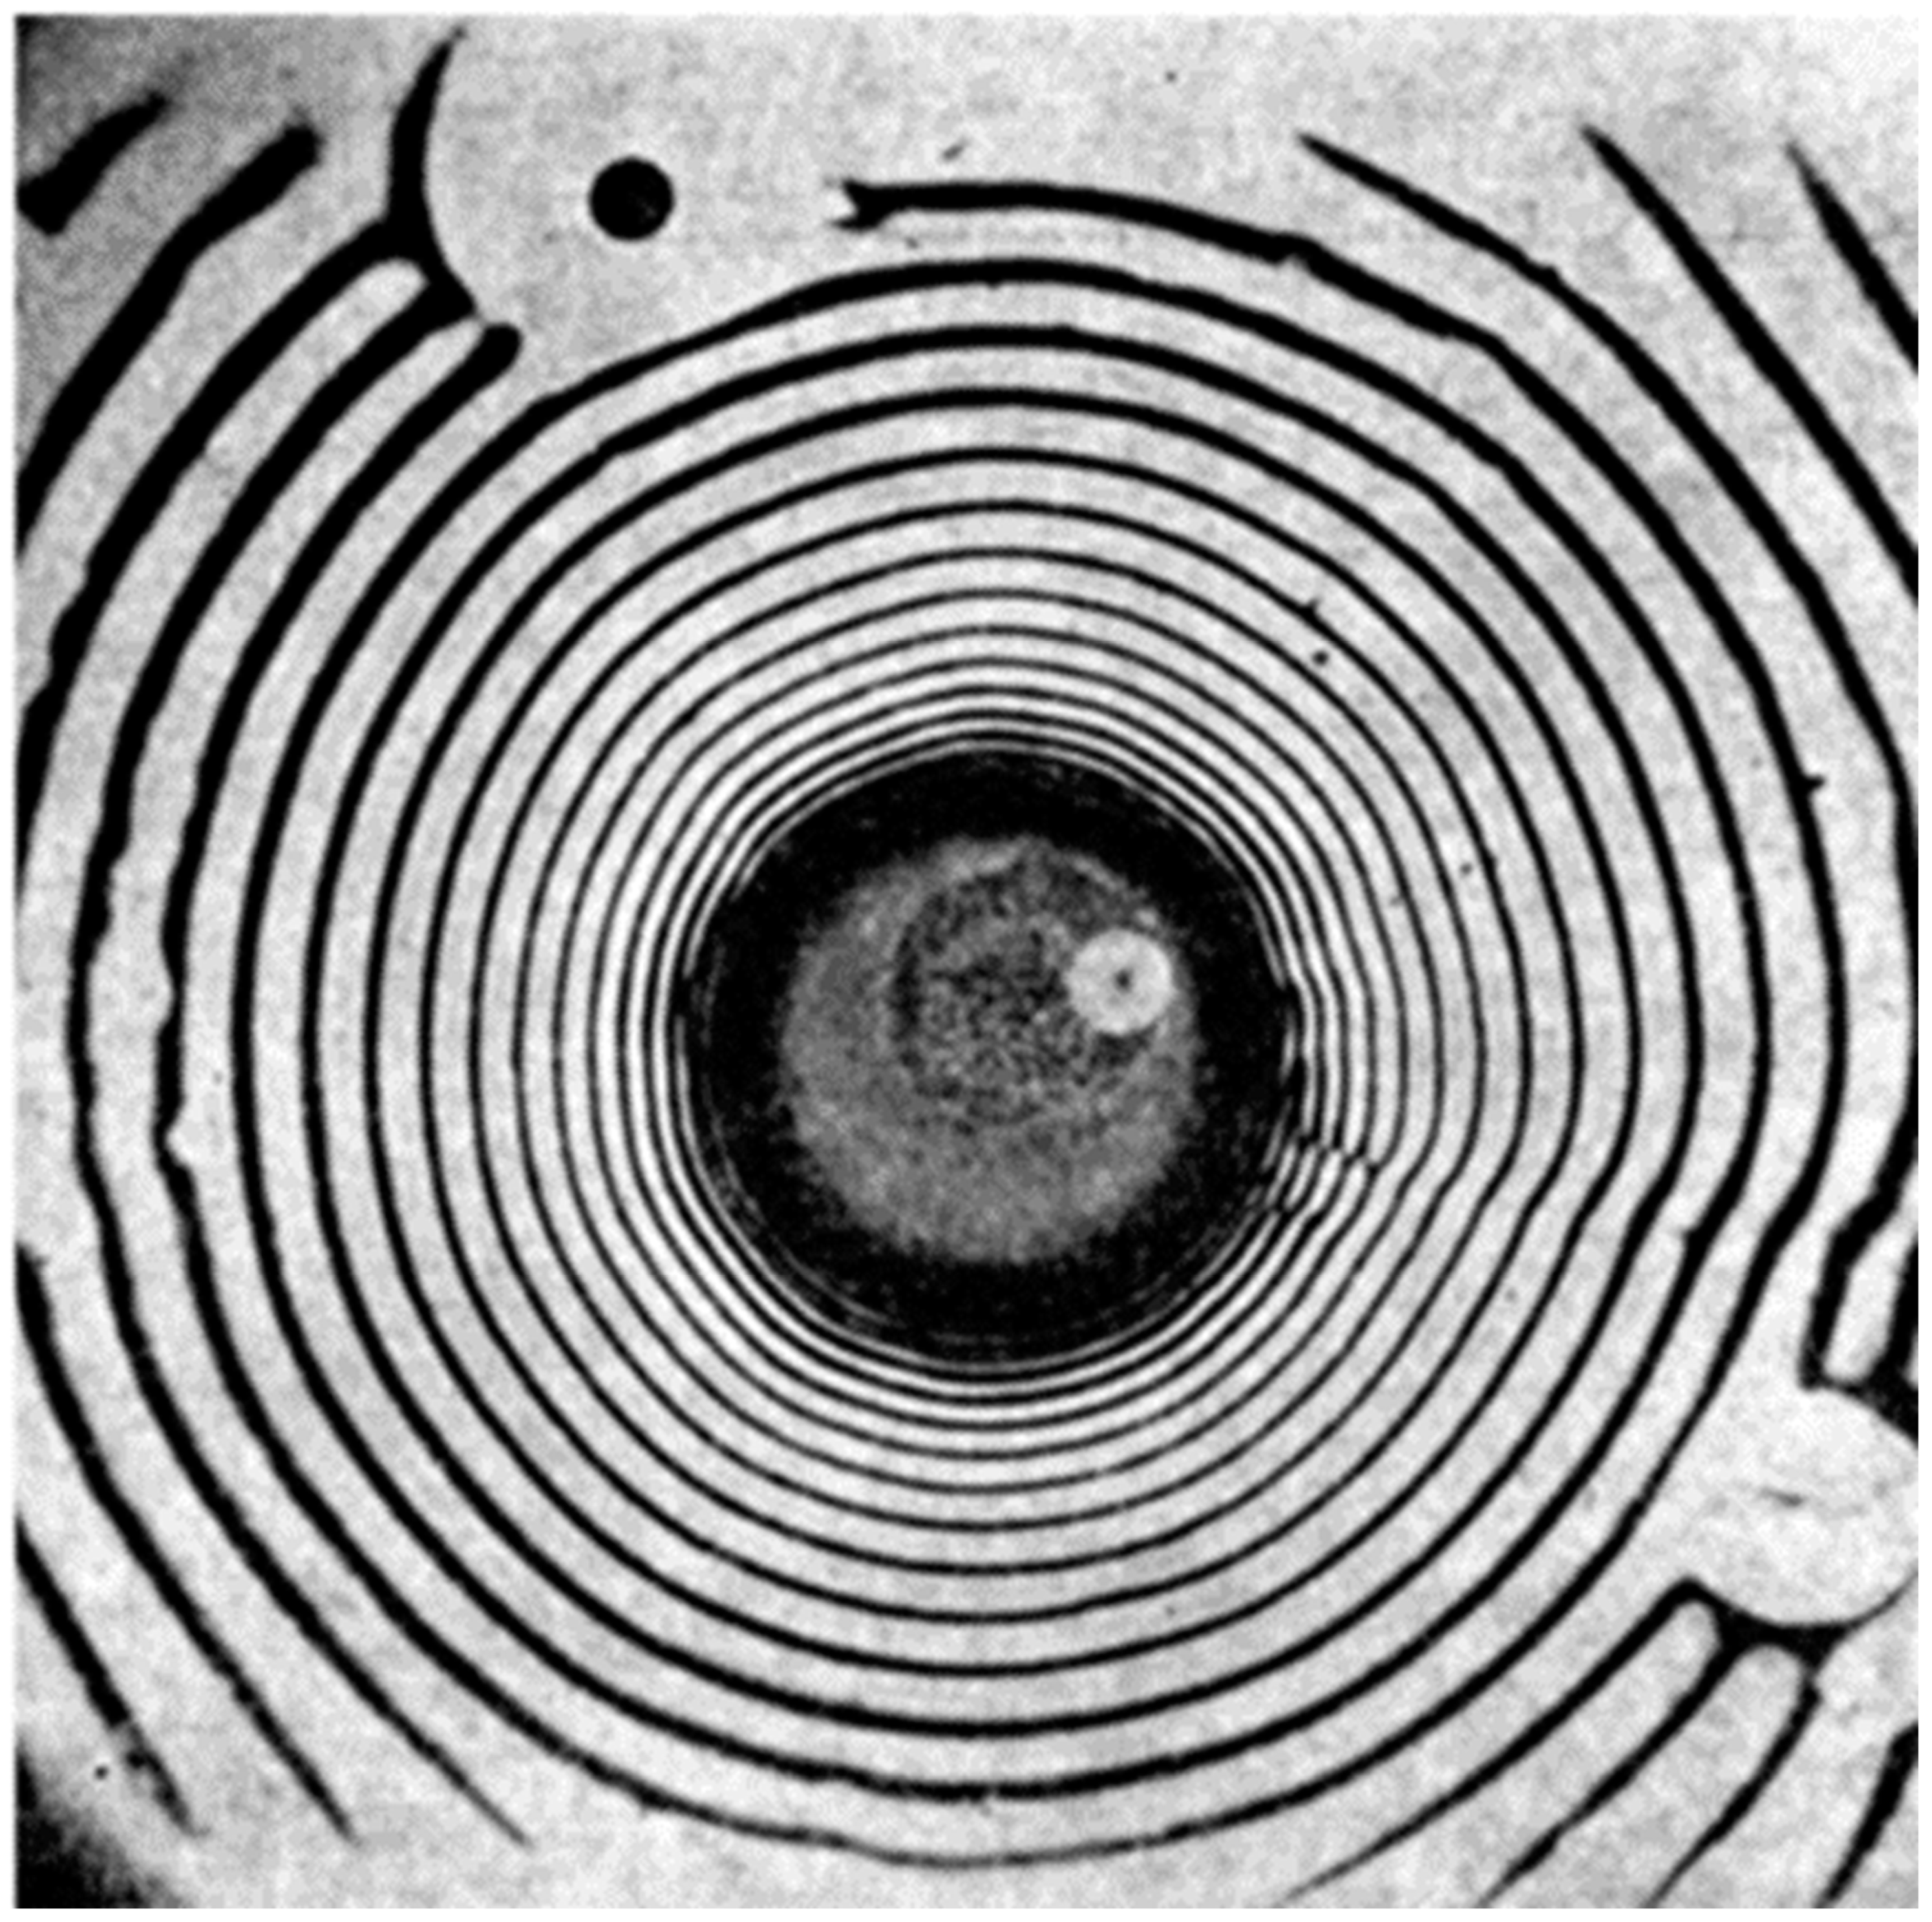
Figure 10 shows plots of droplet number density. Nucleation first appears in an arc on the windward side of the parent drop. The ends of this arc grow in the streamwise direction. Aerosol droplets formed by this nucleation grow and deplete the vapour surrounding them, which stops further nucleation from occurring. The arc of nucleated droplets moves closer to the drop surface until the concentration of aerosol decreases as it is pushed around the side of the droplet. This allows vapour to diffuse away from the upstream face of the droplet until the concentration increases enough to allow another arc of aerosol to form. The development of the bands of aerosol in Figure 10 closely resembles the experimental observations in Figure 1.
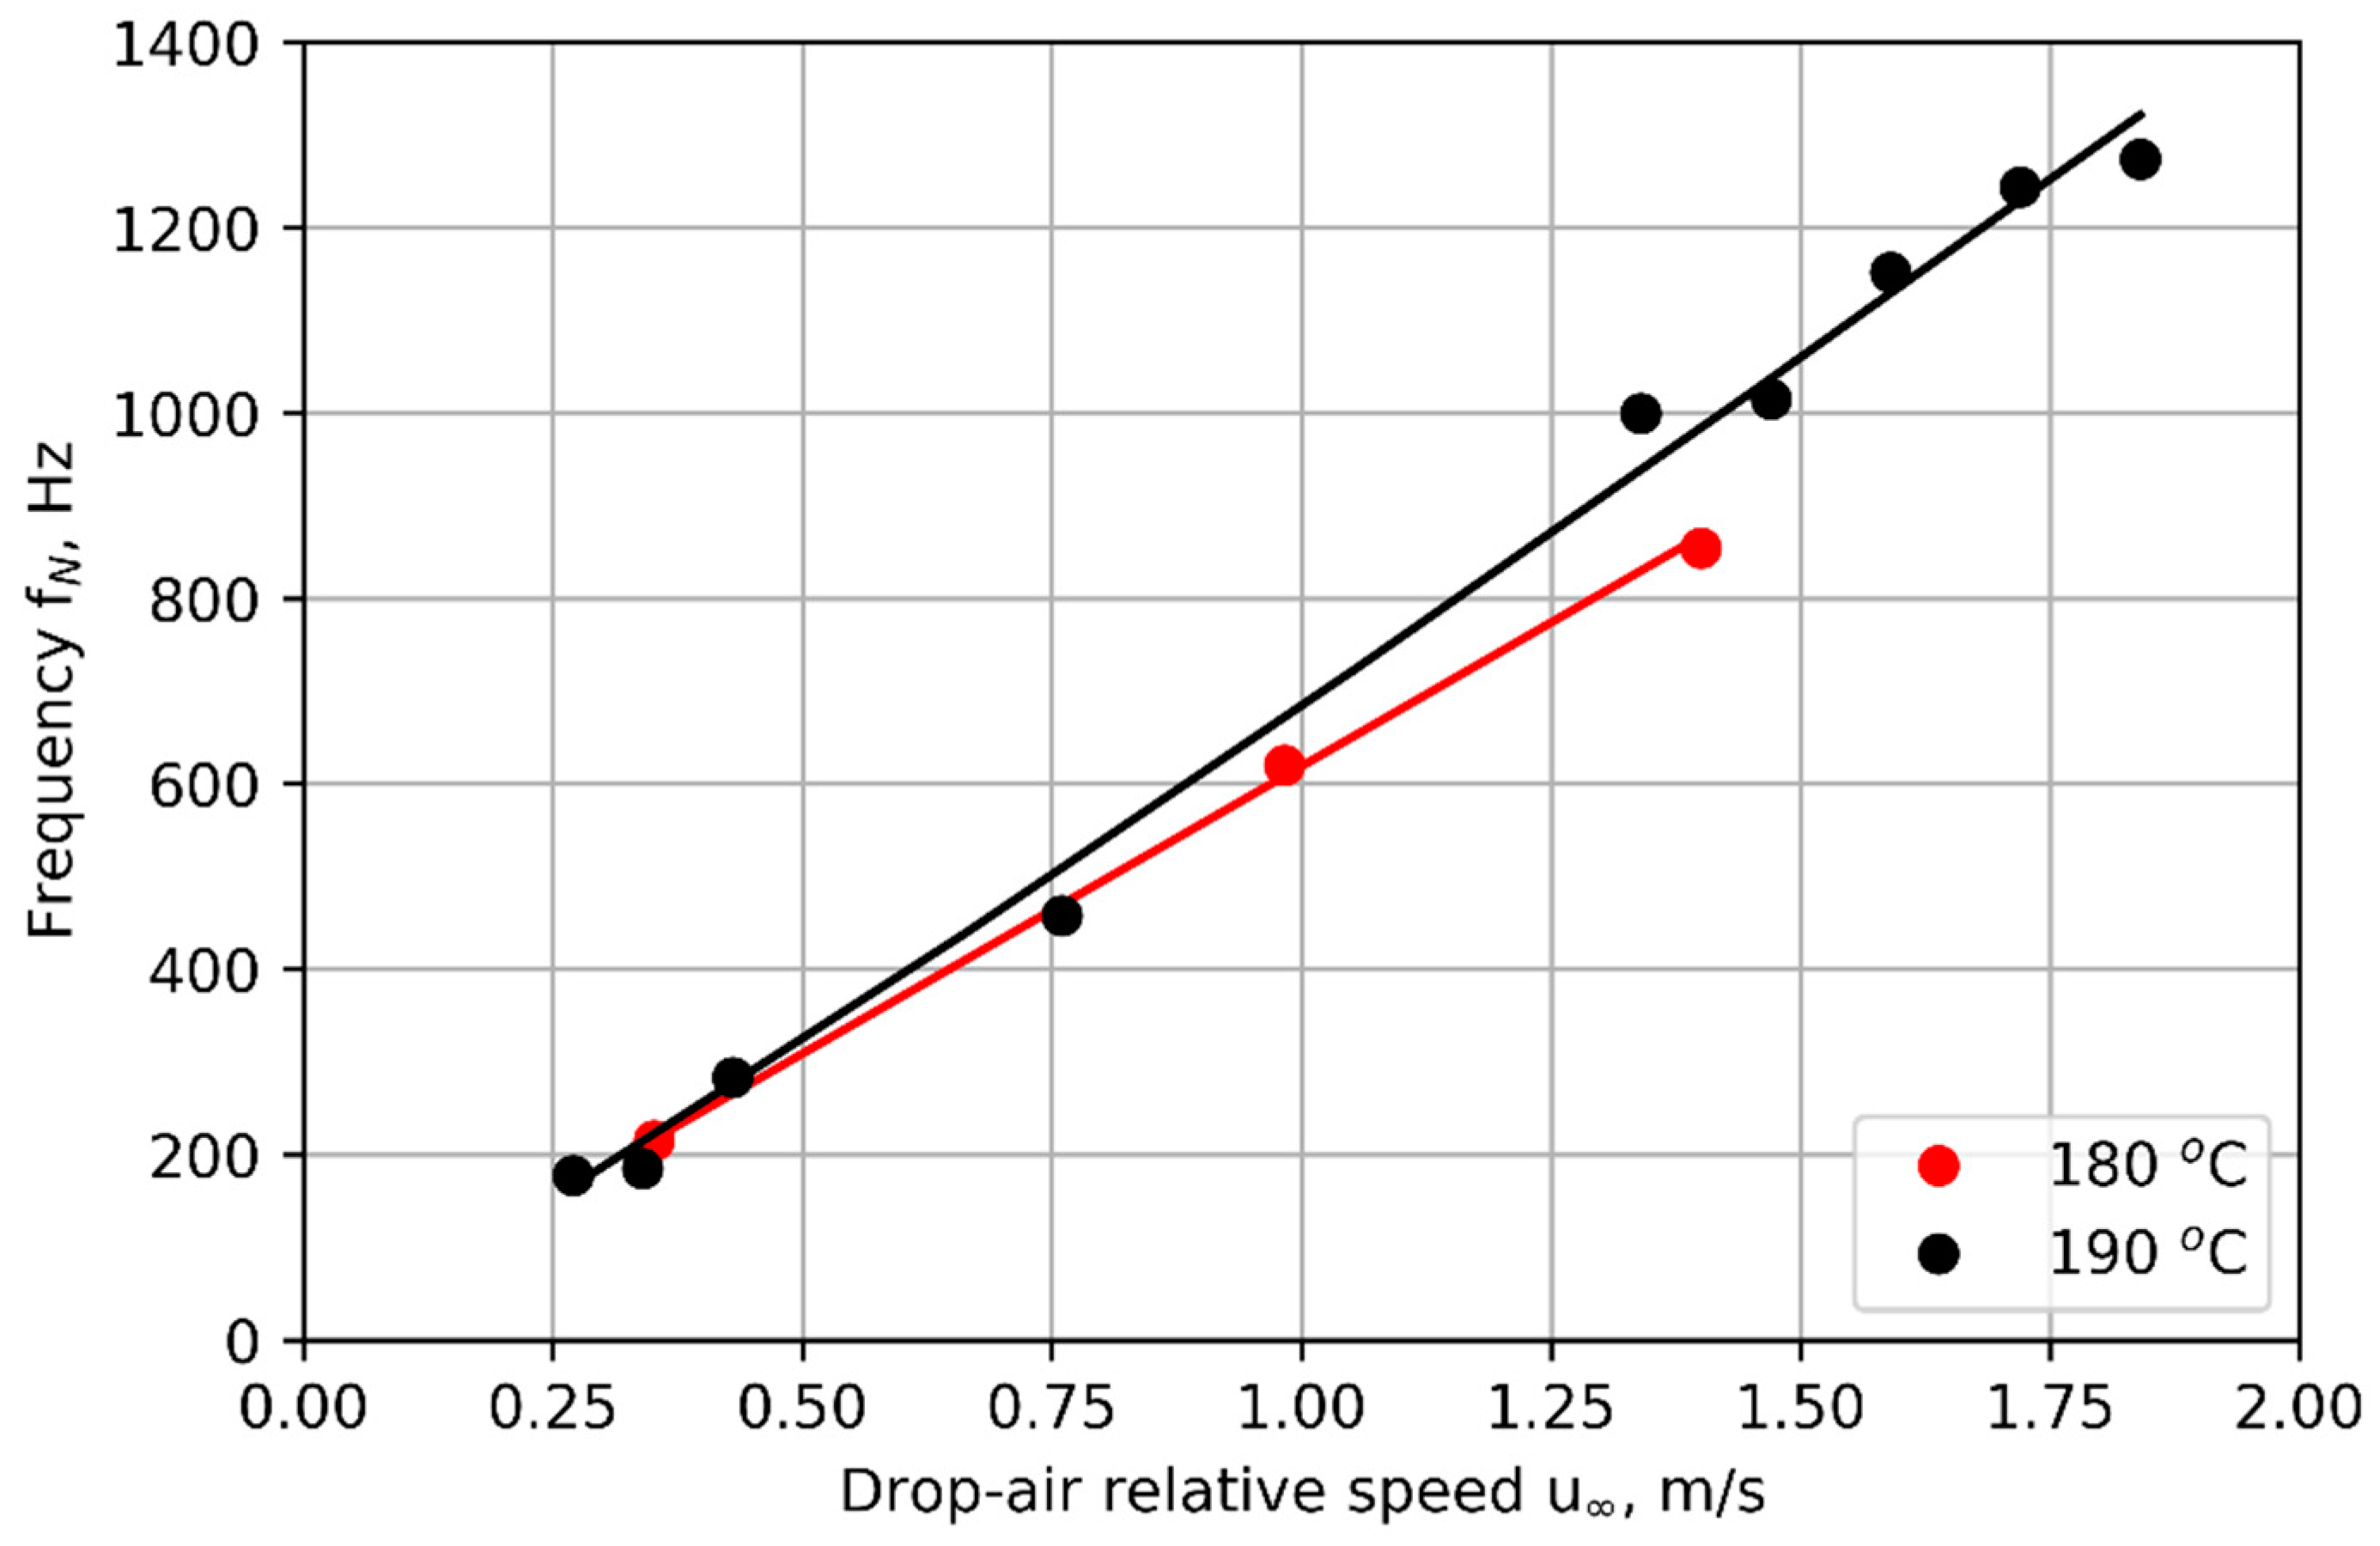
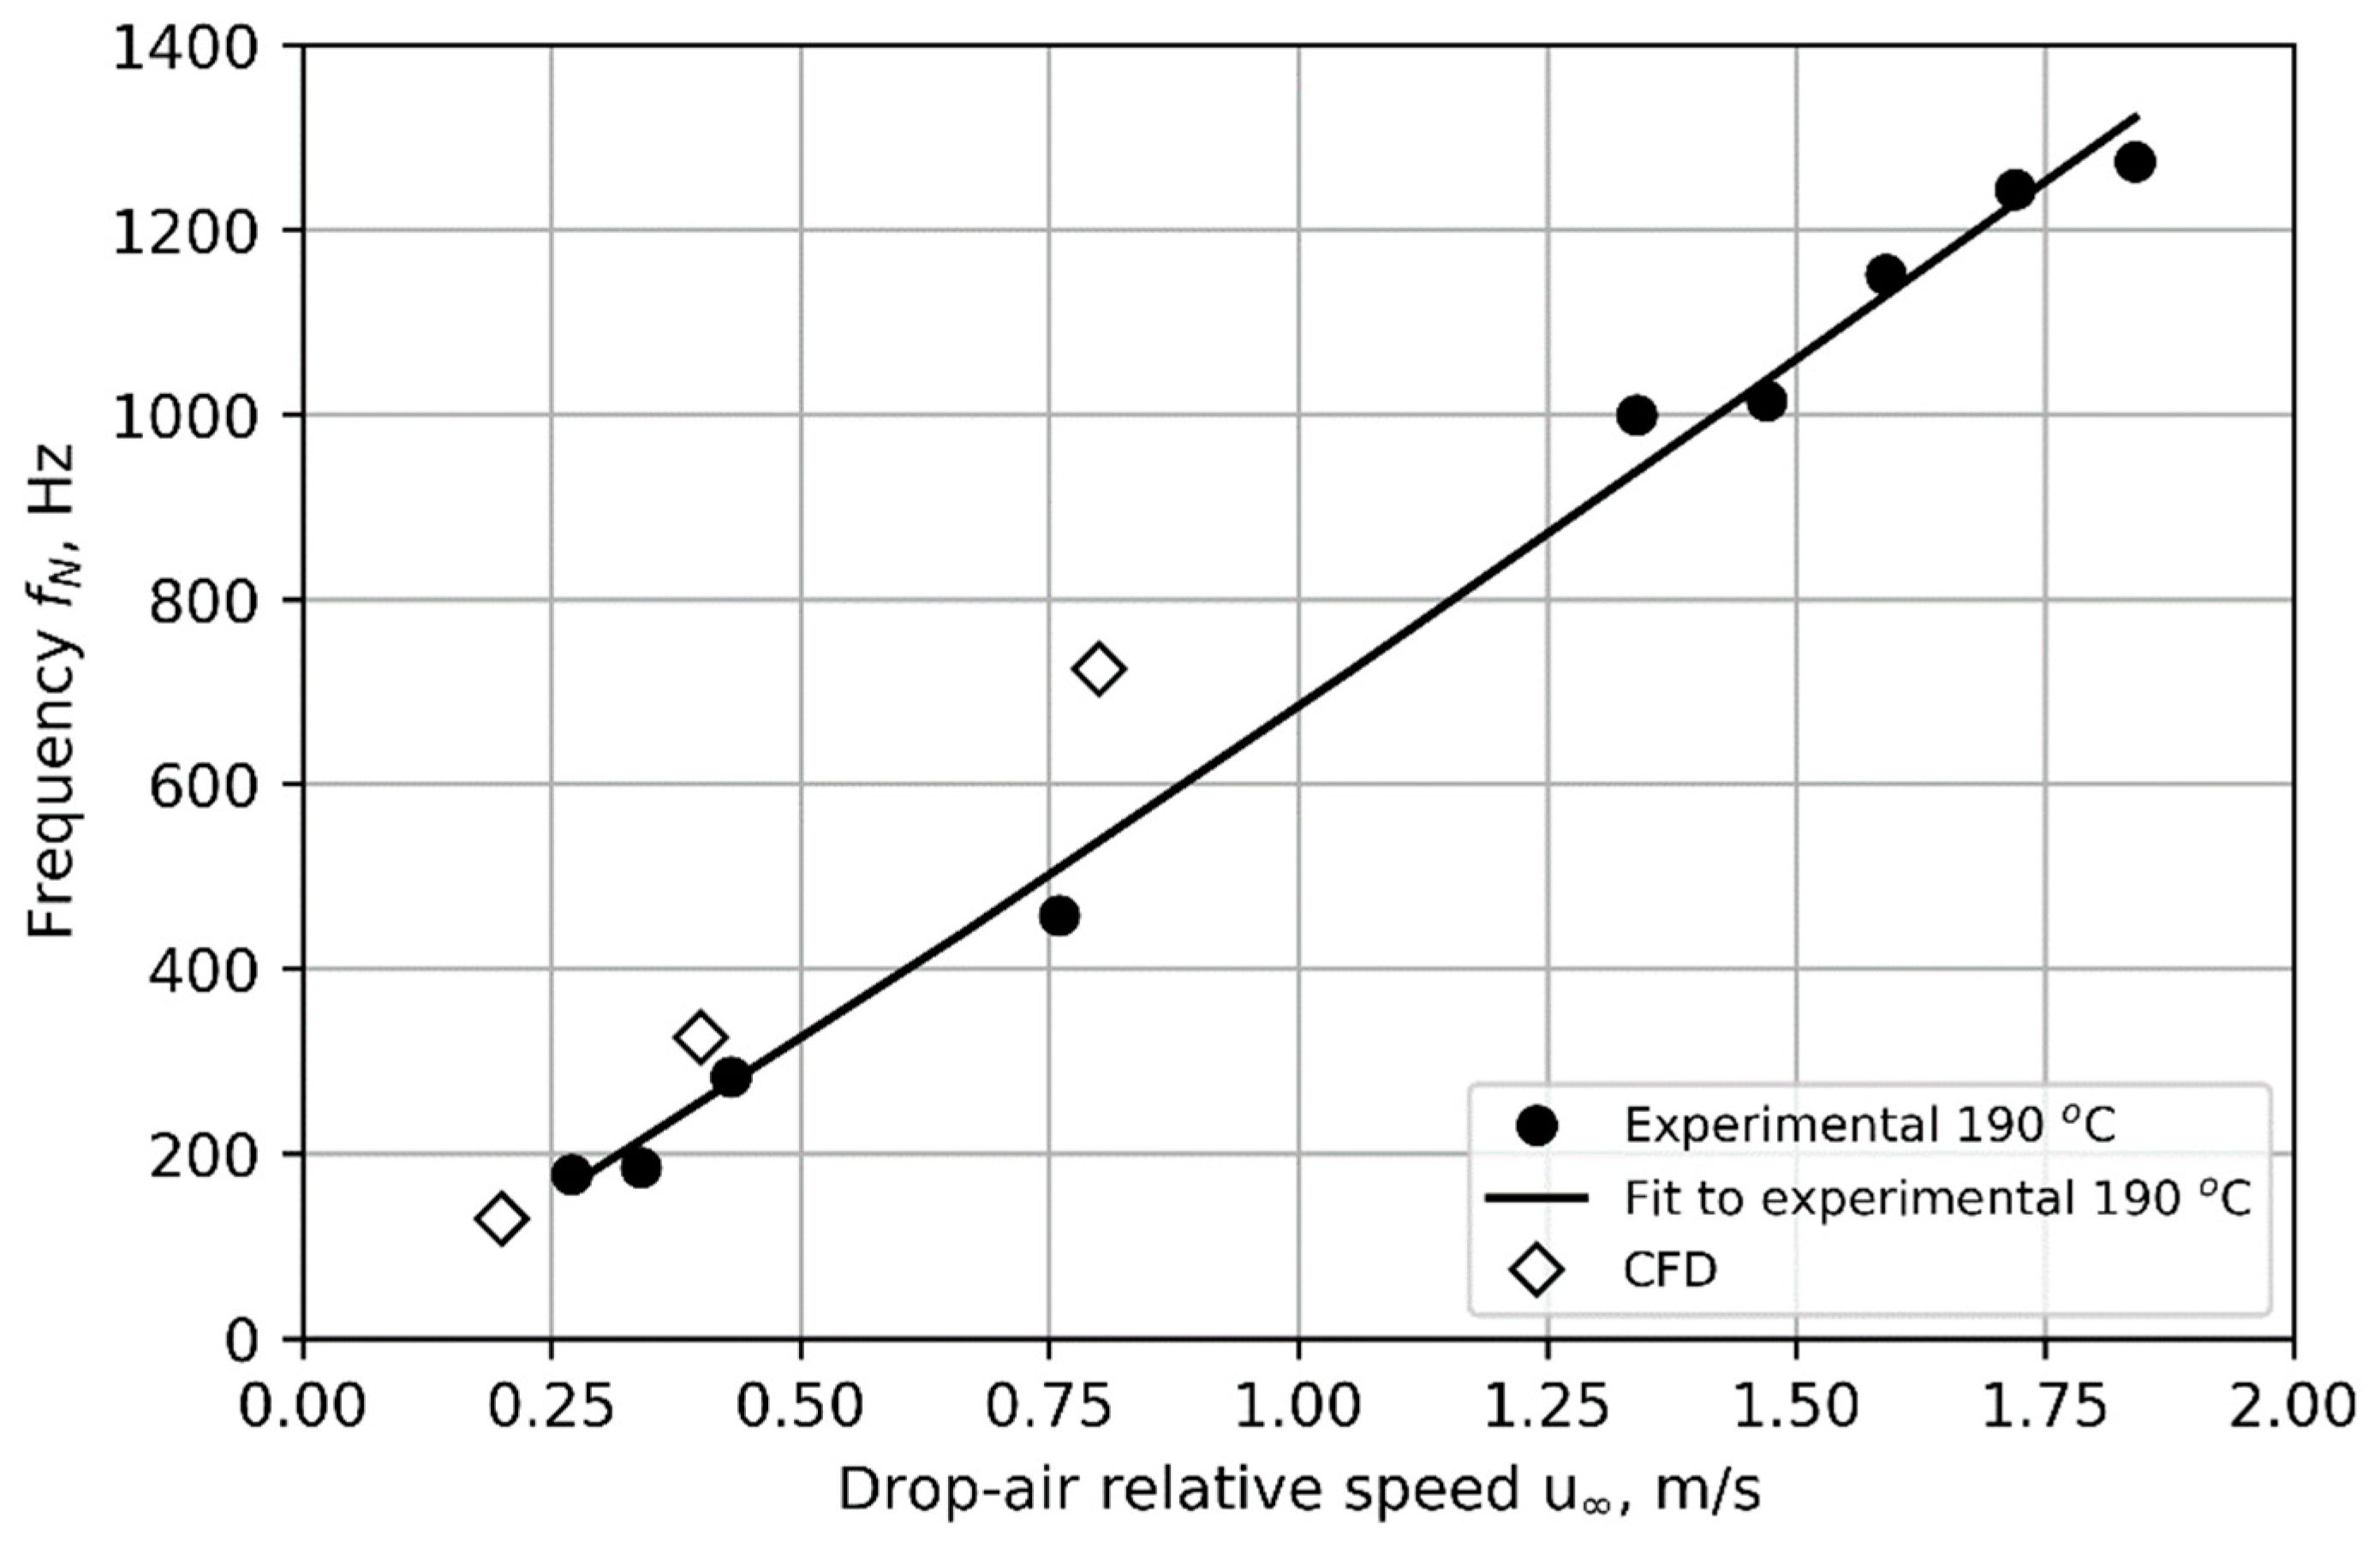
Figure 11 compares the frequency of cyclic nucleation predicted by the CFD model to experimental results with a nozzle core temperature of 190 °C. The trend observed in the experiment of nucleation frequency increasing with drop–air relative velocity u is successfully reproduced by the model. A power law (Equation (20)) fits the CFD predictions well, albeit with coefficients differing from the fit to experimental data (A = 975, B = 1.24 for the CFD with f in Hz and u in m/s).
f N = A u B
The aerosol droplet diameter predicted by the model was approximately 5 µm, which is in reasonable agreement with the photographic observations between 3 µm and 6 µm.

4. Discussion

We observed cyclic nucleation of an aerosol of pure liquids in the air on the windward side of free-falling and suspended parent drops. Nucleation occurs in a layer of vapour-bearing flow at a small stand-off from the droplet surface, with nucleation-free regions on either side. After a time, nucleation ceases. Simultaneously, the region where nucleation forms droplets is convected downstream, and the droplets grow. After some time, nucleation begins in the original location. In this way, spatially stratified and/or temporally cyclic bands of droplet-containing fluid are formed.
The cyclic nucleation phenomenon is relatively stable experimentally for 1,3-propanediol and 1,2-propanediol, less so for glycerol, perhaps due to thermal decomposition at temperatures close to the boiling point. Shape oscillation does not seem to drive the cyclic nucleation, being an order of magnitude lower in frequency. Neither does turbulence, which, in fact, appears to destroy the phenomenon.
Two finite volume numerical models were shown capable of reproducing the cyclic nucleation phenomenon. Both reproduce the trends of nucleation frequency increasing as a power law with air approach velocity. Both models predict the nucleation frequency to be better than the order of magnitude. The CFD model predicts an aerosol droplet size, which is a good match to observations.
Both models have shortcomings, which may explain their imperfect prediction of nucleation frequency. Both models may suffer from imperfect material properties such as diffusion coefficient, vapour pressure, latent heat and surface tension; both use classical nucleation theory (CNT), which is known to underpredict the nucleation rates of alcohols. If the same underprediction holds for propanediol, it is expected to produce smaller numbers of larger droplets than are truly present, as there is more vapour available to condense onto a smaller number of droplets. Low nucleation rates may be partially compensated for by faster growth rates where there is more vapour available.
Both models imperfectly represent the air flow field: the 1D model requires source strengths to be tuned, and the CFD uses a spherical parent drop with a different diameter (2.8 mm diameter sphere compared to 1.53 mm tip radius body-of-rotation, and without the downstream support structure used in the suspended experiments) and lacks the drop shape oscillations and accelerating air flow field seen in the free-falling drop experiments. The CFD mesh is unlikely to be fully converged.
Both models required a threshold on nucleation rate to avoid fractional drop nucleation, and to avoid premature nucleation leading to nonlayered nucleation or decay of cyclicity. However, the threshold value could be varied over a wide range, showing only a moderate impact on nucleation frequency and thickness of layers.
The most important simplification may be that the surface of the parent drop has a uniform temperature, either equal to nozzle temperature (CFD) or lower than this by a factor calculated from heat transfer via a liquid layer of finite thickness (1D model). No one value of liquid layer thickness predicted nucleation frequency perfectly, and this model predicts a drop in frequency at a given air speed, which is not seen in the experimental observations.
Both simulations are inherently two-dimensional with an axis of symmetry in the flow direction. Three-dimensional structures are observed in the boundary layers of deformable spheres such as droplets. Three-dimensional simulations may better predict the nucleation frequency.
More minor simplifications are the single size of the droplet in each computational cell, the assumption that latent heat released is partitioned between liquid and vapour in proportion to their heat capacity, the flow field in the 1D model approximated from an eight-source potential flow solution, the absence of shape oscillation of the parent drop, and the assumption of laminar flow in the boundary layer.
Despite these imperfections, both models reproduce the cyclic nucleation phenomenon, which has a complex cause involving the interaction of several thermo-physical processes. It appears that both models contain the correct physics to reproduce the cyclic nucleation phenomenon, i.e., evaporation, nucleation, condensational growth of nucleated droplets, diffusive and convective heat and mass transfer, and the absence of turbulence. Both models predict the frequency better than an order of magnitude accuracy. Both models predict the power law dependence of frequency on air speed. The CFD model predicts the initial aerosol droplet size with reasonable accuracy.
The phenomenon may be explained with the following hypothesis. As droplets nucleate in a region of supersaturated vapour, cyclic nucleation is initiated in the region where sufficiently strong supersaturation first occurs. The vapour condenses onto the nuclei, which creates a gradient of concentration of the volatile compound(s). Vapour diffuses along this gradient, sequestering the volatile compound and depleting nearby regions. This suppresses supersaturation in these regions and prevents nucleation from occurring. This accounts for the droplet-free regions between bands of nucleated droplets. Convection carries the droplet-bearing region downstream until diffusion can replace the depleted vapour. Nucleation re-commences once supersaturation has increased to a large enough value.
For this segregation of supersaturation and droplet-containing regions to occur, there must be little or no eddy-mediated mixing. As the vapour-phase flow in the falling droplet is not steady, it could be expected that nucleation may fluctuate due to the cyclic appearance of eddies, which may drive the cyclic nature of the nucleation. However, the cyclic nucleation was reproducible in the models presented here, assuming laminar flow, as well as being observed experimentally in the flat plate and suspended hot drop experimental apparatuses, where eddy production was not apparent [5], meaning that cyclic eddy shedding is not likely to be causing the cyclic nucleation phenomenon.
The trends seen in the experiments and simulations of increasing nucleation frequency with increasing temperature and approach velocity are consistent with the hypothesis described above. Increasing velocity increases the convective transport of cool air into the vicinity of the droplet, cooling the adjacent vapour, and increasing the saturation ratio, hence bringing the onset of nucleation earlier and increasing nucleation frequency. Higher droplet temperature increases the rate of diffusion of vapour from the droplet, which replenishes depleted vapour at a faster rate, resulting in a faster onset of nucleation and increased nucleation frequency.
If this hypothesis is correct, for distinct bands to form, the convective timescale must be similar to or longer than the diffusional transport timescale.
The phenomenon requires the following physics:
  • A supply of at least one volatile, nucleating, and condensable component in the vapour phase;
  • A convective velocity or transport rate that exceeds the rate of diffusion. This creates the separation between bands of nucleated droplets;
  • At least one nucleating, condensable component in the vapour phase;
  • Minimal flow turbulence or mixing processes;
  • A supersaturation of the condensable component large enough to allow homogenous nucleation to occur.
We speculate that local supersaturation (or saturation ratio) is the dominant quantity that determines nucleation. It is proposed that the key dimensionless numbers that describe the maximum value of the saturation ratio in the boundary layer are as follows:
(1)
Lewis number, i.e., the ratio of thermal to mass diffusivity, which influences the local temperature and condensable component vapour concentration in the gas phase near the surface of the hot parent drop;
(2)
The Peclet number, here interpreted as the ratio of the convective transport rate of vapour with the airflow to the diffusional transport rate of vapour from the parent drop to the nucleating aerosol, i.e., Equation (21):
L u D    
where L is the distance from the parent drop surface to a band of nucleates aerosol, u is the velocity of the air relative to the parent drop, and D is the diffusion coefficient of the condensable vapour in the air.
(3)
The Reynolds number of flow in the boundary layer, which must be sufficiently low that there is no turbulence.
(4)
The ratio of the vapour pressure of the condensable compound at drop surface temperature to the vapour pressure of the same at ambient temperature.
At the present time, there are insufficient data to experimentally determine the ranges of these dimensionless numbers over which cyclic nucleation may occur.
Under some experimental conditions, cyclic nucleation was observed in some instances, and not in others with nominally identical conditions. It is possible that cyclic nucleation ceases when mixing in the boundary layer (caused by drop shape oscillation, or ambient turbulence) reduces the concentration gradients such that there is no spatial banding of nucleation rate.
A similar, perhaps analogous, phenomenon is the Liesegang ring effect [7,8,26,27,28], where chemical reaction and precipitation take the place of nucleation and condensation. A chemical is removed from the fluid by a reaction with a solid phase product (precipitation). Reagents diffuse to the site of the precipitation, depleting nearby regions and suppressing precipitation in these regions. This causes rings of precipitate to form, with precipitate-free regions between them. An example of these Liesegang patterns is shown in Figure 12 ([26], taken from Liesegang’s original [7]). An explanation of these rings, in terms of supersaturation, was offered by Ostwald [8], quantified by Prager [9] and Zeldovich et al. [10], and later extended by Smith [11]. Alternative explanations have also been offered as reviewed by Stern [29].
The class of processes described by the Turing instability [30] may also be relevant. Turing described processes by which patterns can emerge from homogenous fields if components in that field have unequal diffusion coefficients. Similar processes were described in premixed flames by Zeldovich [31].
At present, the cyclic nucleation phenomenon remains a curiosity. However, a practical application may be the validation of thermo-fluid models which include nucleation, as the phenomenon seems to be sensitive to conditions. If such models successfully predict the frequency of nucleation to high accuracy, confidence in such models may be well founded.

5. Conclusions

Spatially stratified, and/or the temporally cyclic nucleation of aerosol has been observed in free-falling and suspended drops of volatile liquid near its boiling point, surrounded by cooler air. This was previously reported in our conference papers. The modelling presented here is new. For the nucleation to be cyclic, it appears that eddy-dominated mixing must be absent. The nucleation frequency increases with increasing air approach velocity and parent drop temperature. The phenomenon was successfully reproduced in a 1D model using potential flow to generate the airflow field and 2D axis-symmetric CFD. These models predict the nucleation frequency to be better than order-of-magnitude and reproduce the trends with air velocity and parent drop temperature. The CFD predicts aerosol droplet sizes in good agreement with observation. The models contain only convective and diffusive mass and heat transport, the evaporation and condensation of the volatile compound, and homogenous nucleation. We explain the phenomena by considering a layer where supersaturation leads to nucleation of droplets, which grow via condensation of vapour, creating a gradient of concentration of the volatile compound. Vapour diffuses along this gradient, depleting the volatile compound from nearby regions and suppressing supersaturation and thus nucleation there. Convection carries the layer of droplets downstream, supersaturation re-occurs near the original position, and the cycle repeats. It is proposed that the key dimensionless numbers controlling the process are the Lewis number, Peclet number, Reynolds number, and the ratio of the vapour pressure of the condensable compound at drop surface temperature to the vapour pressure of the very same at ambient temperature. Of interest for further work is defining the range of conditions over which the phenomenon can be observed.

Supplementary Materials

The following supporting information can be downloaded at https://www.mdpi.com/article/10.3390/en16227491/s1. The Electronic Supplementary Material is a video of a suspended hot drop of 1,3-propanediol with 4.1 mm base diameter, 190 °C core temperature, and approaching air flow at 0.34 m/s, recorded at 10,000 fps and 99 ms exposure time, with default video playback speed 30 fps.

Author Contributions

Conceptualization, P.S. (Patrick Scheunemann) and M.J.; Methodology, P.S. (Patrick Scheunemann), M.J. and P.S. (Paul Stephenson); Validation, P.S. (Patrick Scheunemann), M.J. and P.S. (Paul Stephenson); Formal analysis, P.S. (Patrick Scheunemann), M.J. and P.S. (Paul Stephenson); Investigation, P.S. (Patrick Scheunemann), M.J. and P.S. (Paul Stephenson); Resources, P.S. (Patrick Scheunemann) and M.J.; Data curation, P.S. (Patrick Scheunemann); Writing—original draft, P.S. (Patrick Scheunemann), M.J. and P.S. (Paul Stephenson); Writing—review & editing, P.S. (Patrick Scheunemann) and M.J.; Supervision, P.S. (Patrick Scheunemann) and M.J.; Funding acquisition, P.S. (Patrick Scheunemann) and M.J. All authors have read and agreed to the published version of the manuscript.

Funding

We are grateful to Körber AG for funding this work.

Data Availability Statement

The data that support the findings of this study are available from the corresponding author upon reasonable request.

Conflicts of Interest

The authors declare no conflict of interest.

References

  1. Kashchiev, D. Nucleation; Butterworth-Heinemann: Oxford, UK, 2000; ISBN 9780750646826. [Google Scholar]
  2. Rogers, R.R.; Yau, M.K. A Short Course in Cloud Physics; Butterworth-Heinemann: Oxford, UK, 1996; ISBN 9780750632157. [Google Scholar]
  3. Mikheev, V.B.; Brinkman, M.C.; Courtney, B.S.; Granville, A.; Gordon, S.M.; Clark, P.I. Real-Time Measurement of Electronic Cigarette Aerosol Size Distribution and Metals Content Analysis. Nicotine Tob. Res. 2016, 18, 1895–1902. [Google Scholar] [CrossRef] [PubMed]
  4. Rebelo, N.; Zhao, H.; Nadal, F.; Garner, C.; Williams, A. Evaporation of liquid nitrogen droplets in superheated immiscible liquids. Int. J. Heat Mass Transf. 2019, 143, 118575. [Google Scholar] [CrossRef]
  5. Scheunemann, P.; Schadow, D.; Stephenson, P.; Jermy, M. Aerosol Generation by Condensation in Laminar Boundary Layers for Inhalers, Paper 42. In Proceedings of the 22nd Australasian Fluid Mechanics Conference, Brisbane, Australia, 6–10 December 2020. [Google Scholar]
  6. Scheunemann, P.; Stephenson, P.; Jermy, M. Cyclic formation of droplets by nucleation in condensing vapour: Observations and modelling of frequency of occurrence and suppression of nucleation, Paper 408. In Proceedings of the 23rd Australasian Fluid Mechanics Conference, Sydney, Australia, 4–8 December 2022. [Google Scholar]
  7. Liesegang, R.E. A-Linien. Liesegang’s Photograph Archiv 37 Nr. 801. 1896, pp. 321–326. Available online: https://www.uni-kiel.de/anorg/lagaly/group/klausSchiver/liesegangliterature-1.pdf (accessed on 1 September 2023).
  8. Ostwald, W. Liesegang-Ringe. In Lehrbuch der Allgemeinen Chemie. 2. Auflage; Engelmann-Verlag: Leipzig, Germany, 1897; p. 768. [Google Scholar]
  9. Prager, S. Periodic Precipitation. J. Chem. Phys. 1956, 25, 279–283. [Google Scholar] [CrossRef]
  10. Zeldovitch, Y.B.; Barenblatt, G.I.; Salganik, R.L. The quasi-periodical formation of precipitates occurring when two substances diffuse into each other (Liesegang’s rings). Sov. Phys. Dokl. 1962, 6, 869. [Google Scholar]
  11. Smith, D. On Ostwald’s supersaturation theory of rhythmic precipitation (Liesegang’s rings). J. Chem. Phys. 1984, 81, 3102–3115. [Google Scholar] [CrossRef]
  12. Vehkamäki, H. Classical Nucleation Theory in Multicomponent Systems; Springer: Berlin, Germany, 2010. [Google Scholar] [CrossRef]
  13. Aasen, A.; Reguera, D.; Wilhelmsen, Ø. Curvature Corrections Remove the Inconsistencies of Binary Classical Nucleation Theory. Phys. Rev. Lett. 2020, 124, 045701. [Google Scholar] [CrossRef] [PubMed]
  14. Fisenko, S.P.; Rostami, A.A.; Kane, D.B.; Pithawalla, Y.B.; Maximoff, S.N.; Li, W.; El-Shall, M.S. Model of aerosol evolution in high supersaturated glycerol-air vapor mixtures. Aerosol Sci. Technol. 2021, 55, 871–885. [Google Scholar] [CrossRef]
  15. Kane, D.; El-Shall, M.S. Condensation of supersaturated vapors of hydrogen bonding molecules: Ethylene glycol, propylene glycol, trimethylene glycol, and glycerol. J. Chem. Phys. 1996, 105, 7617–7631. [Google Scholar] [CrossRef]
  16. Zeldovich, Y.B. On the theory of new phase formation: Cavitation. Acta Physicochem. USSR 1943, 18, 1. [Google Scholar]
  17. Fuchs, N.A. Evaporation and Droplet Growth in Gaseous Media; Pergamon Press: Oxford, UK, 1959. [Google Scholar]
  18. Maxwell, J.C. The Scientific Papers of James Clerk Maxwell; Dover Books: New York, NY, USA, 1890; Volume 2. [Google Scholar]
  19. Sparrow, E.M.; Gregg, J.L. The Variable Fluid-Property Problem in Free Convection. Trans. ASME 1958, 80, 879–886. [Google Scholar] [CrossRef]
  20. Fuller, E.N.; Schettler, P.D.; Giddings, J.C. A new method for prediction of binary gas-phase diffusion coefficients. Ind. Eng. Chem. 1966, 58, 18–27. [Google Scholar] [CrossRef]
  21. Tang, M.J.; Shiraiwa, M.; Pöschl, U.; Cox, R.A.; Kalberer, M. Compilation and evaluation of gas phase diffusion coefficients of reactive trace gases in the atmosphere: Volume 2. Diffusivities of organic compounds, pressure-normalised mean free paths, and average Knudsen numbers for gas uptake calculations. Atmos. Chem. Phys. 2015, 15, 5585–5598. [Google Scholar] [CrossRef]
  22. Wassiljewa, A. Warmeleitung in gasgemischen. Physik. Z. 1904, 5, 737. [Google Scholar]
  23. Mason, E.A.; Saxena, S.C. Approximate Formula for the Thermal Conductivity of Gas Mixtures. Phys. Fluids 1958, 1, 361. [Google Scholar] [CrossRef]
  24. VDI-Gesellschaft Verfahrenstechnik und Chemieingenieurwesen (VDI-GVC). VDI Heat Atlas, 2nd ed.; Springer: Düsseldorf, Germany, 2010. [Google Scholar]
  25. Peng, Y.; Mahyari, H.M.; Moshfegh, A.; Javadzadegan, A.; Toghraie, D.; Shams, M.; Rostami, S. A transient heat and mass transfer CFD simulation for proton exchange membrane fuel cells (PEMFC) with a dead-ended anode channel. Int. Commun. Heat Mass Transf. 2020, 115, 104638. [Google Scholar] [CrossRef]
  26. Beneke, K. Liesegang Named in Literature. 2006. Available online: http://www.uni-kiel.de/anorg/lagaly/group/klausSchiver/liesegangliterature-1.pdf (accessed on 1 August 2022).
  27. Ostwald, W. Besprechung der Arbeit von Liesegangs A-Linien. Z. Physikal. Chem. 1897, 23, 365. [Google Scholar]
  28. Pechenkin, A. Liesegang Rings and the Other Periodic Phenomena. In The History of Research on Chemical Cyclic Processes; SpringerBriefs in History of Science and Technology; Springer: Berlin/Heidelberg, Germany, 2018. [Google Scholar] [CrossRef]
  29. Stern, K.H. The Liesegang Phenomenon. Chem. Revs. 1954, 54, 79–99. [Google Scholar] [CrossRef]
  30. Turing, A.M. The chemical basis of morphogenesis. Phil. Trans. R. Soc. Lond. 1952, 237, 37–72. [Google Scholar]
  31. Zeldovich, Y.B. Theory of Combustion and Detonation of Gases (1944). In Selected Works of Yakov Borisovich Zeldovich, Volume I: Chemical Physics and Hydrodynamics; Barenblatt, G.I., Sunyaev, R.A., Eds.; Princeton University Press: Princeton, NJ, USA, 2014; pp. 162–232. [Google Scholar]
Figure 1. A sequence of images of cyclic nucleation around a 2.9 mm diameter parent drop of mass fraction 32% glycerol, 67.8% 1,2-propanediol, and 0.2% water at a fall velocity of 0.48 m/s (Reynolds number = 92) and a nominal temperature of 180 °C.
Energies 16 07491 g001
Figure 2. A photograph of a 3.8 mm diameter falling hot drop with cyclic nucleation: 1,3-propanediol of initial temperature 190 °C falling at 0.92 m/s in cold air (20 °C), (Reynolds number = 230).
Energies 16 07491 g002
Figure 3. A free-falling parent drop with nominally the same conditions as Figure 2, but where nucleation is not cyclic.
Energies 16 07491 g003
Figure 4. Suspended drop apparatus (no drop present, copper finger exposed).
Energies 16 07491 g004
Figure 5. Photo of a suspended drop of 1,3-propanediol at 190 °C core temperature in 0.4 m/s upflow of cold air (20 °C) (Re = 110) with the design of the copper nozzle and finger superimposed. White cross-hatched areas are solid copper. Unhatched areas enclosed by white lines are internal passages or surface grooves. The aperture through which the liquid was extruded is shown. The core of the nozzle is maintained at a set temperature. The copper finger is covered with the volatile liquid.
Energies 16 07491 g005
Figure 6. Detail of Figure 5 showing the bands of aerosol. The diameters of droplets in the aerosol are 3 to 6 µm in the layer closest to surface and ≤3 µm farther away.
Energies 16 07491 g006
Figure 7. Measured nucleation frequencies for suspended drops of 1,3-propanediol at 180 and 190 °C. Air temperature was 21 °C when the nozzle temperature was 180 °C; 19 °C for 190 °C.
Energies 16 07491 g007
Figure 8. The 1D mesh used for the simple model. The parent drop is on the left with the air approaching from the right.
Energies 16 07491 g008
Figure 9. Nucleation frequencies observed in the suspended drop experiment, and predicted with the simple 1D model, as a function of drop–air relative speed u and liquid layer thickness δ L L for suspended drops of 1,3-propanediol of 4.1 mm base diameter and 1.53 mm drop tip radius with a nozzle core temperature of 190 °C.
Energies 16 07491 g009
Figure 10. Plots of droplet number density (log scale) at various times from a parent drop with surface temperature of 180 °C. Droplet-air relative velocities: (a) 0.2 m/s, (b) 0.4 m/s, and (c) 0.8 m/s.
Energies 16 07491 g010
Figure 11. Experimental measurements (nozzle core temperature 190 °C) compared to CFD predictions of nucleation frequency (CFD uses a drop surface temperature of 180 °C and a 2.8 mm diameter spherical parent drop).
Energies 16 07491 g011
Figure 12. Rings of silver chromate, precipitated from silver nitrate and potassium chromate in a gelatine film due to the Liesegang effect (reproduced from Beneke, 2006 [26], in turn from Liesegang, 1896 [7]).
Energies 16 07491 g012
Table 1. Sinks/sources used for approximation of the suspended droplet contour (including first 10 mm of nozzle length) for a reference velocity of u = 1.0000 m/s.
i1234
x i (mm)−1.1739−2.1227−4.3010−4.4209
Q i (10−6 m3/s)19.1667−10.572269.1200−66.6698
i5678
x i (mm)−12.1280−12.1661−13.9355−13.9812
Q i (10−6 m3/s)118.491092.0914−98.1021−47.8398
Disclaimer/Publisher’s Note: The statements, opinions and data contained in all publications are solely those of the individual author(s) and contributor(s) and not of MDPI and/or the editor(s). MDPI and/or the editor(s) disclaim responsibility for any injury to people or property resulting from any ideas, methods, instructions or products referred to in the content.

