

Examining Real-Road Fuel Consumption Performance of Hydrogen-Fueled Series Hybrid Vehicles


Abstract
1. Introduction
2. Materials and Methods
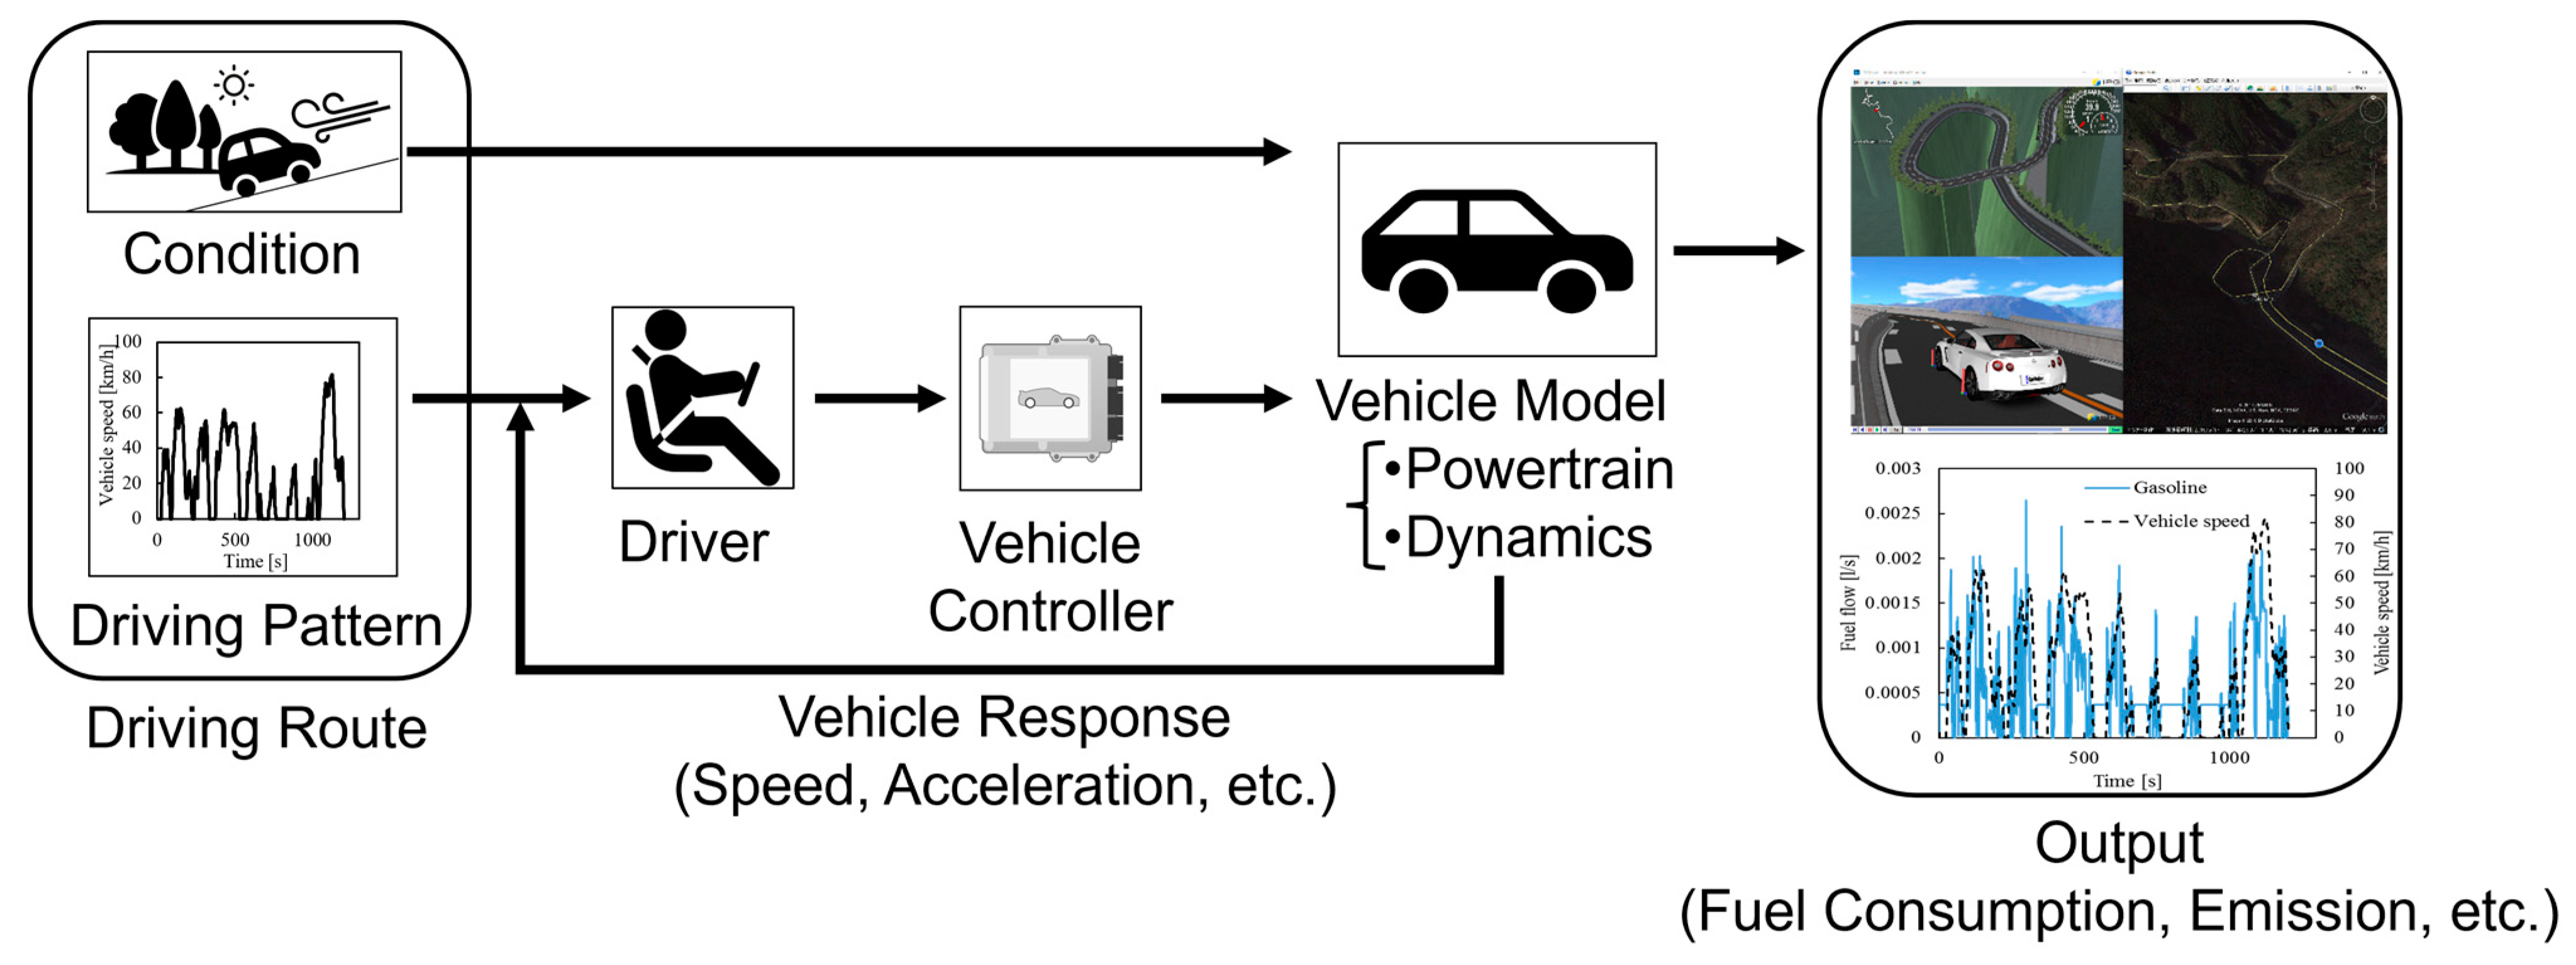
2.1. Analysis Method
2.2. Analysis of Vehicle Models
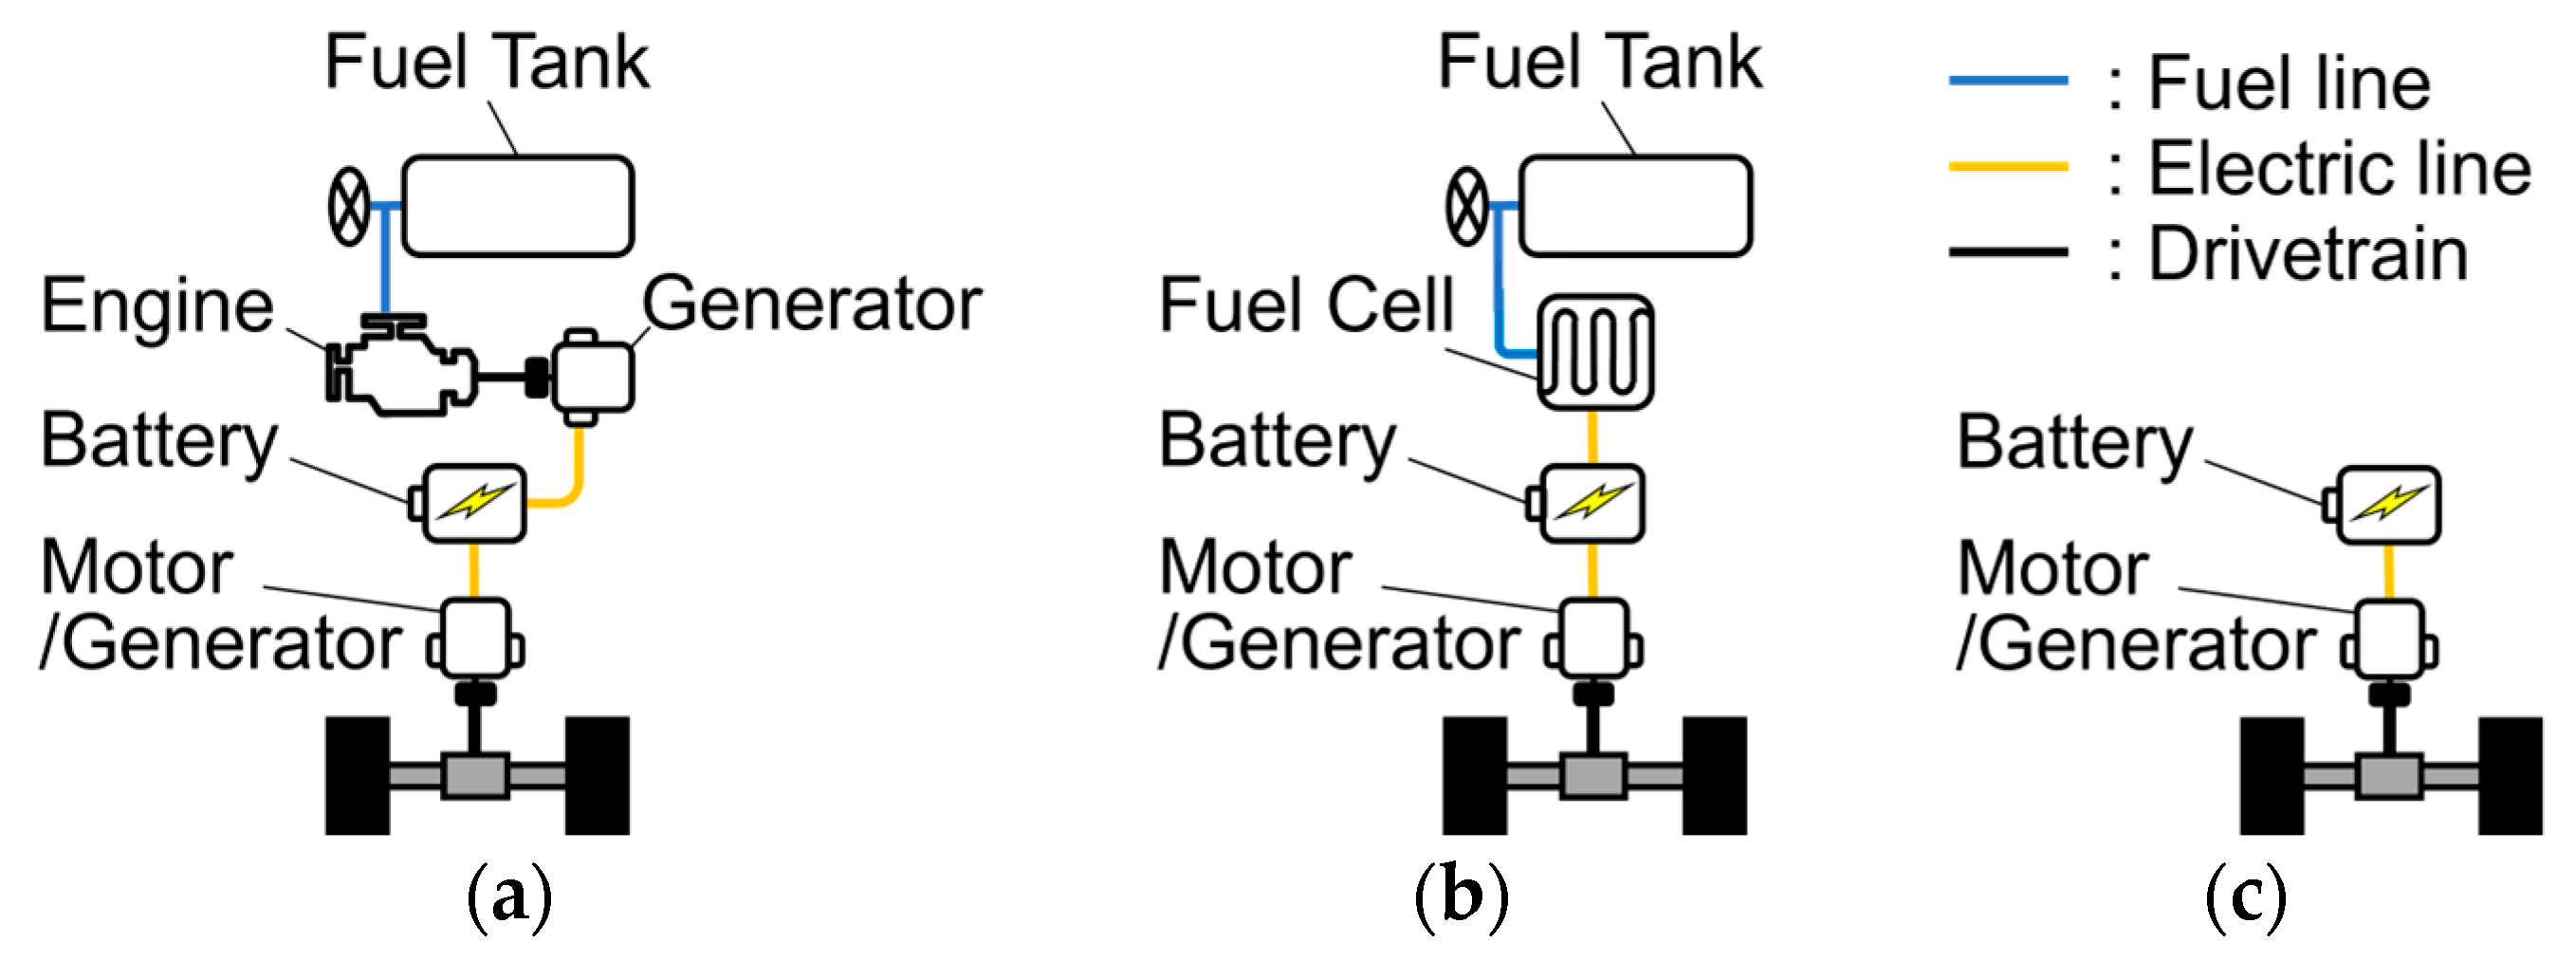
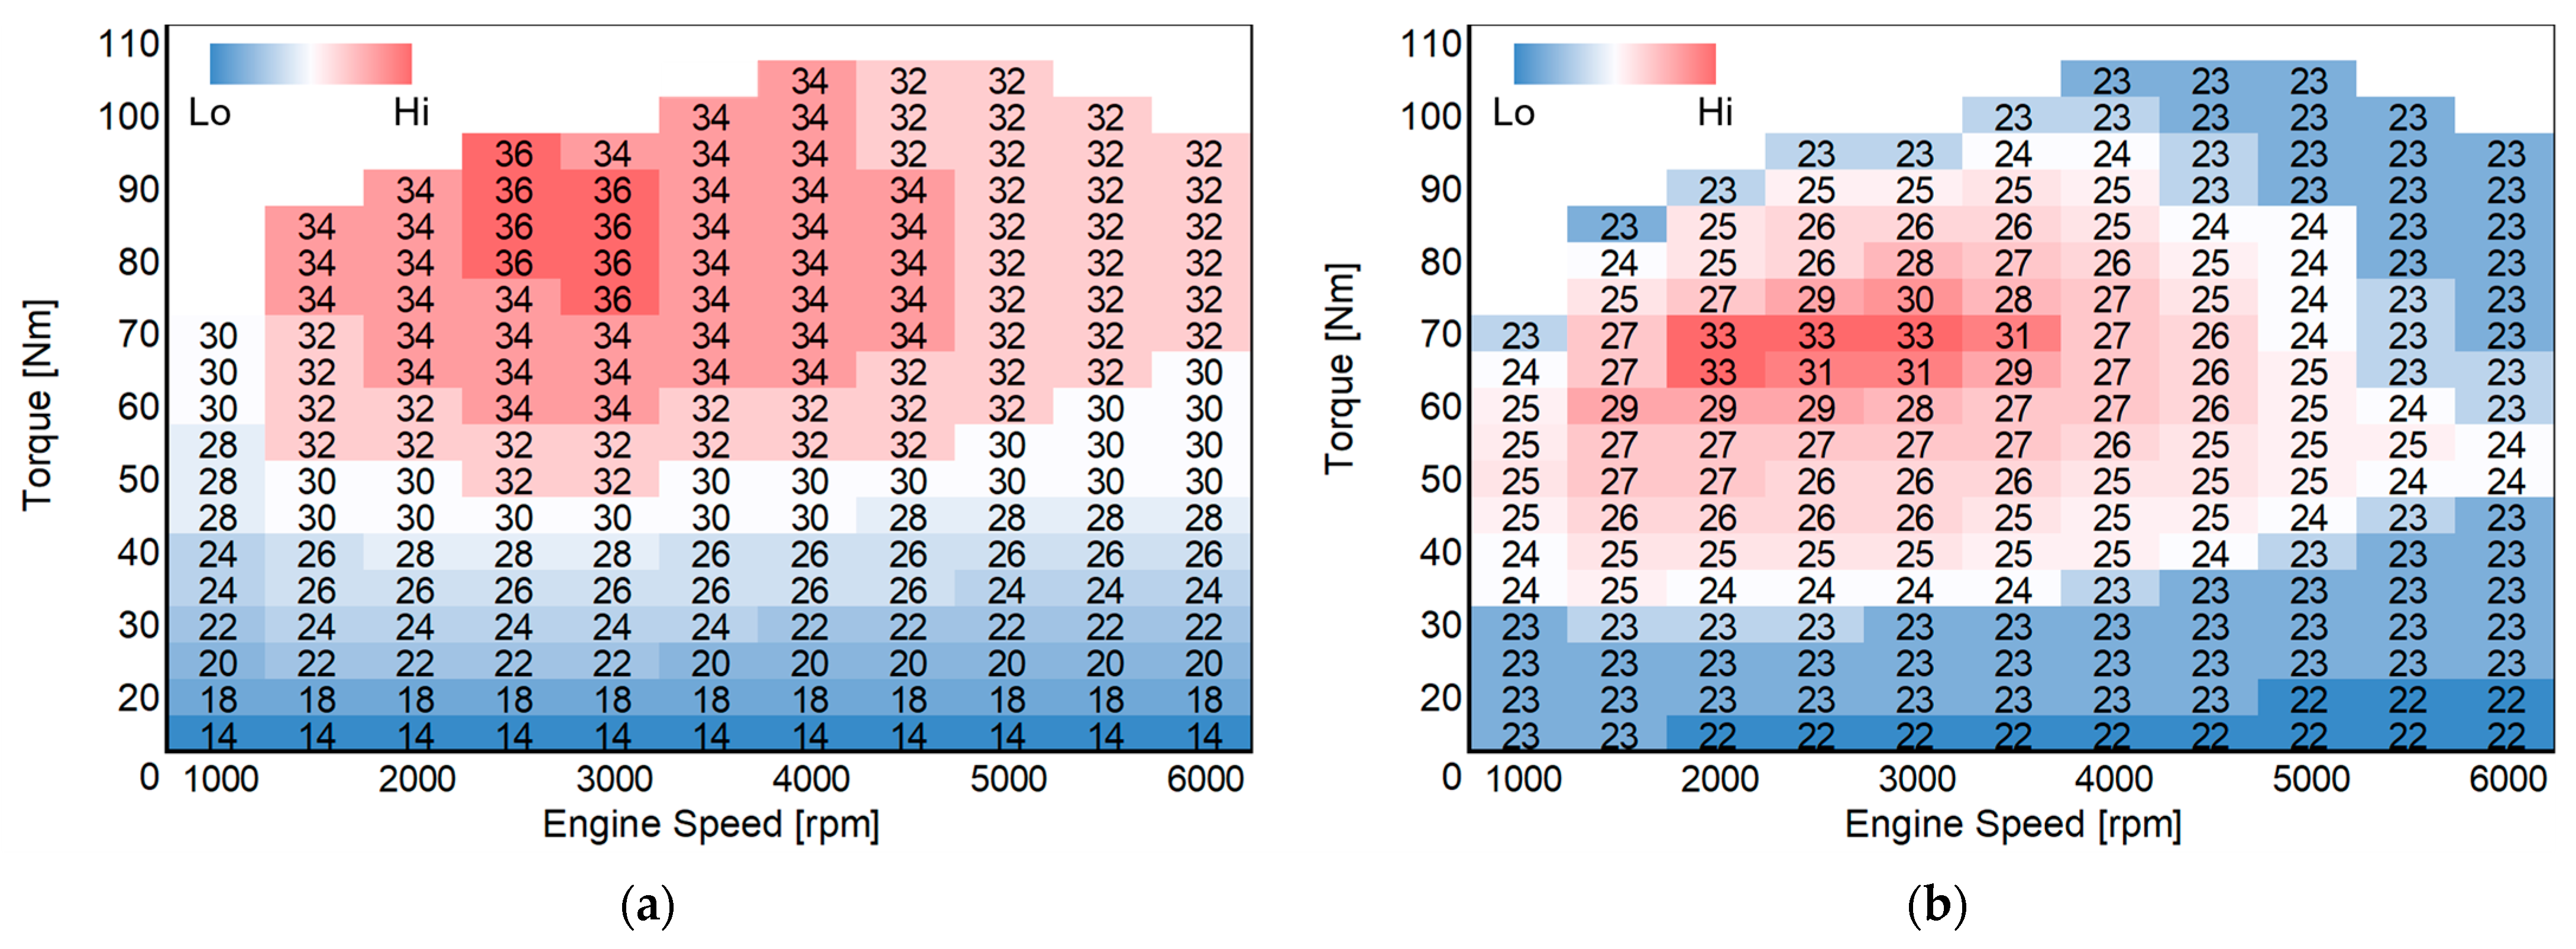
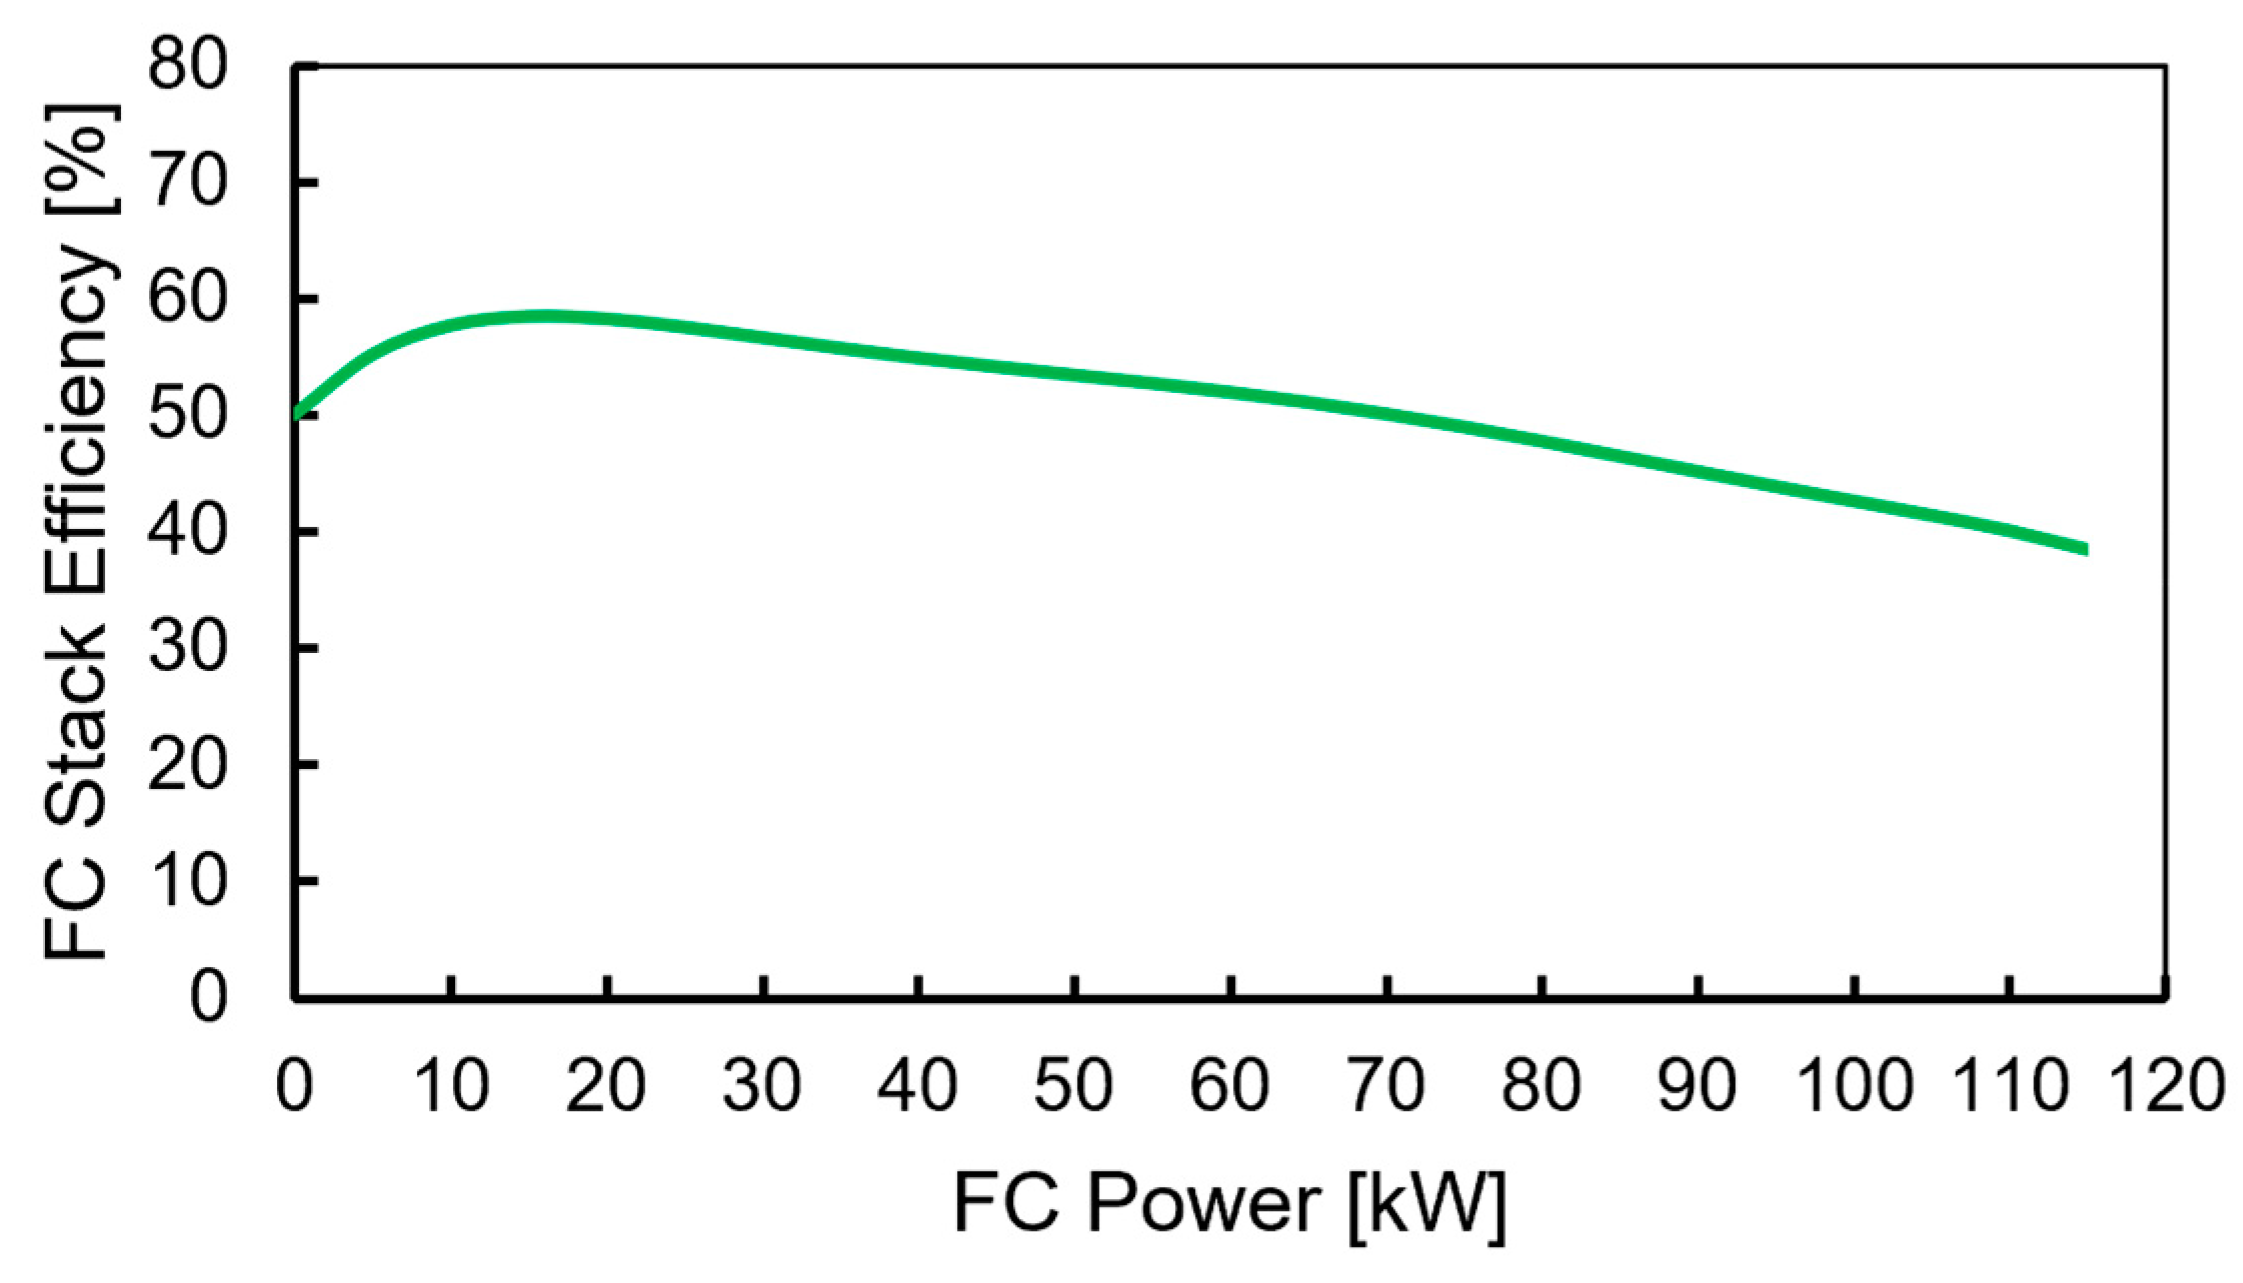
2.2.1. Powertrains
2.2.2. Comparison of Vehicle Specifications
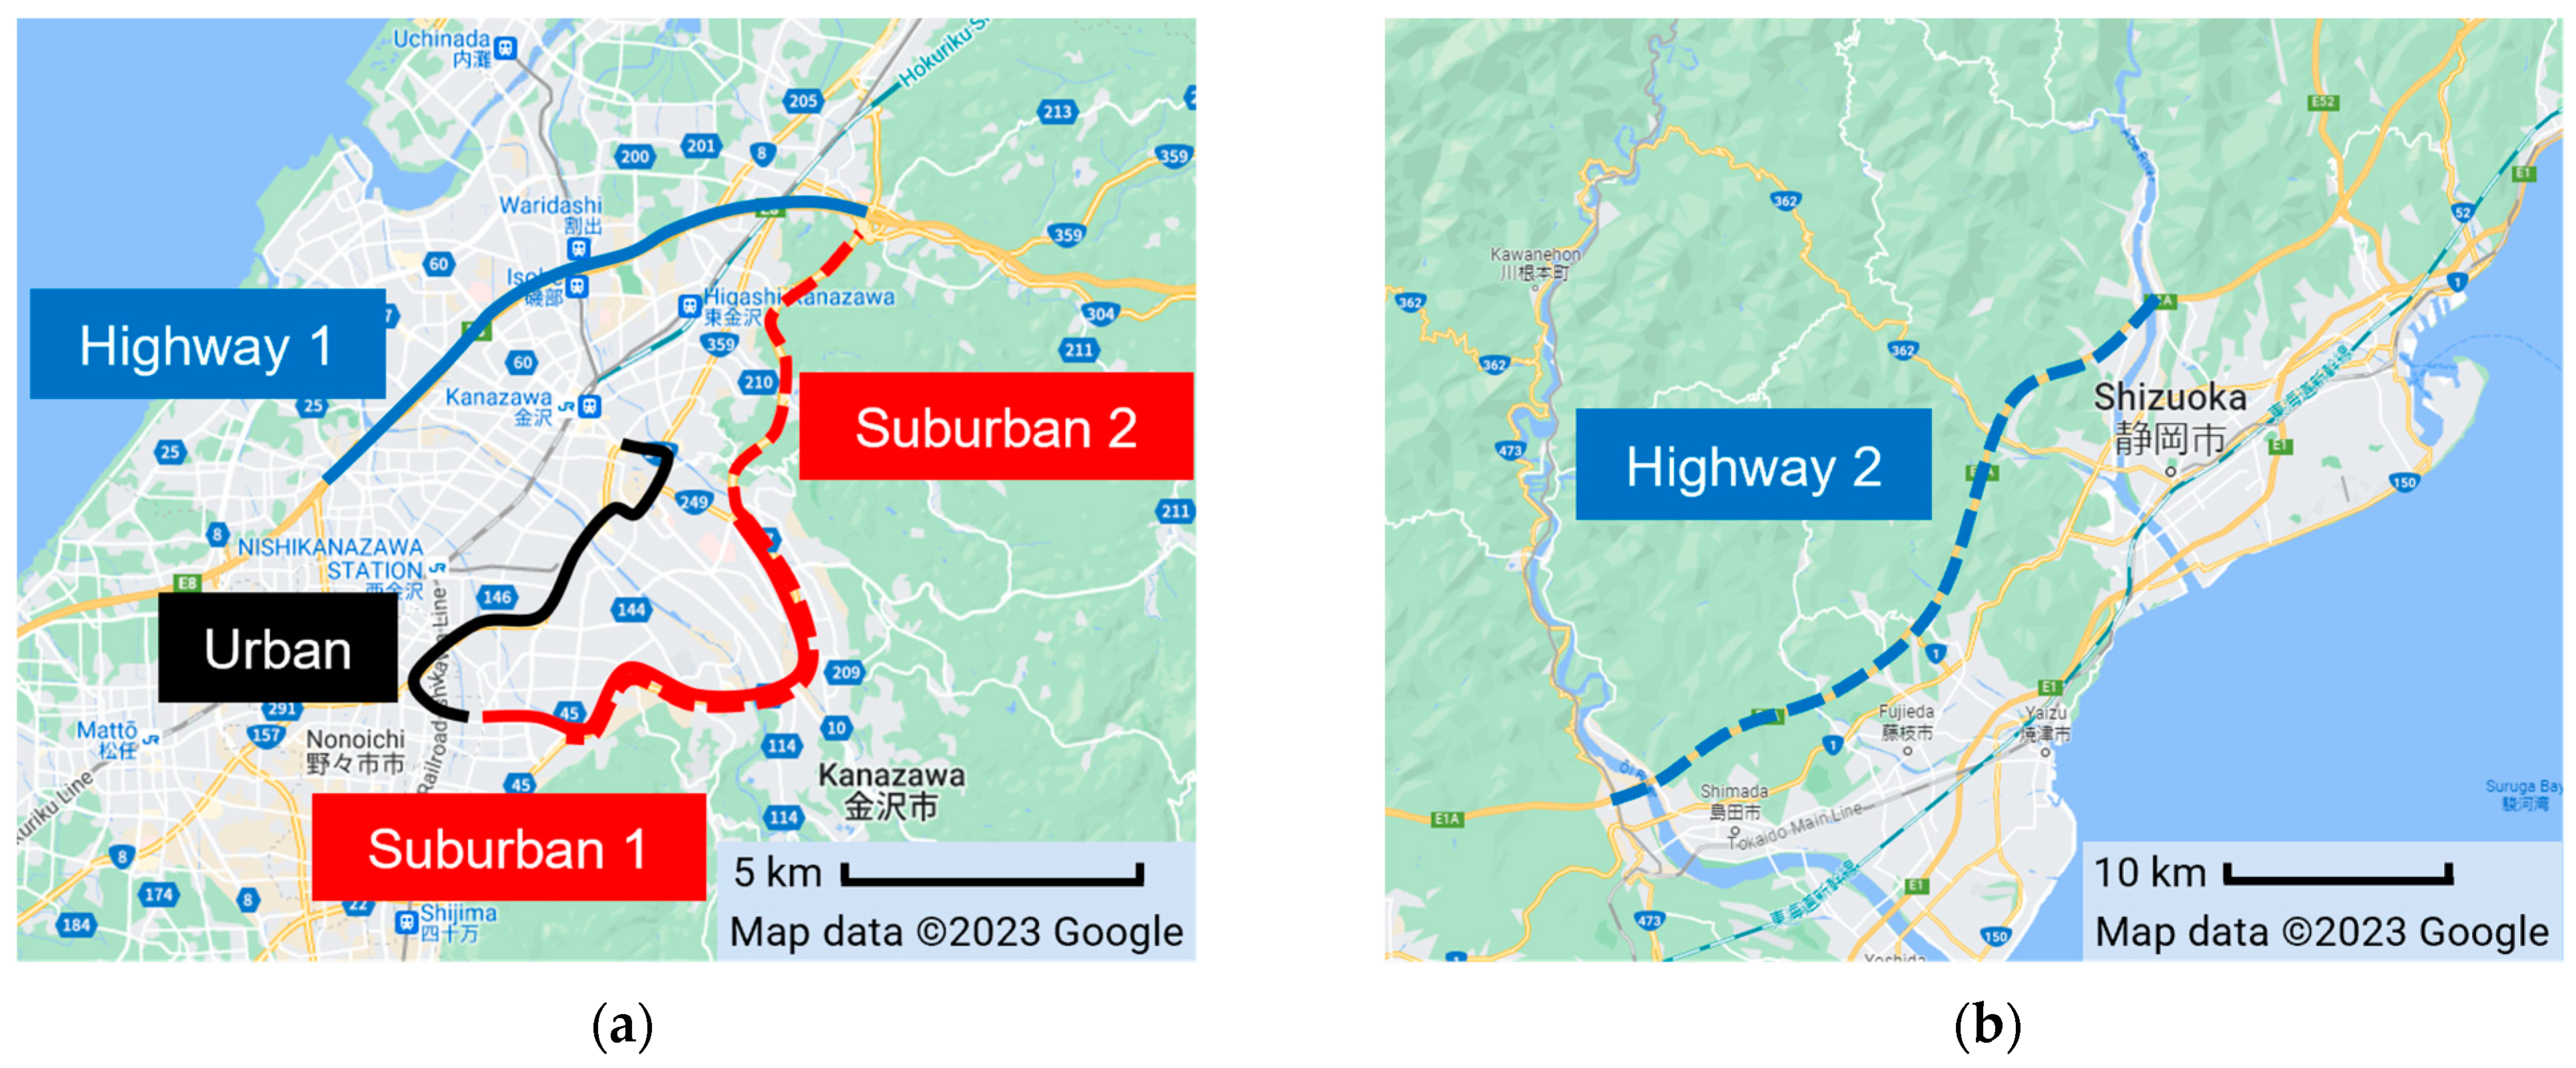
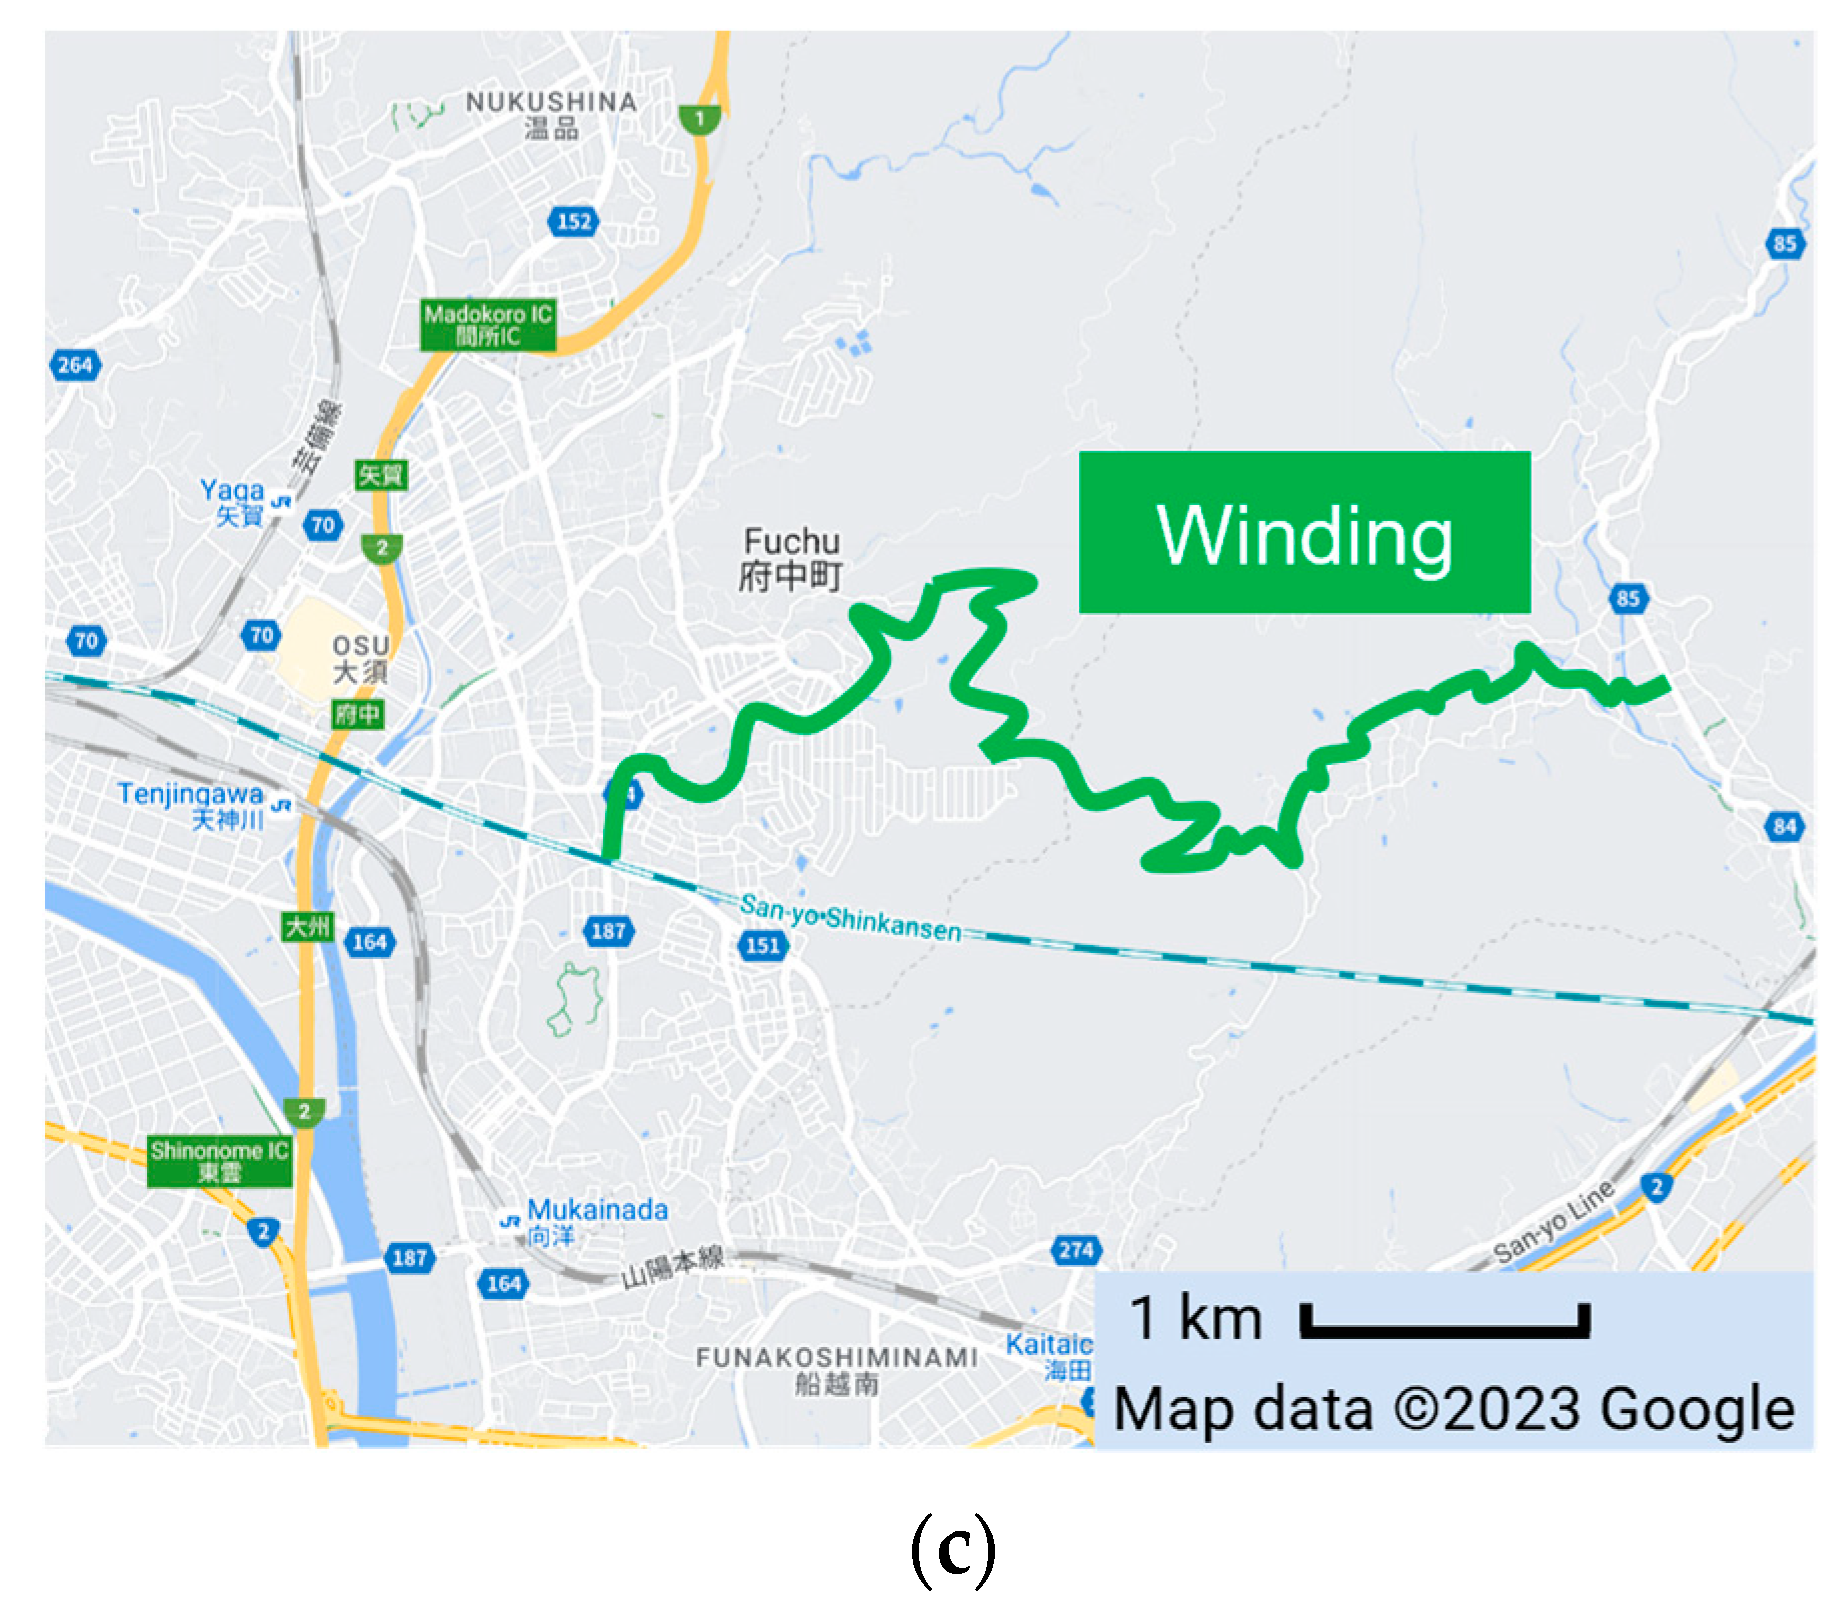
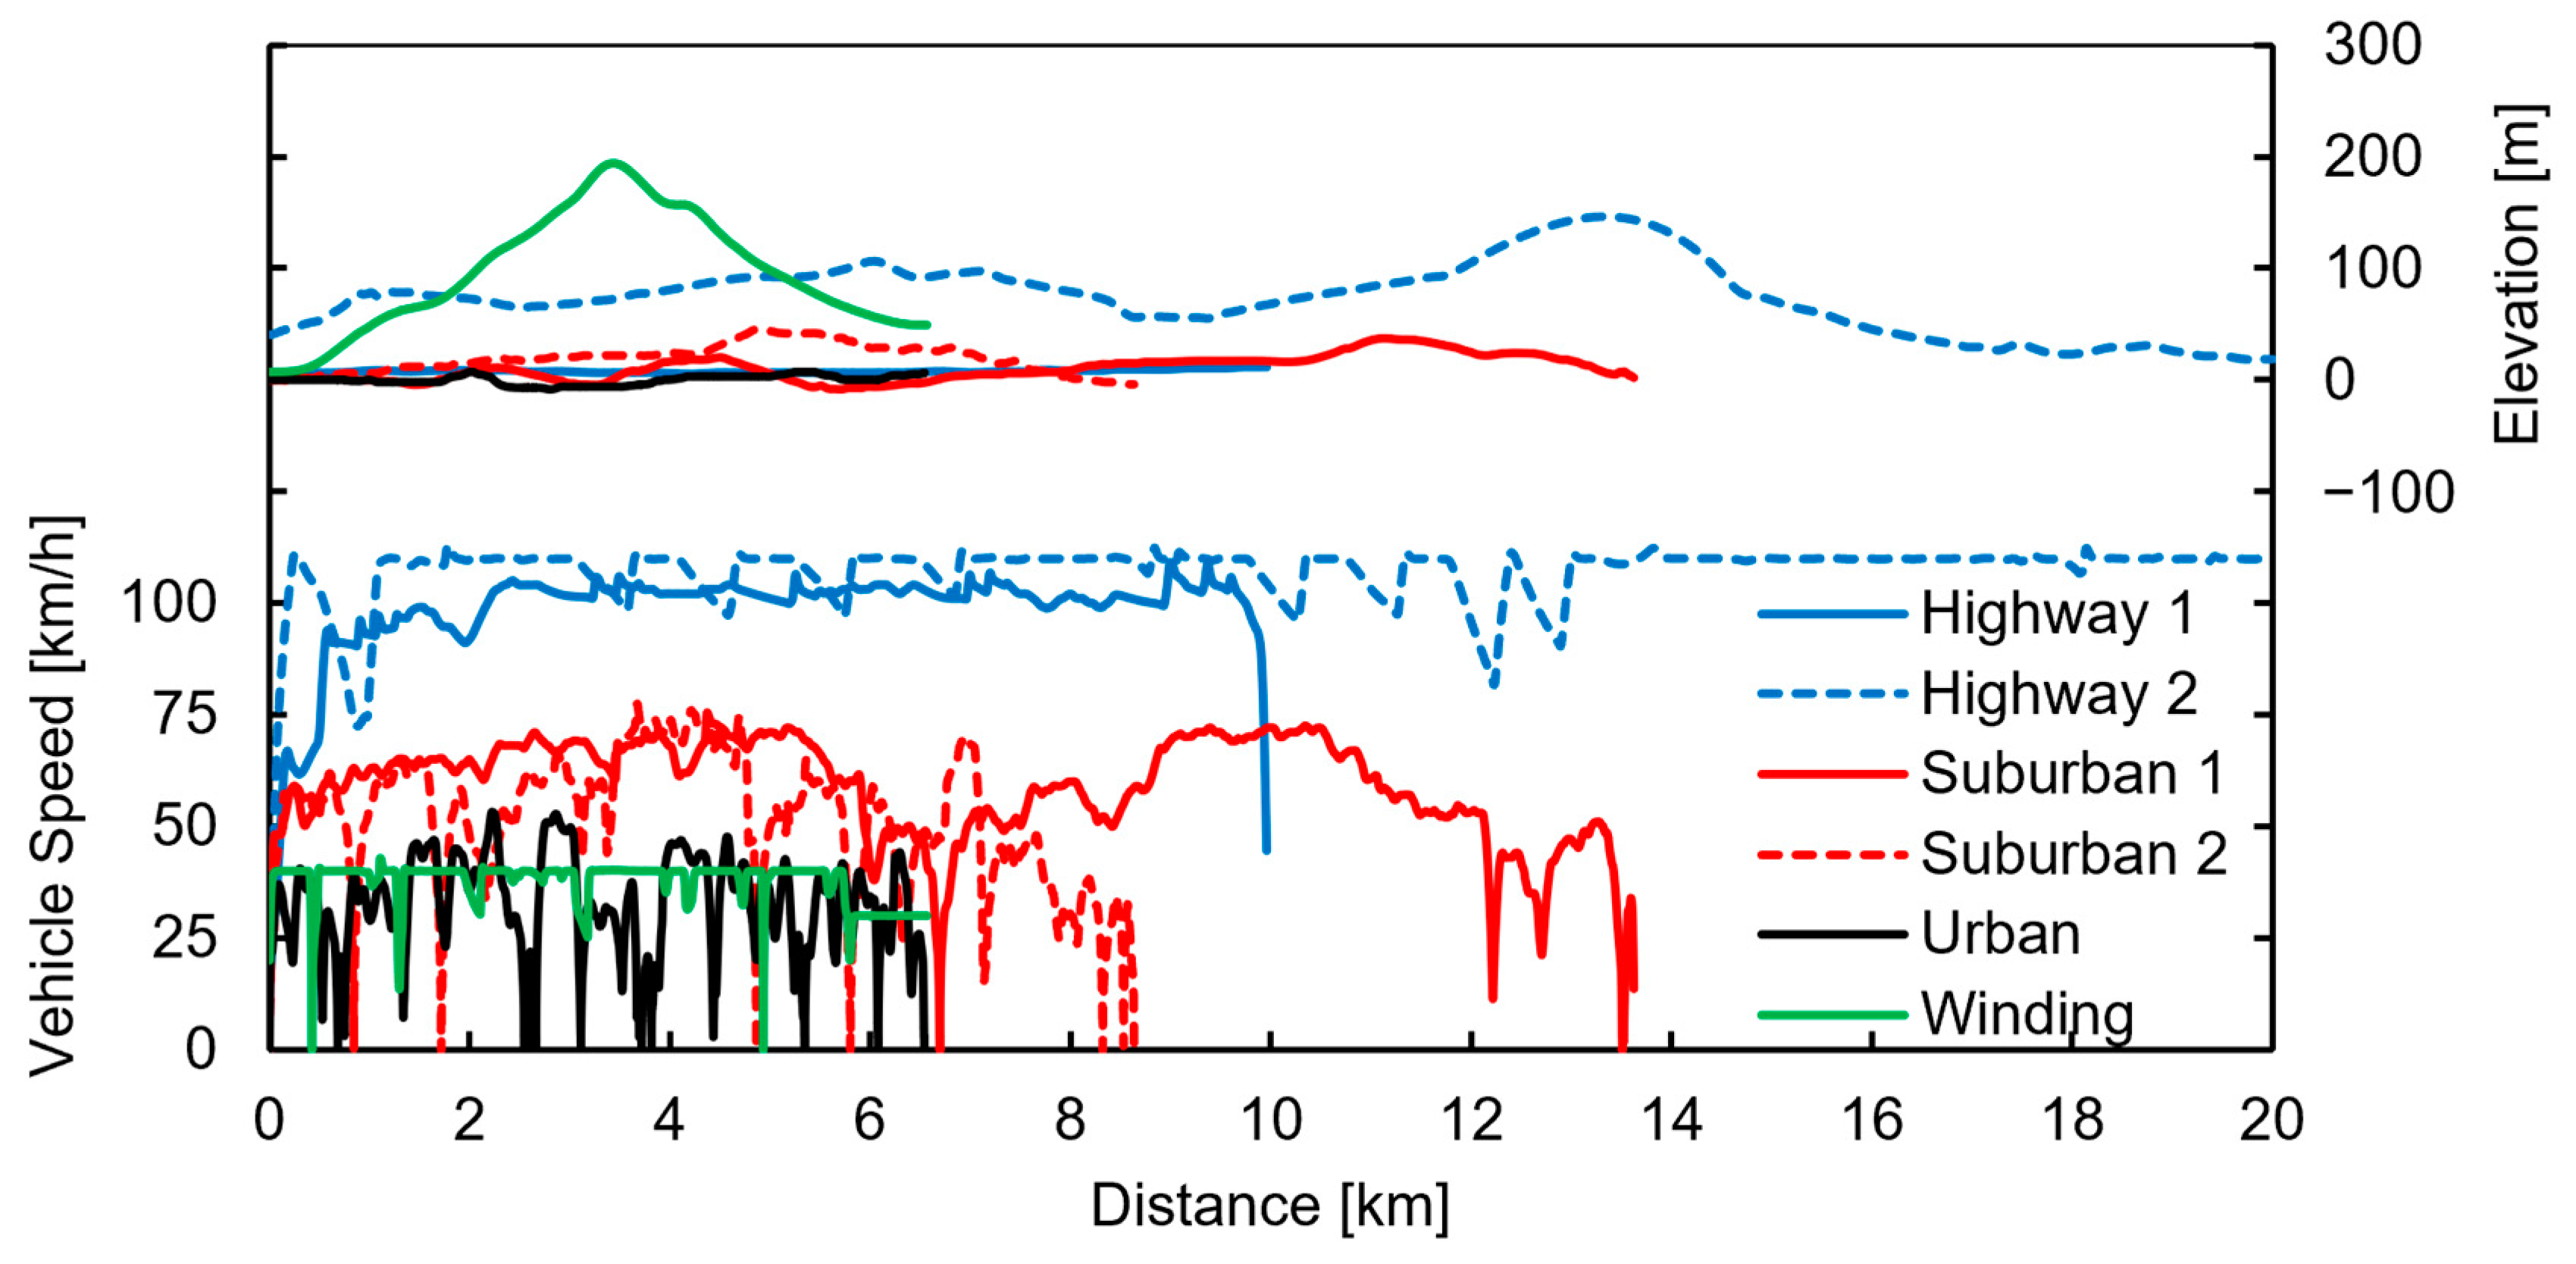
2.3. Driving Route
2.4. CO2 Emissions
3. Results and Discussion
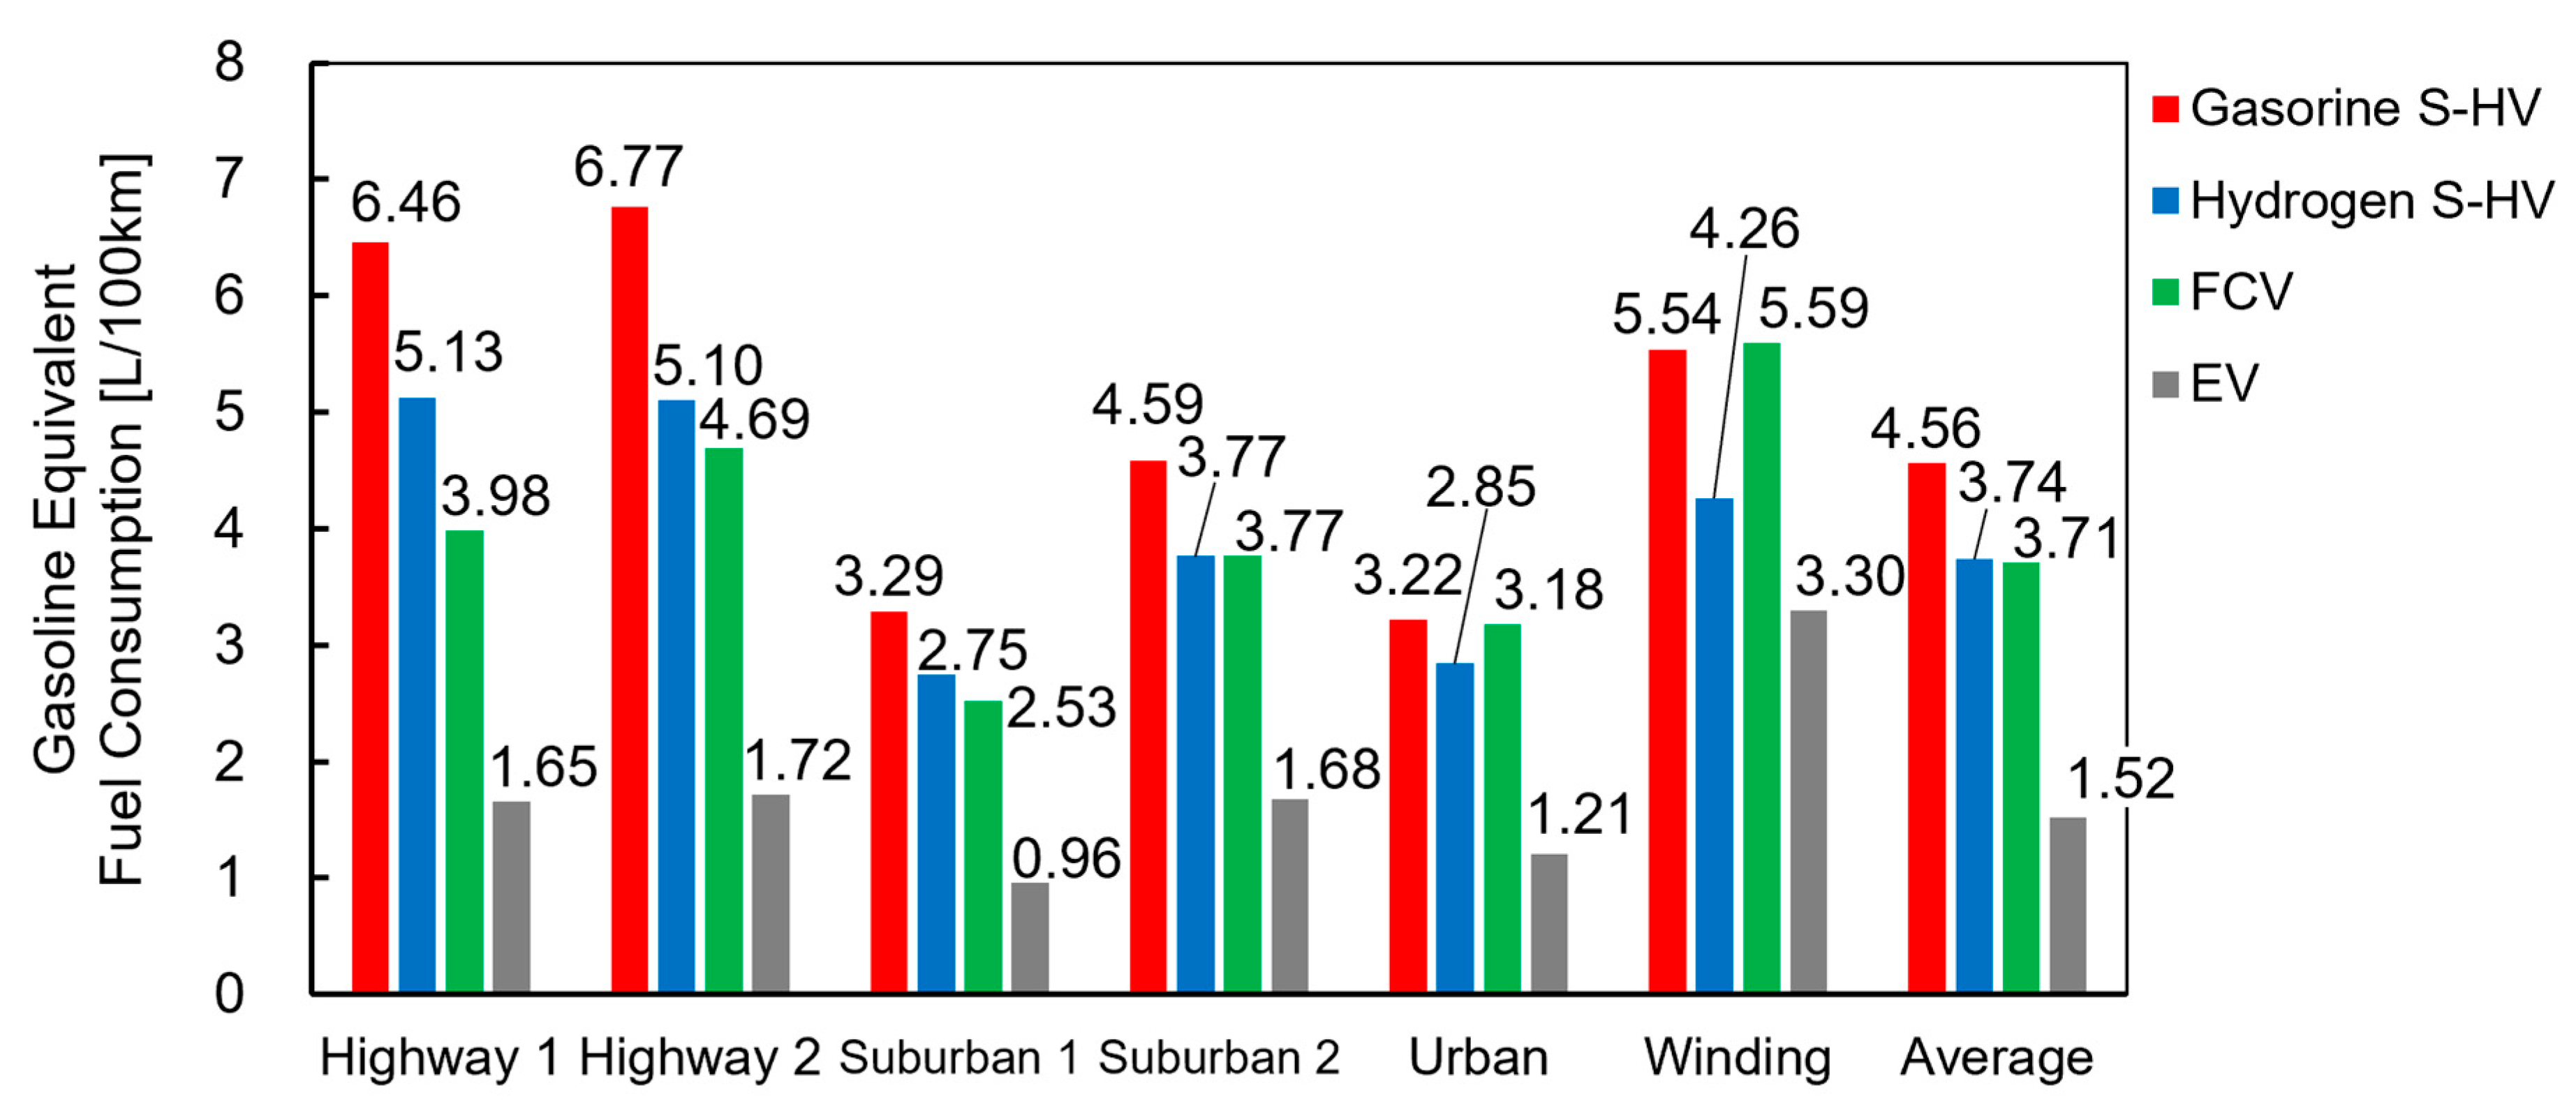
3.1. Real-Road Fuel Consumption Performance
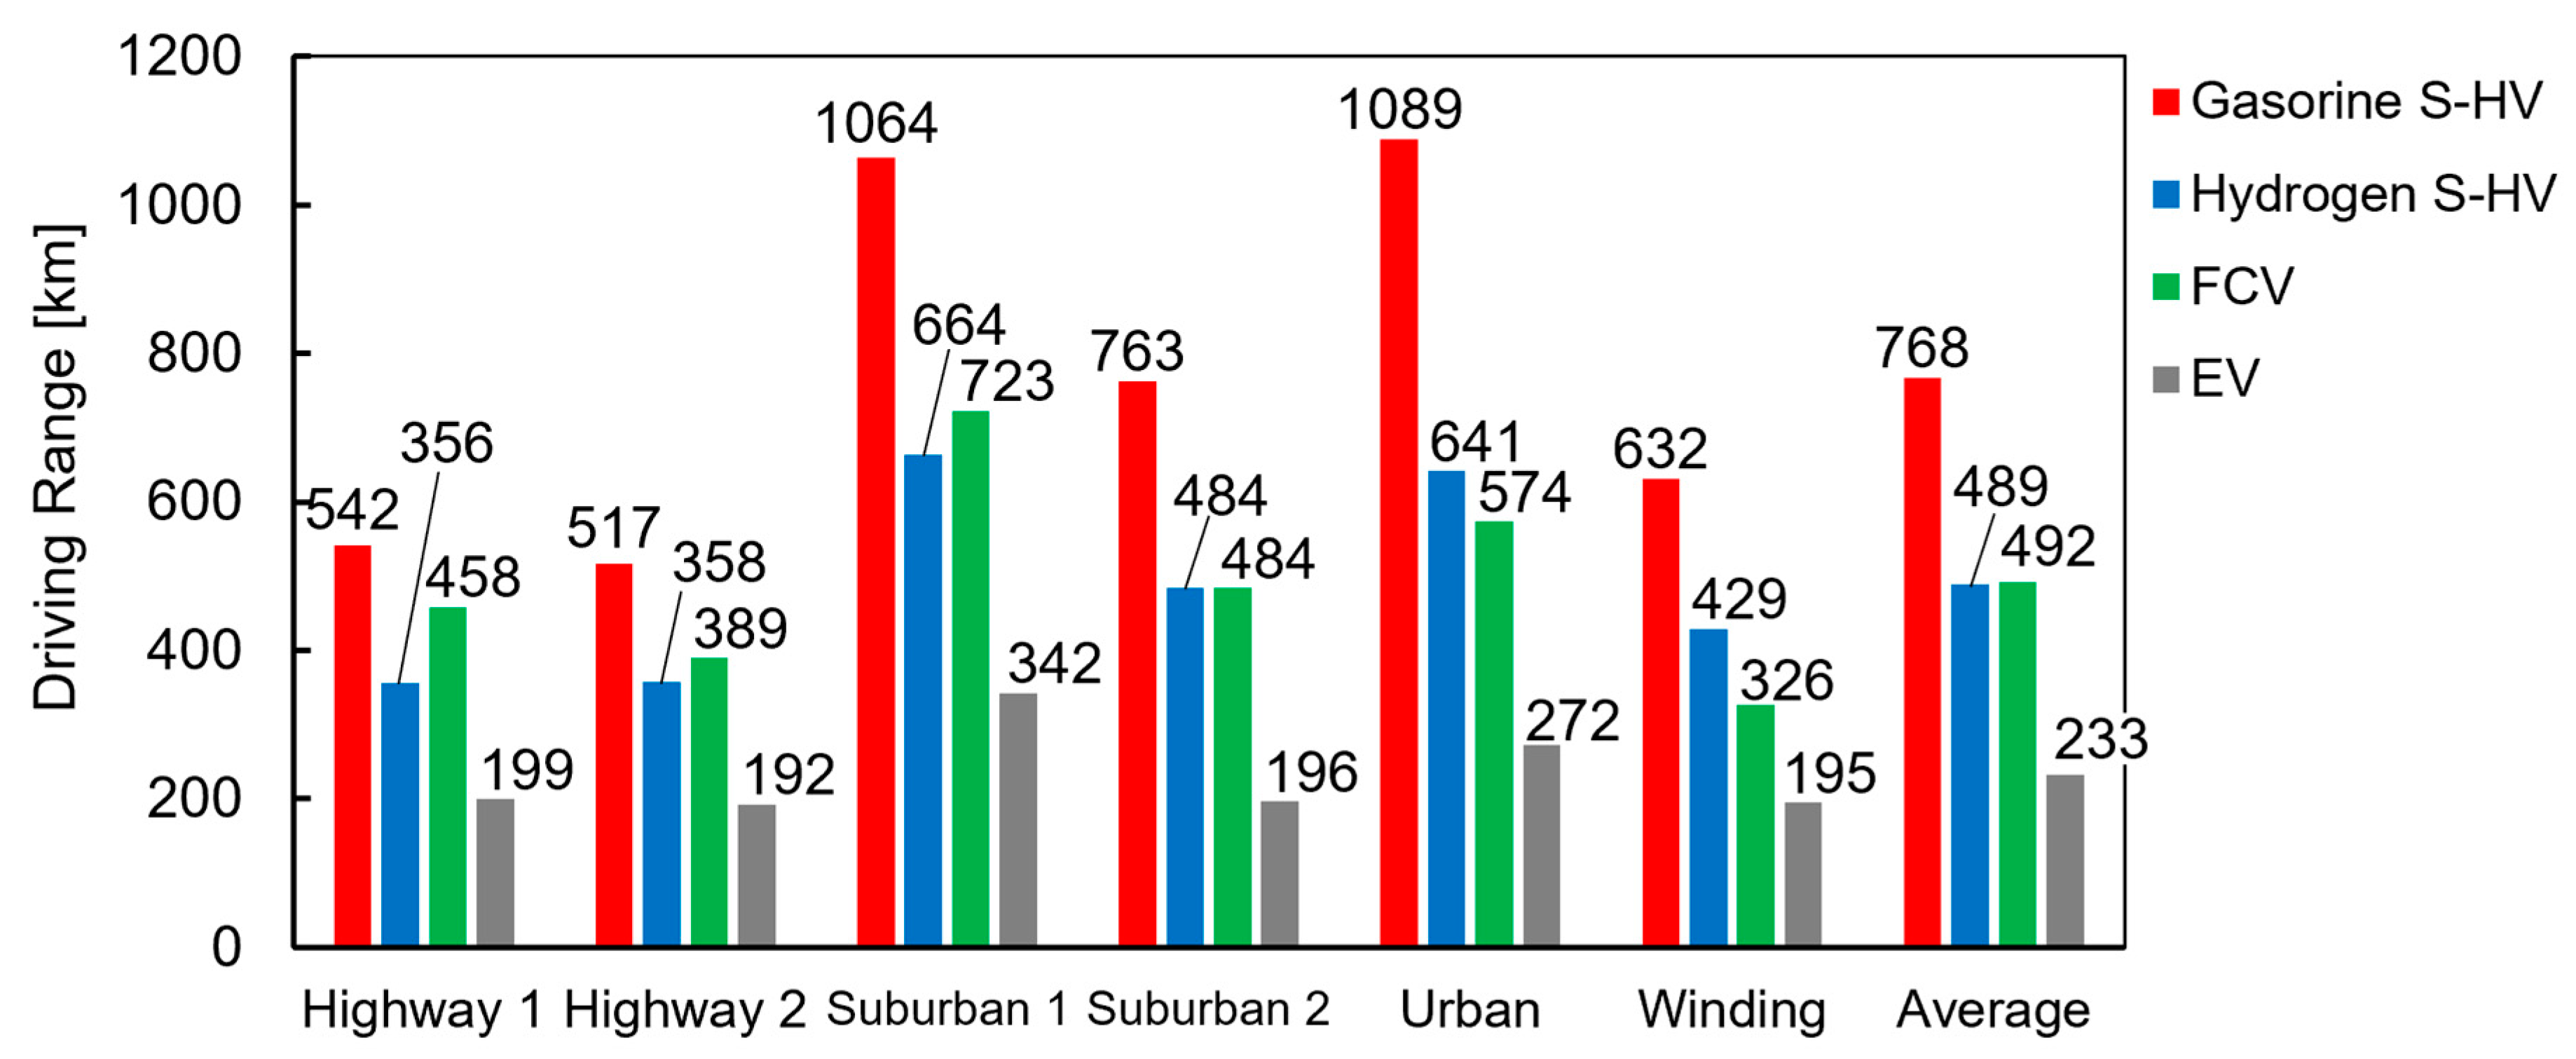
3.2. Driving Range
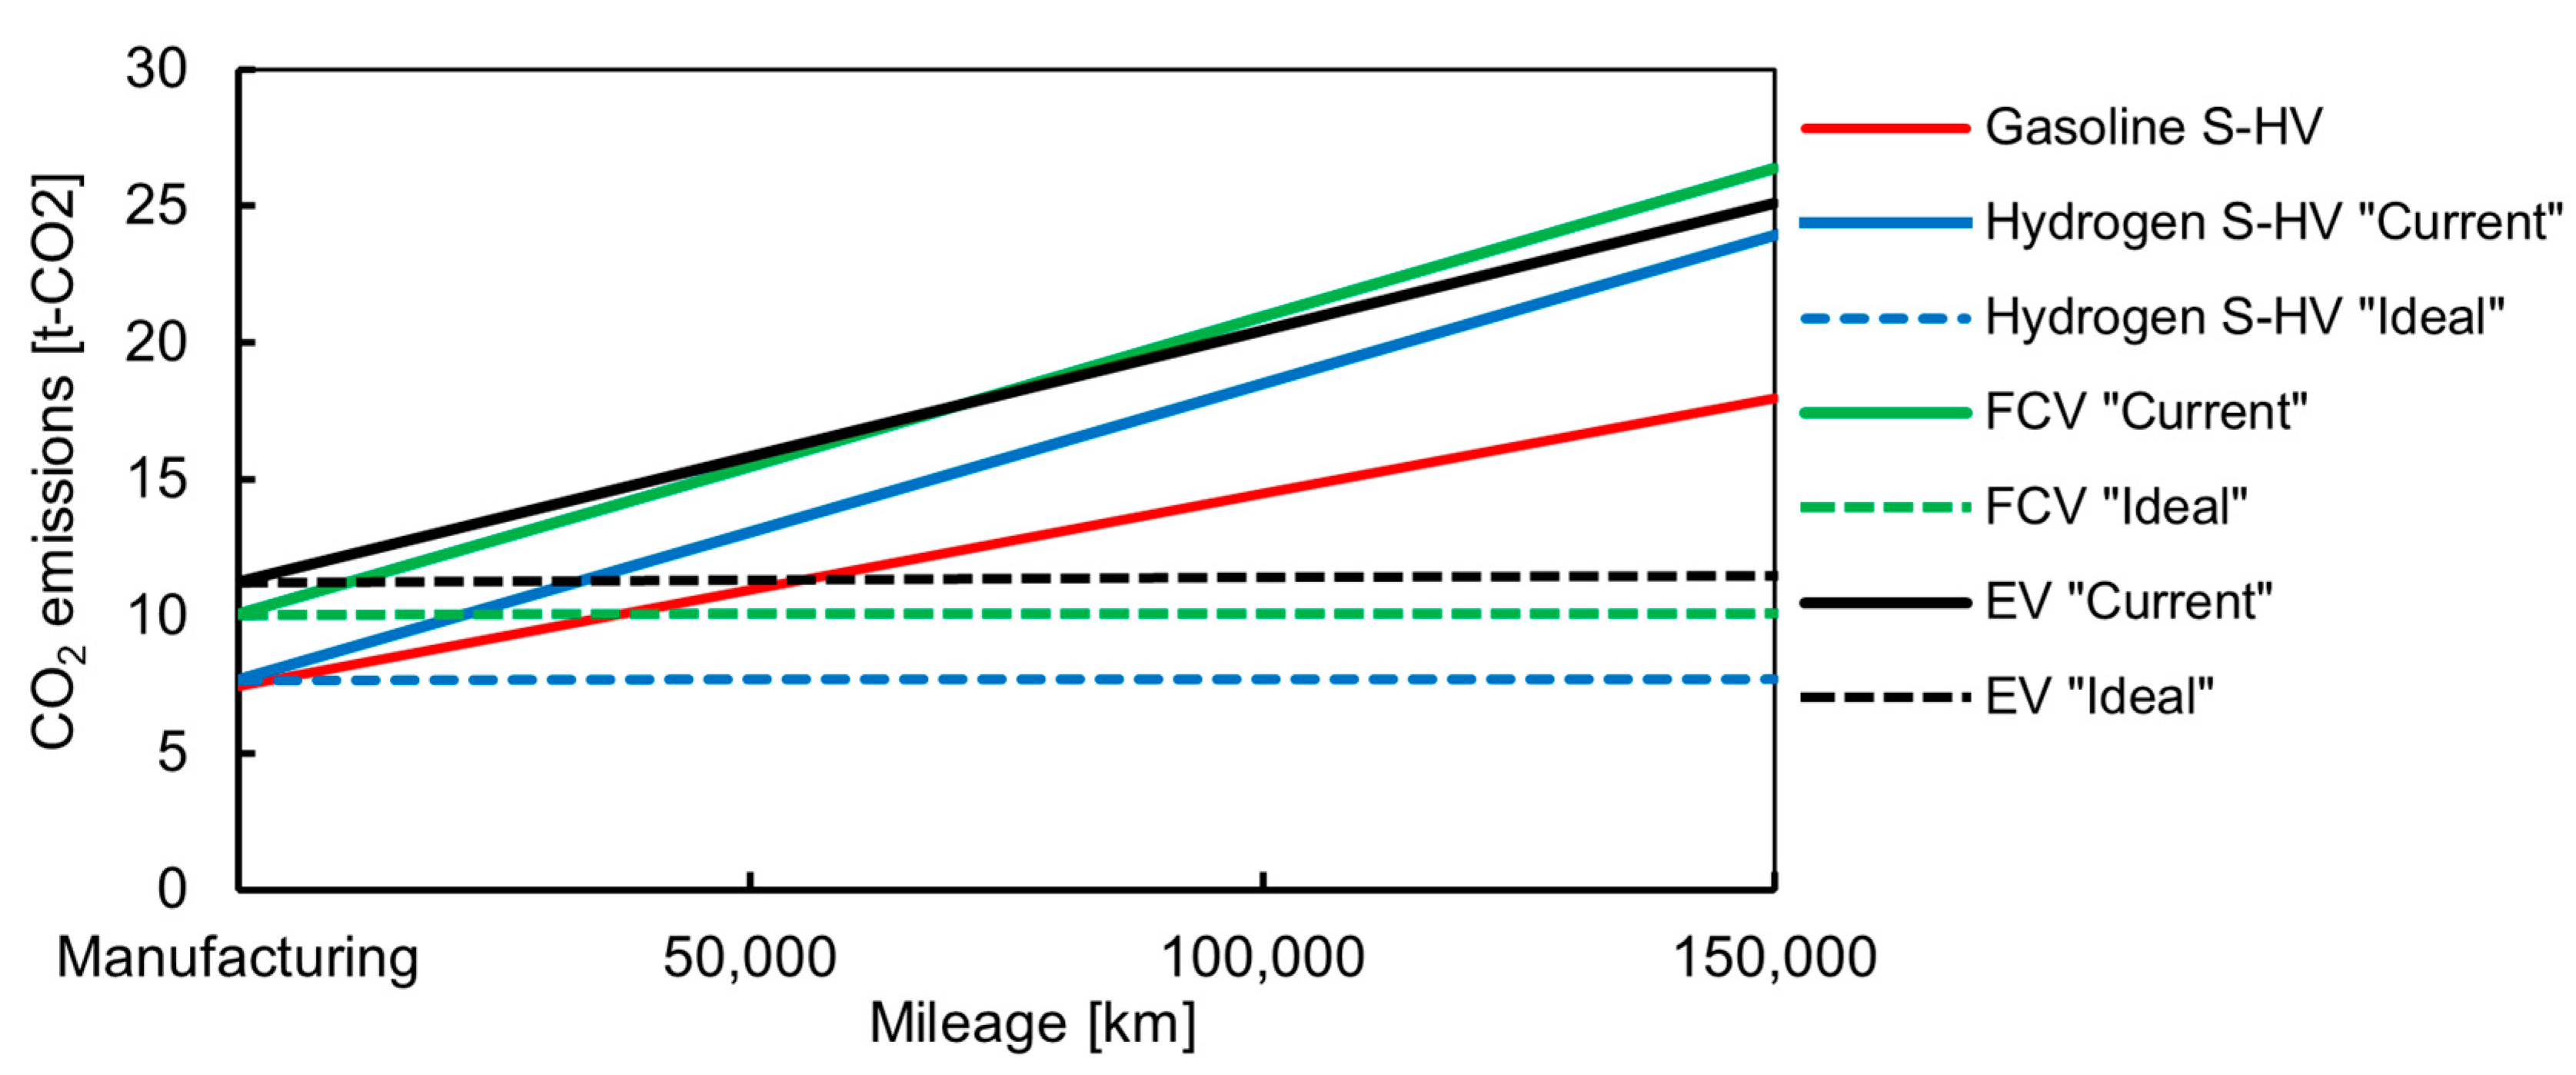
3.3. CO2 Emissions
4. Conclusions
- The average gasoline-equivalent fuel consumption performance of the hydrogen S-HVs and FCVs was approximately 20% better than that of the gasoline S-HVs.
- The average driving ranges of the hydrogen S-HVs and FCVs were sufficient, approximately 60% of that of the gasoline S-HVs and more than twice that of the EVs.
- The vehicle weight of hydrogen S-HVs is lighter than that of FCVs; therefore, it can be concluded that hydrogen S-HVs are more advantageous in terms of fuel consumption and driving range on urban and winding roads, where motor power is frequently required for acceleration and deceleration. In contrast, FCVs are suitable on highways with relatively low accelerations and decelerations, owing to their high stack efficiency.
- The life-cycle CO2 emissions of hydrogen S-HVs are low during manufacturing; however, large differences in CO2 emissions exist depending on the hydrogen fuel production method. In other words, hydrogen S-HVs are superior to FCVs and EVs because they emit less CO2 during manufacturing.
Author Contributions
Funding
Data Availability Statement
Conflicts of Interest
References
- Verhelst, S.; Wallner, T.; Eichlseder, H.; Naganuma, K.; Gerbig, F.; Boyer, B.; Tanno, S. Electricity powering combustion: Hydrogen engines. Proc. IEEE 2012, 100, 427–439. [Google Scholar] [CrossRef]
- Talebian, H.; Herrera, O.E.; Mérida, W. Spatial and temporal optimization of hydrogen fuel supply chain for light duty passenger vehicles in British Columbia. Int. J. Hydrog. Energy 2019, 44, 25939–25956. [Google Scholar] [CrossRef]
- Miotti, M.; Hofer, J.; Bauer, C. Integrated environmental and economic assessment of current and future fuel cell vehicles. Int. J. Life Cycle Assess. 2017, 22, 94–110. [Google Scholar] [CrossRef]
- Li, B.; Xiang, T.; Shao, Y.; Lv, F.; Cheng, C.; Zhang, J.; Zhu, Q.; Zhang, Y.; Yang, J. Secondary-heteroatom-doping-derived synthesis of N, S co-doped graphene nanoribbons for enhanced oxygen reduction activity. Nanomaterials 2022, 12, 3306. [Google Scholar] [CrossRef] [PubMed]
- Schmitz, M.; Bahr, M.; Gößling, S.; Pischinger, S. Analysis of ice formation during start-up of PEM fuel cells at subzero temperatures using experimental and simulative methods. Energies 2023, 16, 6534. [Google Scholar] [CrossRef]
- Gurz, M.; Baltacioglu, E.; Hames, Y.; Kaya, K. The meeting of hydrogen and automotive: A review. Int. J. Hydrog. Energy 2017, 42, 23334–23346. [Google Scholar] [CrossRef]
- Gao, L.; Winfield, Z.C. Life cycle assessment of environmental and economic impacts of advanced vehicles. Energies 2012, 5, 605–620. [Google Scholar] [CrossRef]
- Li, Y.; Ha, N.; Li, T. Research on carbon emissions of electric vehicles throughout the life cycle assessment taking into vehicle weight and grid Mix composition. Energies 2019, 12, 3612. [Google Scholar] [CrossRef]
- Jochem, P.; Babrowski, S.; Fichtner, W. Assessing CO2 emissions of electric vehicles in Germany in 2030. Transp. Res. A. 2015, 78, 68–83. [Google Scholar] [CrossRef]
- Hirz, M.; Nguyen, T.T. Life-cycle CO2-equivalent emissions of cars driven by conventional and electric propulsion systems. World Electr. Veh. J. 2022, 13, 61. [Google Scholar] [CrossRef]
- Oda, H.; Noguchi, H.; Fuse, M. Review of life cycle assessment for automobiles: A meta-analysis-based approach. Renew. Sustain. Energy Rev. 2022, 159, 112214. [Google Scholar] [CrossRef]
- Wang, D.; Zamel, N.; Jiao, K.; Zhou, Y.; Yu, S.; Du, Q.; Yin, Y. Life cycle analysis of internal combustion engine, electric and fuel cell vehicles for China. Energy 2013, 59, 402–412. [Google Scholar] [CrossRef]
- Ashnani, M.H.M.; Miremadi, T.; Johari, A.; Danekar, A. Environmental impact of alternative fuels and vehicle technologies: A life cycle assessment perspective. Procedia Environ. Sci. 2015, 30, 205–210. [Google Scholar] [CrossRef]
- Alam, M.S.; Hyde, B.; Duffy, P.; McNabola, A. Analysing the Co-Benefits of transport fleet and fuel policies in reducing PM2.5 and CO2 emissions. J. Cleaner Prod. 2018, 172, 623–634. [Google Scholar] [CrossRef]
- Teimouri, A.; Zayer Kabeh, K.Z.; Changizian, S.; Ahmadi, P.; Mortazavi, M. Comparative lifecycle assessment of hydrogen fuel cell, electric, CNG, and gasoline-powered vehicles under real driving conditions. Int. J. Hydrog. Energy 2022, 47, 37990–38002. [Google Scholar] [CrossRef]
- Smith, J.R.; Aceves, S.; Van Blarigan, P. Series hybrid vehicles and optimized hydrogen engine design. SAE Trans. 1995, 104, 816–827. [Google Scholar] [CrossRef]
- Nissan Motor Co., Ltd. NOTE. (Journal of Eng. Power) Specifications. Available online: https://www2.nissan.co.jp/SP/NOTE/VLP/PDF/note_specsheet.pdf (accessed on 20 July 2023). (In Japanese).
- Etori, S.; Enomoto, T.; Kuwata, T.; Mori, Y. Noise and vibration reduction technologies for new e-power powertrain. Nissan Tech. Rev. 2017, 80, 39–47. [Google Scholar]
- Oki, S.; Sato, Y.; Nakajima, T.; Abe, M.; Tamai, K. Development of an electrified powertrain for e-POWER. Nissan Tech. Rev. 2017, 80, 15–18. [Google Scholar]
- Toyota Motor Co. MIRAI Specifications. Available online: https://toyota.jp/pages/contents/mirai/001_p_003/4.0/pdf/spec/mirai_spec_201910.pdf (accessed on 20 July 2023). (In Japanese).
- Toyota Motor, Corporation. MIRAI Catalog. Available online: https://toyota.jp/pages/contents/request/webcatalog/mirai/mirai_main_201908.pdf (accessed on 20 July 2023). (In Japanese).
- Nissan Motor Co., Ltd. LEAF Specifications. Available online: http://history.nissan.co.jp/LEAF/ZE0/1211/pdf/leaf_specification.pdf (accessed on 20 July 2023). (In Japanese).
- National Agency for Automobile and Land Transport Technology. TRIAS 08-001-01, Test Requirements and Instructions for Automobile Standards. Available online: https://www.naltec.go.jp/publication/regulation/fkoifn0000000ljx-att/fkoifn00000060q2.pdf (accessed on 20 July 2023). (In Japanese).
- Kurtz, J.M.; Sprik, S.; Saur, G.; Onorato, S. Fuel Cell Electric Vehicle Durability and Fuel Cell Performance; National Renewable Energy Lab.: Golden, CO, USA, 2019. [Google Scholar] [CrossRef]
- Petroleum Association of Japan. Efforts to Combat Global Warming in the Oil Refining Industry. 2011. Available online: https://www.meti.go.jp/committee/summary/0004606/2011_05_01.pdf (accessed on 20 July 2023). (In Japanese).
- New Energy and Industrial Technology Development Organization. Hydrogen Production Technology. 2015. Available online: https://www.nedo.go.jp/content/100567362.pdf (accessed on 20 July 2023). (In Japanese).
- Agency for Natural Resources and Energy. Electricity Survey Statistics Table. 2017. Available online: https://www.enecho.meti.go.jp/statistics/electric_power/ep002/results_archive.html#r01 (accessed on 20 July 2023). (In Japanese).
- Imamura, E.; Iuchi, M.; Bando, S. Comprehensive Assessment of Life Cycle CO2 Emissions from Power Generation Technologies in Japan. Central Research Institute of Electric Power industry Report; Central Research Institute of Electric Power industry: Tokyo, Japan, 2016; Volume Y06. (In Japanese) [Google Scholar]
- Ministry of Land, Infrastructure, Transport and Tourism. CO2 Emissions in the Transportation Sector and CO2 Emissions per Unit Transported. 2018. Available online: https://www.mlit.go.jp/sogoseisaku/environment/sosei_environment_tk_000007.html (accessed on 20 July 2023). (In Japanese).
- Kawamoto, R.; Mochizuki, H.; Moriguchi, Y.; Nakano, T.; Motohashi, M.; Sakai, Y.; Inaba, A. Estimation of CO2 emissions of internal combustion engine vehicle and battery electric vehicle using LCA. Sustainability 2019, 11, 2690. [Google Scholar] [CrossRef]
- Ishizaki, K.; Nakano, M. The environmental performance of current mass-produced passenger vehicles in Japan. Trans. JSME 2018, 84, 18–50. [Google Scholar] [CrossRef][Green Version]


| Vehicle Type | Gasoline S-HV [17,18,19] | Hydrogen S-HV [1,19] | FCV [19,20,21] | EV [19,22] | ||
|---|---|---|---|---|---|---|
| Unloaded Weight | 1170 kg | 1170 kg | 1850 kg | 1460 kg | ||
| Energy Storage | Fuel | Type | Gasoline | Hydrogen | Hydrogen | - |
| Capacity | 35 L | 4.6 kg | 4.6 kg | - | ||
| Battery Capacity | 1.47 kWh | 1.47 kWh | 1.35 kWh | 30.1 kWh | ||
| Engine | Displacement | 1198 cm3 | 1198 cm3 | - | - | |
| Cylinders | 3 | 3 | - | - | ||
| Supercharging | N/A | Turbocharger | - | - | ||
| Max. Power | 58 kW | 58 kW | - | - | ||
| Max. Torque | 104 Nm | 104 Nm | - | - | ||
| Fuel Cell | Max. Power | - | - | 114 kW | - | |
| Motor | Max. Power | 80 kW | 80 kW | 113 kW | 80 kW | |
| Max. Torque | 254 Nm | 254 Nm | 335 Nm | 254 Nm | ||
| Driving Route | Distance | Average Speed | Max Speed | Max Slope | Number of Stops | |
|---|---|---|---|---|---|---|
| Uphill | Downhill | |||||
| [km] | [km/h] | [km/h] | [°] | [°] | [-] | |
| Highway 1 | 10.0 | 95.0 | 109 | 3.20 | −1.22 | 0 |
| Highway 2 | 20.0 | 107.0 | 113 | 5.86 | −5.80 | 0 |
| Suburban 1 | 13.6 | 51.1 | 75.9 | 4.45 | −8.81 | 2 |
| Suburban 2 | 8.79 | 37.1 | 78.2 | 5.23 | −7.03 | 6 |
| Urban | 6.54 | 17.9 | 53.3 | 3.81 | –5.02 | 10 |
| Winding | 6.58 | 35.2 | 43.5 | 10.2 | –9.15 | 2 |
| Vehicle | Scenario | Manufacturing | WtT | TtW | WtW |
|---|---|---|---|---|---|
| kg-CO2/unit | g-CO2/km | g-CO2/km | g-CO2/km | ||
| Gasoline S-HV | - | 7461 | 0.56 | 69.62 | 70.18 |
| Hydrogen S-HV | Current | 7691 | 108.18 | 0.00 | 108.18 |
| Ideal | 7691 | 0.20 | 0.00 | 0.20 | |
| FCV | Current | 10,071 | 108.70 | 0.00 | 108.70 |
| Ideal | 10,071 | 0.21 | 0.00 | 0.21 | |
| EV | Current | 11,241 | 92.23 | 0.00 | 92.23 |
| Ideal | 11,241 | 1.73 | 0.00 | 1.73 |
Disclaimer/Publisher’s Note: The statements, opinions and data contained in all publications are solely those of the individual author(s) and contributor(s) and not of MDPI and/or the editor(s). MDPI and/or the editor(s) disclaim responsibility for any injury to people or property resulting from any ideas, methods, instructions or products referred to in the content. |
© 2023 by the authors. Licensee MDPI, Basel, Switzerland. This article is an open access article distributed under the terms and conditions of the Creative Commons Attribution (CC BY) license (https://creativecommons.org/licenses/by/4.0/).
Share and Cite
Naganuma, K.; Sakane, Y. Examining Real-Road Fuel Consumption Performance of Hydrogen-Fueled Series Hybrid Vehicles. Energies 2023, 16, 7193. https://doi.org/10.3390/en16207193
Naganuma K, Sakane Y. Examining Real-Road Fuel Consumption Performance of Hydrogen-Fueled Series Hybrid Vehicles. Energies. 2023; 16(20):7193. https://doi.org/10.3390/en16207193
Chicago/Turabian StyleNaganuma, Kaname, and Yuhei Sakane. 2023. "Examining Real-Road Fuel Consumption Performance of Hydrogen-Fueled Series Hybrid Vehicles" Energies 16, no. 20: 7193. https://doi.org/10.3390/en16207193
APA StyleNaganuma, K., & Sakane, Y. (2023). Examining Real-Road Fuel Consumption Performance of Hydrogen-Fueled Series Hybrid Vehicles. Energies, 16(20), 7193. https://doi.org/10.3390/en16207193