1. Introduction
Energy is essential for the development of society and its economy, and the correct use of it enables an improvement in the quality of life of human beings [
1]. In 2019, Ediger affirmed that the global energy matrix has been predominantly controlled by fossil fuels, particularly oil, and coal since coal beginning of the industrial revolution [
2]. The carbon monoxide and dioxide emissions generated during the combustion of these fuels are fundamental causes of global warming. Consequently, countries have rethought their development models toward clean energy generation, implementing regulations that limit the maximum amount of these emissions and the annual increase in global temperature.
The conservation of the environment and the mitigation of the gas emission process is one of the objectives of the 2030 agenda and is found, specifically, in the Sustainable Development Goal (SDG) number 7 (affordable and non-polluting energy) [
3]. In this sense, all countries, and Colombia is no exception, seek to implement public policies that seek to address not only the 2030 agenda but also the objectives that are in tune with the states. In particular, the environment and the use of clean energy are closely related. Various works available in the specialized literature have highlighted the environmental problem that is going through today worldwide and the importance of using alternative energies. During the year 2023, countries like Vietnam have experienced significant economic growth as stated by Raihan [
4]; however, the environmental impact that this has generated must also be considered. Raihan [
4] states that energy use triggers environmental degradation by increasing CO
2 emissions while increasing agricultural value-added improves Vietnam’s environmental quality by reducing CO
2 emissions in both the long and short term. In this way, I recommend the use of renewable energy. On the other hand, Umar Farooq et al. [
5] state that there is a significant negative association between the use of renewable energy and technological innovation with carbon emissions, while economic growth, non-renewable energy, and urbanization have shown a positive relationship. To lessen the effects on the environment, the authors suggest setting up research and development facilities to mitigate environmental pollution through the use of innovation and discouraging greater use of coal in electricity generation. Recent work agrees that there is environmental degradation from industrialization, which has resulted in misery for humans and biodiversity around the world. These environmental concerns require consideration to obtain a better understanding of how to design policies around climate change such as: the use of renewable energy, energy efficiency policies, and increasing the use of photovoltaic panels at the industrial level, among others [
6,
7,
8,
9,
10].
Based on the environmental situation described above and to achieve the purpose, the population is encouraged to consider renewable energies as a clean and safe alternative to power equipment and devices used basis daily. This cooperation with sustainable development and the reduction of greenhouse gas emissions can have a positive impact on the economic and social development of the population, as stated by Mahjabeen [
11]. A clear example of this is the provision of energy to regions of a country that do not yet have their own conventional electrical supply network, which radically improves people’s quality of life and encourages everyone to participate in an energy transition in which this type of energy plays a greater role. According to Pupo et al. [
12], in the Colombian energy matrix, energy generation from hydroelectric and thermal plants has predominated, with an average energy generation of 71% and 28%, respectively. The remaining 1% of the total annual average power generation corresponds to power generation from renewable energy sources. Currently, Colombia has only one wind farm, with an installed capacity of 19.5 MW.
The Colombian Caribbean region, due to its geographical location, has great and little-explored potential for the implementation of different types of renewable energy that can facilitate the development and application of alternative technologies to complement the national energy generation system. At the same time, these technologies can contribute to the protection of the environment, with solar energy standing out as a key option. Given the weather conditions of the city of Barranquilla, which are characterized by a warm climate for much of the year, IDEAM (Institute of Hydrology, Meteorology, and Environmental Studies) records are used to show daily solar irradiation values of 5–5.5 kWh/m
2. Based on this information, it is considered that the city presents favorable conditions for the implementation of photovoltaic energy as a power source for equipment used in daily life. This makes it a strategic point for taking advantage of the sun as an energy source [
13]. The Generation-Transmission Reference Expansion Plan 2017–2031 establishes that in the long term, the Colombian energy generation system must include alternatives to non-conventional technologies, such as large-scale solar photovoltaics. According to the plan’s scenario analysis, by 2031, the share of non-conventional renewable energies in the country will increase from less than 1% to between 14% and 18% [
14,
15,
16,
17,
18].
In economic terms, electric power generation technologies from solar energy began to evolve rapidly starting from the 1990s, gradually improving their efficiency and reducing the sale prices of photovoltaic panels, allowing for their widespread implementation [
19,
20]. According to Lodi et al. [
21], photovoltaic technology has also been integrated into the transport sector, with the initial motivation of reducing greenhouse gas emissions. In some vehicles, photovoltaic roofs have been implemented, providing the necessary energy to charge their accumulators, and reducing the mechanical load on the combustion engine caused by the alternator, thus saving fuel consumption costs.
In technical terms, reducing energy consumption in the transport sector through the use of renewable energy has been an important task for the energy scientific community. The specialized literature confirms that multiple tasks have been developed in different areas of knowledge, in order to meet the objective of clean, affordable energy and environmental conservation [
22,
23,
24,
25]. For example, Kolhe et al. [
26] presented a system that regulates the temperature in the cabin of a purely electric vehicle using ventilation equipment powered by electrical energy provided by a photovoltaic generator installed on its roof. The aeronautical sector has not been an exception. According to Rodríguez et al. [
27], there are currently two projects in the sector that use photovoltaic technology to meet their energy requirements: The SoLong UAV and the Solar Impulse. In 2005 and 2010, respectively, these projects flew at night using only solar energy. The Solar Impulse plane completed a flight over the entire United States and, in addition, set many records in terms of distances flown. On the other hand, considering that the accurate prediction of the solar diffuse fraction (DF), sometimes called the fuzzy ratio, is an important topic for solar energy research, in 2020, Claiwell et al. [
28] conducted a study, which analyzed three widely robust models to predict the solar diffuse fraction in Almería, Spain. The researchers claim to have collected data continuously for eight years, which guaranteed reliability in the application of the measurement and analysis models. The results showed that the multilayer hybrid perceptron gray wolf optimizer (MLP-GWO) model, followed by the Hybrid Adaptive Network-Based Fuzzy Inference System (ANFIS) model, provided higher performance in both the training and testing procedures.
Recently, Escandón et al. [
29], knowing the limitations to migration to renewable energy, carried out an investigation where they applied hydrogen as an energy vector. The objective of the work was to determine the hydrogen potential that can be obtained using photovoltaic plants in urban areas. This work, carried out in Cuenca (Ecuador) confirmed that the electrical energy produced is 5.5 times the demand of the study area. With the energy surplus, it was determined that energy would be available that would cover between 97% and 127% of the demand required to mobilize all urban buses. There are advantages such as the reduction of emissions or the increase in the quality of life, but the economic and technological aspects can be barriers to the implementation of these in the medium or short term. In that same year, 2022, Zaneti et al. [
30], interested in mitigating the environmental effects produced by energy resources, carried out an investigation where they proposed an optimization model to minimize the operating costs of a sustainable charging station (SC) under different types of charging for an electric bus, as part of an electric mobility living lab in the public transport system of the University of Campinas (Unicamp, Brazil). The results confirmed that the charging schedule defined by the optimization model is profitable, reducing the monthly cost by 52% compared to the actual charging schedule performed on campus. In addition, the inclusion of photovoltaic panels confirmed a significant reduction in operating costs, which can be improved with the inclusion of a battery energy storage system. Furthermore, in 2022, Fijałkowska et al. [
31], stated that access to renewable energy is an important element of modern urban policies aimed at sustainable development and energy security for residents but also limits energy production from conventional sources due to the pollution associated with them. For this reason, they carried out an investigation aimed at evaluating the effectiveness of photovoltaic panels in the canopies of public transport bus/tram stops. The results confirmed that bus shelters located in the center of Warsaw (Poland) were tested to constitute an important alternative to newly designed high-rise buildings. In this way, savings in energy consumption are obtained, as well as being useful for planning the supply of photovoltaic panels to other infrastructure facilities in the city of Warsaw, in Poland. Finally, the authors of this work highlight the publication carried out in the current year 2023 by Kantawong et al. [
32]. The document introduces the prototype module of an electronic public bus station system to serve as the intelligent public bus system in the new normal scenario. The aim of this work was to propose the smart public automation module which, based on electronics and digital control platforms, acted as a paradigm-shifting design to get closer to Thailand’s smart city policy 4.0, especially for public transportation systems having a new service paradigm for crowds in the COVID-19 crisis as an endemic situation. For the consumption of renewable energy, the solar cell photovoltaic (PV) system was used as the solar roof of the bus station module with the maximum power point tracking (MPPT) control of the Arduino controller in the battery charging process. The simulation results and many tests of the real prototype module results in the laboratory scenario met the analysis concept of the V-shaped model, but the whole system needs to be checked again in the public area on the site for more practical use.
Considering the specialized revision showed, this work is focused on the automotive sector, which is considered the largest consumer of fuel to fulfill its intrinsic function of transportation, as well as to supply the energy demand of its internal components such as lighting and air conditioning equipment, to improve the comfort of passengers when operating in demanding temperature conditions. Thus, the main novelty associated with this research work is to study the feasibility of implementing photovoltaic panels in public transport in the city of Barranquilla. As a pilot project, a case study began with the FRR Forward Euro IV bus fleet of the public transport service provider Alianza Sodis. It is very important to highlight that, as shown in the specialized literature, similar works published in international journals do not show that they have considered various criteria to carry out the energy analysis. In fact, the works available in international databases, as shown above, focus their studies only considering the energy impact, from the point of view of energy efficiency. This proposed work, documented here, considered a much deeper analysis, which translates into an interesting contribution to the state of the art of the matter. This work analyzed the feasibility of implementing solar panels, as well as its consequent impacts on the following four criteria: energy efficiency, environment, economic and social. The foregoing unquestionably translates into a contribution to the study of the implementation of solar panels in the transport sector that, without a doubt, can be implemented and reproduced in other economic sectors at a national and international level.
2. Materials, Methods, and System Description
The methodology is based on calculating the photovoltaic and energy storage system, performing stress analysis on the chassis and bodywork of the analyzed bus, and conducting the respective economic analysis of the project. There are four sequential and interrelated stages, and their focus is established based on the following considerations:
Sizing of the photovoltaic system: The sizing of this system is necessary to determine the size of the generator (number, technical characteristics, and arrangement of photovoltaic panels) needed to meet the daily energy consumption of the air conditioning equipment for a specific solar irradiation value. After determining the required generator size, it is compared to the energy resource that can be obtained from the photovoltaic panels installed on the bus deck based on the distribution of free spaces, which will determine the feasibility of the study. This sizing is carried out according to the Technical Specifications for Installations Isolated from the Network of the Institute for Energy Diversification and Saving (IDAE) [
33].
Sizing of the energy storage system: Sizing the energy storage system requires establishing the size of the battery bank (number, technical characteristics, and arrangement of batteries) necessary to energy supply the required electrical energy fully or partially at night, during cloudy or rainy days, or hours of low solar irradiation. The sizing of the energy storage system is based on the weather conditions in Barranquilla, with emphasis on the maximum number of days that the city experiences without sunlight, whose values are obtained from the database of the Institute of Hydrology, Meteorology, and Environmental Studies (IDEAM) [
34]. The calculation guide described in the book Handbook for Photovoltaic Systems by Sandia National Laboratories [
35] is used.
Analysis of the distribution of forces in the chassis and bodywork of the analyzed bus: The distribution of forces that will act on the bus under study must be analyzed after adding the loads corresponding to the air conditioning equipment, energy accumulators, and photovoltaic panels. This is to observe if, under the action of these additional loads, the permissible stresses in the chassis are exceeded, if deformations are generated in the body outside the permitted values, and if an acceptable safety factor is maintained in the structural elements.
Economic analysis of the project: The economic analysis of the project determines its profitability by using two investment evaluation indices, namely the Net Present Value (NPV) and the Internal Rate of Return (IRR). To determine the budget required for the installation of the photovoltaic system and energy storage, the results of the previous sizing are correlated with this analysis. The budget expenses, including installation costs, maintenance, contingencies, and taxes, represent the cash flow expenses. The added value of the project is estimated by comparing the fuel consumption of the bus with similar technical characteristics, whose air conditioning system is conventionally fed, with those that use photovoltaic panels for the same purpose. This saving represents the income in the cash flow of the project. By entering both the income and expenses into the cash flow, the investment can be evaluated to determine its profitability. The aim is to achieve a return on investment with a time horizon shorter than the useful life of the photovoltaic installation.
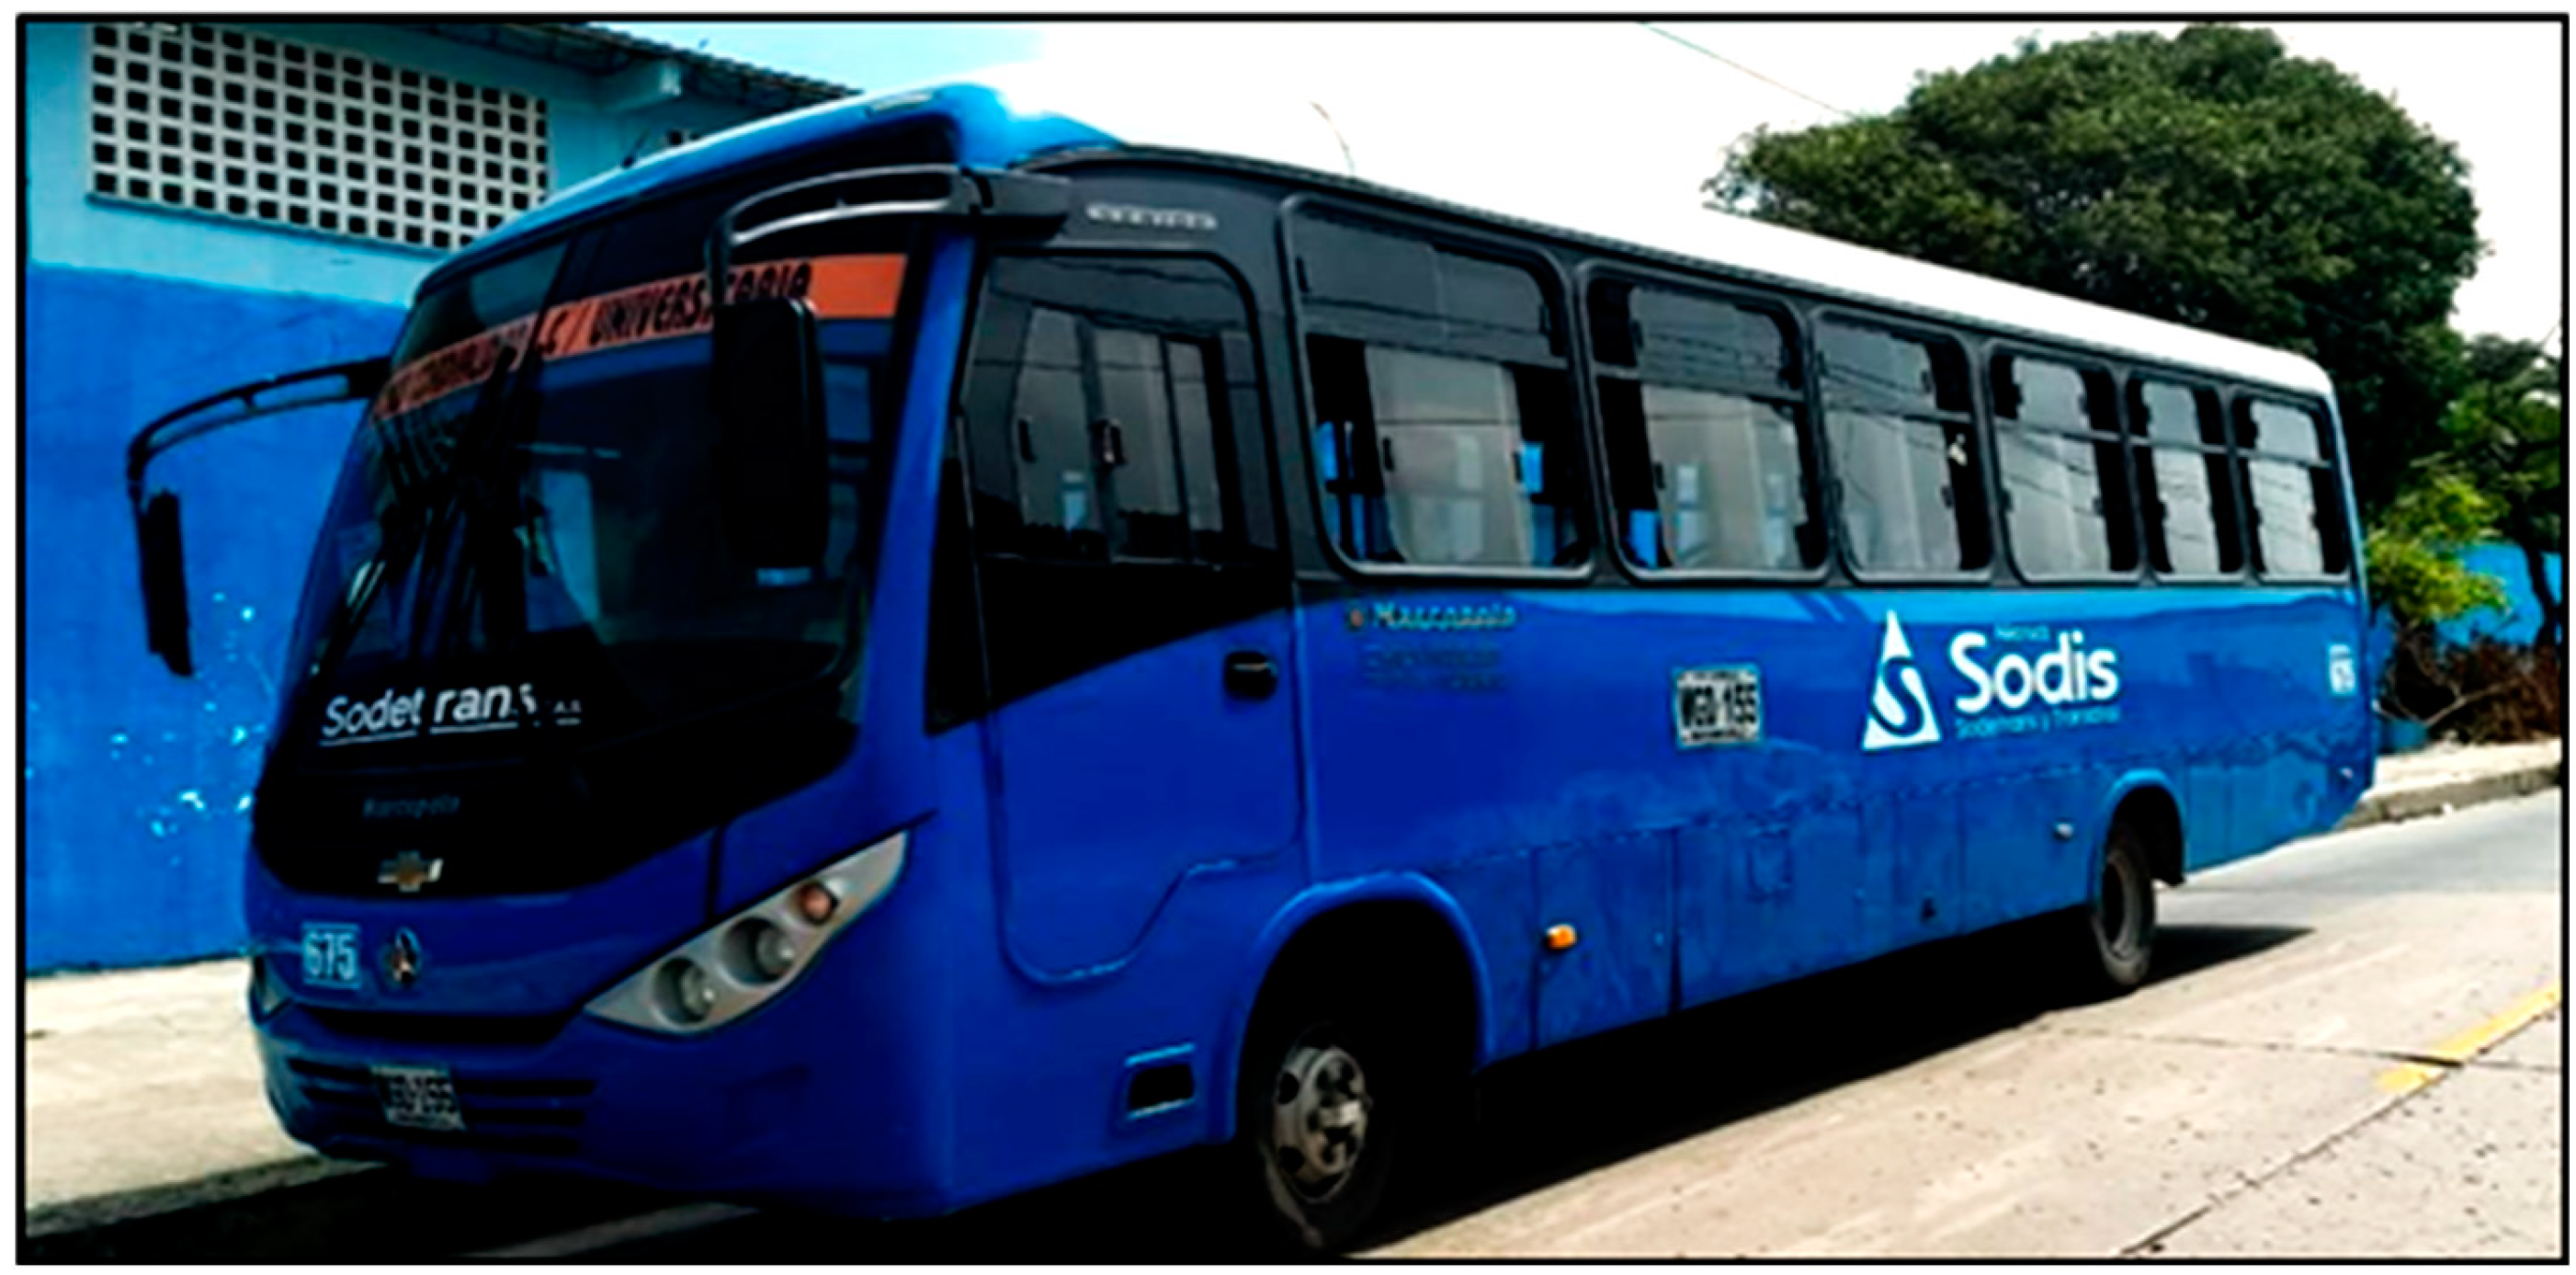
The analyzed bus model is the FRR Forward Euro IV from
Alianza Sodis, which is depicted in
Figure 1. This bus has a seating capacity of 41 passengers and has dimensions of 2.4 m in width and 10.18 m in length.
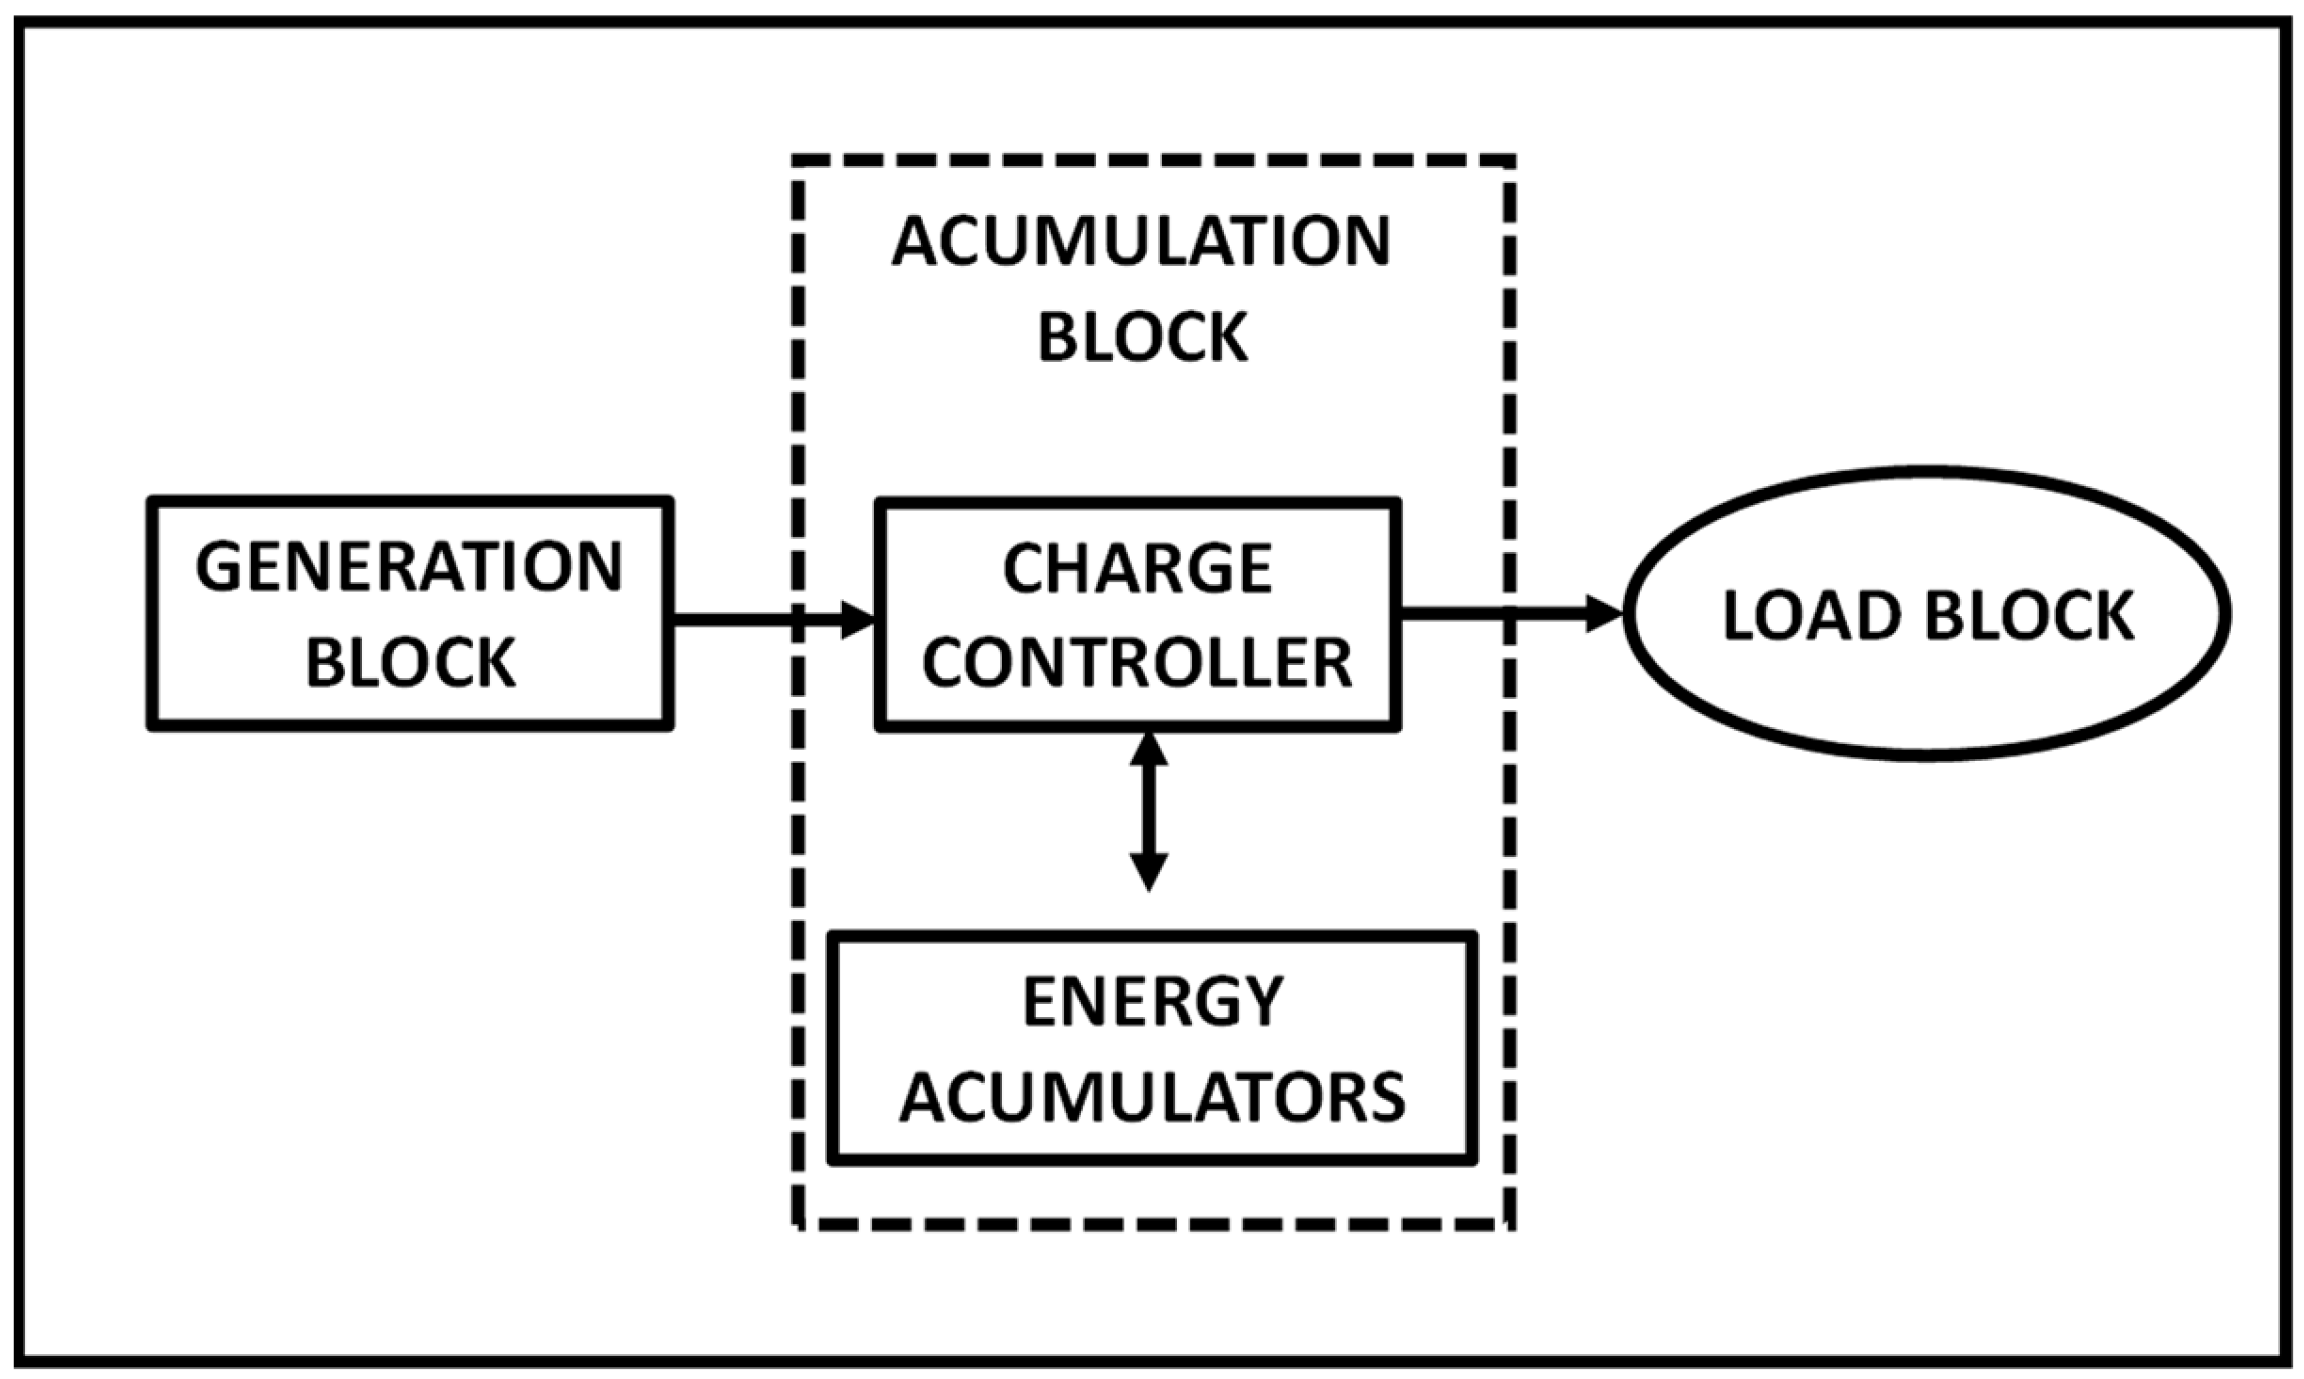
In the following sections, each component of the installation and its operation are described. The photovoltaic and energy storage system is dimensioned based on the characterization of the daily energy consumption of the air conditioning equipment and the solar resource available in the city of Barranquilla.
Figure 2 shows a block diagram of the photovoltaic installation. Finally, stress analysis on the chassis and bodywork and the economic study are presented.
2.1. Generation Block
It consists of custom-made flexible monocrystalline photovoltaic panels with low thickness, designed to adapt to the curved surfaces of the bus deck where they are installed. These features are selected to avoid a significant impact on the aesthetics and aerodynamics of the vehicle.
Distribution of Available Space on the Bus Deck
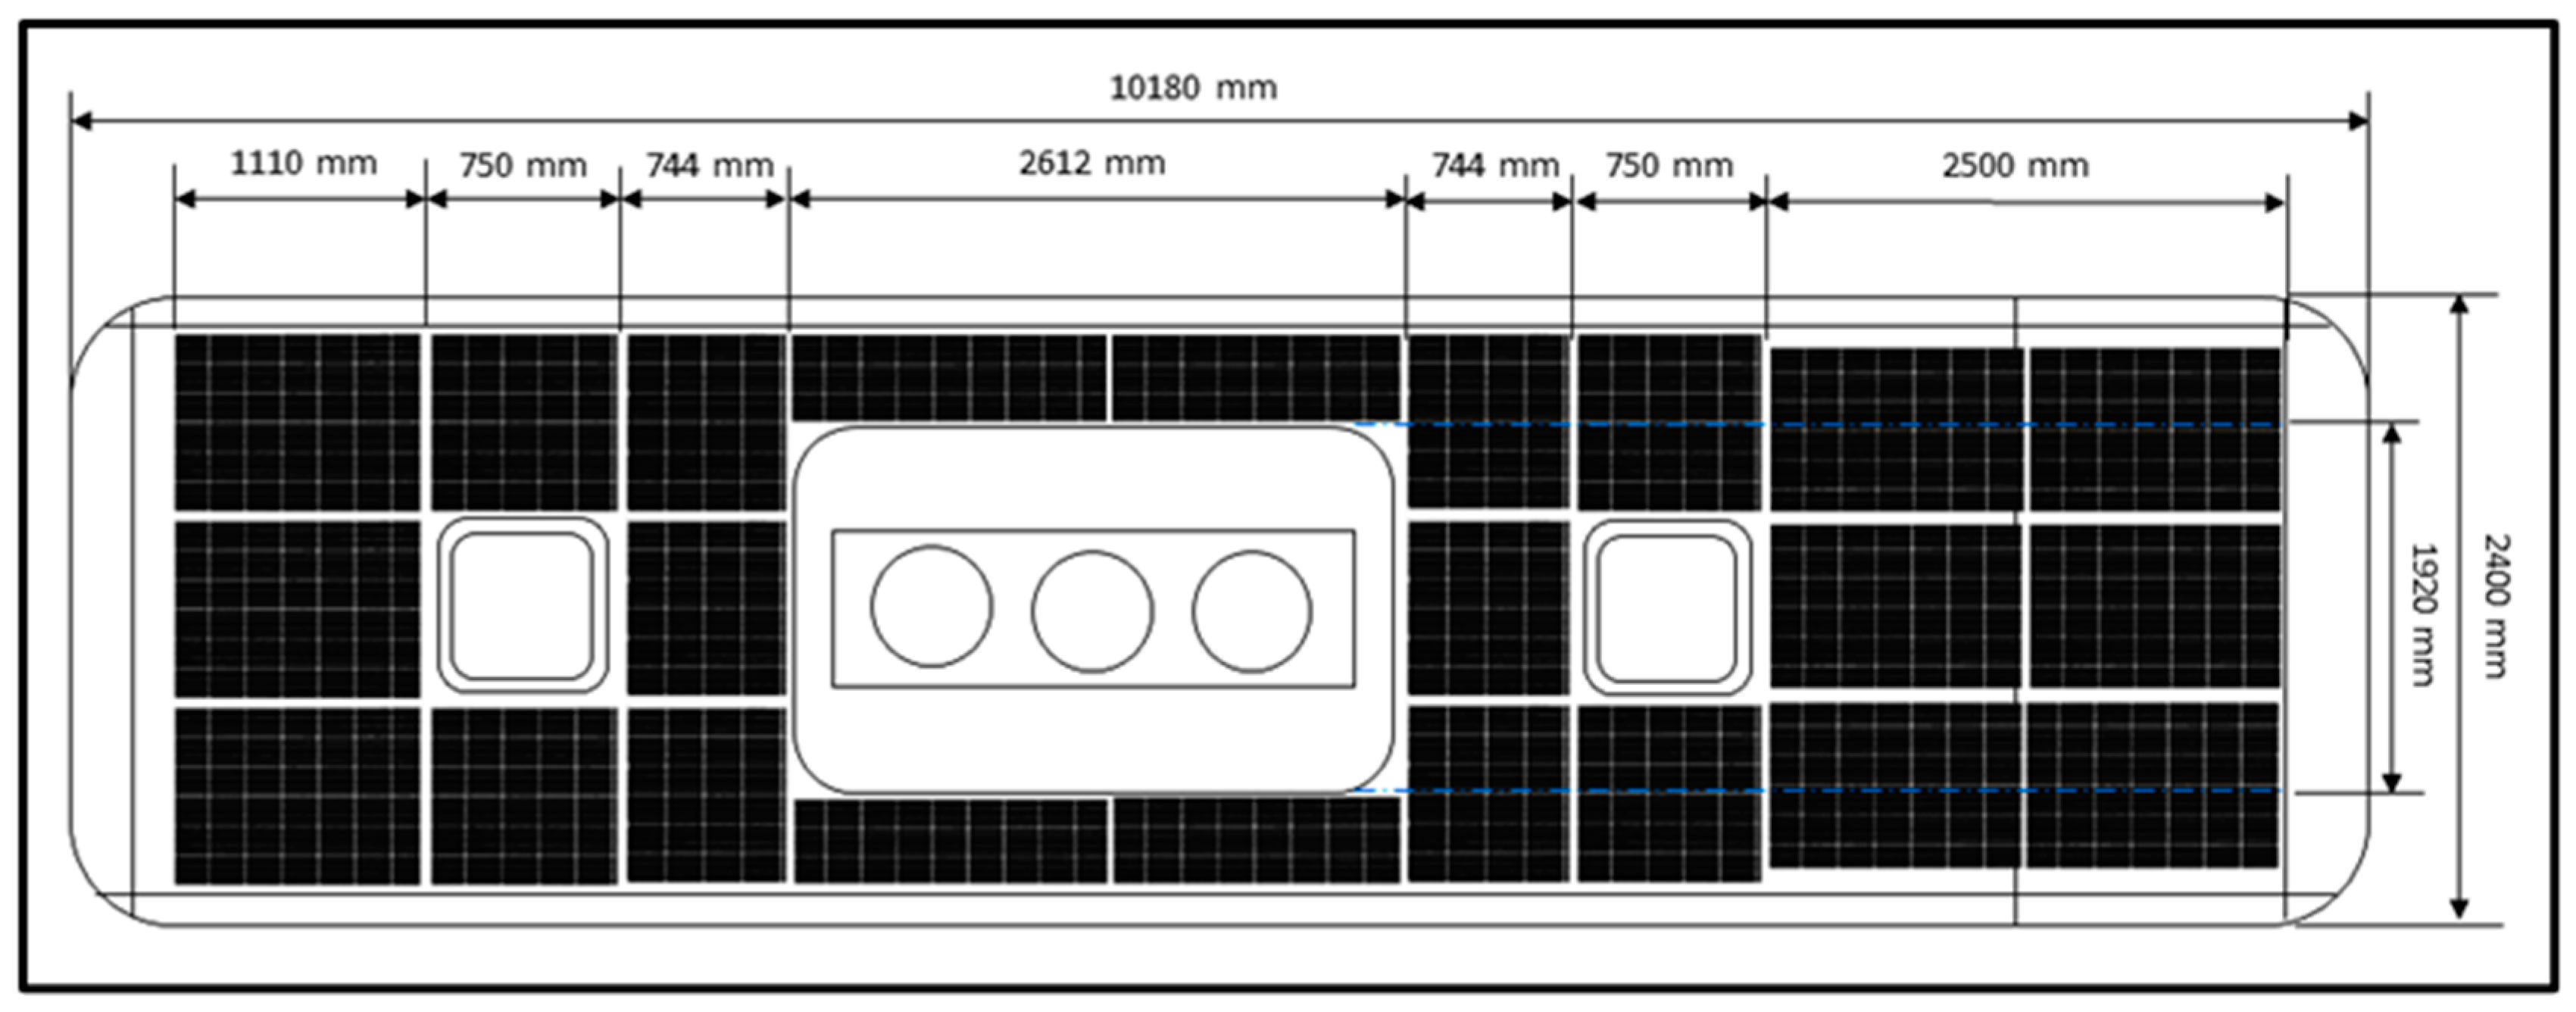
The distribution of available space on the bus deck needs to be analyzed to determine if the required energy can be generated once the photovoltaic panels are installed in the total available area. The dimensions of the bus deck were directly measured at the Alianza Sodis transport company facilities, and the following considerations and observations were made:
Dimensions of the two skylights (emergency exits): 0.6 m × 0.75 m;
Area of the Guchen ES-05 air conditioning equipment to be implemented (provided by the manufacturer’s data sheet): 2.612 m × 1.92 m;
The elbows that are formed between the bus cover and the upper part of the windows located on the side walls of the bus have a curvature. Therefore, it is a usable area for installation given the flexibility of the photovoltaic panels used;
The areas in white (see
Figure 3) represent the spaces in which it is not technically feasible to install panels. The spaces corresponding to the corners of the bus have curvatures whose complex geometry does not allow a photovoltaic panel to flex safely. The blank spaces in the front and rear correspond to the panoramic and rear windows, respectively;
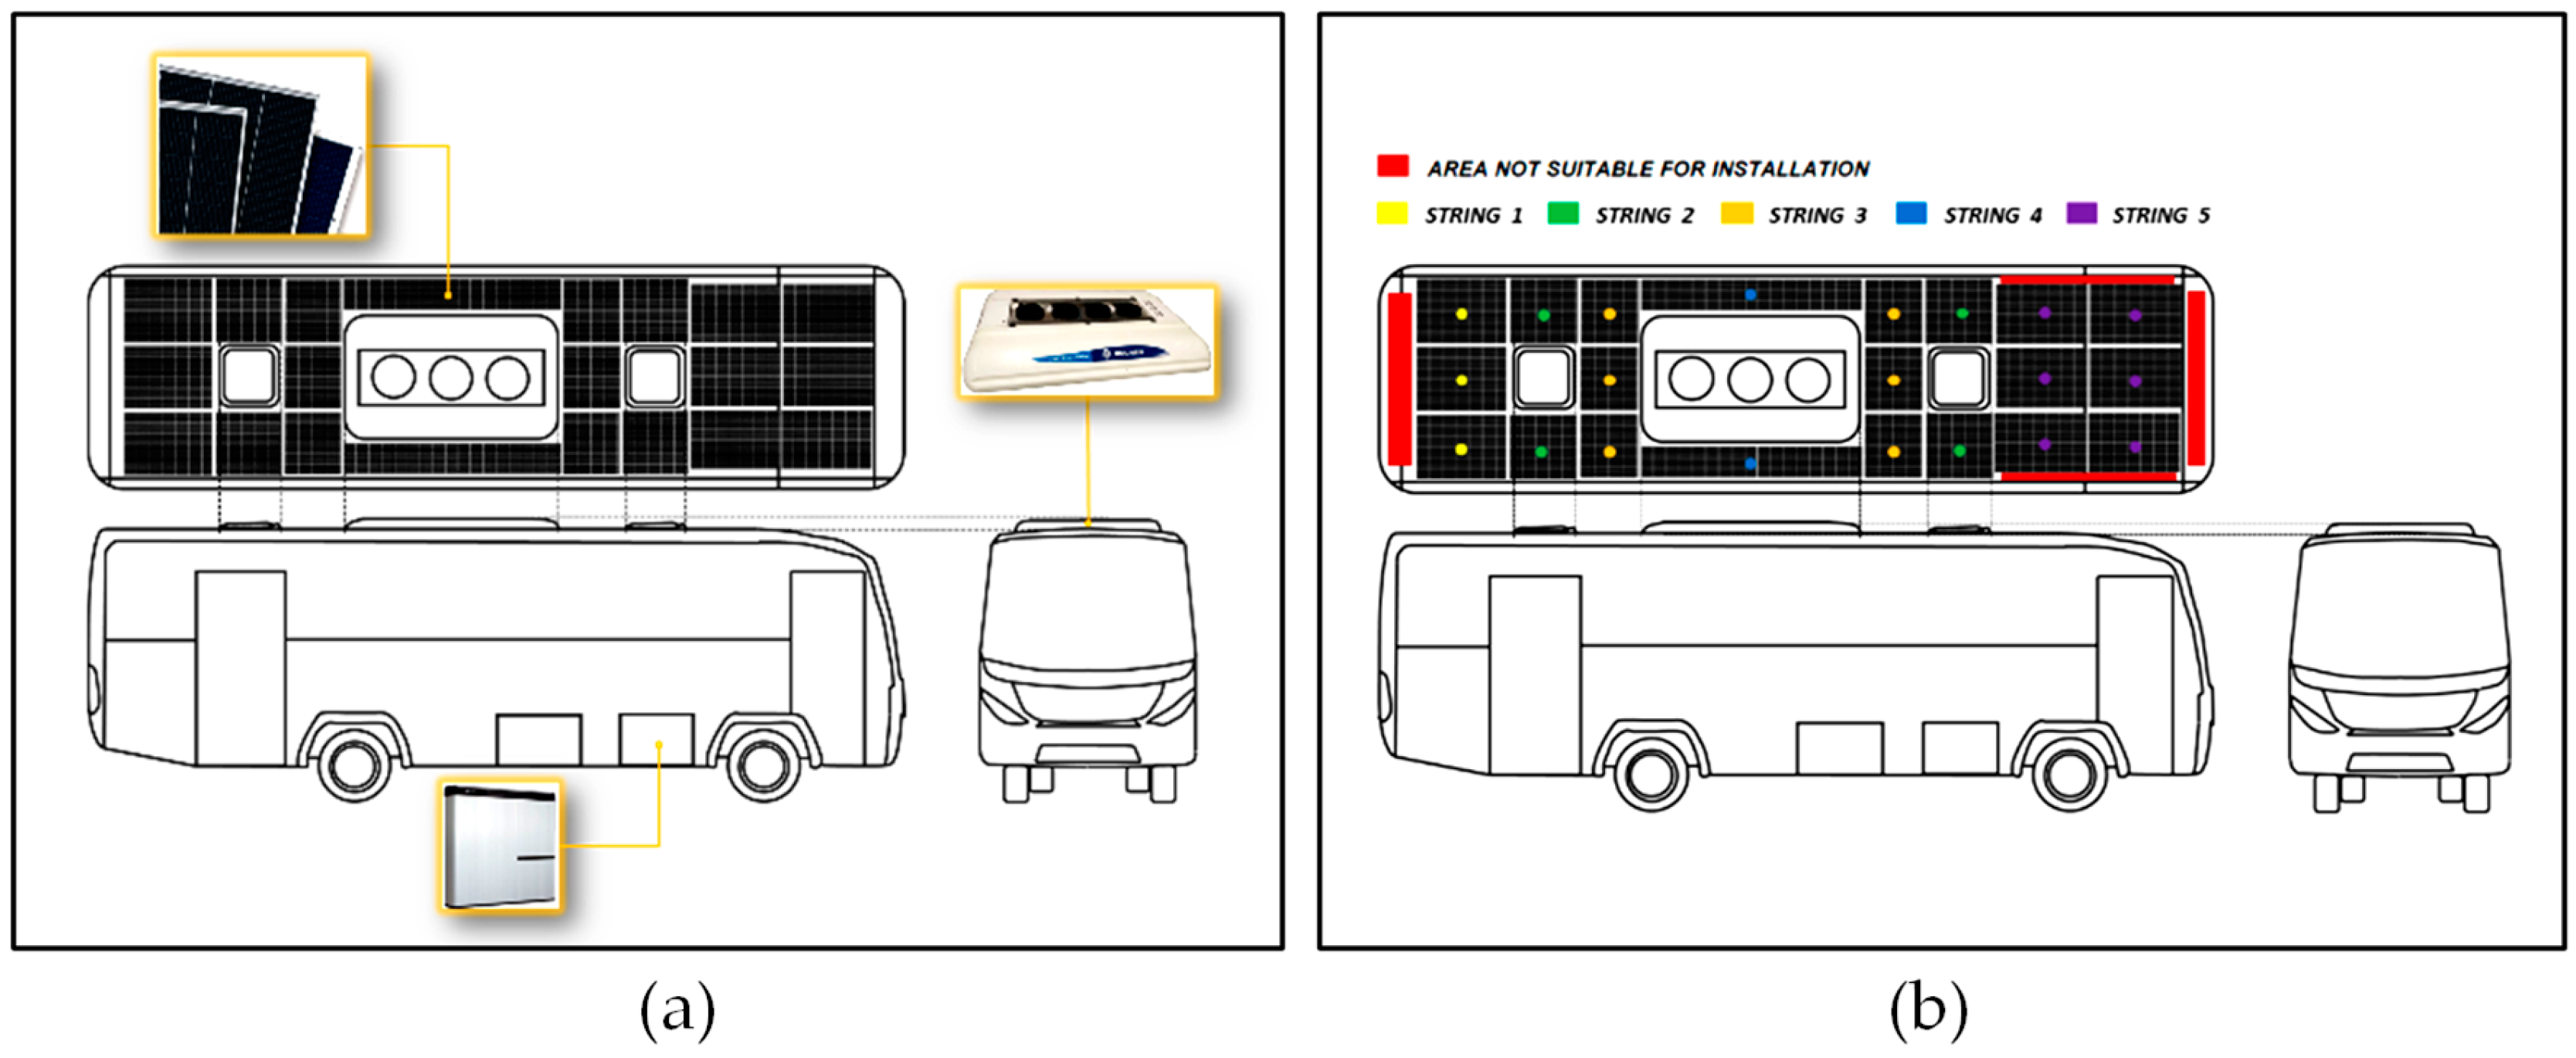
The selected photovoltaic panels, being flexible and with the possibility of being manufactured to the size requested by the client, the available area (not including the area occupied by the skylights and the air conditioning equipment) is an area that can be fully utilized. Therefore, to take full advantage of the dimensions of the photovoltaic panels, they were strategically established with the support of the photovoltaic panel supplier company Mr. Watt (see
Figure 3).
Based on the above, the generation block has 23 photovoltaic panels grouped into 5 different strings connected in series as shown in
Figure 4 (See
Figure 4b), using a string box to collect their voltage outputs.
2.2. Accumulation Block
It is made up of deep-cycle energy accumulators made of lithium-iron-phosphate with a built-in charge controller, with a storage capacity of 63 Ah each one, a voltage range of 430–550 V, DC, and 100% depth of discharge. Lithium-iron-phosphate accumulators were selected due to their great capacity to store energy, their high depths of discharge, for offering constant performance regardless of the temperature conditions in which they operate their charge density which allows storing a greater amount of energy occupying less space and its weight compared to stationary accumulators.
2.3. Load Block
It consists of an electric air conditioning unit located on the bus roof, which has the following nominal characteristics: a cooling capacity of 104,000 BTU, a nominal power of 8 kW (8000 W), a voltage of 500 V DC and current consumption of 16 A. The Guchen ES-05 equipment is recommended to be installed in buses with the characteristics of the bus model studied (class 1 buses with a single body with a maximum capacity of 60 passengers intended to provide collective public service within a municipal, district, and metropolitan radius of action) and that also operate in the climatic conditions of the Atlantic Coast, to guarantee a correct comfort temperature in the passenger compartment.
2.4. Functioning
The photovoltaic panels are responsible for providing the energy required by the air conditioning equipment. When the energy demand is lower than that generated, the excess energy charges the accumulators, which will be the energy backup during night hours or periods of low solar irradiation.
Figure 4a shows the general scheme of the installation. The photovoltaic panels, air conditioning equipment, and emergency exits are located on the bus roof, while the energy accumulators are in the lateral holds of the bus.
2.5. Starting Data
2.5.1. Daily Energy Consumption
The
Alianza Sodis company offers its services from 5:00 AM to 10:00 PM, which accounts for a total of 17 h per day, during which the air conditioning equipment remains in operation. However, these devices are typically switched off for 45 min while they are stationed, waiting for their next run. Four trips are made per day, which means that the equipment is switched off for approximately 3 h and remains in operation for a total of 14 h. Using Equation (1), the theoretical daily energy consumption of the air conditioning equipment was calculated based on the hours of operation and its nominal power.
In real operating conditions, energy losses occur in the installation. Therefore, the theoretical daily energy consumption value must be corrected using the installation performance ratio (PR) given in Equation (2), which breaks down each of the presented losses.
The criteria by which the different values for the energy loss coefficients present in Equation (2) were selected are based on considering the operating conditions of the system as close to reality as possible, to guarantee reliable results.
Table 1 shows these coefficients and their respective selection criteria. The selected values are as follows: K
b = 0.1; K
c = 0; K
v = 0.1; K
a = 0.002.
Loss coefficient due to accumulator performance : A value of 0.1 is assigned because the energy storage system will provide the necessary energy resource for the air conditioning equipment at night and on winter days when the values of solar radiation received are not sufficient for the photovoltaic system to provide the required energy resource. Therefore, it is assumed that the energy storage system will experience significant depths of discharge.
Loss coefficient in the inverter : A value of 0 is assigned because the installation is a photovoltaic installation isolated from the conventional electrical network. Therefore, it does not require an inverter to convert direct current into alternating current and vice versa.
Coefficient of various losses
: This coefficient considers the losses due to the joule effect and the general performance of the network.
Table 1 shows the range of referential values for this coefficient from which an average value of 0.1 is taken between the minimum and maximum value of the range.
Daily self-discharge coefficient
: This value is assigned according to the type of accumulator selected, in this case, a lithium-iron-phosphate accumulator was selected with low self-discharge values. Therefore, the assigned coefficient is 0.002. The
and
represent the depth of discharge of the selected accumulator established by the manufacturer and the number of days of autonomy of the installation, respectively. A value of 1 is selected since the selected accumulator allows a depth of discharge of 100%, and a value of 2 is chosen for the days of autonomy of the installation. The selection criteria for these last two values are explained in depth in numeral 2.7 (sizing of the energy storage system). The selected values are then replaced in Equation (2), and the actual daily energy consumption is calculated using Equation (3).
2.5.2. Solar Resource Available
To calculate photovoltaic production, it was necessary to estimate the available global horizontal solar irradiation in Barranquilla. To obtain this data, the information provided by the Atlas of Solar, Ultraviolet, and Ozone Radiation [
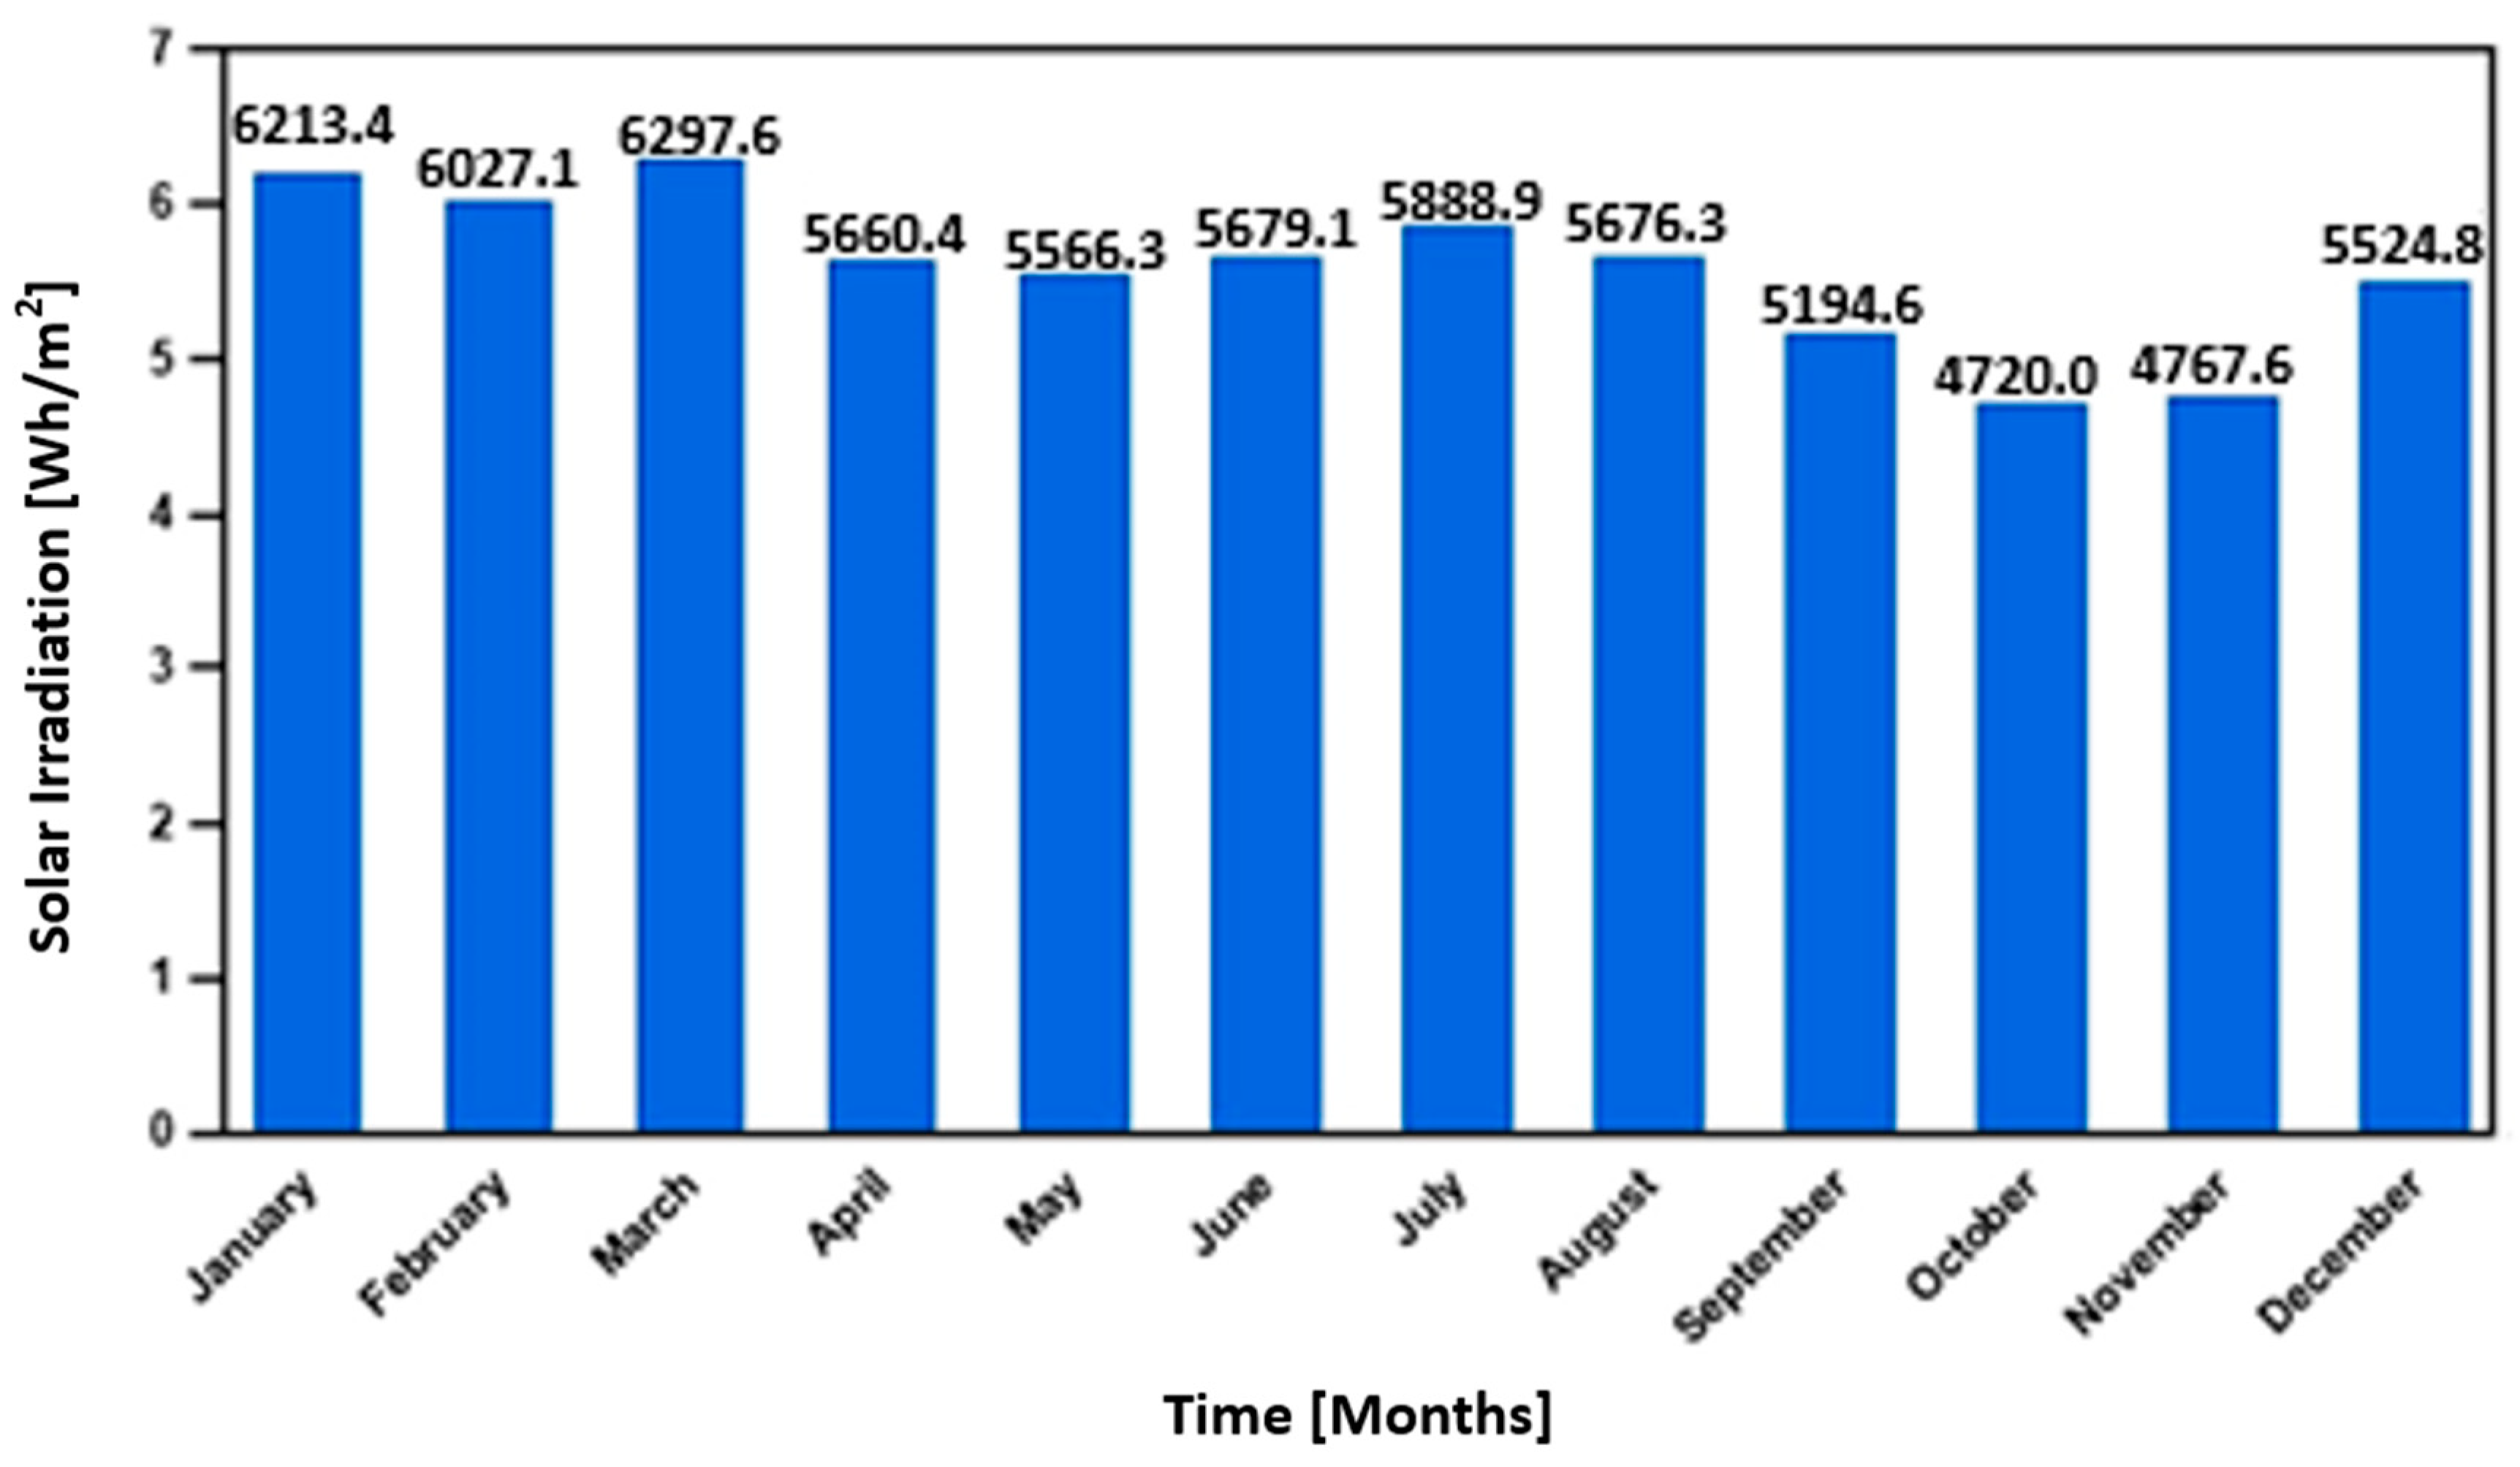
34] from the Institute of Hydrology, Meteorology, and Environmental Studies (IDEAM) for the year 2014 was used. October was selected as the design period, since it is the month with the lowest solar irradiation values, with a monthly average of 4720 Wh/m
2, as shown in
Figure 5.
The solar irradiation values presented are obtained for a horizontal or flat surface (
Gdm (
β = 0)). In the sizing of photovoltaic systems, it is customary to use solar irradiation in terms of Peak Sun Hours (
PSH), which is the ratio of solar irradiation in W/m
2 to the reference irradiance in standard conditions of measurement (
SCM). The equivalence of
Gdm (
β = 0) in
PSH can be calculated using Equation (4).
This means that during the day, there will be an equivalent of 4.72 h of sunshine with a constant solar irradiance of 1000 W/m2.
2.6. Sizing of the Photovoltaic System
To size the photovoltaic system, the reference guide used was the Technical Specifications for Off-Grid Photovoltaic Installations provided by the Institute for Energy Diversification and Saving (IDAE) [
33]. This guide considers the daily energy consumption of the equipment to be supplied, the solar resource available in Barranquilla, and the different losses present in the photovoltaic installation. Additionally, a safety factor of 1.2 was included to oversize the calculations and ensure the system’s reliability by compensating for any energy losses not considered.
The sizing calculation provides the power required to supply the air conditioning equipment, the size of the photovoltaic system, and its configuration, whether in series or parallel connection. The photovoltaic system sizing is carried out simultaneously with the analysis of the free space available on the bus deck. This analysis quantifies the area available for the installation of the panels, plans their organization, and finally maximizes the use of the available area. The power obtained from the installed panels is estimated and compared with the initially calculated requirement.
This comparison is then related to the fuel savings to be obtained since the goal is to determine whether the photovoltaic system fully meets the consumption needs of the air conditioning equipment or if a hybrid system is required. In a hybrid system, the total energy input is shared between the photovoltaic generator and the internal combustion engine of the bus (Diesel-Photovoltaic system).
Using the real daily energy consumption and the previously calculated peak sun hours, the nominal power required (
) for the photovoltaic generator is estimated using Equation (5).
2.7. Sizing of the Energy Storage System
For sizing the energy storage system, the “Amperes-Hour” method of [
34] was taken as a calculation guide. This method starts from the daily energy consumption in Amperes-hour of the equipment to be fed, incorporating the energy losses presented between the accumulator and the air conditioning equipment, the losses in the wiring, the days of autonomy of the installation in general, and the maximum depth of discharge of the selected accumulator. This calculation provides the following results: the required energy storage capacity in the accumulator, the size, and its configuration (series or parallel connection). The Guchen ES-05 unit works at 16 Amperes, and, since the unit will be in operation for 14 h a day, its daily consumption is calculated using Equation (6):
The value of daily consumption in Amperes-Hour must be corrected since the performance of the accumulator is not 100% and there are also losses in the wiring. For this reason, the performance factors for the accumulator and the wiring were included in the calculation. For the case of the LG Chem Resu 7H Type C accumulator, an efficiency of up to 95% is specified. The default value for the performance factor in the wiring is 98% so the losses in the circuits are less than 3%. The capacity of the accumulator is calculated using Equation (7):
The proposed range of days of autonomy (
) is from 2 to 5 days for non-critical systems [
34], which are systems that do not affect the physical integrity of the population in case of failure. Since the system is intended to power an air conditioning unit, it is considered non-critical because only the comfort conditions of the passenger compartment would be affected in case of failure. To maintain a balance between safety and economy, the (
) is established based on the climatological characteristics of Barranquilla. According to [
34], the maximum number of days without sunshine registered in Barranquilla is 1.71 days, which is the period during which the photovoltaic generator will not receive sufficient solar irradiation and, therefore, it will be the accumulator that provides the required energy. For 1.71 days is less than the minimum value allowed, an (
) equal to 2 is chosen. The (
) selected LG Chem Resu 7H Type C accumulator allows a depth of discharge of up to 100% without affecting its useful life; therefore, a value of 1 is chosen. Finally, since accumulators made from lithium-iron-phosphate are not affected by the temperature conditions in which they are operating, a temperature correction factor (n
temp) is not needed.
The number of accumulators required both in series and in parallel is calculated using Equations (8) and (9) based on the relationship between the required capacity in the accumulator and the capacity of the selected accumulator (63 Ah) and based on the relationship between the nominal voltage of the system and the nominal voltage of the selected accumulator, respectively.
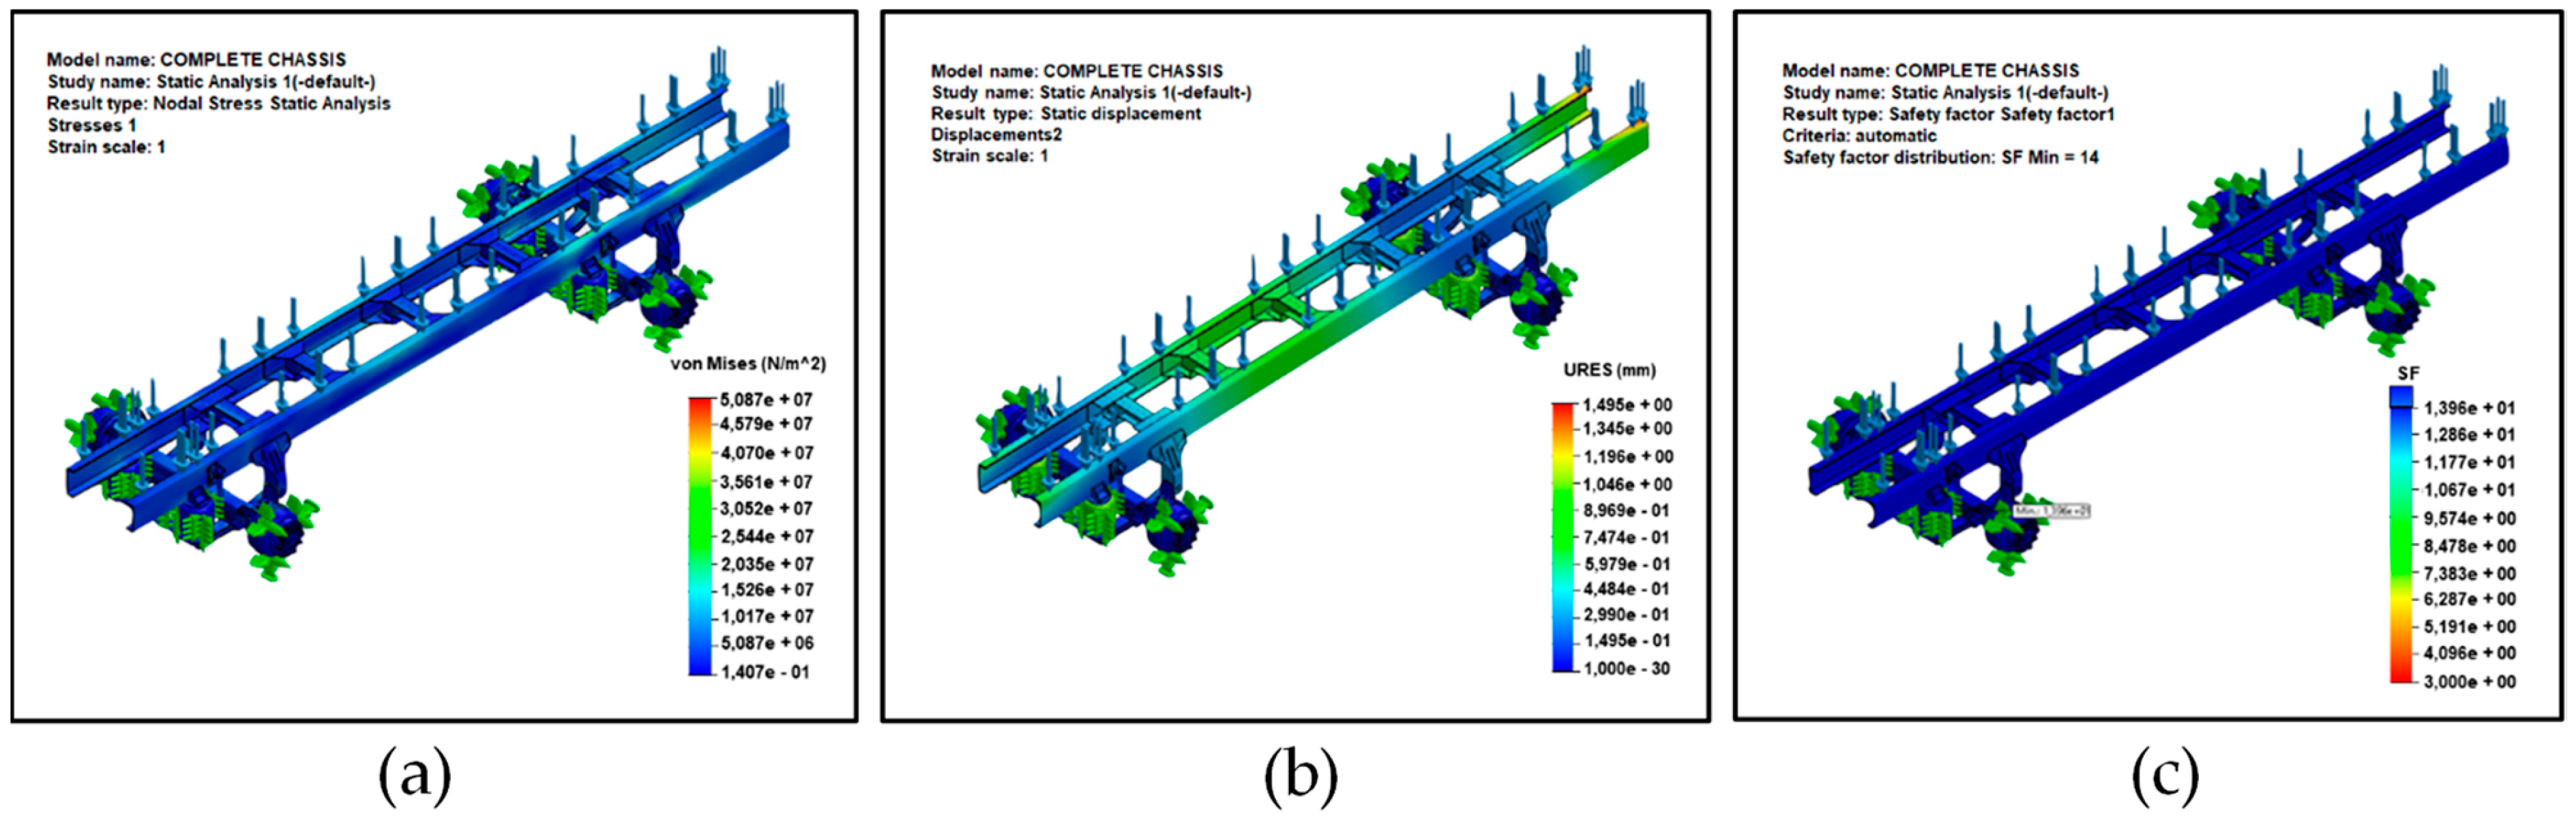
2.8. Stress Analysis on Chassis and Bodywork
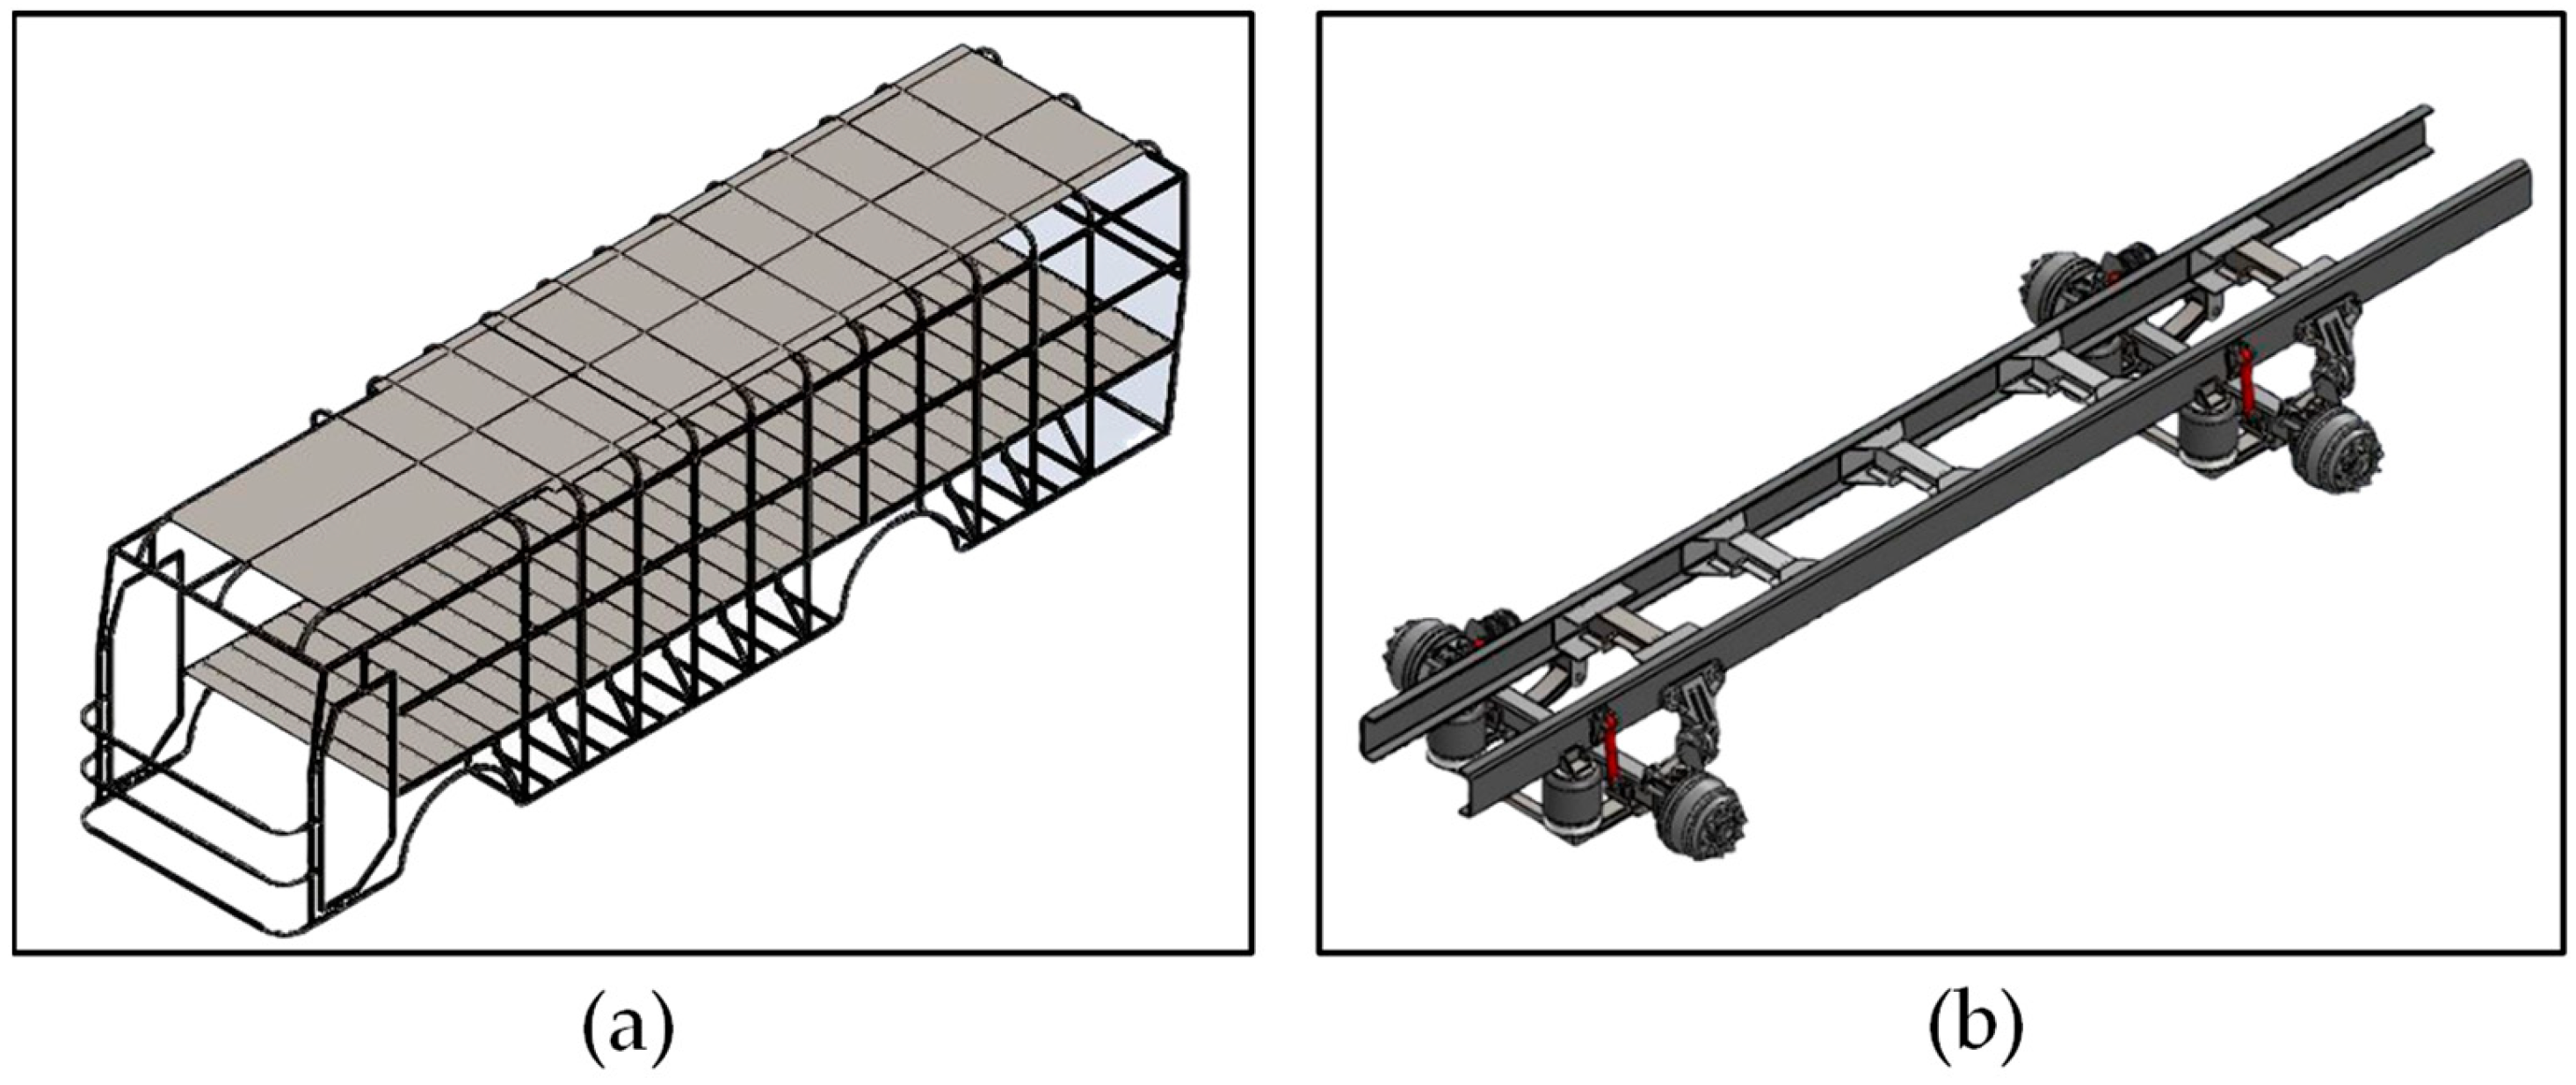
This analysis was carried out to observe whether the stresses, deformations, and safety factors in the chassis and bodywork remained within adequate values after adding the loads corresponding to the air conditioning equipment, photovoltaic panels, and energy accumulators. For modeling the chassis and bodywork (
Figure 6), SolidWorks mechanical design software was used, and normalized AISI 4340 steel (yield strength = 710,000,000 N/m
2) and AISI 1020 cold-rolled steel (yield strength = 350,000,000 N/m
2) were used as manufacturing materials for the chassis and body, respectively.
2.8.1. Applied Loads
The applied load is an important variable that must be considered. This is due to the dynamics of the flow of passengers who may be using the means of transport during a certain day of the year. The load directly influences not only the mechanical performance of the bus but also its thermal and energy performance. It is clear that the higher the load, by the principle of the first law of thermodynamics, the system as a whole will consume more energy to produce the same work. For this reason, this section will carry out a detailed analysis of the charging system associated with the bus.
The values of live loads were established based on the data provided by the Colombian Technical Standard NTC 5206 of 2009 for the manufacture of buses. The number of sitting passengers was assigned according to the available chairs in the analyzed bus model. The number of standing passengers was initially assigned according to the maximum average occupancy established by NTC 5206 of 2009, which allows for the location of 7 standing passengers per free square meter in the aisle. However, consultations with the company
Alianza Sodis indicate that the bus can carry up to 31 standing passengers during peak hours. A mass of 3 kg, corresponding to the mass of the hand luggage of class 2 buses, is included as it is common for passengers to carry hand luggage. The mass of roof luggage is not included, as the analyzed bus does not have an upper luggage compartment. The above data are summarized in
Table 2.
The mass of photovoltaic panels varies according to their dimensions, those panels with commercial dimensions already have a certain mass; however, the mass of panels made to measure depends directly on the number of photovoltaic cells that comprise it. Since each of the photovoltaic strings located on the bus roof is made up of panels with different dimensions, an average mass of 2.3 kg for each of them is assumed for simplicity. Loads of the air conditioning equipment and the LG Chem Resu 7H Type C energy accumulators are consulted in the respective catalogs [
33,
34], the mass of the chairs is assumed to equal 5 kg, and finally, the mass of the chassis and bodywork is found in the AA-70310 homologation of the Ministry of Transport, homologation corresponding to the FRR Forward Euro IV analyzed bus model [
36]. The mass of the chassis includes the mass of each of the mechanical, electrical, and electronic elements that make it up. All these loads are shown in
Table 3.
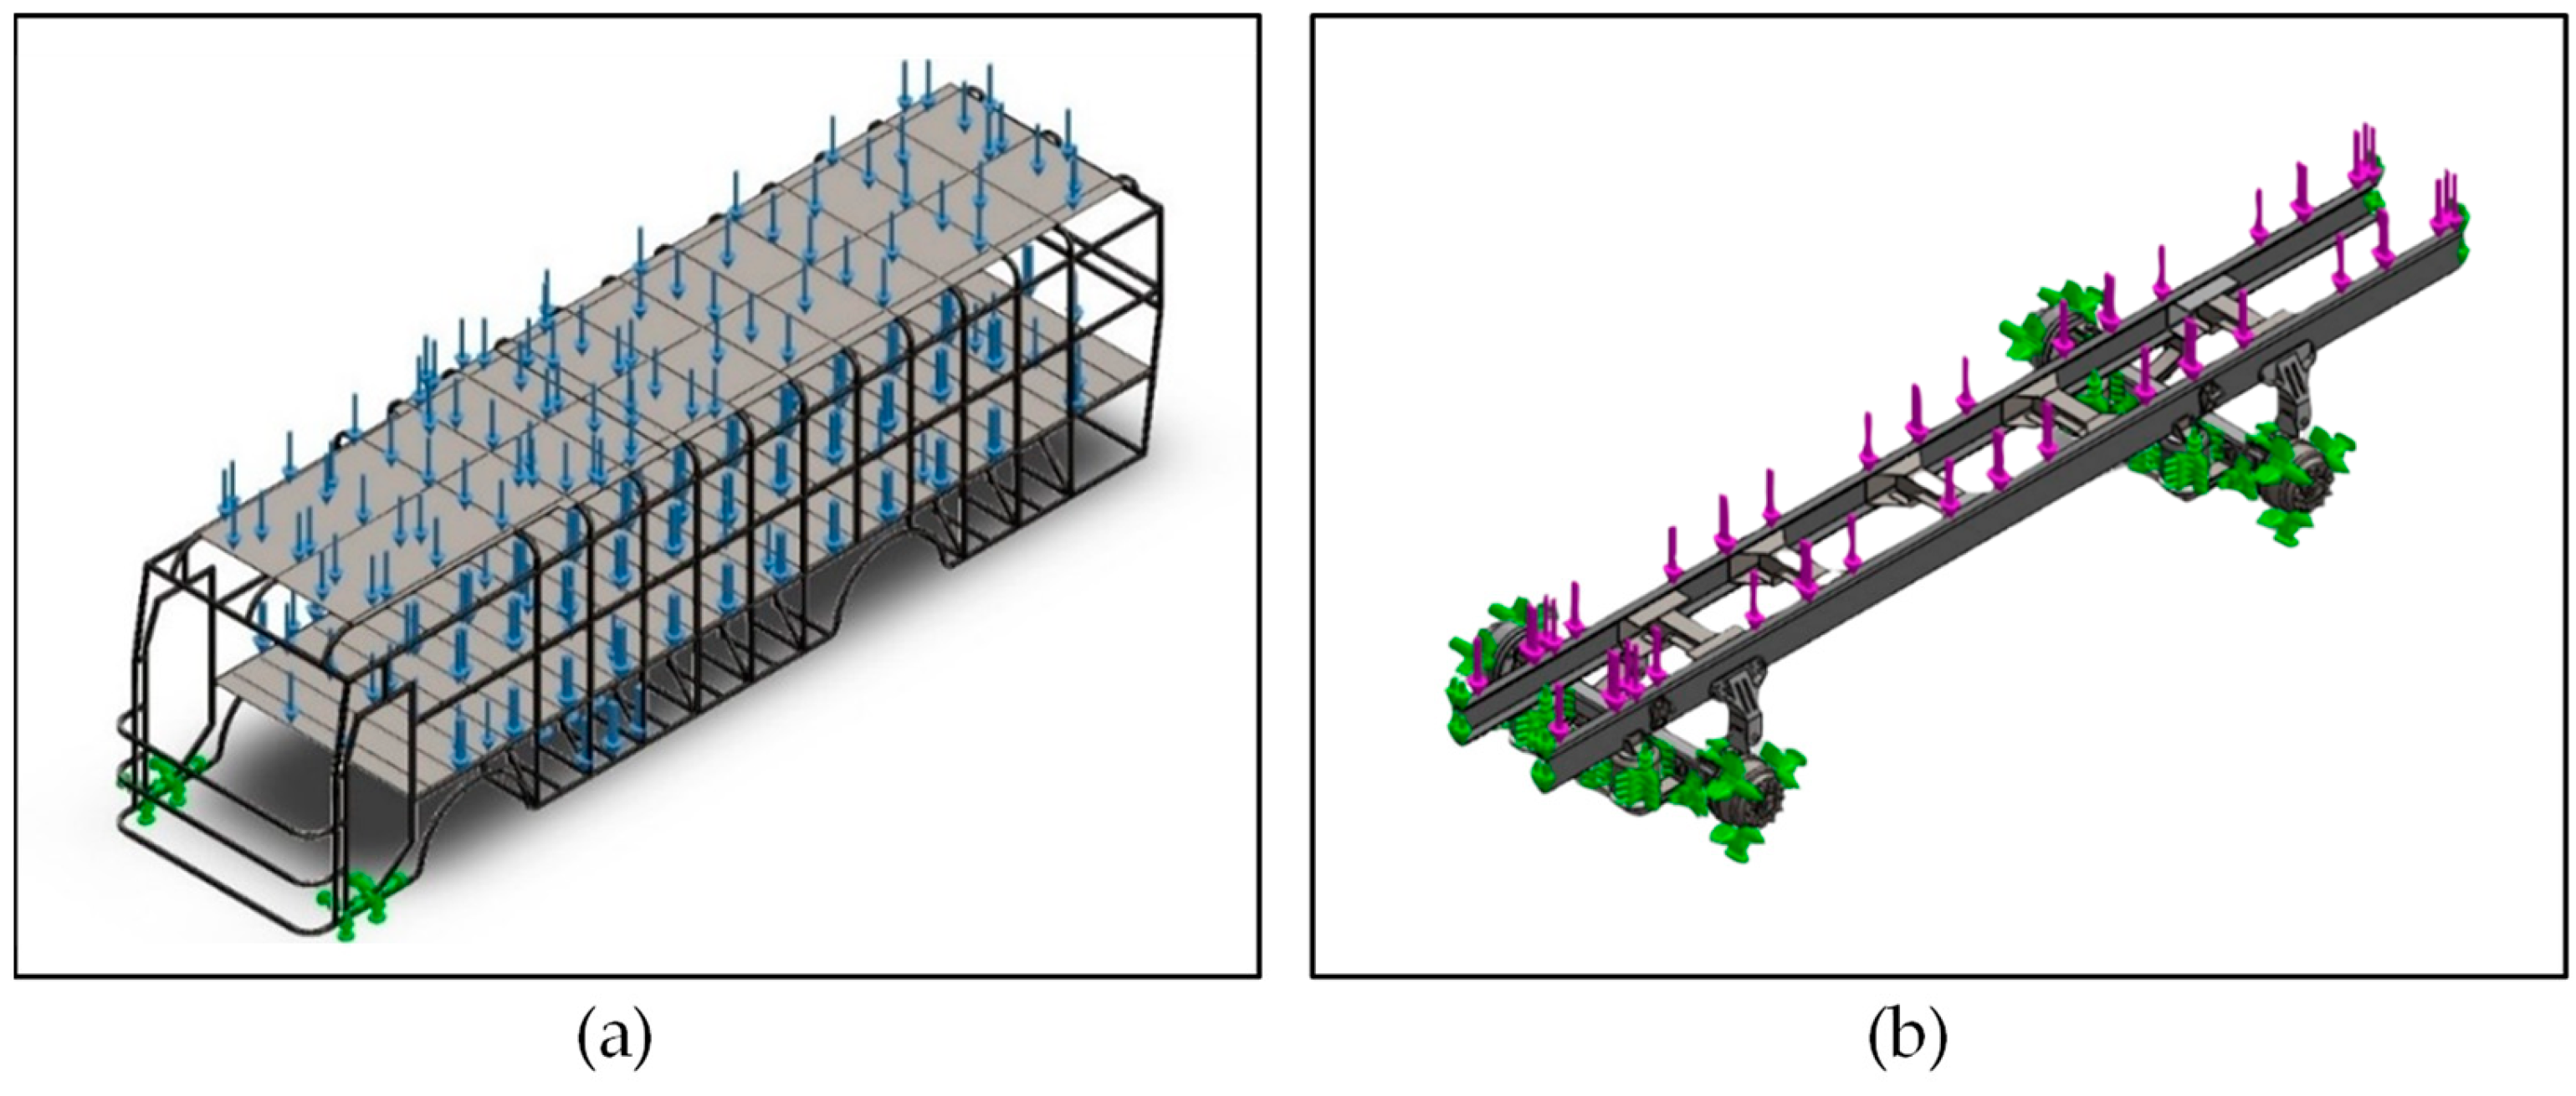
Figure 7 shows the location of the loads of the photovoltaic panels and air conditioning equipment on the bus roof. The gray surface in the center of the roof represents the location of the air conditioning equipment load, while the yellow, green, red, and blue surfaces represent the location of the photovoltaic panel loads grouped by string. Additionally, the gray surfaces in front of and behind the air conditioning equipment represent the location of the emergency exits. There are also surfaces corresponding to the bus floor and the location of the energy accumulators behind the front wheels. Each load is assumed to be uniformly distributed over its respective surface. An overload factor of 40% was applied to the total loads to account for oversizing and safety considerations.
2.8.2. Simulation Details
Static analysis simulations were carried out on the generated model (see
Figure 8). Before this, a respective mesh convergence analysis was performed to ensure precision in the results, with an acceptable error margin of less than 1%. A high-order quadratic element mesh was used, composed of 80,505 elements connected by 168,664 nodes in the chassis. In the bodywork, a high-order quadratic element mesh was used, composed of 3,896,208 elements connected by 7,710,240 nodes. For the sake of simplicity, the simulation was divided into two parts. The first part involved simulating the bodywork independently of the chassis, supporting the live and dead loads, which are organized and shown in
Table 4. In the second part, the chassis was simulated independently of the bodywork, applying a load of 14,805 kg. This load corresponds to the sum of all the live and dead loads shown in
Table 2 and
Table 3, respectively, which were increased by 40% due to the overload factor. A minimum of 16 GB RAM and an 8-core processor was required for the computer equipment used.
2.9. Economic Study
Finally, an economic analysis of the project was conducted based on the results obtained from sizing the photovoltaic and energy storage system, as these results influence the cost of the necessary technological equipment. After establishing the investment parameters, this study determined the project’s profitability using established evaluation criteria, including the use of the Net Present Value (NPV) and the Internal Rate of Return (IRR) indices. Additionally, the return-on-investment time was estimated. The economic study focused primarily on the following two independent variables:
In this case, an evaluation period of 30 years was established, given that the selected photovoltaic panels guarantee a useful life with adequate operation during this period. The resulting cash flow corresponds to the annual difference between the income and expenses generated by the project during the evaluated period. Aspects such as the initial investment, operation, and maintenance costs, fuel price, component replacements, inflation, depreciation, and useful lifetime were taken into consideration.
2.9.1. Expenses Analysis
The project costs are derived from the size and design of the photovoltaic installation. These costs consist of the initial investment, maintenance costs, and reinvestments due to the replacement of components, with the initial investment being the value required to start up the project. The initial investment includes the cost of the following items: photovoltaic modules, panel supports, lithium-iron-phosphate energy accumulators, wiring, electrical protections, labor, administration costs, contingencies, and utilities of the company Alianza Sodis.
The operational costs are the costs related to the functioning or operation of the project. These costs are generally classified into variable costs and fixed costs. In the case of a photovoltaic installation, the costs do not depend on the level of production. For this reason, only fixed costs are considered, which correspond to the annual cost of preventive and corrective maintenance of all the components of the installation to keep them in good operating conditions and maintain their useful life up to the time specified by the manufacturer. The annual maintenance cost is estimated at 0.25% of the total initial investment. This annual maintenance cost must be updated every year since it increases due to inflation. To estimate this, the evolution of the Consumer Price Index (CPI) is considered, based on historical data from the National Administrative Department of Statistics (DANE) [
37], with an estimated increase of 3.99% each year (see
Table 5).
The useful life for the selected energy accumulators (with built-in charge controller) is 10 years, for this reason, the cash flow of the project includes the costs of replacing the accumulators twice during the 30-year evaluation period. The demand for lithium-based accumulators has increased in recent years, which favors the reduction of their sale costs since it would allow a reduction in manufacturing costs, improvement in economies of scale, reduction in the cost of the raw materials, improved performance, and increased energy density offered, thus making photovoltaic projects increasingly profitable. The reduction of these sale costs is described in detail in numeral 3.5.
2.9.2. Income Analysis
The income generated by the project corresponds to the fuel savings resulting from the added value of the bus’s electric Guchen ES-05 air conditioning unit. The fuel savings are generated because the air conditioning unit is electric and does not require the internal combustion engine to operate. The quantification of these fuel savings is based on data provided by the transport company
Alianza Sodis, which allows for a comparison between the fuel consumption of two FRR Forward Euro IV model buses, one with air conditioning equipment and the other without said equipment. This comparison allows for an estimate of the average increase in annual fuel consumption generated by this bus model when using air conditioning equipment, which is the increase that the photovoltaic system and energy storage aim to compensate for. The fuel savings vary annually due to fluctuations in the price of ACPM, which is why an average annual growth rate is estimated using historical ACPM price data in Barranquilla from the Ministry of Mines and Energy’s Hydrocarbons section [
16]. These values are presented monthly, and the values for each of the 12 months are averaged to obtain annual values, allowing for the establishment of an average annual growth rate for ACPM.
Based on the above, an average annual increase in fuel savings of 7.857% is estimated. Therefore, the fuel savings over time will not be linear but rather increasing. Both inflation and the average annual rate of increase of the ACPM are important considerations when scheduling the cash flow for the economic analysis of the project.
2.9.3. Indices and Evaluation Criteria
Based on the above, the evaluation criteria for the project will be the Net Present Value (NPV) and the Internal Rate of Return (IRR). The NPV will be calculated by algebraically adding the cash flows of the project, considering the income and expenses presented during the evaluated time horizon. The project will be considered profitable if the calculated NPV is greater than or equal to zero, which means that the present value of expenses is less than the present value of income [
38]. On the other hand, the IRR represents the discount rate that causes the present value of income to be equal to the present value of expenses, which makes the NPV zero. The project will be considered profitable if the calculated IRR is higher than the minimum rate of return imposed on the investment, thus generating higher profitability in the project than required [
38].
4. Discussion
The economic study involves the investment in technological components required for the proposed alternative solution. The study was based on the resulting cash flow, and the evaluation indices are as follows: NPV = 22,817 USD and IRR=11.05%. For precision, Microsoft Excel software functions were used. The return on investment of the project is estimated to be 13 years after its start-up. The calculated NPV is positive, indicating that the project will bring in net benefits. The IRR of 11.05% suggests that a return on investment will be achieved, and the degree of acceptance will depend on the transport company’s minimum rate of return required according to its financial standards. The 13-year return time indicates that the project will remain profitable for the remaining 17 years of its useful life, which is an attractive value.
The initial approach used flexible panels made to measure based on the free spaces on the bus roof, considering the location of the air conditioning equipment and two emergency exits. The photovoltaic panels enable maximum use of the available roof spaces, including the curved areas between the roof and the top of the windows located on the sidewalls of the bus, the panoramic, and the rear window. However, the 23 panels installed on the bus roof do not provide the total power required. As a result, the initial approach is considered technically infeasible. Despite this, the bus’s chassis and bodywork would support the loads corresponding to each of the technological components if the implementation were carried out. The feasibility of this implementation may improve in a few years as the energy efficiency of current photovoltaic technologies improves simultaneously with the air conditioning equipment’s energy consumption improvement.
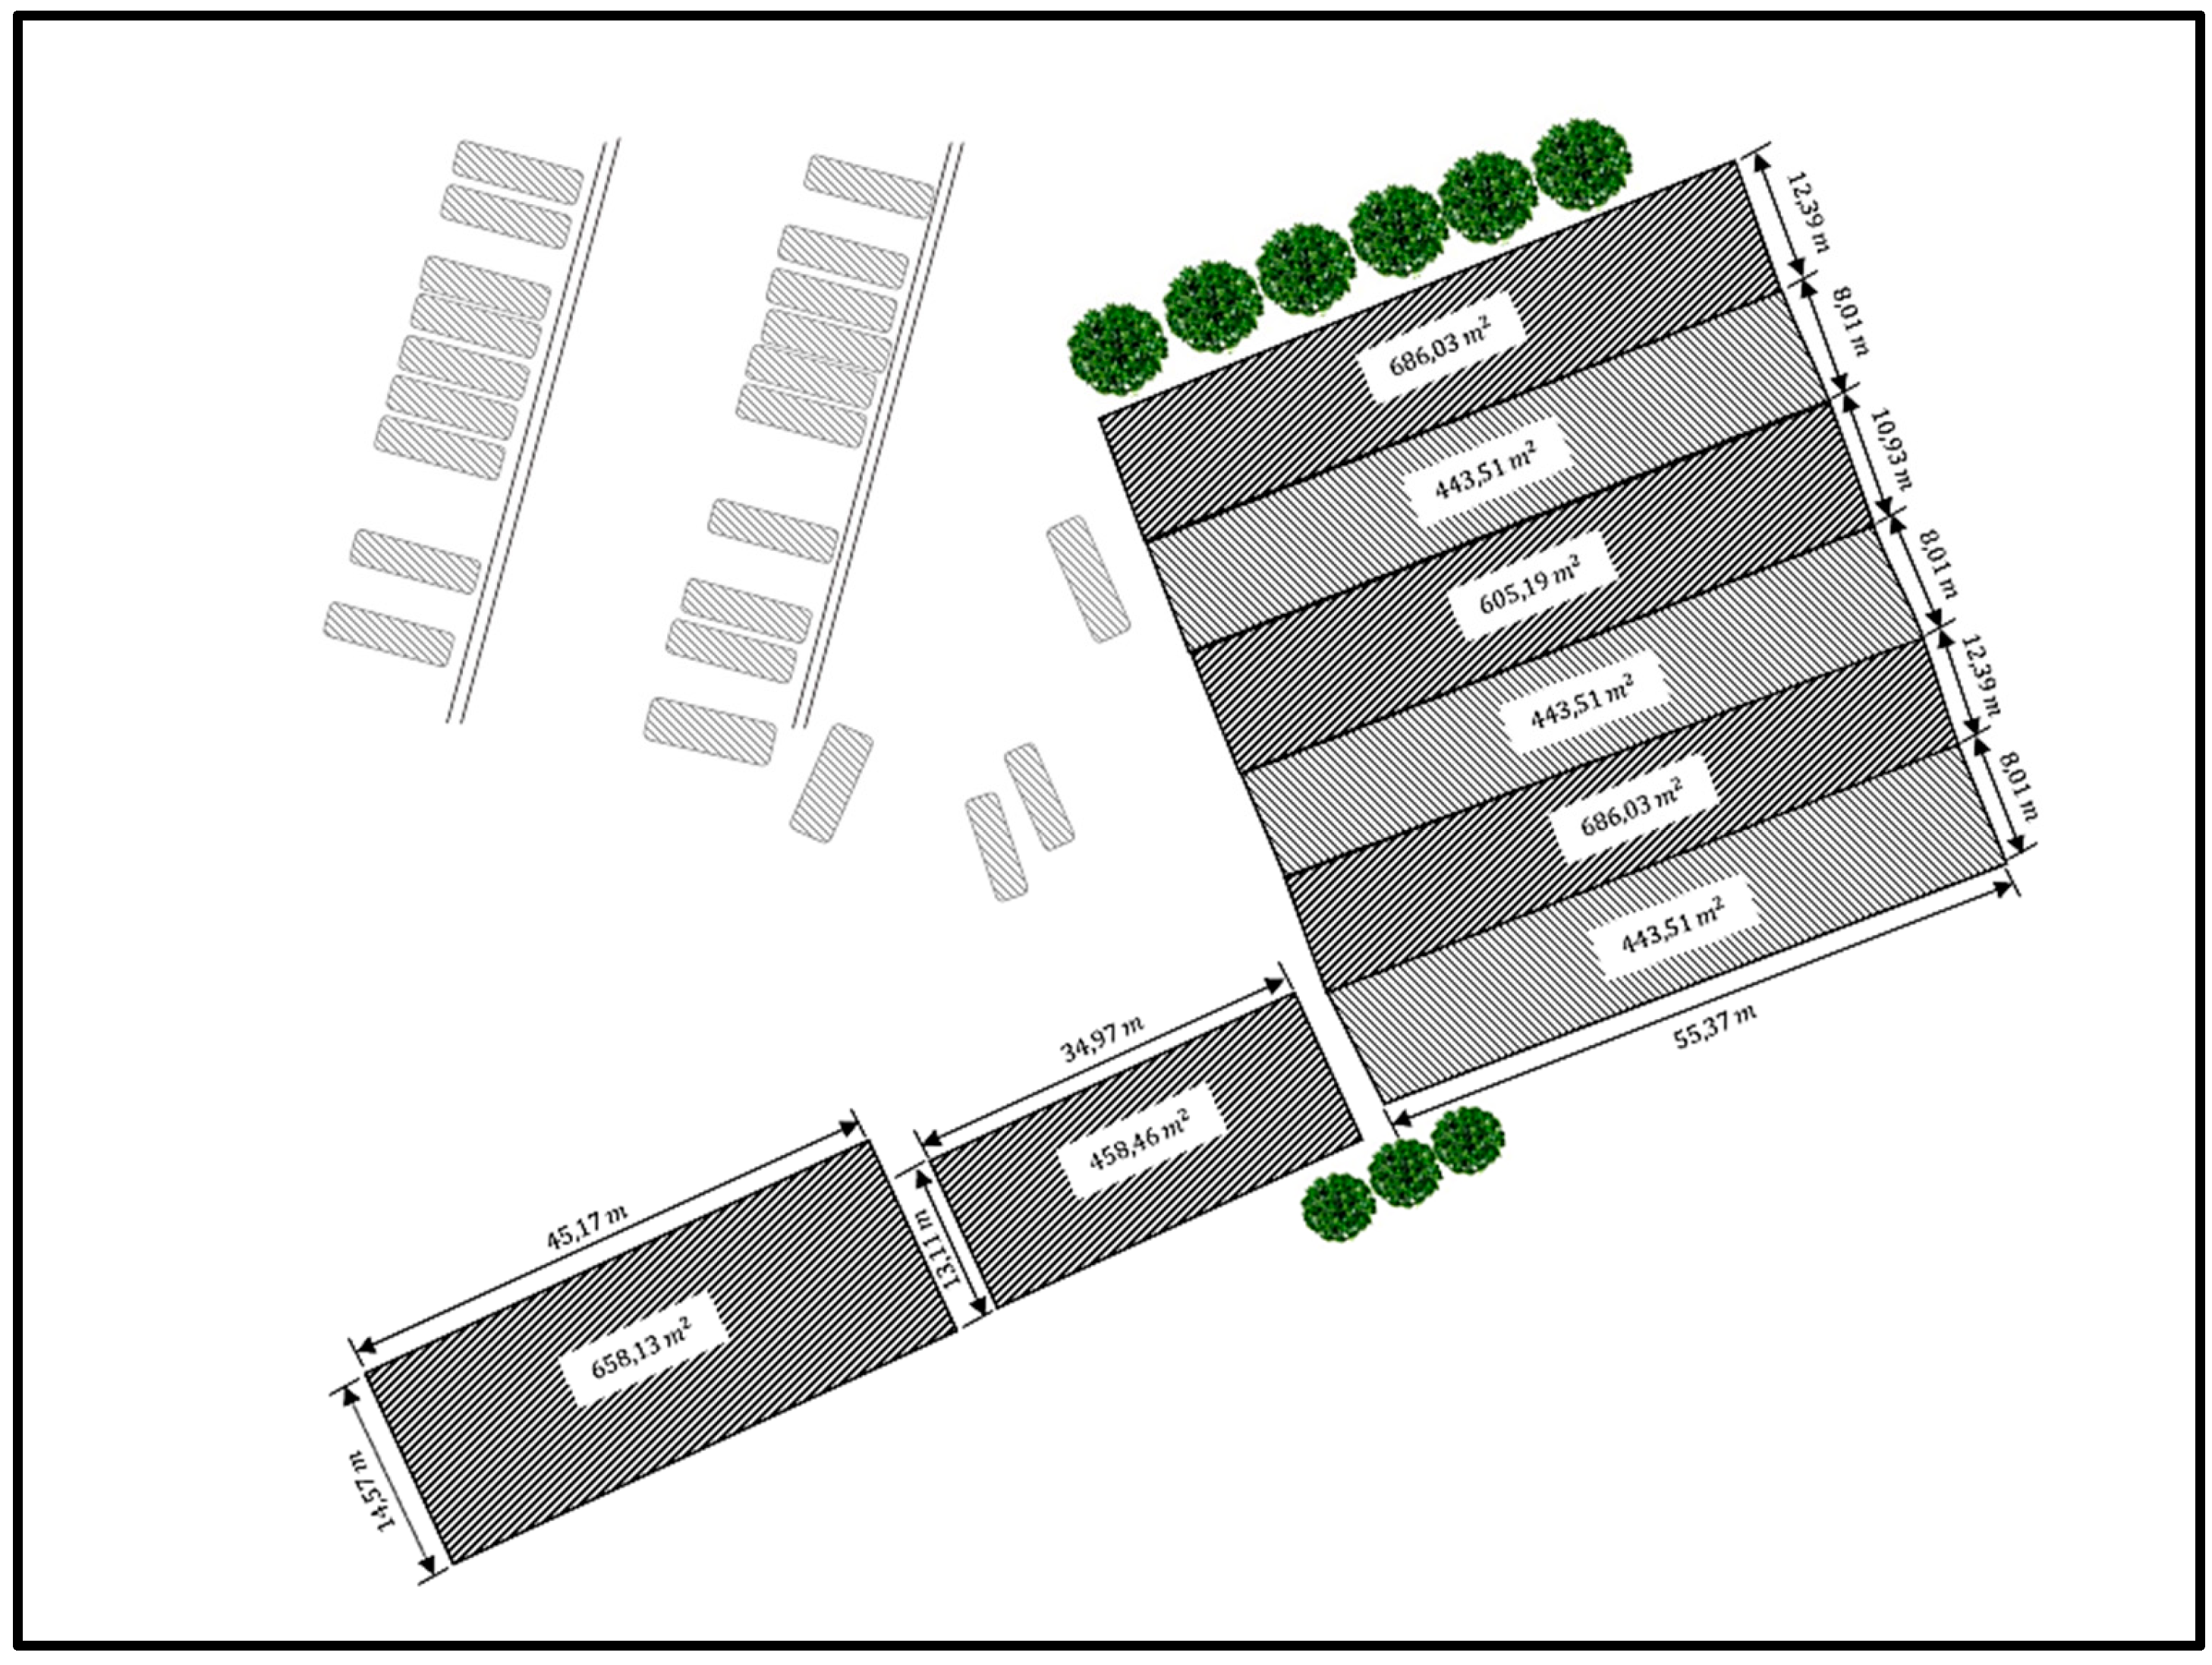
The transport company Alianza Sodis has approximately 4422 m2 available on their roofs, and the total number of panels required occupies a total area of 170 m2. The proposed alternative solution is technically feasible, and a detailed study should be carried out. Even though the generator is not located on the bus roof, the photovoltaic energy will still be responsible for supplying the air conditioning equipment through energy accumulators.
The energy accumulators made of lithium-iron-phosphate currently have a high sale cost compared to the other components of the photovoltaic installation. Moreover, these accumulators offer an average useful life of 10 years, meaning that they must be replaced with entirely new ones after 10 years, requiring two replacements in the project’s 30-year useful life. The high sale costs of the accumulators and their replacements decrease the project’s profitability. However, the
Alianza Sodis company can access the benefits offered by the Clean Energy Law 1715 of 2014 [
33], which could reduce the initial investment, decrease the return time, and improve the project’s general profitability.
In addition, it is important to highlight that considering the environmental aspect, the results confirmed that the use of this technology has a positive impact on the search for the reduction of polluting emissions, once clean and renewable energy such as solar energy is used. On the other hand, this work shows that, unquestionably, measures associated with the use of renewable energy must be included in the framework of the public policies of the city of Barranquilla and extended throughout the Colombian territory. The scientific community in general, as shown in the review of the specialized literature, agrees that the use of solar panels in the transportation system is a more than interesting alternative to support the development of the agendas of international states. In addition, the use of alternative energy not only contributes to economic and social development, but also, from the technical and environmental point of view, the positive impact is considerable. Finally, from the social point of view, this work showed that qualified labor is required to technically attend to this energy generation alternative in the transportation system. In this way, with the purpose of having qualified labor, a transcendental result is that the Colombian state makes efforts to strengthen technical and industrial knowledge in this type of technology for the use of clean energy. In this way, the implementation of solar panels in the transport system has been analyzed considering the energy, economic, technical, and social aspects, which are essential for decision-making that directly impacts the national energy matrix, the country’s economy, as well as social policies.
5. Conclusions
This study examined the feasibility of implementing photovoltaic panels on public transportation in Barranquilla to power air conditioning units, without significantly increasing fuel consumption. The initial approach showed technical infeasibility due to the limited space available on the bus roof and the low energy efficiency of current photovoltaic technology. The daily energy consumption of the air conditioning equipment required a nominal power of 35.73 kW in the photovoltaic generator, while the photovoltaic generator on the bus roof only provided 3.38 kW or 9.46% of the required power.
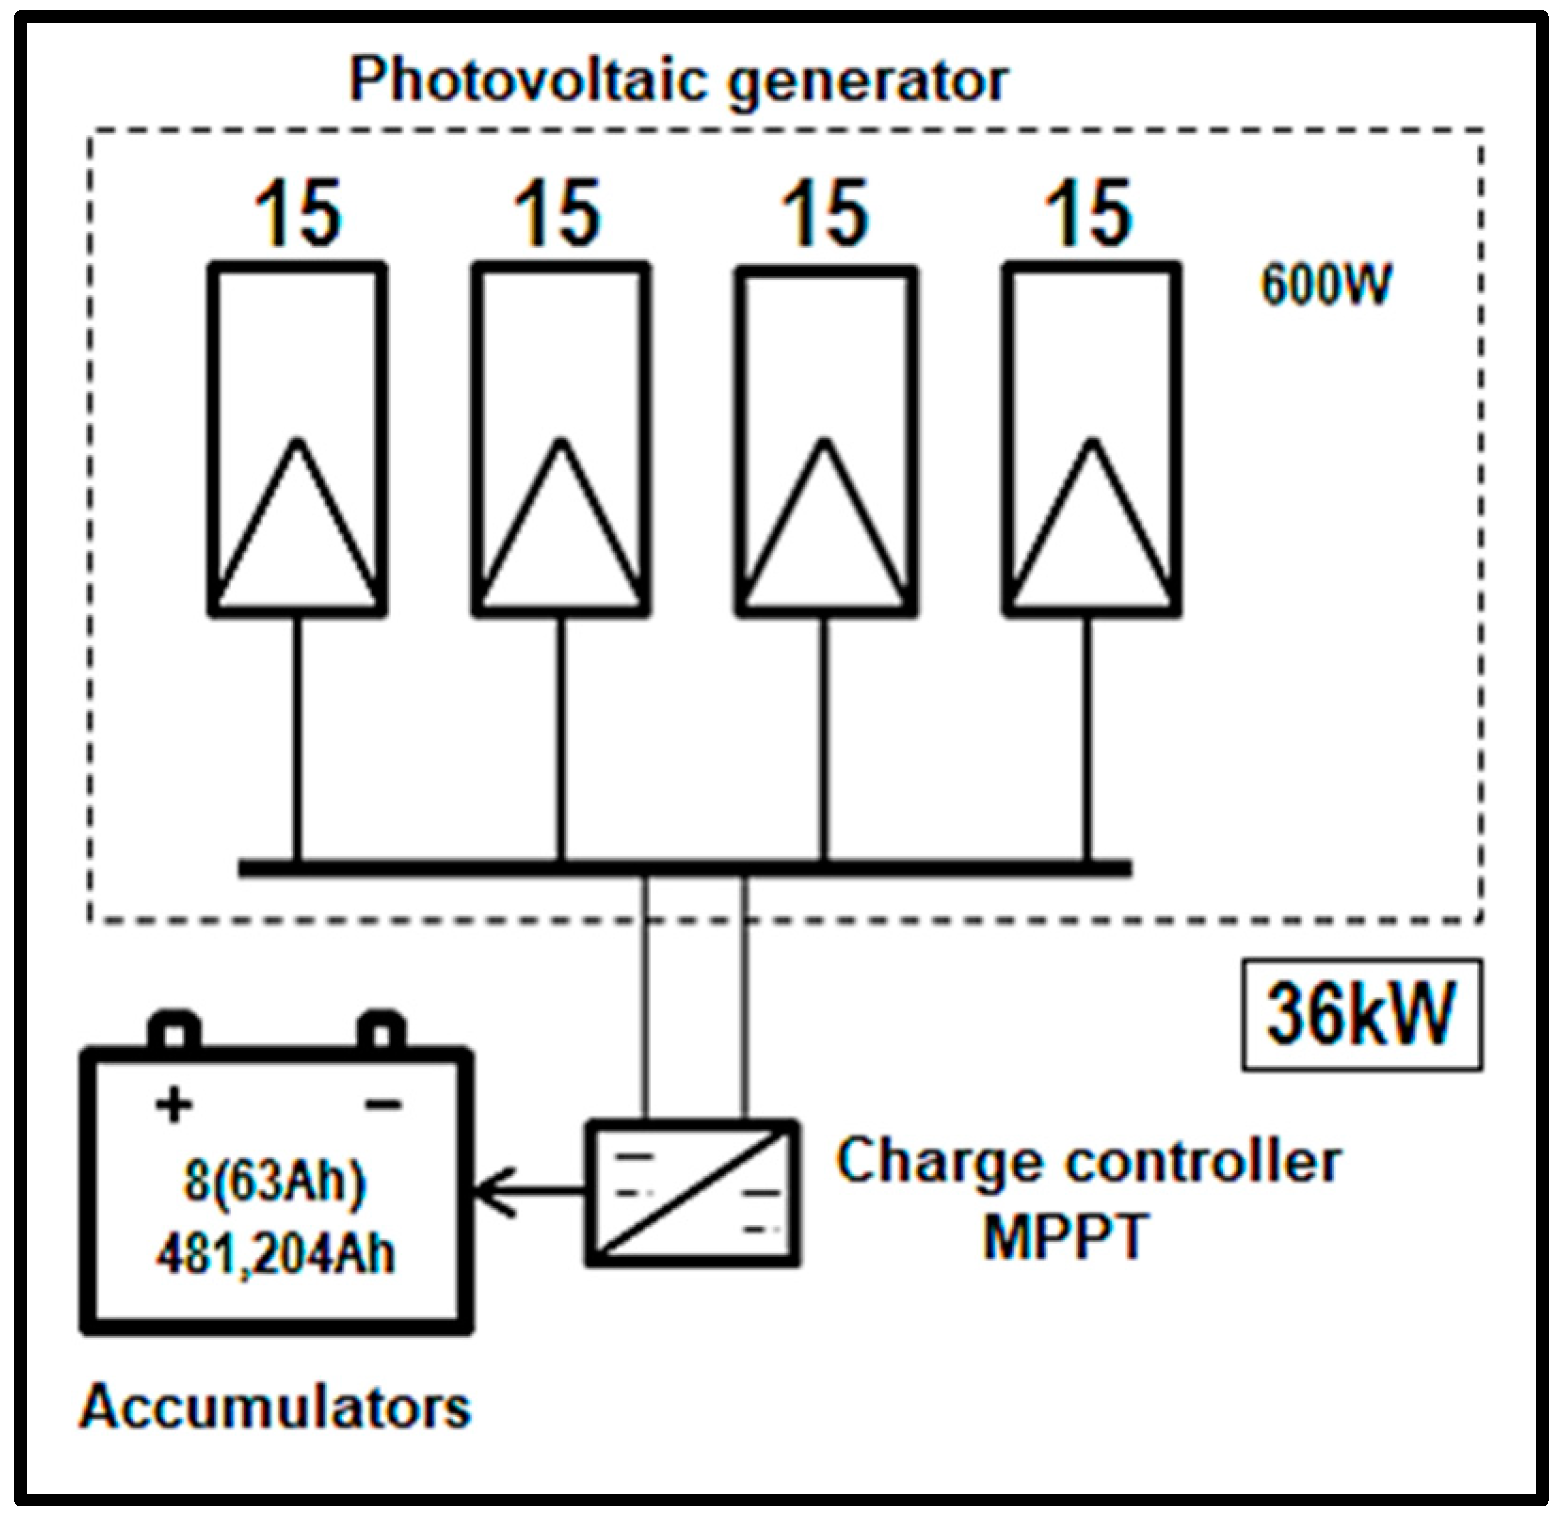
As a solution to the initial approach, the proposal to locate the photovoltaic generator on the facilities of transport company
Alianza Sodis turned out to be technically and economically viable. Installing a photovoltaic generator with 60 monocrystalline rigid panels of 600 W each, configured as shown in
Figure 14, could provide the required power of 35.73 kW to satisfy the daily energy consumption of the air conditioning equipment. The roofs of
Alianza Sodis provided enough space (4422 m
2) to install the photovoltaic generator, which occupied only 170 m
2.
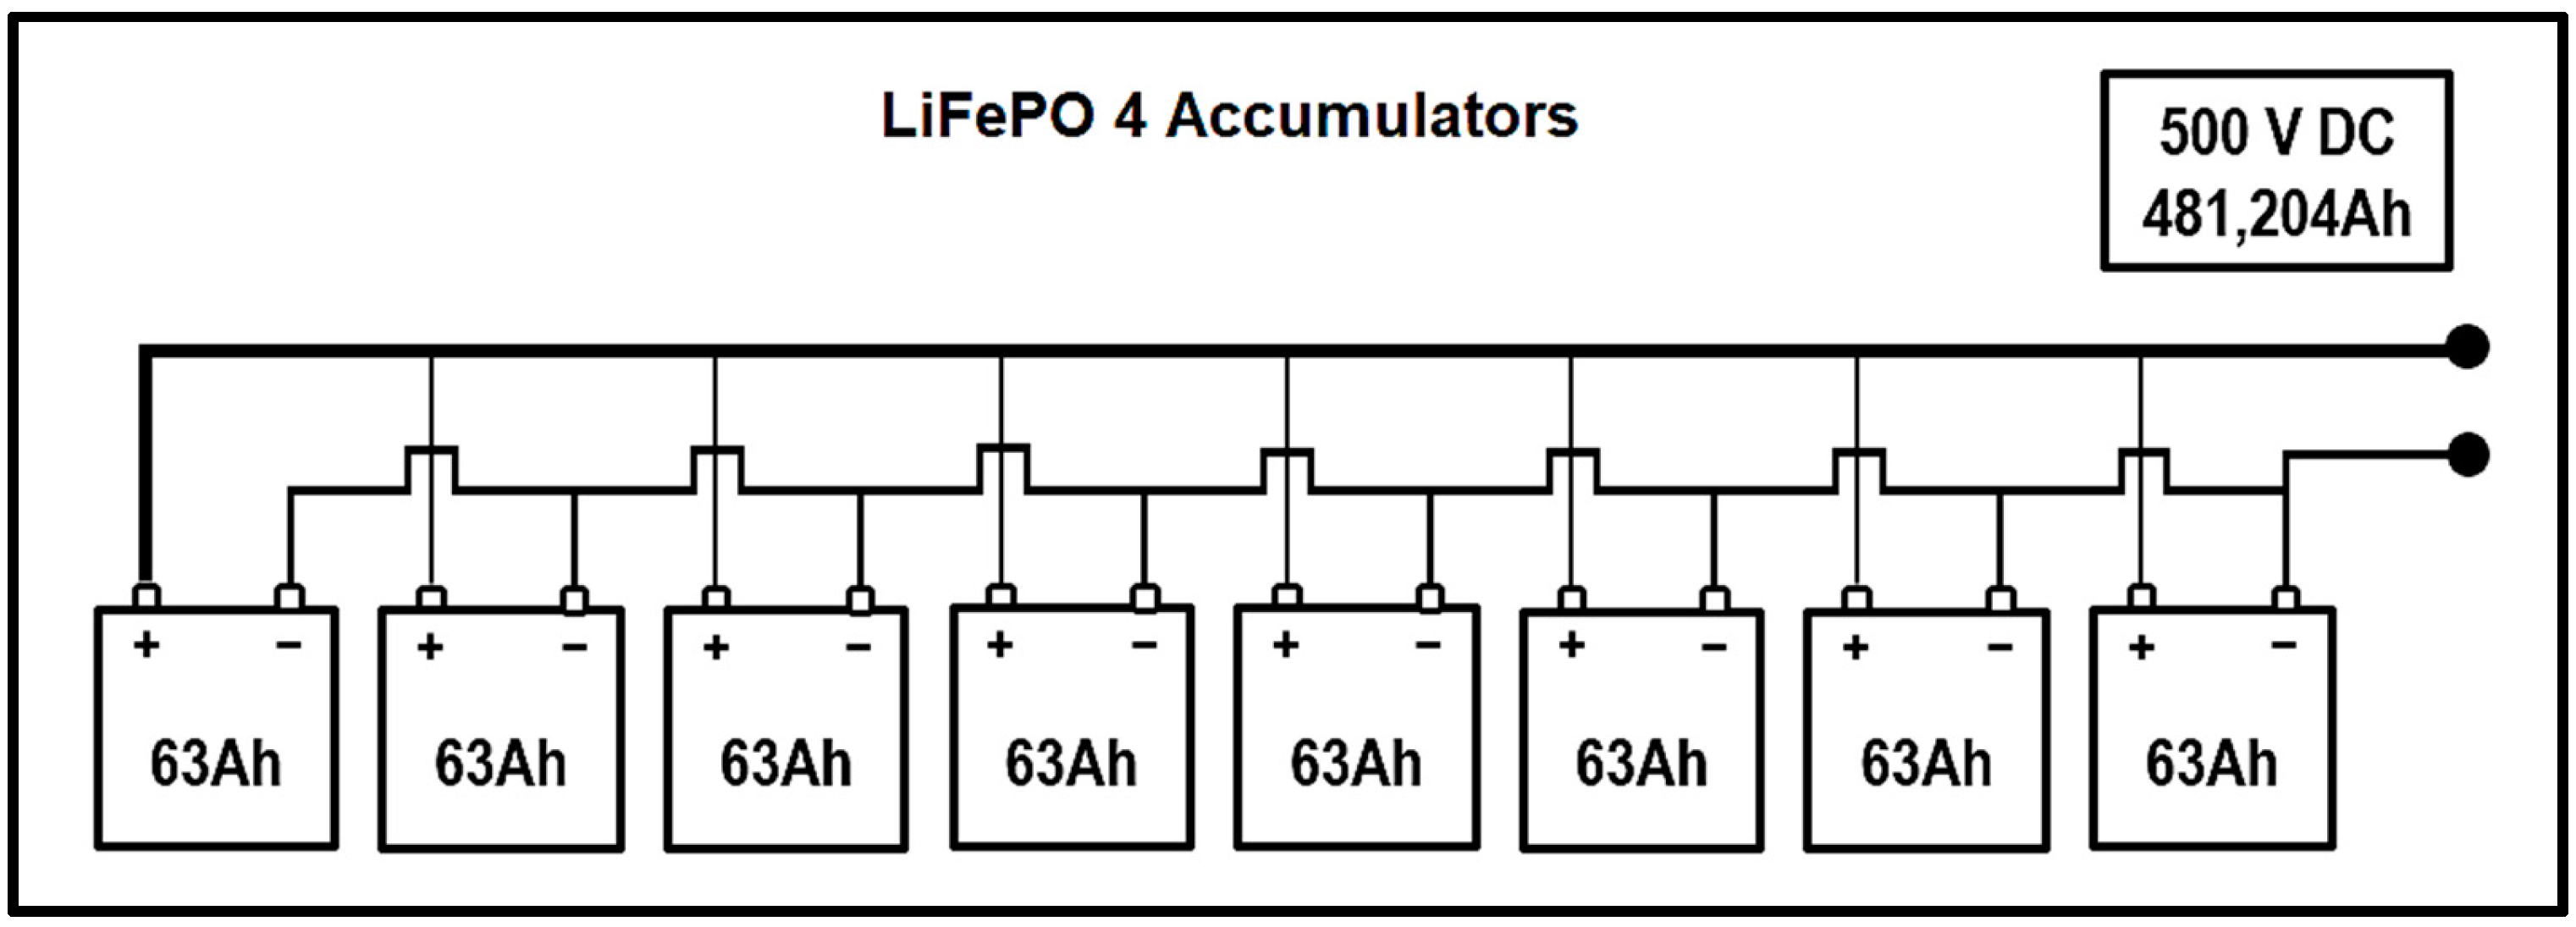
The study demonstrates the possibility of using alternative sources of energy generation to meet our needs and expand the country’s energy matrix. At present, renewable energies do not have the necessary participation in Colombia. The energy storage system required for the proposed alternative solution is the same as the initial proposal, with a total energy storage capacity of 481.204 Ah using 8 accumulators of 63 Ah each connected in parallel.
Regarding the stress analysis of the chassis and bodywork, the Von Mises stress values were lower than the yield strength of the respective manufacturing materials. Thus, permanent deformations would not be generated in the structures if the implementation were carried out. The displacement values obtained were below the maximum values allowed by NTC 5206 of 2009, which stipulates that the bus must not experience deformations greater than 70 mm at any point of it, supporting a static load on the ceiling equivalent to 50% of the maximum technically permissible mass (7049 kg), evenly distributed throughout it, for 5 min. Finally, the safety factors obtained were considered acceptable.


 ,
, 


