Abstract
With energy efficiencies close to two times higher than traditional photovoltaic (PV), concentrated photovoltaic (CPV) systems represent a promising solution for solar power generation. In the same way, the converging Levelized Cost of Energy (LCOE) of both technologies favors interest toward CPV systems. In order to assess more clearly the potential of this technology, an up-to-date evaluation of the power electronic conversion techniques used in CPV to increase the yielded energy is crucial. This assessment not only sheds light on the latest advancements, but also provides insights into design trade-offs, performance limitations, and potential areas for improvement in CPV systems. This work focuses on the DC/DC converters used as an intermediary stage of conversion between the panels and a central grid-tied inverter. Electrical and economical metrics are used to compare actual converters developed and presented in a comprehensive literature review.
1. Introduction
Concentrating photovoltaic (CPV) technique stands as a dynamic field of improvement focused on increasing the efficiency of photovoltaic conversion. At the panel level, prototypes have achieved photoelectric efficiencies reaching as high as 38.9% [1]. This substantial achievement significantly surpasses the capabilities of conventional single-junction silicon-based photovoltaic (PV) panels [2]. In this regard, the primary technological trajectory within CPV involves the integration of multi-junction (often three) III–V semiconductor materials. Given the intricate manufacturing processes involved in creating such junctions, CPV cell dimensions are minimized by typically incorporating lenses that concentrate solar irradiance onto a smaller surface area. However, this lens-based approach restricts CPV panels to operate under Direct Normal irradiance (DNI) exclusively. Consequently, the deployment of a solar tracker, which continuously aligns the sun’s irradiance with the lens’s focal point, becomes a mandatory prerequisite.
This particular configuration results in higher initial costs for CPV installations [3]. Consequently, in pursuit of cost reduction, industry stakeholders have opted to adapt well-established electrical solutions commonly utilized in PV contexts to extract energy. Indeed, the majority of CPV plants comprises panels arranged in series to form strings, which are subsequently interconnected in parallel to a shared DC bus. This DC bus acts as the input of a grid tied inverter.
Electrical mismatch effects, arising when interconnected solar cells exhibit diverse electrical behaviors at a given moment, are inherent to any photovoltaic system. Traditional photovoltaic systems experience electrical mismatch due to manufacturing tolerances and partial shading across arrays. The coexistence of solar cells with distinct I–V characteristics at a specific point distorts the array’s I–V output. While Maximum Power Point Tracking (MPPT) algorithms aim to alleviate this issue, electrical mismatch effects remain a challenge, particularly in CPV systems due to the high concentration factor, the use of direct normal irradiance only [4], and the high number of bypass diodes inside a module [5,6]. The latter factor makes the tracking of the effective maximum power point difficult. Indeed, each bypass diode, depending on the irradiance condition, can potentially create a local MPP. In return, each of the local maxima constitutes an additional difficulty for a classical MPPT algorithm to find the global maximum point and thus to extract maximum energy under the available operating point [7].
Because of these intrinsic drawbacks in the use of CPV technology, substantial research efforts within its different fields have been made. For example, the use of a tracking device to follow the trajectory of the sun is embedded at the cell or optical level [8,9]. It allows the placing of the panels on a fixed support and relaxing the mounting tolerances associated with accurate tracking. In addition, hybrid architectures with CPV and PV inside the same cell is an extensive field of research [10,11], as it would allow the harnessing of diffuse sunlight. Additionally, luminescence solar concentrators (LSC) seem to tackle more specifically the challenges of building integrated CPV [12]. Lastly, micro-CPV seems to decrease some losses associated with PV, and a better density of cell and overall use of direct normal irradiance [13]. All of these research topics are still at an early stage of development, reaching prototype level at best.
In parallel, existing CPV power plants are constructed all over the world, with 350 MW in current commercial exploitation [14], mainly under the form of fields of pedestal two-axes trackers. To overcome the identified electrical mismatch effects, and in order to keep the current setup as closely similar as possible for economic reasons, the addition of a power electronic conversion stage has drawn interest over the last years. The conversion stage (DC/DC or DC/AC) between the area of CPV panels and the grid plays a key role in increasing electrical efficiency. A great number of studies based on the addition of DC/AC converters (inverters) can be found in the literature, both at theoretical [15,16] and experimental levels [17]. However, they all rely on the removal of a central grid-tied inverter, which would imply changing drastically the setup of current CPV power plants.
The present work thus focuses on reviewing the literature on the work achieved in DC/DC conversion, with a comprehensive overview of the DC/DC prototype developed for CPV applications. In addition, this paper lays the groundwork for a global methodology to assess the electrical and economical relevance of any added DC/DC conversion stage. It takes into account the latest developments and trends in power electronics, such as the partial power conversion principle, and includes it in its developed methodology.
The first section is dedicated to the presentation of the theoretical pedestal tracker electrical layout in order to take into account, the specificities of current CPV installations and technologies. The next section presents a technical and economic framework to analyze the DC/DC converters. The last section is dedicated to comparing the existing structure of DC/DC conversion developed for CPV requirements.
2. Theoretical Setup
As mentioned previously, a great amount of work has been conducted regarding pedestal two-axis trackers for CPV, as they are the most popular solution installed throughout the world. In consequence, a lot of data are available regarding their production, economic impact, and reliability. To set a common electrical and economical bases for the study, we consider a generic tracker, the power rating (28.5 kWp) of which has been mainly discussed in different studies. This power-rated tracker can be found in [18] for a ground-to-cover ratio analysis, in [4,16] for the impact of partial shading, in [19] for the sizing of DC-to-AC ratio, and in [17] for the impact of distributed inverter configurations. The generic electrical characteristics of the considered setup are presented in Table 1.

Table 1.
Ratings of the setup under study.
These characteristics are averaged from different existing setup characteristics to provide a reference framework. The numbers of cells per panels and the short-circuit currents used as a basis can be found in [2,20,21,22]. The short-circuit current value depends on the size of the cell, and ranges from 2 A to 8 A. Nevertheless, the cell short-circuit current is lower with increasing voltage [20], so that the value is set to 4 A. The open-circuit voltage, on the other hand, is set given the fact that most installed CPV panels utilize three junctions with III–V semiconductors.
The increase in yielded energy resulting in the addition of a DC/DC stage greatly relies on the scale at which it is deployed, or, in other terms, the granularity of the converters. In the case of DC/DC converters, this study presents the following granularities: string level, panel level, and cell level. These granularities are depicted in Figure 1.
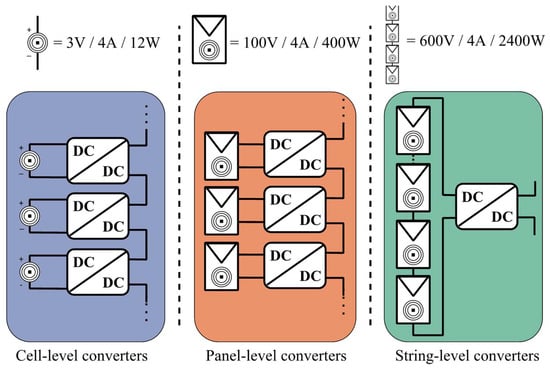
Figure 1.
Presentation of the granularity levels under review in DC/DC converters. Circles and squares represent a simplified Fresnel lens to indicate we work with CPV instead of classical PV.
3. Techno-Economic Framework
The aim of this part is to present classical metrics used to assess the relevance, both energetic and economical, of conversion solutions. The LCOE (Levelized Cost Of Energy) encapsulates efficiently the tradeoff between the cost of a proposed solution and its benefits in terms of energy gain. It is hence a well-used tool that can perfectly fit in any global analysis requiring some of these parameters. In addition, the intermediary metrics used to calculate the LCOE are also relevant to support different analysis regarding the DC/DC stages reviewed in this paper.
3.1. Energetic Analysis
To quantify the relevance of a given diminution in granularity in the added DC/DC stage, the global energy yielded by the plant has to be calculated. It is presented in the next Formula (1):
where DNIa is the available energy per year under direct normal irradiance, P* is the power evaluated at the CSOC (Concentrator Standard Operating Conditions) available in the installation [2], DNICSOC the direct irradiance fixed at 0.9 kW/m2. Parameter PR stands for Performance Ratio, and is calculated as follows:
where Li are in %, representing any electrical or optical loss undergone by the real CPV system. The study presented in [23] synthesizes the different Li parameters of interest in the CPV domain. The most quantitively important ones are Shading, Cell temperature, Lens temperature, DC wiring, Soiling, Mismatch, MPPT, Inverter, AC wiring, Transformer, Auxiliary consumption and Unavailability. The reduction in any of the previous losses must therefore translate into the reduction in the corresponding Li factors. An added DC/DC stage acts on three of these factors: Shading losses, Mismatch losses, and Unavailability losses.
- Shading losses: They encompass two concepts—losses resulting from a significant reduction in received sunlight intensity and losses attributed to the disparity of the MPP (Maximum Power Point) voltage between different panels placed of the same string. These voltage variations are linked to the uneven distribution of shading patterns.
- Mismatch losses: They are linked to the discrepancy in angles between a module and its adjacent modules that are connected in a series arrangement. Indeed, when CPV panels are installed on the tracker, it is required that they are as closely aligned with one another.
- Unavailability losses: They are the losses related to the unavailability of the trackers while maintenance is performed. Currently, the maintenance of trackers is performed “blindly”, meaning it is triggered by a decrease in its production without information about neither the nature nor the location of the faulty panel(s).
Previous reference works [4,17,23,24] have discussed and calculated the impact of granularity up to the panel level on these losses. The corresponding Li factors are shown in Table 2. Each line in Table 2 presents the three main loss contributions affecting the complete setup, occurring for a given granularity.

Table 2.
Losses as function of granularity.
The shading losses at cell level are considered null because the degree of freedom added by a cell-level conversion stage allows bypassing completely the discrepancy implied by any partial shadowing. The mismatch losses are the same as for the panel because the angular dispersion makes sense at the panel level, but not at the cell level. It implies that the manufacturing tolerance and installation tolerance of the cells within the frame of the panel are not significant enough to have an impact on the losses.
Implementing an additional stage of conversion comes necessarily with losses. The latter can be translated into a supplementary Li factor: LDC. This factor depends on the topology used, the level of power and numerous other parameters. For the sake of simplification in this section, a range of DC/DC efficiency from 90% to 99% is presented. This generic efficiency formulation allows the relevance of future conclusions in this section beyond the scale of power electronics. However, an analysis more centered around power electronic is found in the next sections.
With the figures presented in Table 2, the energy efficiency of the DC/DC stages, and Equation (1) applied to the setup presented in introduction, we obtain the plots displayed in Figure 2. For the calculation, we take a base PR value of 0.8 [23], and replace the value of Lis displayed at tracker level by Lis of the corresponding granularity.
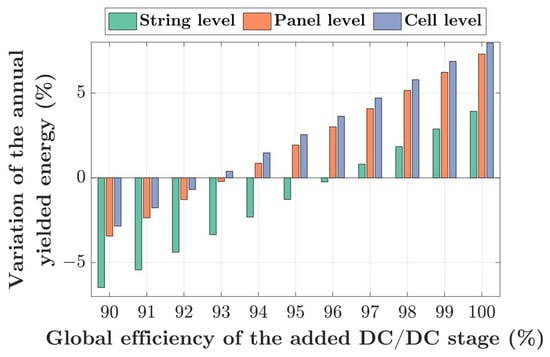
Figure 2.
Variation of the annual yielded energy for a CPV system as function of the energy efficiency of the added DC/DC stage.
Figure 2 shows that, as expected, different levels of granularity yield different energy gains as a function of the converter theoretical efficiency. Moreover, we can see that the sign of the energy yield variation (positive for improvement, negative for decrease) changes for different values of converter efficiency with respect to granularity. This detail is emphasized in Figure 3.
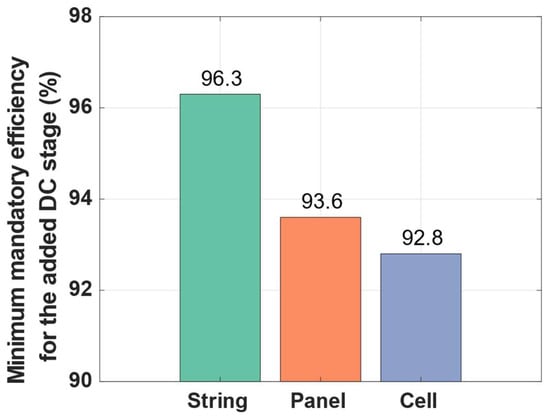
Figure 3.
Minimum mandatory energy efficiency of the added DC stage in order to create a benefit depending on granularities.
We can see that the level of granularity has a direct impact on the efficiency requirement for the additional stage. With a diminishing scale of power, the efficiency requirements are relaxed from 96.3% for the string-level converter to 92.8% for the cell-level one. On the contrary, we can observe that the gap in requirement tolerance is higher when it moves from string to panel levels compared to panel to cell levels.
3.2. Economical Framework
The previous energetical analysis is then used as a basis for a cost analysis with the mean of LCOE calculation. Equation (3) describes the LCOE calculation used in this article.
where LCC is the CPV system cost (in USD) for a prospective life cycle N (in years), ECPV is the annual energy obtained by the CPV system, previously calculated, and d is the annual discount rate. The details for the calculation of the LCC (Life Cycle Cost) are given below (4):
where CPVIN is the initial cost of installation (in USD), and PW[CPVOM(N)] is the cost of operation and maintenance of the installation for N predicted years of operation. All the economic parameters are taken from [2], unless stated otherwise, and can be found in Table 3. The initial cost of an installation is derived from [9] to lie between 2.0 USD/Wp and 3.5 USD/Wp and is taken at 2.4 USD/Wp following [2].

Table 3.
Economical parameters used for this study derived from [2].
To perform a first analysis, we make a hypothesis of a costless added DC/DC stage (the LCC encompasses only the cost of the tracker + inverter setup). This allows us the assessment of the maximum range of economy achievable by the different solution, i.e., different levels of granularity. The effect of this costless assumption can be seen in Figure 4.
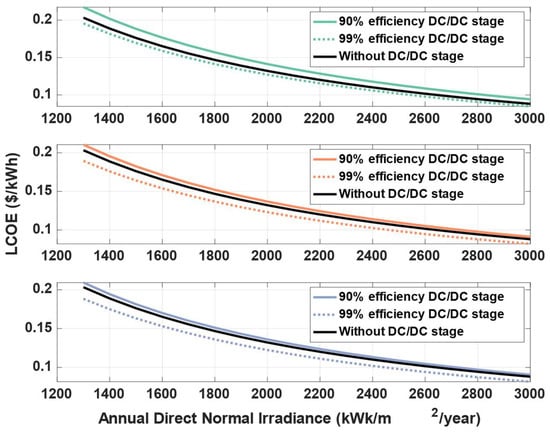
Figure 4.
LCOE calculation in the case of costless added DC/DC stage, with respect to energy efficiency, for string-level converters (Top, green), panel-level converters (Middle, orange) and cell-level converters (Bottom, blue). All cases display the reference case of tracker level inverter in black.
Figure 4 shows that for an annual direct normal irradiance of 2000 kWh/m2/year, a cell-level added DC/DC conversion stage (in blue) with 99% efficiency allows a decrease of 0.01 USD/kWh compared to the current industrial solution. With increasing irradiance, an added stage with the same efficiency holds less savings potential. The same cell-level stage at 3000 kWh/m2/year decreases the LCOE only by 0.008 USD/kWh.
As of 2020, the range of LCOE of PV is set between 0.027 USD/kWh and 0.048 $/kWh [25]. Regarding CPV during the same period, different studies place LCOE between 0.040 USD/kWh and 0.080 USD/kWh [26], and between 0.065 USD/kWh and 0.075 USD/kWh [27]. It highlights that LCOE of CPV is usually higher than LCOE of PV. However, the most recent worldwide assessment on the disparity of LCOE between CPV and PV [28] states that these two technologies are often found to be below 0.01 USD/kWh of LCOE difference. Formulating precise cost evaluations proves challenging, as predictive LCOE calculations rely on a multitude of economic assumptions and simplifications. Moreover, these estimations are greatly influenced by the specific country under examination. Nonetheless, a substantially efficient system holds the potential to make CPV installations advantageous across a wider set of countries and markets, particularly when PV installations are already economically viable.
To assess more clearly the actual impact of adding a DC/DC efficiency stage, we vary the input price of the stage in parameters CPVIN and PW[CPVOM(N)]. It allows us determination of the maximal admissible price so that industrials can derive and quantify Return On Investment (ROI) from these solutions. The results are presented in Figure 5.
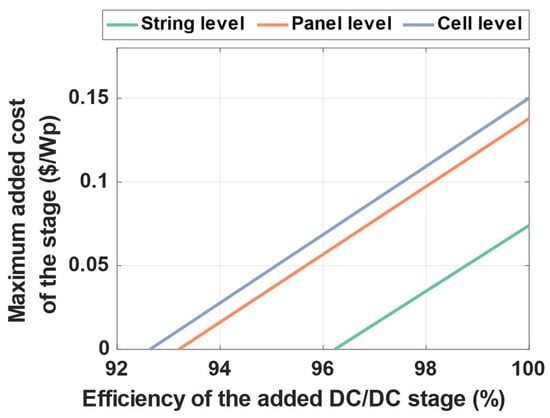
Figure 5.
Maximum admissible cost of the added stage as function of its granularity and global energy efficiency.
To ensure economic benefits compared to the current industrial solutions, the system installed should lie under the line corresponding to its chosen granularity in Figure 5. For example, a string-level solution requires both high efficiency and very low cost. For constant efficiency, we see that its corresponding price per Watt peak should be less than a half of the ones for the other kind of conversion strategies.
However, the cost of power electronics can greatly vary from one converter to another. The difference between isolated and non-isolated topologies, the type and number of switches implemented makes it difficult to put a predictive yet accurate price on a solution. As it is obvious that the cost of the converters plays a key role in the acceptability of the augmented solution, the next section presents a mean of comparing different DC/DC topologies within a unified framework.
3.3. Cost Evaluation for Power Electronic Converters
The objective of this part is to derive a generic yet sufficiently accurate method for evaluating the cost of the converters under study. This cost value is then fed into the LCC Equation (4).
There is no unified method to compare different topologies of DC/DC converters. Such a comparison problem is often addressed in the literature considering at least the number of active switches. As they are very often the most expensive part of the converter, this metric makes sense to estimate roughly the price range of devices. This study takes a step further by including all power devices present in the later compared topologies. To achieve such a work, we rely on [29] to estimate a “complexity factor”. This is achieved by using the prices of parts presented in the cited article as unitless coefficients. This method allows us the statement of a quantitative index that can be crossed with other more general studies regarding the price of power electronic. The cost value used as coefficients are presented in Table 4.

Table 4.
Complexity index names and values.
We then use these complexity indices to derive a complexity factor for the DC/DC converter under study using Equation (5),
where FC,Switch, FC,Diode, FC,L and FC,C are the complexity coefficient of power switches, diodes, inductors and capacitors, respectively. NSwitch, NDiode, NL and NC are the number of power switches, diodes, inductors, and capacitors, respectively. In the case of a coupled inductor or a transformer, each unit consists of inductor complexity index multiplied by two.
It is useful to manipulate a normalized coefficient that equals one when the simplest form of DC/DC conversion is evaluated. In this study, and, more globally, in power electronics, the simplest topologies are buck and boost, which display the same number of parts. We use them as a basis for normalizing the complexity factors of more complex converters. Equation (6) displays the normalized coefficient used in this study:
where FC,Buck/Boost equals 4.95 using (5) with one power switch, one diode, one inductor and two capacitors. We can note that this complexity factor does not consider the power rating of the converter under study. In other words, a 4 kW buck exhibits the same FC factor as a 0.4 W one. The different granularities of conversion presented in this study call for a power-related evaluation of price. Such a metric can be found in [30], with a work centered around the economical behavior of power electronics for PV injection in commercial buildings. The range of prices presented in this work for DC/DC converters for MPPT is between 100 USD/kW and 220 USD/kW. This range takes into account the component quality and overall price volatility. One of the articles under study [31] assumes a price of 150 USD/kW, falling within that range. We assume that the range of power ratings displayed in the next section is compatible with the use of the latter price range.
4. Literature Review of DC/DC Converters for CPV
Numerous topologies have been developed to improve the efficiency and the scalability of CPV power plants. To the best of the authors’ knowledge, a comprehensive list of relevant publications can be found in Table 5. Panel-level conversion and cell-level conversion have been mostly favored. The former can be explained by the will of transposition of PV-based solutions, notably with the growing market of DC/DC optimizers. The latter takes advantage of the relatively low voltages, currents and overall powers found for a unique CPV cell. This reason makes the use of embedded power electronic possible. Hence, each of the cell-level converters under review are CMOS based.
4.1. List of Reviewed Topologies
Simple topologies can be found, such as buck, boost or buck boost. The more complicated ones represent attempts at answering some specificities of the CPV cells, and are represented in Figure 6. For example, in [32], it consists of an interleaved buck topology. Each of its input is directly linked to a junction of the CPV cell, mainly to overcome spectral mismatch and the necessity of lattice-matched junctions [33]. Article [34] proposes a high-gain DC/DC topology to directly feed one panel to the DC bus of a grid-tied inverter.
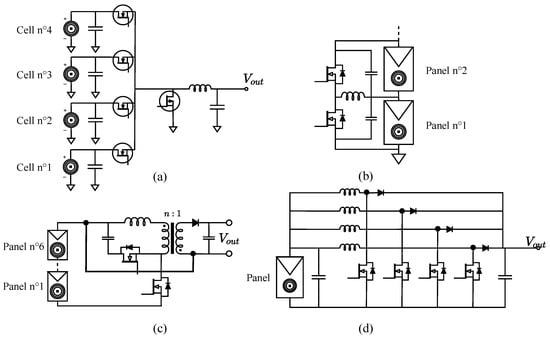
Figure 6.
Presentation of some of the topologies under study: (a) Interleaved buck [32], (b) Buck boost in differential power processing [32,33], (c) Flyback active clamp with partial power processing [21], (d) Mirror boost [34].
The topology presented in [35] is only a theoretical study based on the cascading of a DPC buck boost present in [36] and a partial power flyback active clamp [21]. The efficiency of each is used as a base to calculate the total efficiency of this cascaded stage.
The calculation presented in the previous section regarding a unified complexity factor can be found in Line 7 of Table 5. To set a common ground for comparison, this factor is further normalized with respect to the granularity of the topology it characterizes, for display purposes only. In other words, the number of parts presented in the calculation of the complexity factor is taken for a single converter attached to the cell, panel or string. This allows mitigation of unfruitful comparisons between numbers whose difference of magnitude would solely rely on the multiplicative nature of dealing with different granularities. Later results naturally take into account the number of actual converters per tracker to show real costs.
As designed, the buck and boost topologies exhibit a unitary complex factor, followed closely by the buck boost topologies (which trades a diode for a switch compared to buck or boost). The most complex topologies, namely [32,34], show complexities three times or higher than the simplest ones.
It has to be noted that no global efficiency curve versus input power of the converter presented in [34] has been found. Therefore, the efficiency curve from [37] is used instead due to the very close nature of the two converters.

Table 5.
List of the converters under review.
Table 5.
List of the converters under review.
| References | [38] | [31] | [32] | [36] | [34] | [21] | [21,35] |
|---|---|---|---|---|---|---|---|
| Authors | Neuhaus et al. | Alonso et al. | Zhang et al. | Zaman et al. | Petit et al. | Camail et al. | Camail et al. |
| Year | 2018 | 2018 | 2020 | 2015 | 2018 | 2022 | 2023 |
| Type | FPP | FPP | FPP | PPP (DPC) | FPP | PPP (S-PPC) | PPP (DPC + S-PPC) |
| Topology | Boost | Buck | Interleaved Buck | DPC Buck Boost | Mirror Boost | Flyback Active Clamp | FBAC + DPC BB |
| Granularity | Cell | Panel | Cell | Cell | Panel | String | Panel |
| Complexity factor | 1 | 1 | 3 | 1.2 | 3.4 | 1.5 | 1.5 |
| Average efficiency over clear sky day | 88.9% | 98.2% | 92.9% | 99.2% | 94.2% | 94.1% | 93% |
4.2. Partial Power Processing Concept
This study aims at comparing topologies with different kinds of power processing. For a decade, partial power processing (PPP) has been of interest regarding the achievement of high efficiencies and the diminution of power requirements. Indeed, in traditional power converters (viewed as full power processing (FPP)), all of the input power is processed by the converter. Losses can be then calculated as a fraction of this entire input power. With PPP, only a proportion of the input power is processed by the converter, and only this proportion is hence submitted to losses. This leads to lower overall losses, as further explained in [39].
Among the converters under review, two types of PPPs can be distinguished: Serial Partial Power converters (S-PPC) and Delta Power Converters (DPC). The first is a direct transposition of the principle of PPP, where the fraction of processed power depends on the voltage gain between the input and output of the converter [21]. The DPC, on the other hand, is used to perform multi-input power management. In this case, the converters process only a mismatch fraction of the total power. If the two sources produce power at the same voltage and current, the DPC does not perform any power processing.
4.3. Method of Comparison
To compare the converters, we base our work on the different powers provided in [17]. The total theoretical power during a clear-sky day scenario received by a pedestal 28.5 kWp tracker is displayed in Figure 7 in red on the left axis. The figure also represents the losses associated with the shading mismatch (in blue) and with the alignment mismatches (in green), the values of which can be read on the right axis. In the case of a conventional inverter-level-based MPPT, both the losses displayed in the figure must be subtracted from the total available power to represent the actual yield of the system.
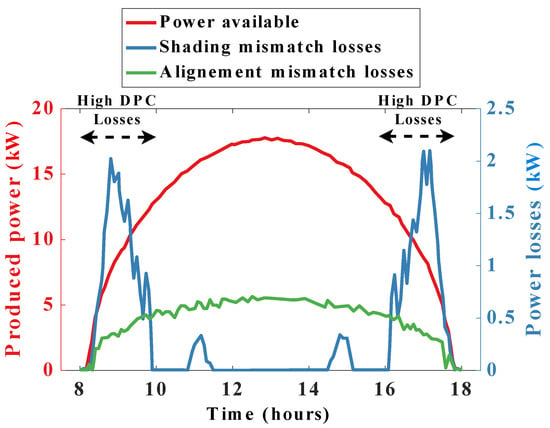
Figure 7.
Ideal produced power by a 28.5 kWp tracker during a typical clear sky day (red). Shading mismatch losses (blue) and alignment mismatch losses (green). Produced power data from [17].
We can see that the main shading mismatches are present at dawn and twilight. This is because in a CPV plant, inter-tracker shadowing (the shadow of a tracker projected to another one) takes place during these periods. They are represented by the two grayed rectangles. Compared to it, the alignment mismatch losses are much more regular and take place during the whole period of irradiance. They are roughly proportional to the amount of total power received by the tracker.
Because of the intrinsic difference of nature in the power flow inside of a traditional full power converter and a partial power converter, a global way to calculate efficiency in this scenario has to be defined. For the flyback active clamp in [21,35], the fact is that the actual processed power is proportional to the total input power. Its efficiency curve in Figure 8 can then be used without further modification. We can note that the factor of proportionality of these two power levels may vary due to differences in voltage gain during the scenario. However, in order to simplify the study, only a unique efficiency curve is used, taken from [21] in a relatively high voltage gain case, so that the losses are not underestimated.
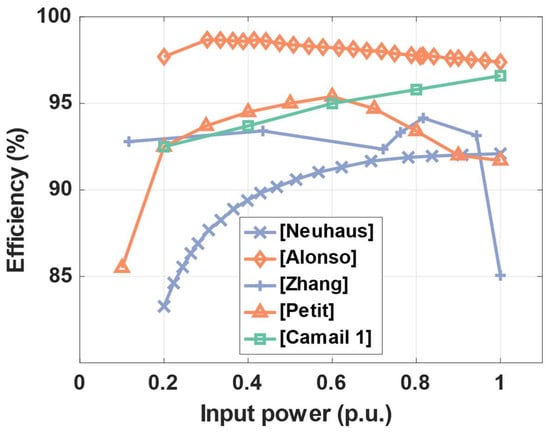
Figure 8.
Energy efficiency as function of input power (p.u.) for the considered DC/DC converters (blue = cell-level conversion, orange = panel-level, green = string-level).
Regarding the DPC converter studied in [35,36], only the difference of power between the connected sub-units is processed. Hence, the losses are only applied to this differential power. We can estimate that, following [36], most of the differential power can be attributed to the differential current, the VOC voltages of the cells being kept approximately constant. Hence, we can link the differential power (i.e., the sum of the losses from Figure 7) to the differential current and derive an efficiency for the scenario of interest as presented in Figure 9.
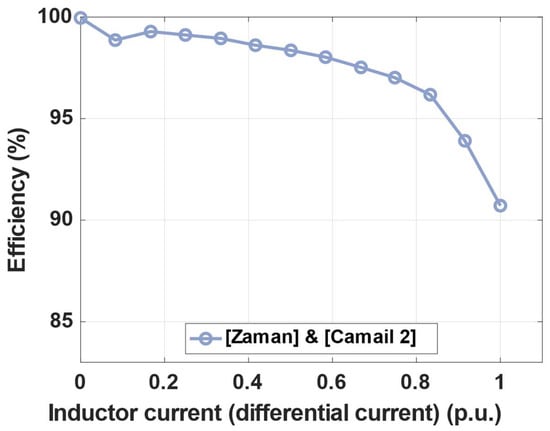
Figure 9.
Energy efficiency as function of inductor current (p.u.) of DPC converter.
4.4. Result and Analysis
The resulting efficiency analysis can be found in Figure 10. The averaged efficiency for each converter is given at the bottom of Table 5.
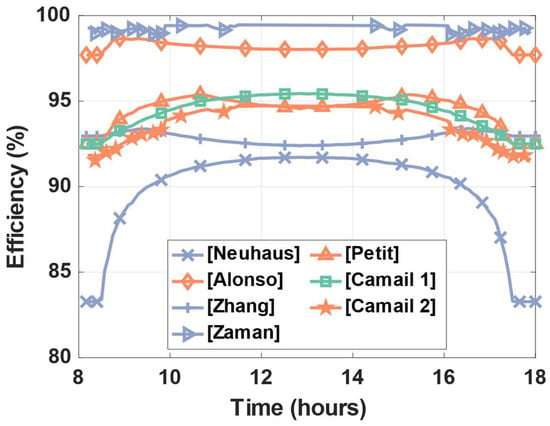
Figure 10.
Results of energy efficiency for each converter under test under the ideal produced power scenario presented in Figure 9.
Considering the cell-level converters (blue line), we can see a large disparity of efficiencies, with a clear advantage for the differential power processing unit. It limits the low efficiency value due to the processing of low power at the very start and very end of the day. All the other topologies exhibit the higher proportion of losses during this period.
For the panel-level granularity of conversion (orange line), a more regular pattern can be seen between the different converters. In [31], with a simple buck topology, the converter seems to hold the best efficiency within its granularity group.
The averaged efficiencies for this generic scenario also allow the analysis of the topologies against the economic requirements developed in the previous section. Figure 11 is the same as Figure 5, with a logarithmic scale for the added cost. It includes the converters presented in this section. The results include the range of price considered for the study: between 100 USD/Wp and 220 USD/Wp.
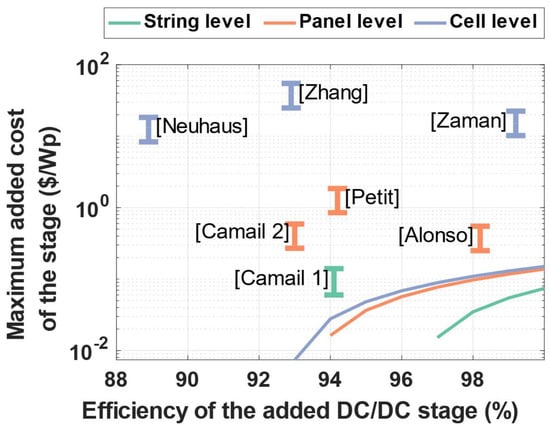
Figure 11.
Maximum admissible cost of the added converter stage depending of its granularity and global energy efficiency compared to the different converters under study.
We can clearly see in this figure the three groups of converters corresponding to the three level of granularities presented in this study. Cell-level converters exhibit prices per Watt peak up to three orders of magnitude higher than the maximum admissible added cost. Even extreme efficiency allowed by the differential power processing of [36] cannot overcome the intrinsic over cost due to the numerous amounts of converters needed to fully cover all of the cells. From these three converters, only the one in [38] does not meet the requirements of minimum mandatory efficiency, the one in [32] being at the limit. It has to be noted that to derive the efficiency curves in Figure 8, only the efficiency relative to power electronic itself is considered. However, with this level of integration, the control unit in charge of the MPPT and regulation must also be embedded, leading to further losses to account for.
Concerning the panel-level converters, the price penalty reaches only one to two orders of magnitudes above the maximum. The cost of the converter in [34] suffers from its high complexity factor and is superior to the two other converters in the same category. The converter in [31] is the closest to achieve both efficiency and added cost criteria, with a simple and low loss buck.
Finally, the only converter working at string level is the one which has a price range directly compatible with the calculated reference. The lack of sufficient efficiency leads however, this converter to lie under the minimum efficiency threshold. It has to be noted that paper [21] presents a soft switching flyback active clamp that performs in hard switching at the conditions from which the efficiency curve is derived. Later changes in component sizing could improve the overall efficiency of this converter.
4.5. Discussion and Recommendation for Future Power Electronic Investigation
The literature reviewed in this article can be qualitatively discussed. The main goal is the presentation of different and innovative topologies along more classical ones. With the use of PPP and cell-level CMOS-based converters, the latest trends in developing power electronics are presented.
A weakness in the analysis can be found at the string-level conversion. Only one reliable and recent article could be found [21] that focused on the requirements intrinsic to CPV challenges and voltage level. This can be partially explained by the fact that, as PV-rated inverters are used for economic reasons, the requirements in terms of voltage for a string-level DC/DC converter would be the same as the ones for a PV string. Hence, this granularity presents the least specificity and is already extensively treated in the literature dedicated to PV [40]. Additionally, the topologies are rarely tested against real-life irradiance scenarios or patterns, so that only an averaged energetical analysis can be conducted.
Due to the early stages of development of the presented converters, the main drawback of the current state of the art on DC/DC converters is their lack of real implementation. In other words, though the hardware is tested and rated, no particular focus is placed on the control and MPPT algorithms. Concerning the latter, three of the studies provide no MPPT implementation [21,34,35]. The four other converters implement very simple MPPT algorithms, mainly in order to validate their hardware: in refs. [31,32], a Perturb and Observe algorithm is implemented, in [38], a hill climbing algorithm is implemented, and in [36], a simple voltage equalization technique is employed. Hence, the focus of the present overview is restricted to discussions related to hardware. It has to be noted that more generally, in the field of CPV, and to the best of the authors’ knowledge, no significant work on the MPPT algorithms comparison has been carried out. Due to the high number of bypass diodes and specific irradiance patterns, this topic should be addressed by the scientific community in light of the latest work already achieved on this matter by the PV community [41] to assess the relevance of recent AI and non-linear control methods.
The development in the field of power electronics for CPV conversion brings the opportunity to gather more data at finer power level. Indeed, with diminishing granularities, it is easier to collect in situ data on panel misalignment and ageing. This opportunity allows tackling the unavailability losses defined previously. As the maintenance is currently performed without any previous knowledge of the panels that are underperforming, an additional requirement for the DC/DC converter at the panel level can be added. This would translate into the addition of data processing and communication that could eventually lead to a trigger mechanism of more localized and overall quicker maintenance.
Finally, two main threats can be highlighted regarding the acceptability of additional DC/DC stages. First, the physical and economic complexity of an added stage tends to bring higher uncertainties regarding its wide development and standardization. With an already expensive first investment [27], additional initial costs could encourage investors toward a more classical and well-proven PV installation. Last, the efficiency improvement caused by the important research efforts, when analyzed with metrics such as LCOE, can be surpassed by economic efforts. For example, a reduction of one percent in discount rate can lead to the same LCOE reduction as a 99% efficient DC/DC converter [42].
In light of these details, some general recommendations for future work in the field can be drawn.
- We see that cell-level converters are currently too expensive and may not, in near future, prove affordable to be scaled to the CPV grid-tied power plants. Given the current and future work in the domain of embedded power electronic toward higher power and higher efficiency, such a statement could be refuted within the next decade.
- Based on the complexity factor proposed in this work, we see that due to the high-cost constraints, the use of more complex DC/DC topologies is unlikely. Indeed, the addition of switches is usually proposed to gain efficiency locally or globally. However, DC/DC converters with four active switches and above would reach a price that would cancel the benefits of the added efficiency.
- No clear intrinsic superiority of the current implementation of partial power processing structures is concluded regarding efficiency alone. Nevertheless, work including the relatability of such structures [39] tends to make them still inherently pertinent. In addition, the ability of this converters to be bypassed entirely and in a lossless fashion is not further explored in this work and is not detailed in many works. Such an ability could benefit the reduction in losses created by misalignment, as they induce virtually no voltage discrepancies between strings.
5. Conclusions
The review of DC/DC converters for concentrated photovoltaic presented here highlights diverse topologies, with conversion at a panel level and a cell level gaining momentum. A generic method is proposed to derive the techno-economical relevance of the added DC/DC stages in the conversion process. The latter metrics are compatible with previous work achieved regarding CPV.
The study compares various topologies, including partial power processing converters, from the simplest buck and boost to more intricate designs tailored to CPV cell characteristics. Panel-level converters, particularly using simpler topologies like buck, demonstrate consistent energy efficiencies. It may be concluded that cost- effectiveness may vary, with cell-level converters facing affordability challenges, panel-level converters showing promise, and string-level conversion needing efficiency enhancements. Future research suggestions include revisiting cell-level converter affordability, being cautious with complexity, and exploring partial power management benefits further.
Author Contributions
Conceptualization, P.C. and J.P.F.T.; methodology, P.C.; validation, C.J., J.P.F.T., C.M., M.D. and B.A.; investigation, P.C. and M.D.; writing—original draft preparation, P.C.; writing—review and editing, C.J., J.P.F.T., C.M. and M.D.; visualization, P.C.; supervision, C.J., J.P.F.T., C.M., M.D. and B.A.; project administration, J.P.F.T., C.J. and M.D.; funding acquisition, M.D. and J.P.F.T. All authors have read and agreed to the published version of the manuscript.
Funding
This work was supported in part by Grant 950-230672 from Canada Research Chairs Program and in part by FCT-Portuguese Foundation for Science and Technology project UIDB/00308/2020. This work was also supported by the NSERC (RDC-CRD 535854-18) and Prompt (PSO- Projet no. 110) in the framework of the MARS-CPV project. LN2 is a joint International Research Laboratory (IRL 3463) funded and co-operated in Canada by Université de Sherbrooke (UdeS) and in France by CNRS as well as ECL, INSA Lyon, and Université Grenoble Alpes (UGA). It is also supported by the Fonds de Recherche du Québec Nature et Technologie (FRQNT).
Data Availability Statement
The data presented in this study are available on request from the corresponding author.
Conflicts of Interest
The authors declare no conflict of interest.
Abbreviations
| CPV | Concentrator Photovoltaic |
| CSOC | Concentrated System Operating Conditions |
| DNI | Direct Normal Irradiance |
| DPC | Differential Power Converter |
| FPP | Full Power Converter |
| LCC | Life Cycle Cost |
| LCOE | Levelized Cost of Energy |
| MPP | Maximum Power Point |
| MPPT | Maximum Power Point Tracking |
| PPP | Partial Power Processing |
| PV | Photovoltaic |
| S-PPC | Series Partial Power Converter |
References
- Green, M.A.; Dunlop, E.D.; Siefer, G.; Yoshita, M.; Kopidakis, N.; Bothe, K.; Hao, X. Solar Cell Efficiency Tables (Version 61). Prog. Photovolt. Res. Appl. 2023, 31, 3–16. [Google Scholar] [CrossRef]
- Algora, C.; Rey-Stolle, I. (Eds.) Handbook of Concentrator Photovoltaic Technology; John Wiley & Sons Inc.: Hoboken, NJ, USA, 2016; ISBN 978-1-118-75564-8. [Google Scholar]
- Talavera, D.L.; Pérez-Higueras, P.; Almonacid, F.; Fernández, E.F. A Worldwide Assessment of Economic Feasibility of HCPV Power Plants: Profitability and Competitiveness. Energy 2017, 119, 408–424. [Google Scholar] [CrossRef]
- Kim, Y.S.; Kang, S.-M.; Winston, R. Modeling of a Concentrating Photovoltaic System for Optimum Land Use: Concentrating Photovoltaic System for Optimum Land Use. Prog. Photovolt. Res. Appl. 2013, 21, 240–249. [Google Scholar] [CrossRef]
- Wiesenfarth, M.; Anton, I.; Bett, A.W. Challenges in the Design of Concentrator Photovoltaic (CPV) Modules to Achieve Highest Efficiencies. Appl. Phys. Rev. 2018, 5, 041601. [Google Scholar] [CrossRef]
- Steiner, M.; Siefer, G.; Bett, A.W. An Investigation of Solar Cell Interconnection Schemes within CPV Modules Using a Validated Temperature-Dependent SPICE Network Model: Investigation of Solar Cell Interconnection Schemes. Prog. Photovolt. Res. Appl. 2014, 22, 505–514. [Google Scholar] [CrossRef]
- Zheng, H.; Li, S.; Haskew, T.A.; Xiao, Y. Impact of Uneven Shading and Bypass Diodes on Energy Extraction Characteristics of Solar Photovoltaic Modules and Arrays. Int. J. Sustain. Energy 2013, 32, 351–365. [Google Scholar] [CrossRef]
- Apostoleris, H.; Stefancich, M.; Chiesa, M. Tracking-Integrated Systems for Concentrating Photovoltaics. Nat. Energy 2016, 1, 16018. [Google Scholar] [CrossRef]
- Wright, D.J.; Badruddin, S.; Robertson-Gillis, C. Micro-Tracked CPV Can Be Cost Competitive with PV in Behind-The-Meter Applications with Demand Charges. Front. Energy Res. 2018, 6, 97. [Google Scholar] [CrossRef]
- Sato, D.; Lee, K.-H.; Araki, K.; Yamaguchi, M.; Yamada, N. Design and Evaluation of a III–V/Si Partial CPV Module for Maximization of Power Generation per Unit Module Area. IEEE J. Photovolt. 2019, 9, 147–153. [Google Scholar] [CrossRef]
- Haney, M.W.; Gu, T.; Agrawal, G. Hybrid Micro-Scale CPV/PV Architecture. In Proceedings of the 2014 IEEE 40th Photovoltaic Specialist Conference (PVSC), Denver, CO, USA, 8–13 June 2014; pp. 2122–2126. [Google Scholar]
- Castelletto, S.; Boretti, A. Luminescence Solar Concentrators: A Technology Update. Nano Energy 2023, 109, 108269. [Google Scholar] [CrossRef]
- Jost, N.; Gu, T.; Hu, J.; Domínguez, C.; Antón, I. Integrated Micro-Scale Concentrating Photovoltaics: A Scalable Path Toward High-Efficiency, Low-Cost Solar Power. Sol. RRL 2023, 7, 2300363. [Google Scholar] [CrossRef]
- Kost, C.; Mayer, J.N.; Thomsen, J.; Hartmann, N.; Senkpiel, C.; Philipps, S.P.; Nold, S.; Lude, S.; Saad Hussein, N.; Schmidt, J.; et al. Levelized Cost of Electricity: PV and CPV in Comparison to Other Technologies. In Proceedings of the 29th EU PVSEC European Photovoltaic Solar Energy Conference and Exhibition, Amsterdam, The Netherlands, 22–26 September 2014; pp. 4086–4090. [Google Scholar] [CrossRef]
- Kim, Y.S.; Winston, R. Power Conversion in Concentrating Photovoltaic Systems: Central, String, and Micro-Inverters: Power Conversion in CPV Systems. Prog. Photovolt. Res. Appl. 2014, 22, 984–992. [Google Scholar] [CrossRef]
- Rodrigo, P.M.; Talavera, D.L.; Fernández, E.F.; Almonacid, F.M.; Pérez-Higueras, P.J. Optimum Capacity of the Inverters in Concentrator Photovoltaic Power Plants with Emphasis on Shading Impact. Energy 2019, 187, 115964. [Google Scholar] [CrossRef]
- Rodrigo, P.; Velázquez, R.; Fernández, E.F.; Almonacid, F.; Pérez-Higueras, P.J. Analysis of Electrical Mismatches in High-Concentrator Photovoltaic Power Plants with Distributed Inverter Configurations. Energy 2016, 107, 374–387. [Google Scholar] [CrossRef]
- Pérez-Higueras, P.J.; Almonacid, F.M.; Rodrigo, P.M.; Fernández, E.F. Optimum Sizing of the Inverter for Maximizing the Energy Yield in State-of-the-Art High-Concentrator Photovoltaic Systems. Sol. Energy 2018, 171, 728–739. [Google Scholar] [CrossRef]
- Roncero-Sánchez, P.; Parreño Torres, A.; Vázquez, J. Control Scheme of a Concentration Photovoltaic Plant with a Hybrid Energy Storage System Connected to the Grid. Energies 2018, 11, 301. [Google Scholar] [CrossRef]
- Rodrigo, P.; Gutiérrez, S.; Velázquez, R.; Fernández, E.F.; Almonacid, F.; Pérez-Higueras, P.J. A Methodology for the Electrical Characterization of Shaded High Concentrator Photovoltaic Modules. Energy 2015, 89, 768–777. [Google Scholar] [CrossRef]
- Camail, P.; Martin, C.; Allard, B.; Joubert, C.; Darnon, M.; Trovao, J.P. Application of DC/DC Partial Power Conversion to Concentrator Photovoltaics. In Proceedings of the IECON 2022—48th Annual Conference of the IEEE Industrial Electronics Society, Brussels, Belgium, 17 October 2022; pp. 1–6. [Google Scholar]
- Fernández, E.F.; Ferrer-Rodríguez, J.P.; Almonacid, F.; Pérez-Higueras, P. Current-Voltage Dynamics of Multi-Junction CPV Modules under Different Irradiance Levels. Sol. Energy 2017, 155, 39–50. [Google Scholar] [CrossRef]
- Gerstmaier, T.; Zech, T.; Röttger, M.; Braun, C.; Gombert, A. Large-Scale and Long-Term CPV Power Plant Field Results. In Proceedings of the 11th International Conference on Concentrator Photovoltaic Systems: CPV-11, Aix-les-Bains, France, 13–15 April 2015; p. 030002. [Google Scholar]
- Rodrigo, P.M. Balancing the Shading Impact in Utility-Scale Dual-Axis Tracking Concentrator Photovoltaic Power Plants. Energy 2020, 210, 118490. [Google Scholar] [CrossRef]
- Vartiainen, E.; Masson, G.; Breyer, C.; Moser, D.; Román Medina, E. Impact of Weighted Average Cost of Capital, Capital Expenditure, and Other Parameters on Future Utility-scale PV Levelised Cost of Electricity. Prog. Photovolt. Res. Appl. 2020, 28, 439–453. [Google Scholar] [CrossRef]
- Talavera, D.L.; Pérez-Higueras, P.; Ruíz-Arias, J.A.; Fernández, E.F. Levelised Cost of Electricity in High Concentrated Photovoltaic Grid Connected Systems: Spatial Analysis of Spain. Appl. Energy 2015, 151, 49–59. [Google Scholar] [CrossRef]
- Mohammadi, K.; Khanmohammadi, S.; Khorasanizadeh, H.; Powell, K. Development of High Concentration Photovoltaics (HCPV) Power Plants in the US Southwest: Economic Assessment and Sensitivity Analysis. Sustain. Energy Technol. Assess. 2020, 42, 100873. [Google Scholar] [CrossRef]
- Talavera, D.L.; Ferrer-Rodríguez, J.P.; Pérez-Higueras, P.; Terrados, J.; Fernández, E.F. A Worldwide Assessment of Levelised Cost of Electricity of HCPV Systems. Energy Convers. Manag. 2016, 127, 679–692. [Google Scholar] [CrossRef]
- Aghdam, F.H.; Abapour, M. Reliability and Cost Analysis of Multistage Boost Converters Connected to PV Panels. IEEE J. Photovolt. 2016, 6, 981–989. [Google Scholar] [CrossRef]
- Vossos, V.; Gerber, D.; Bennani, Y.; Brown, R.; Marnay, C. Techno-Economic Analysis of DC Power Distribution in Commercial Buildings. Appl. Energy 2018, 230, 663–678. [Google Scholar] [CrossRef]
- Alonso, R.; Pereda, A.; Bilbao, E.; Cortajarena, J.A.; Vidaurrazaga, I.; Román, E. Design and Analysis of Performance of a DC Power Optimizer for HCPV Systems within CPVMatch Project. In Proceedings of the 14th International Conference on Concentrator Photovoltaic Systems (CPV-14), Puertollano, Spain, 16–18 April 2018; p. 050001. [Google Scholar]
- Zhang, H.; Martynov, K.; Perreault, D.J. A CMOS-Based Energy Harvesting Approach for Laterally Arrayed Multibandgap Concentrated Photovoltaic Systems. IEEE Trans. Power Electron. 2020, 35, 9320–9331. [Google Scholar] [CrossRef]
- Fernández, E.F.; Almonacid, F.; Ruiz-Arias, J.A.; Soria-Moya, A. Analysis of the Spectral Variations on the Performance of High Concentrator Photovoltaic Modules Operating under Different Real Climate Conditions. Sol. Energy Mater. Sol. Cells 2014, 127, 179–187. [Google Scholar] [CrossRef]
- Talbert, T.; Thiery, F.; Gachon, D.; Fruchier, O.; Martire, T.; Petit, M. Modelling a Redefined Architecture for Concentrated Photovoltaic Power Plant. In Proceedings of the 2019 5th International Conference on Event-Based Control, Communication, and Signal Processing (EBCCSP), Vienna, Austria, 27–29 May 2019; pp. 1–6. [Google Scholar]
- Camail, P.; Martin, C.; Allard, B.; Joubert, C.; Darnon, M.; Trovao, J.P. A Novel Partial Power Cascaded DC/DC Topology for CPV Application: A Theoretical Study. In Proceedings of the 2023 IEEE 14th International Conference on Power Electronics and Drive Systems (PEDS), Montréal, QC, Canada, 7–10 August 2023. [Google Scholar]
- Zaman, M.S.; Wen, Y.; Fernandes, R.; Buter, B.; Doorn, T.; Dijkstra, M.; Bergveld, H.J.; Trescases, O. A Cell-Level Differential Power Processing IC for Concentrating-PV Systems with Bidirectional Hysteretic Current-Mode Control and Closed-Loop Frequency Regulation. IEEE Trans. Power Electron. 2015, 30, 7230–7244. [Google Scholar] [CrossRef]
- Baek, S.-H.; Lee, S.-R.; Won, C.-Y. A Novel Phase Shedding Control Algorithm Considering Maximum Efficiency for 3-Phase Interleaved Boost Converter. In Proceedings of the 2016 IEEE Transportation Electrification Conference and Expo, Asia-Pacific (ITEC Asia-Pacific), Busan, Republic of Korea, 1–4 June 2016; pp. 427–431. [Google Scholar]
- Neuhaus, K.; Alonso, C.; Gladysz, L.; Delamarre, A.; Watanabe, K.; Sugiyama, M. Solar to Hydrogen Conversion Using Concentrated Multi-Junction Photovoltaics and Distributed Micro-Converter Architecture. In Proceedings of the 2018 7th International Conference on Renewable Energy Research and Applications (ICRERA), Paris, France, 14–17 October 2018; pp. 744–747. [Google Scholar]
- Anzola, J.; Aizpuru, I.; Romero, A.A.; Loiti, A.A.; Lopez-Erauskin, R.; Artal-Sevil, J.S.; Bernal, C. Review of Architectures Based on Partial Power Processing for DC-DC Applications. IEEE Access 2020, 8, 103405–103418. [Google Scholar] [CrossRef]
- Kouro, S.; Leon, J.I.; Vinnikov, D.; Franquelo, L.G. Grid-Connected Photovoltaic Systems: An Overview of Recent Research and Emerging PV Converter Technology. IEEE Ind. Electron. Mag. 2015, 9, 47–61. [Google Scholar] [CrossRef]
- Mao, M.; Cui, L.; Zhang, Q.; Guo, K.; Zhou, L.; Huang, H. Classification and Summarization of Solar Photovoltaic MPPT Techniques: A Review Based on Traditional and Intelligent Control Strategies. Energy Rep. 2020, 6, 1312–1327. [Google Scholar] [CrossRef]
- Lai, C.S.; McCulloch, M.D. Levelized Cost of Electricity for Solar Photovoltaic and Electrical Energy Storage. Appl. Energy 2017, 190, 191–203. [Google Scholar] [CrossRef]
Disclaimer/Publisher’s Note: The statements, opinions and data contained in all publications are solely those of the individual author(s) and contributor(s) and not of MDPI and/or the editor(s). MDPI and/or the editor(s) disclaim responsibility for any injury to people or property resulting from any ideas, methods, instructions or products referred to in the content. |
© 2023 by the authors. Licensee MDPI, Basel, Switzerland. This article is an open access article distributed under the terms and conditions of the Creative Commons Attribution (CC BY) license (https://creativecommons.org/licenses/by/4.0/).