The Potential of Chemically Recuperated Power Cycles in Markets with High Shares of Variable Renewables

 , , and
Abstract
:1. Introduction
2. Methodology
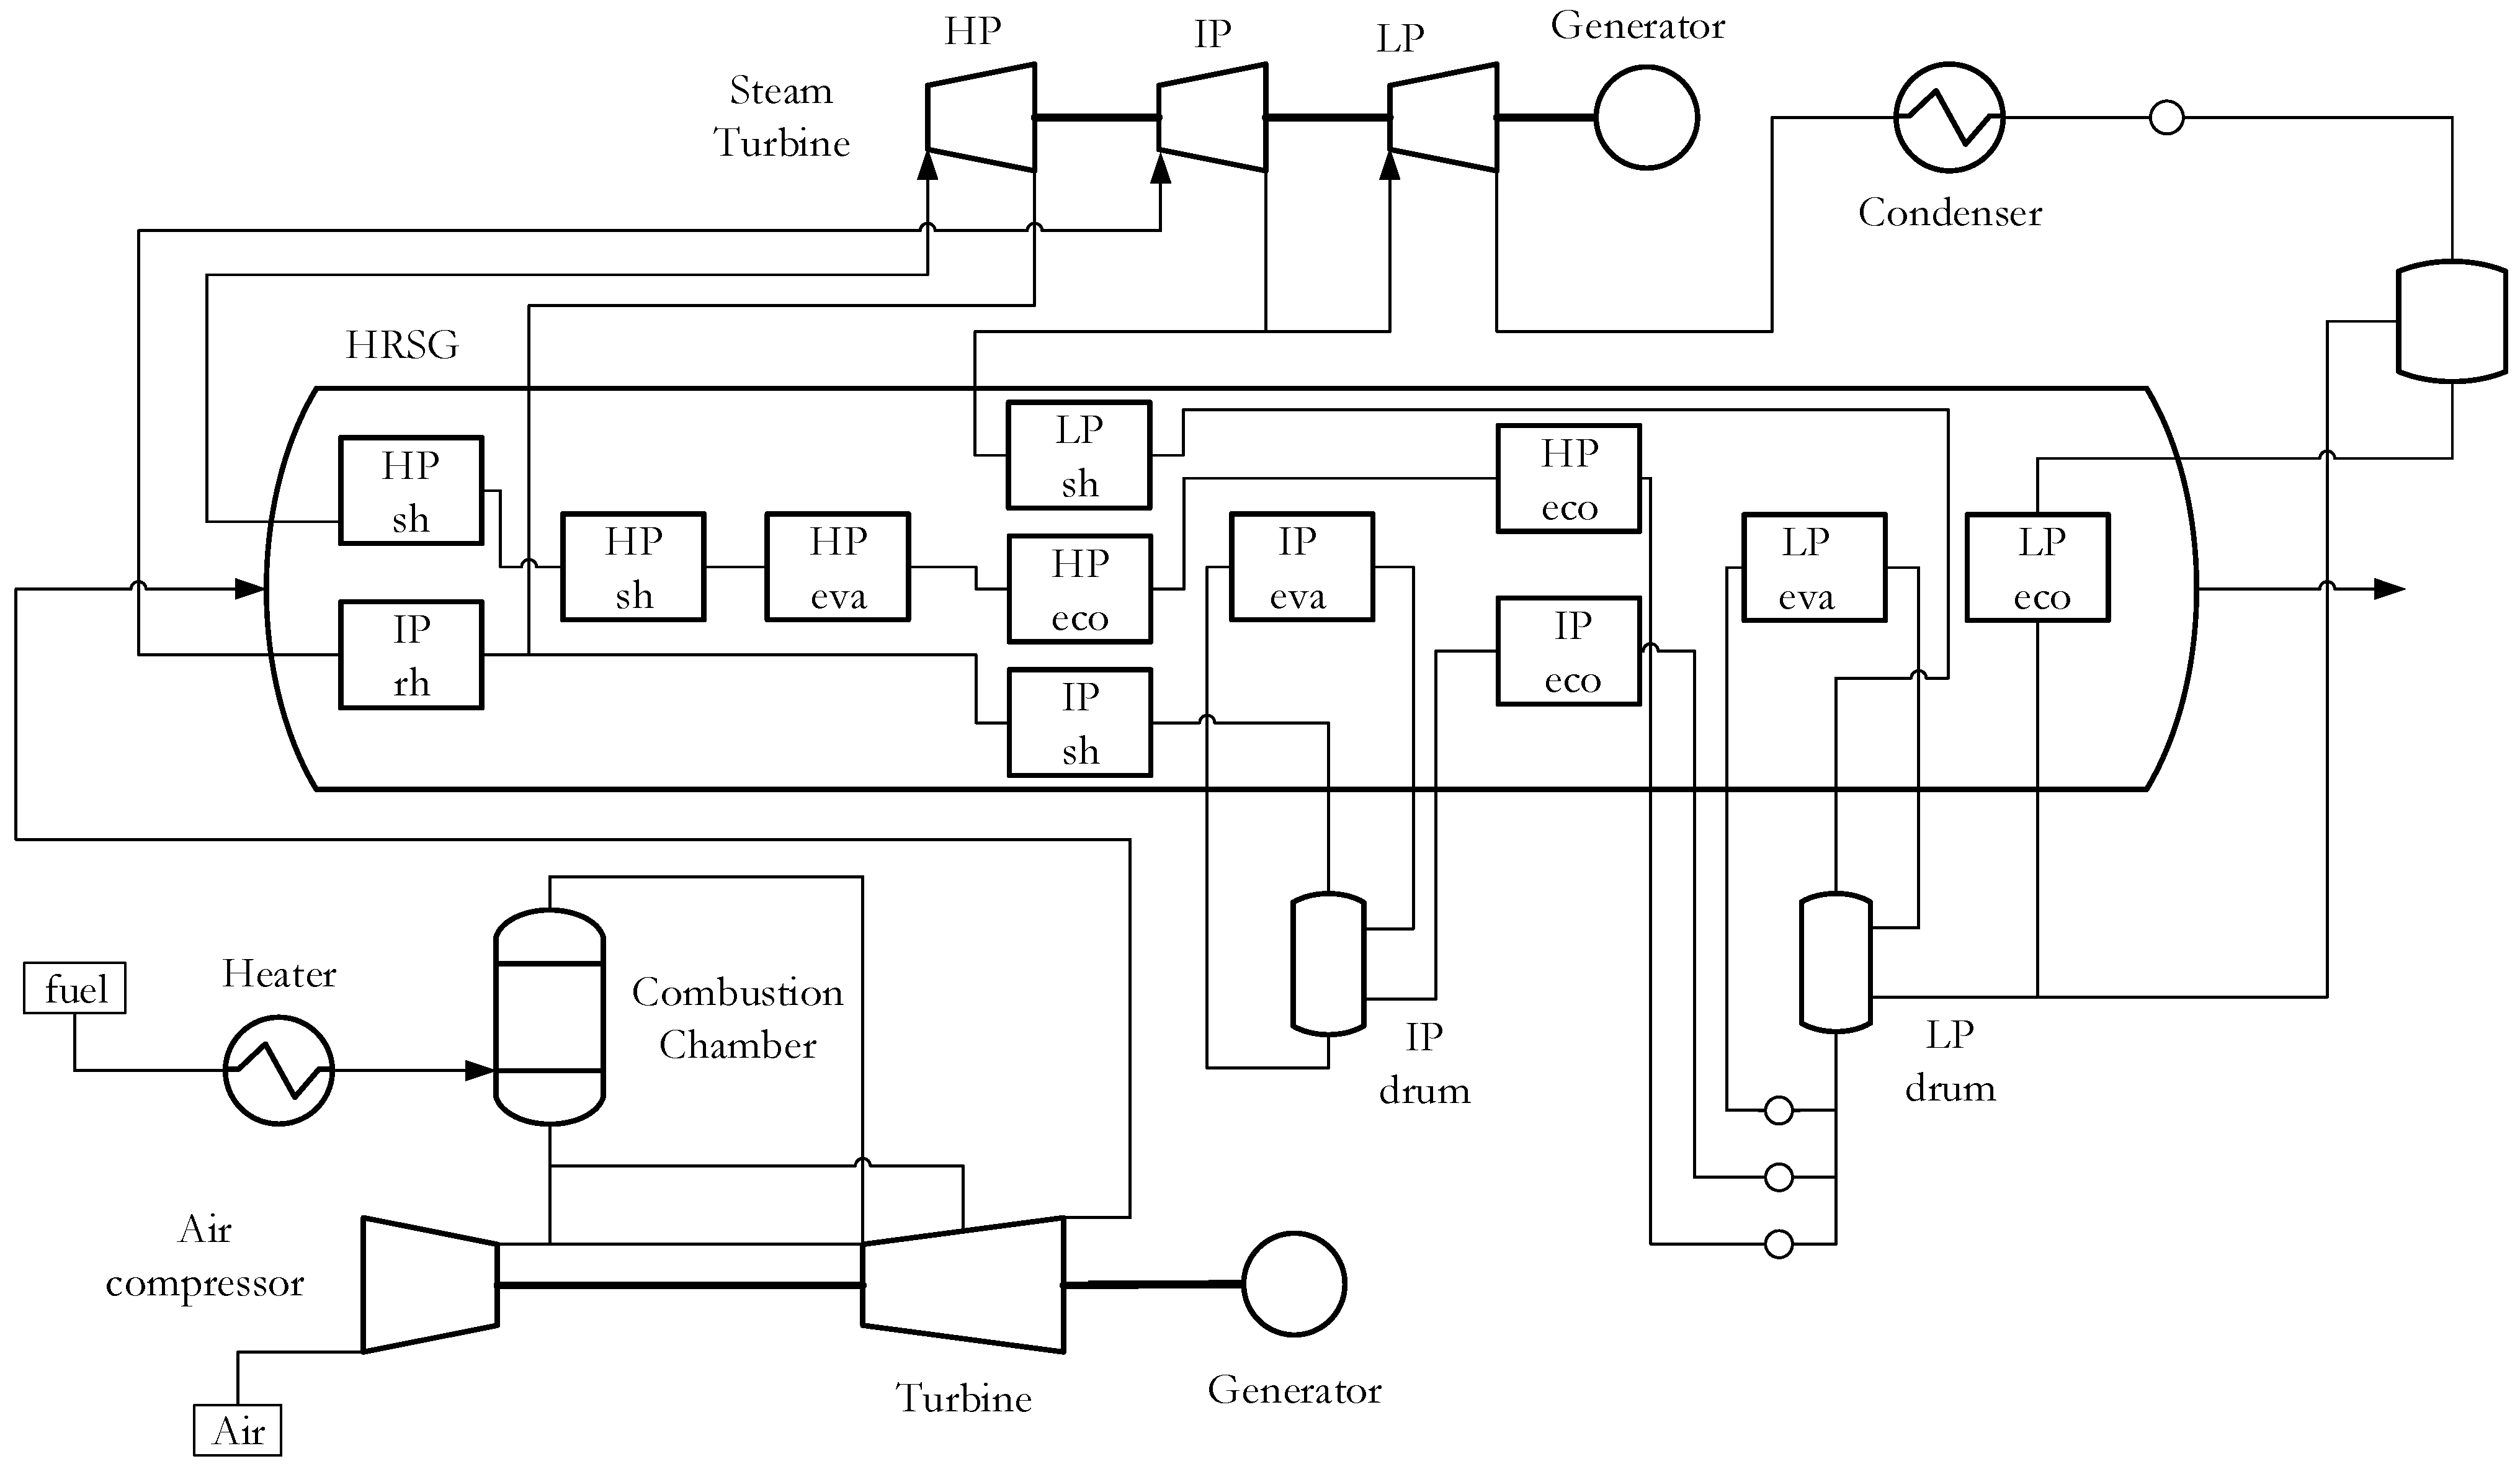
2.1. Power Cycle Modeling
2.2. Plant Key Performance Indicators
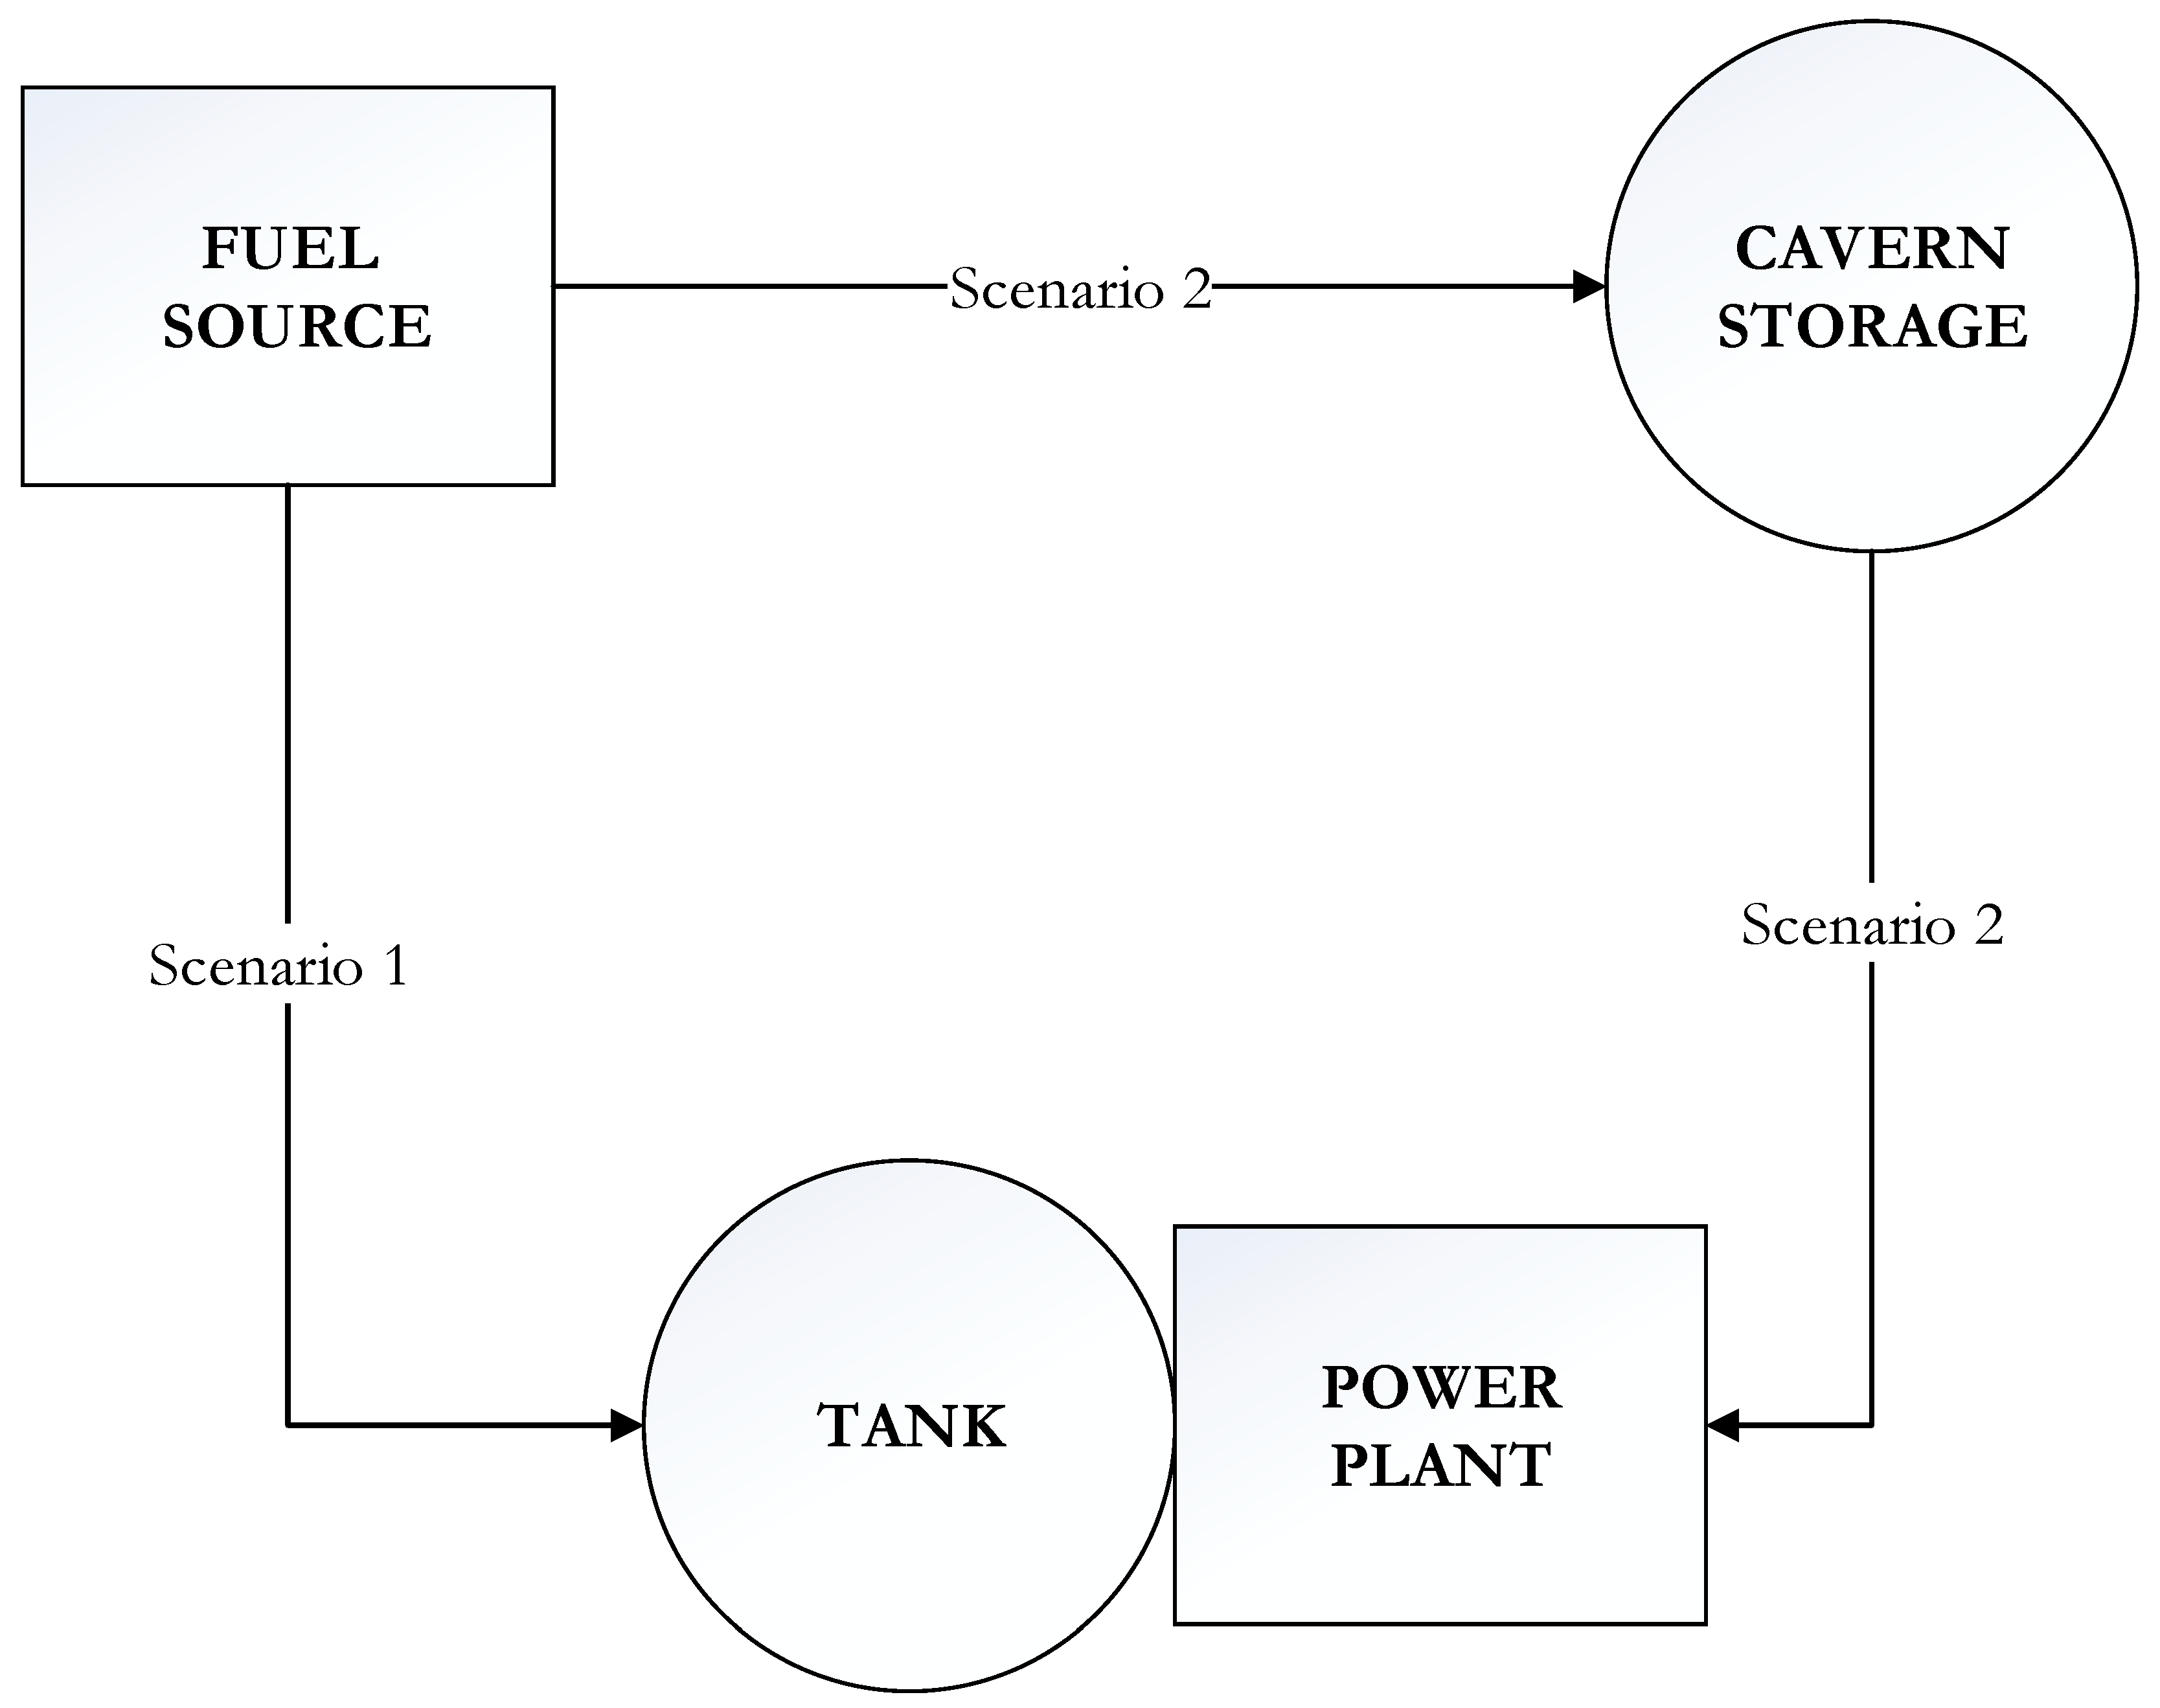
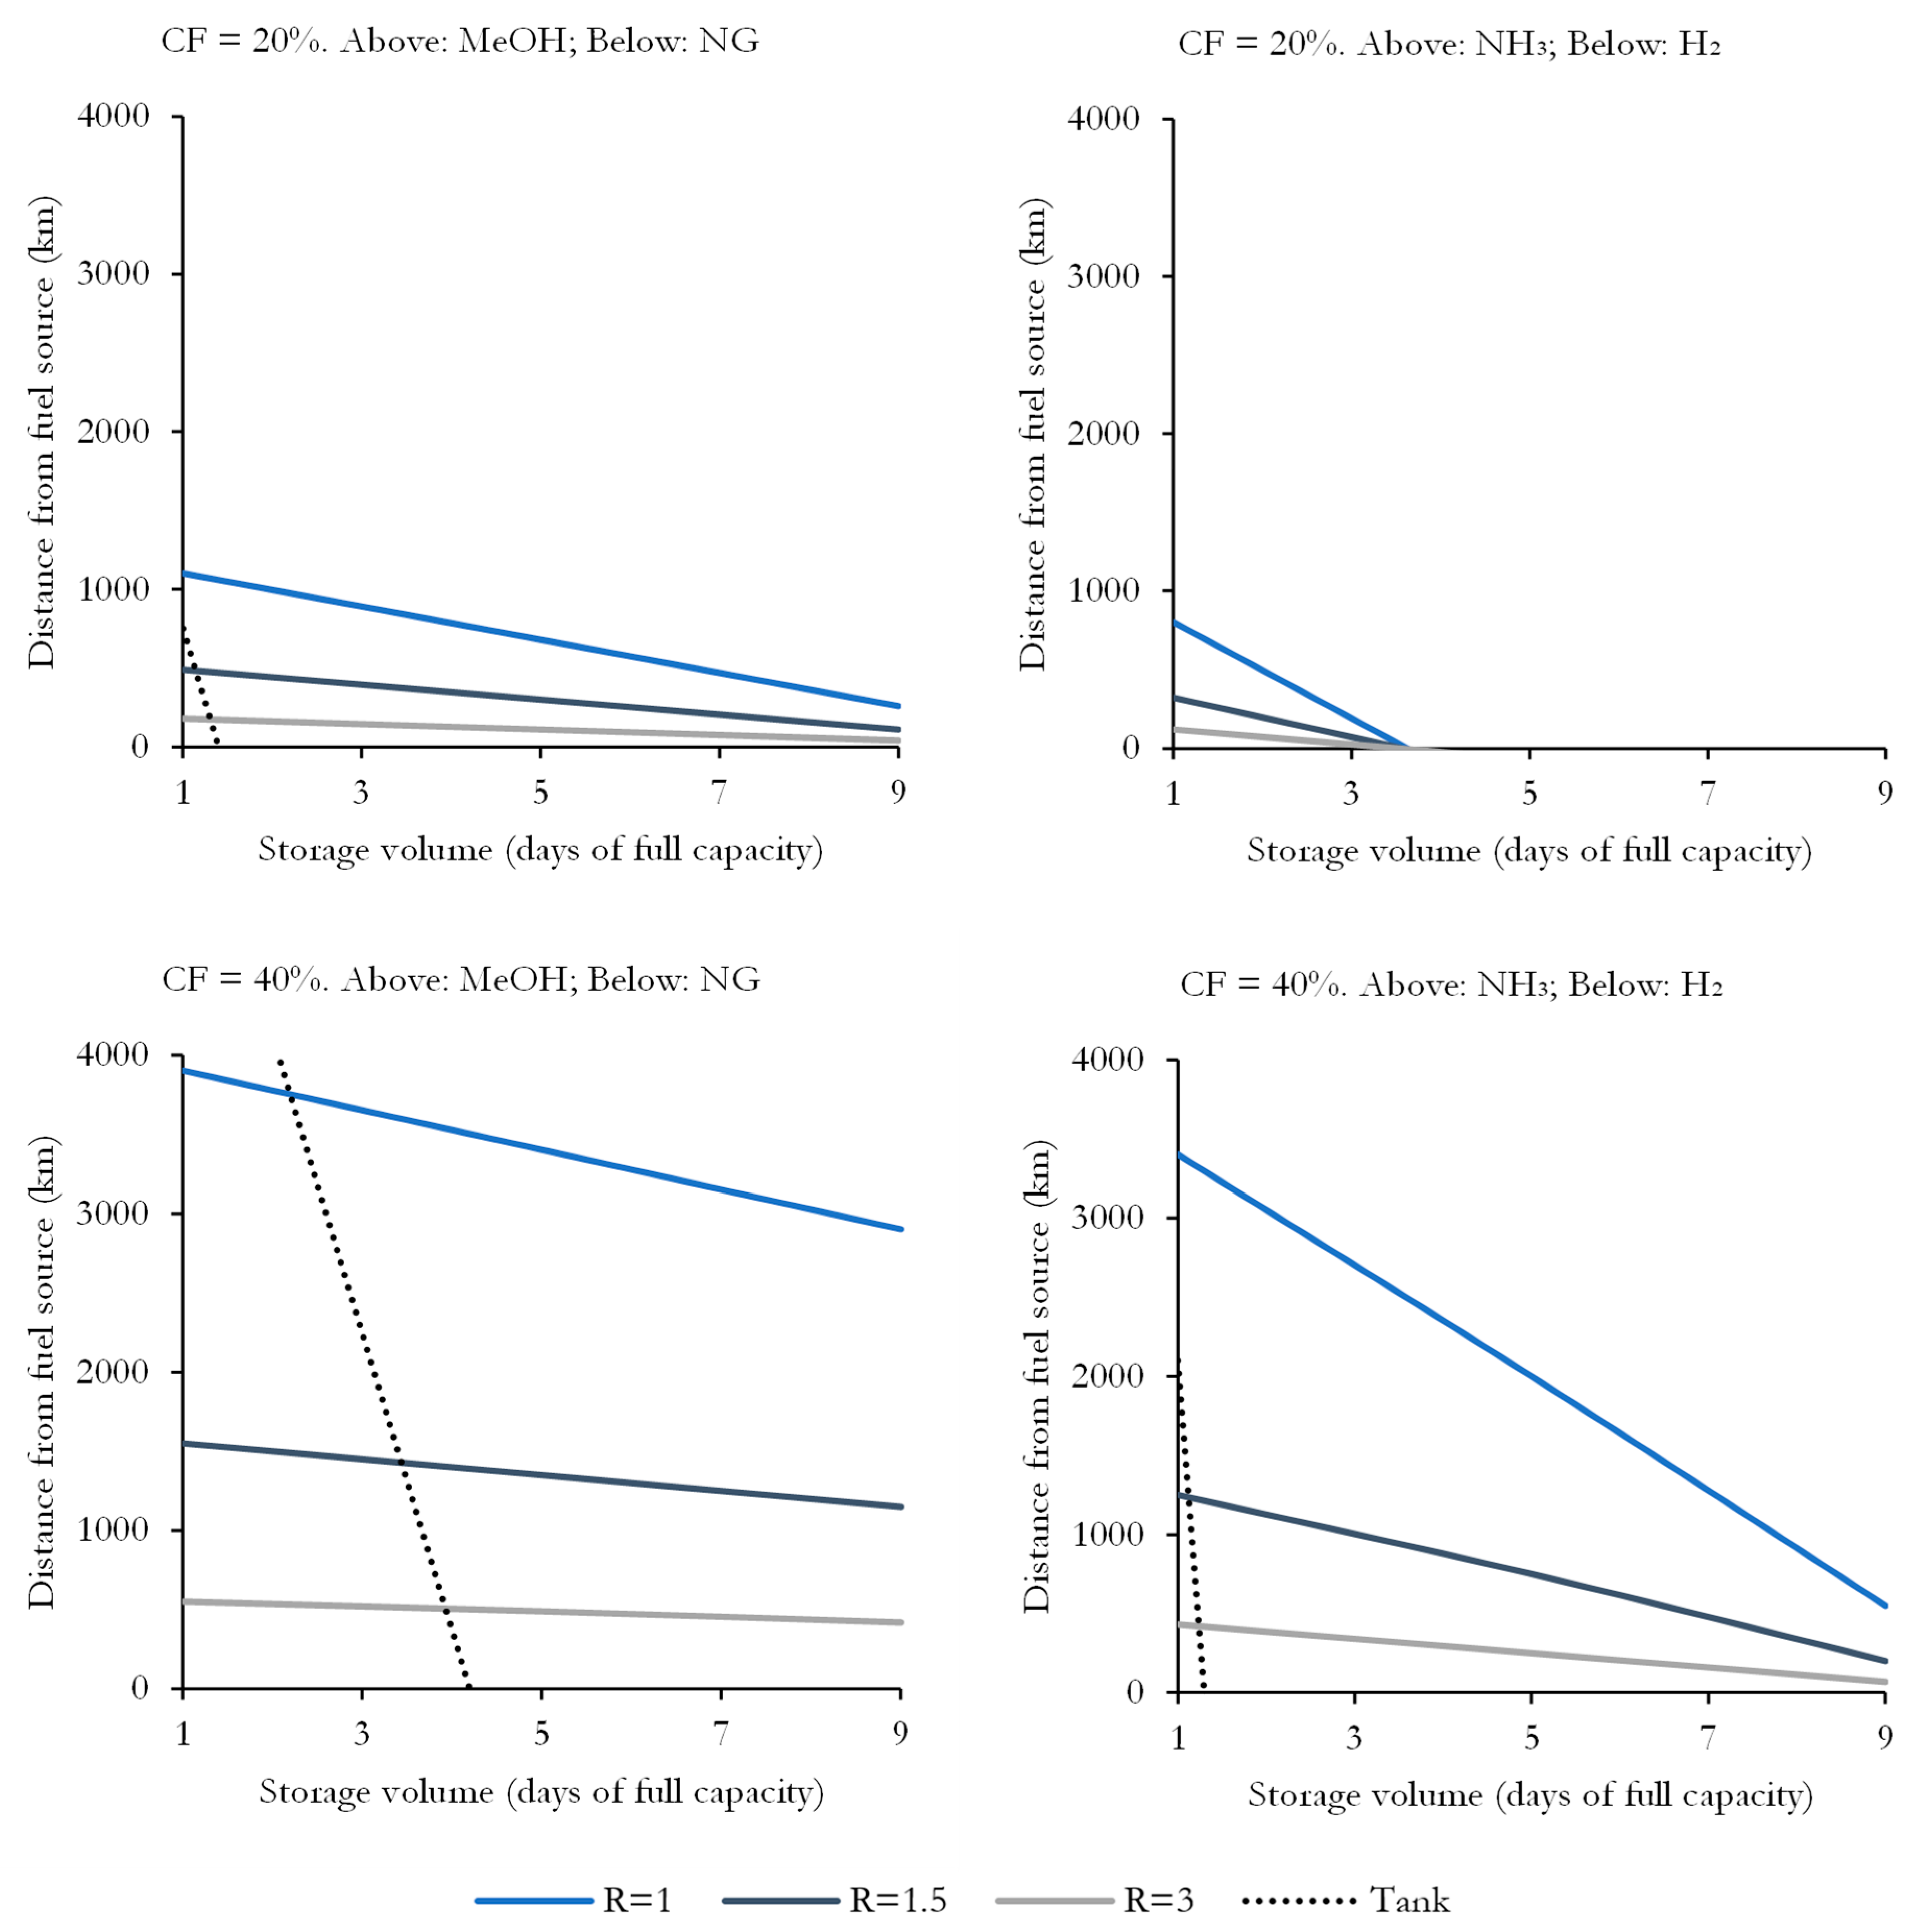
2.3. Fuel Transmission and Storage
2.4. Economic Assessment
3. Results and Discussion
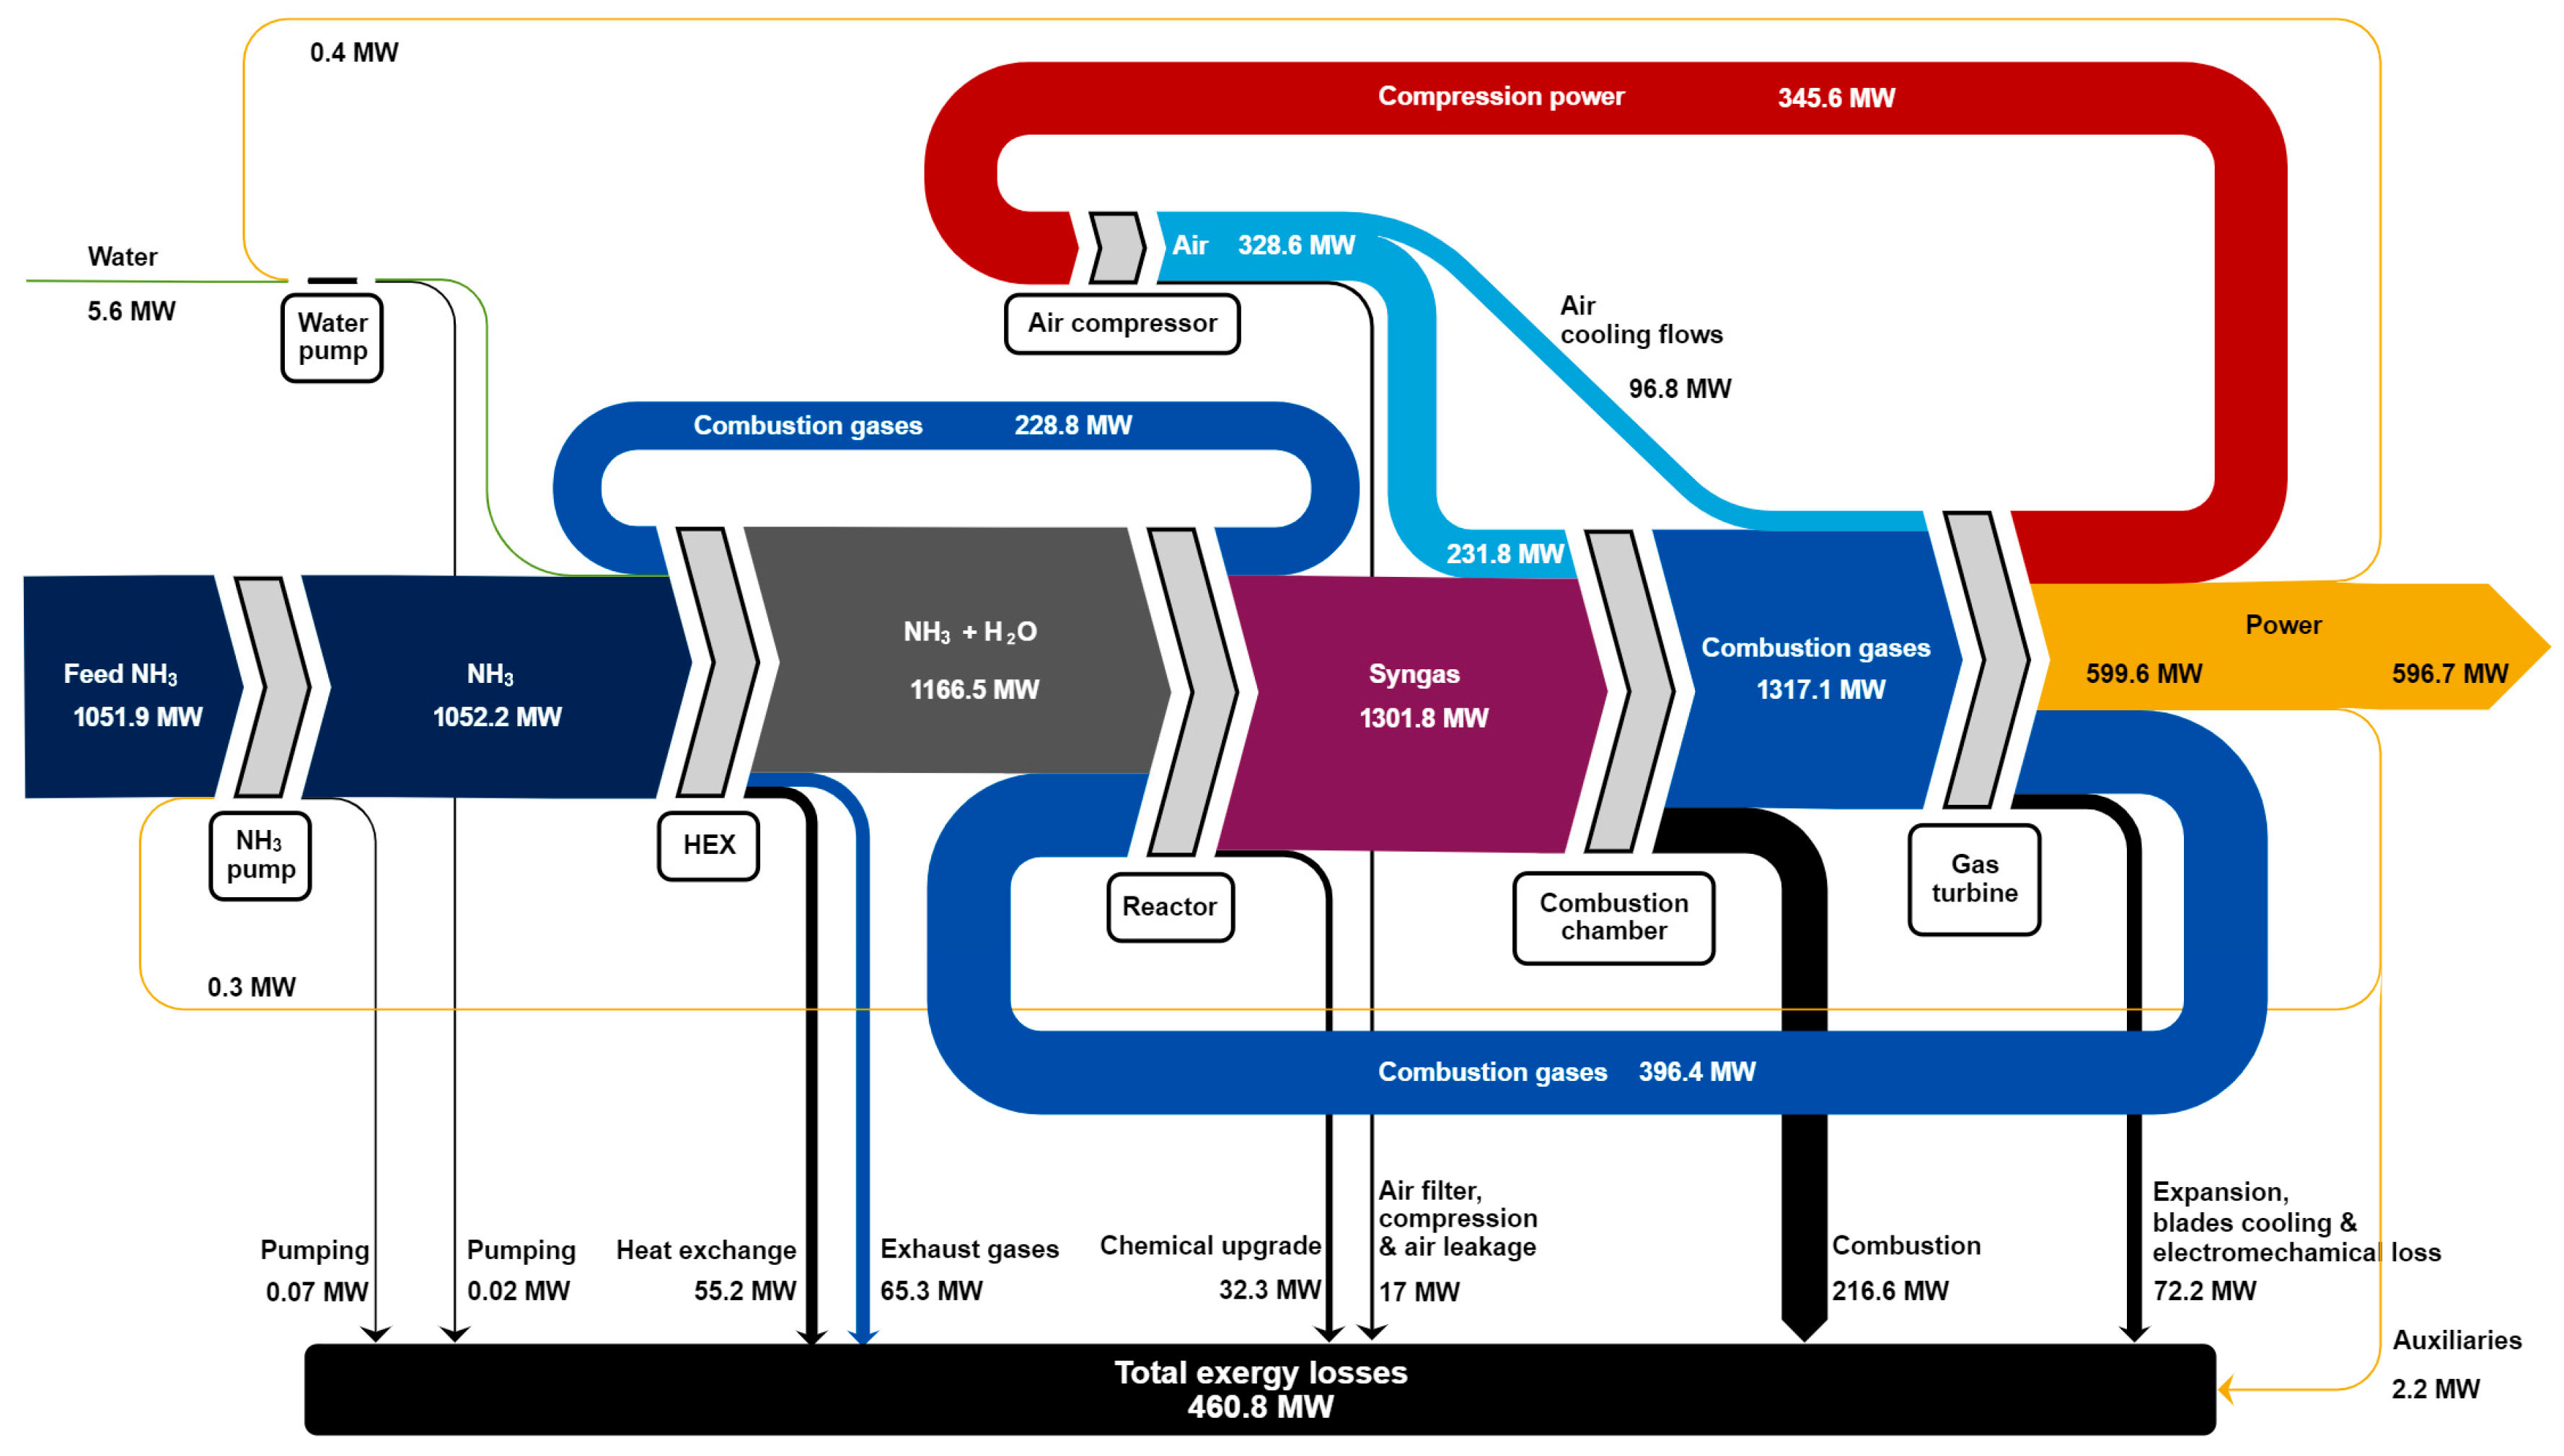
3.1. Energy and Environmental
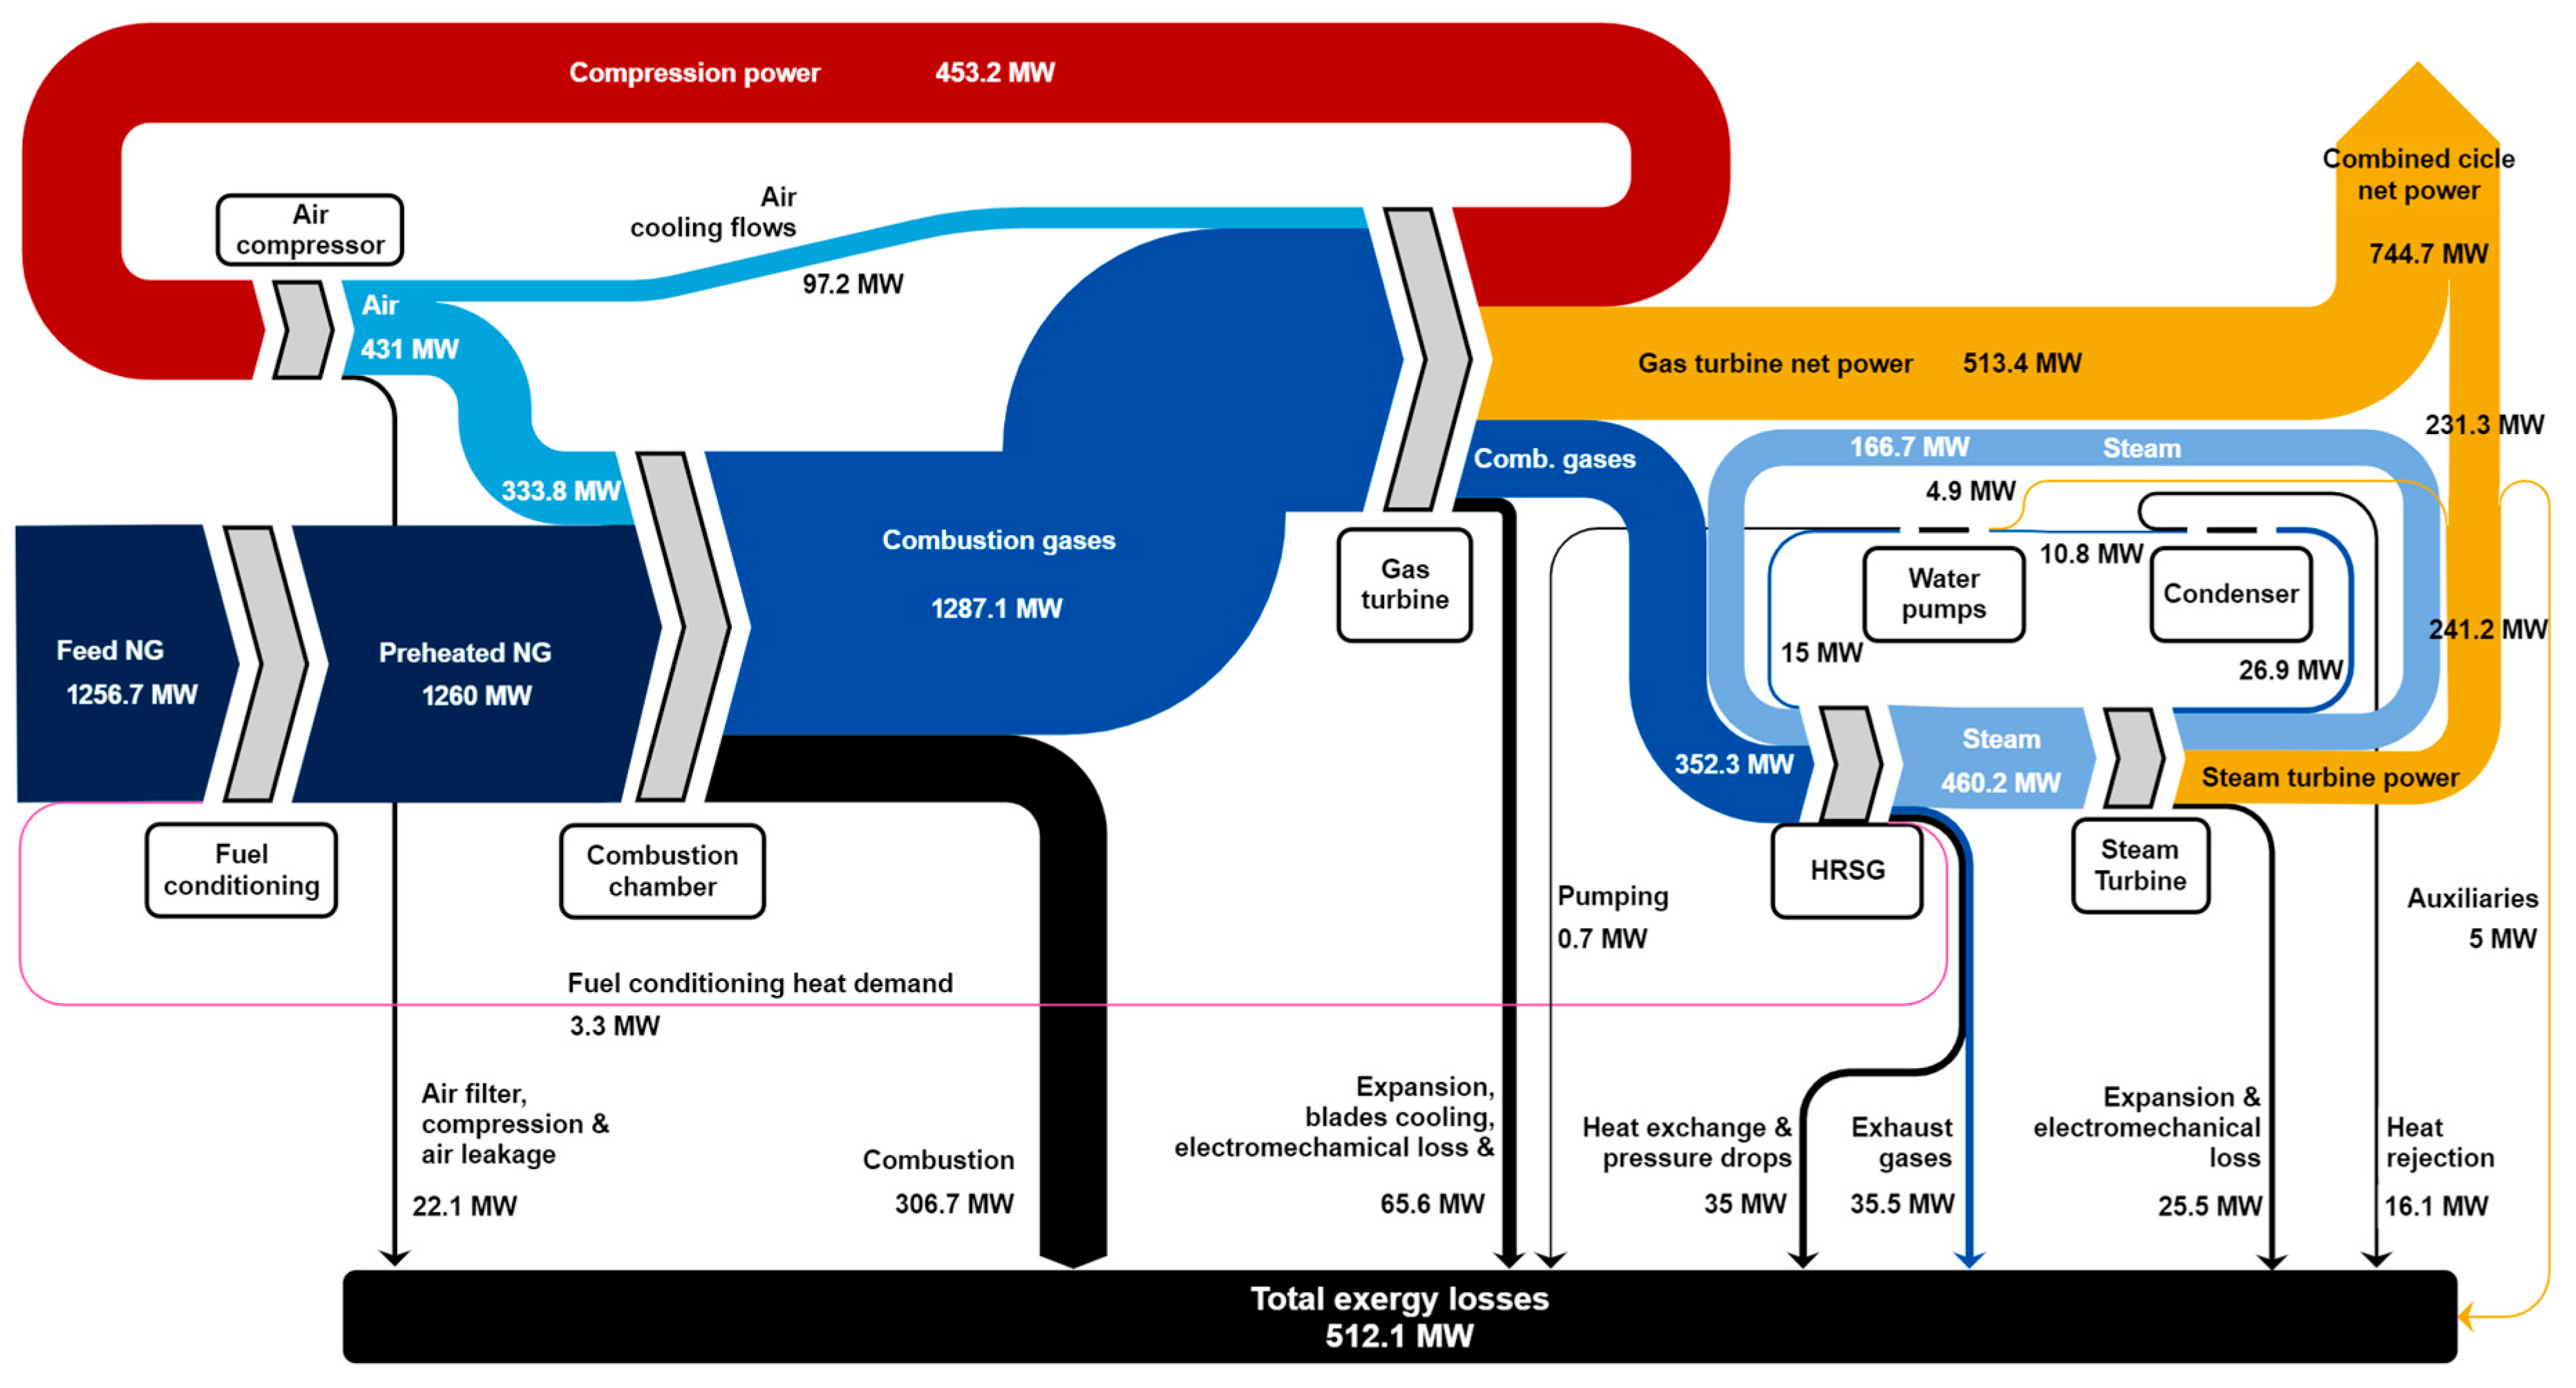
3.2. Exergy
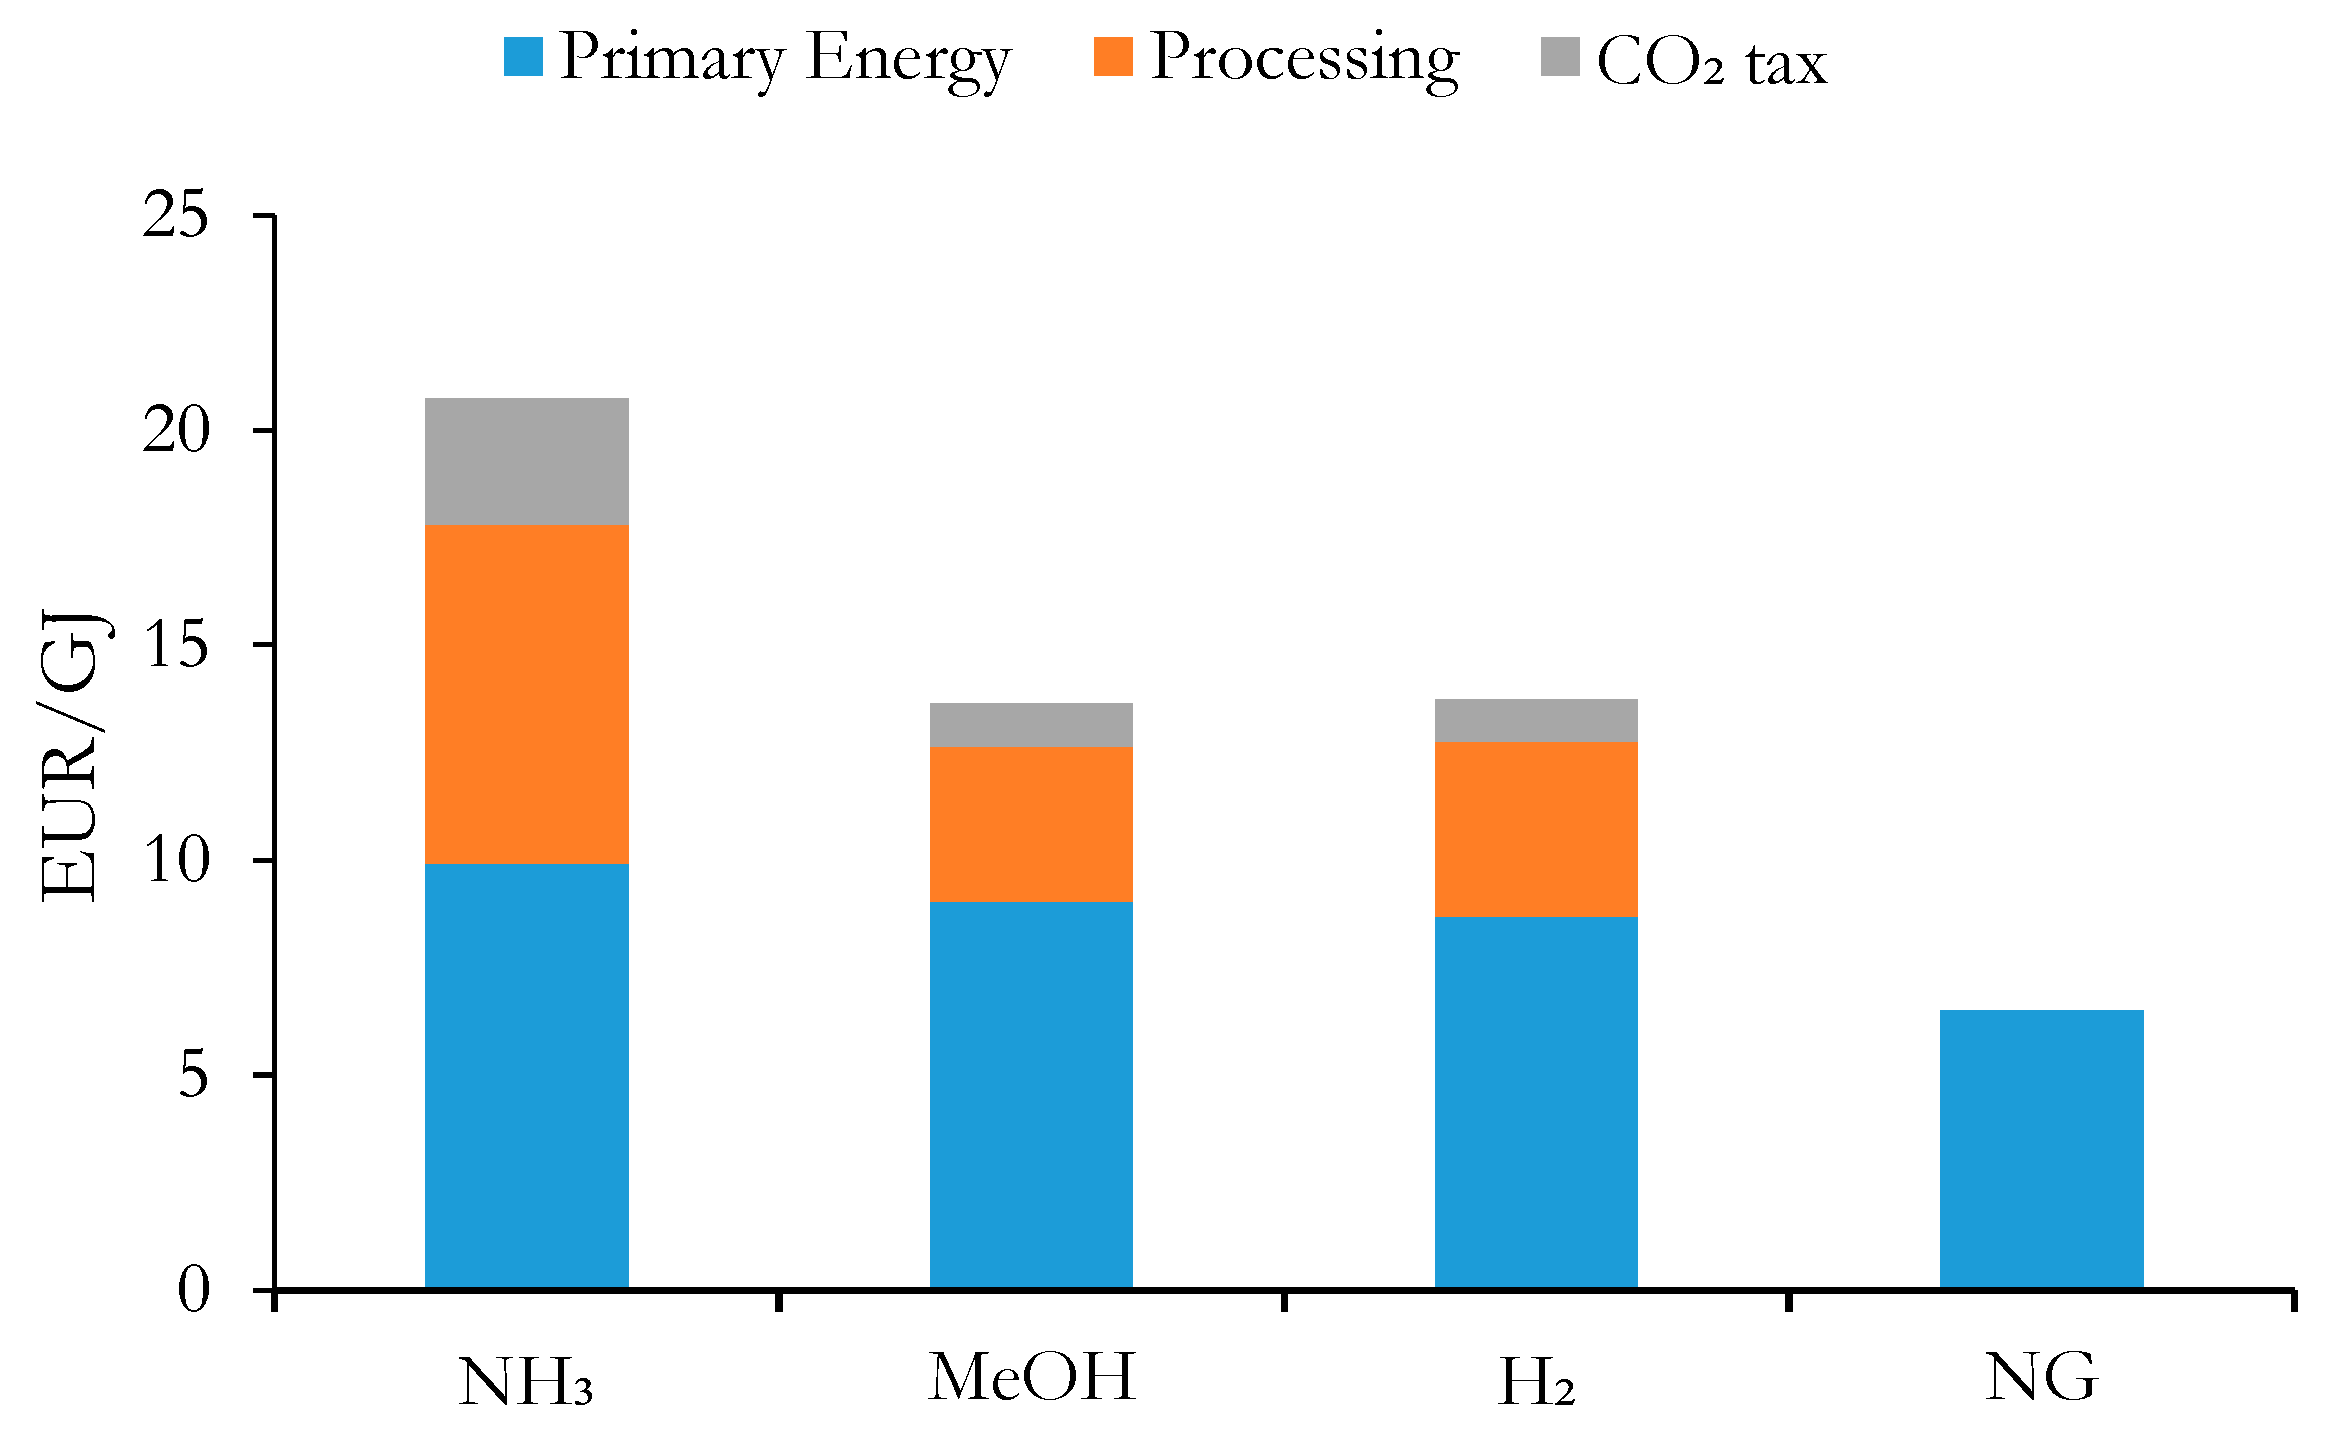
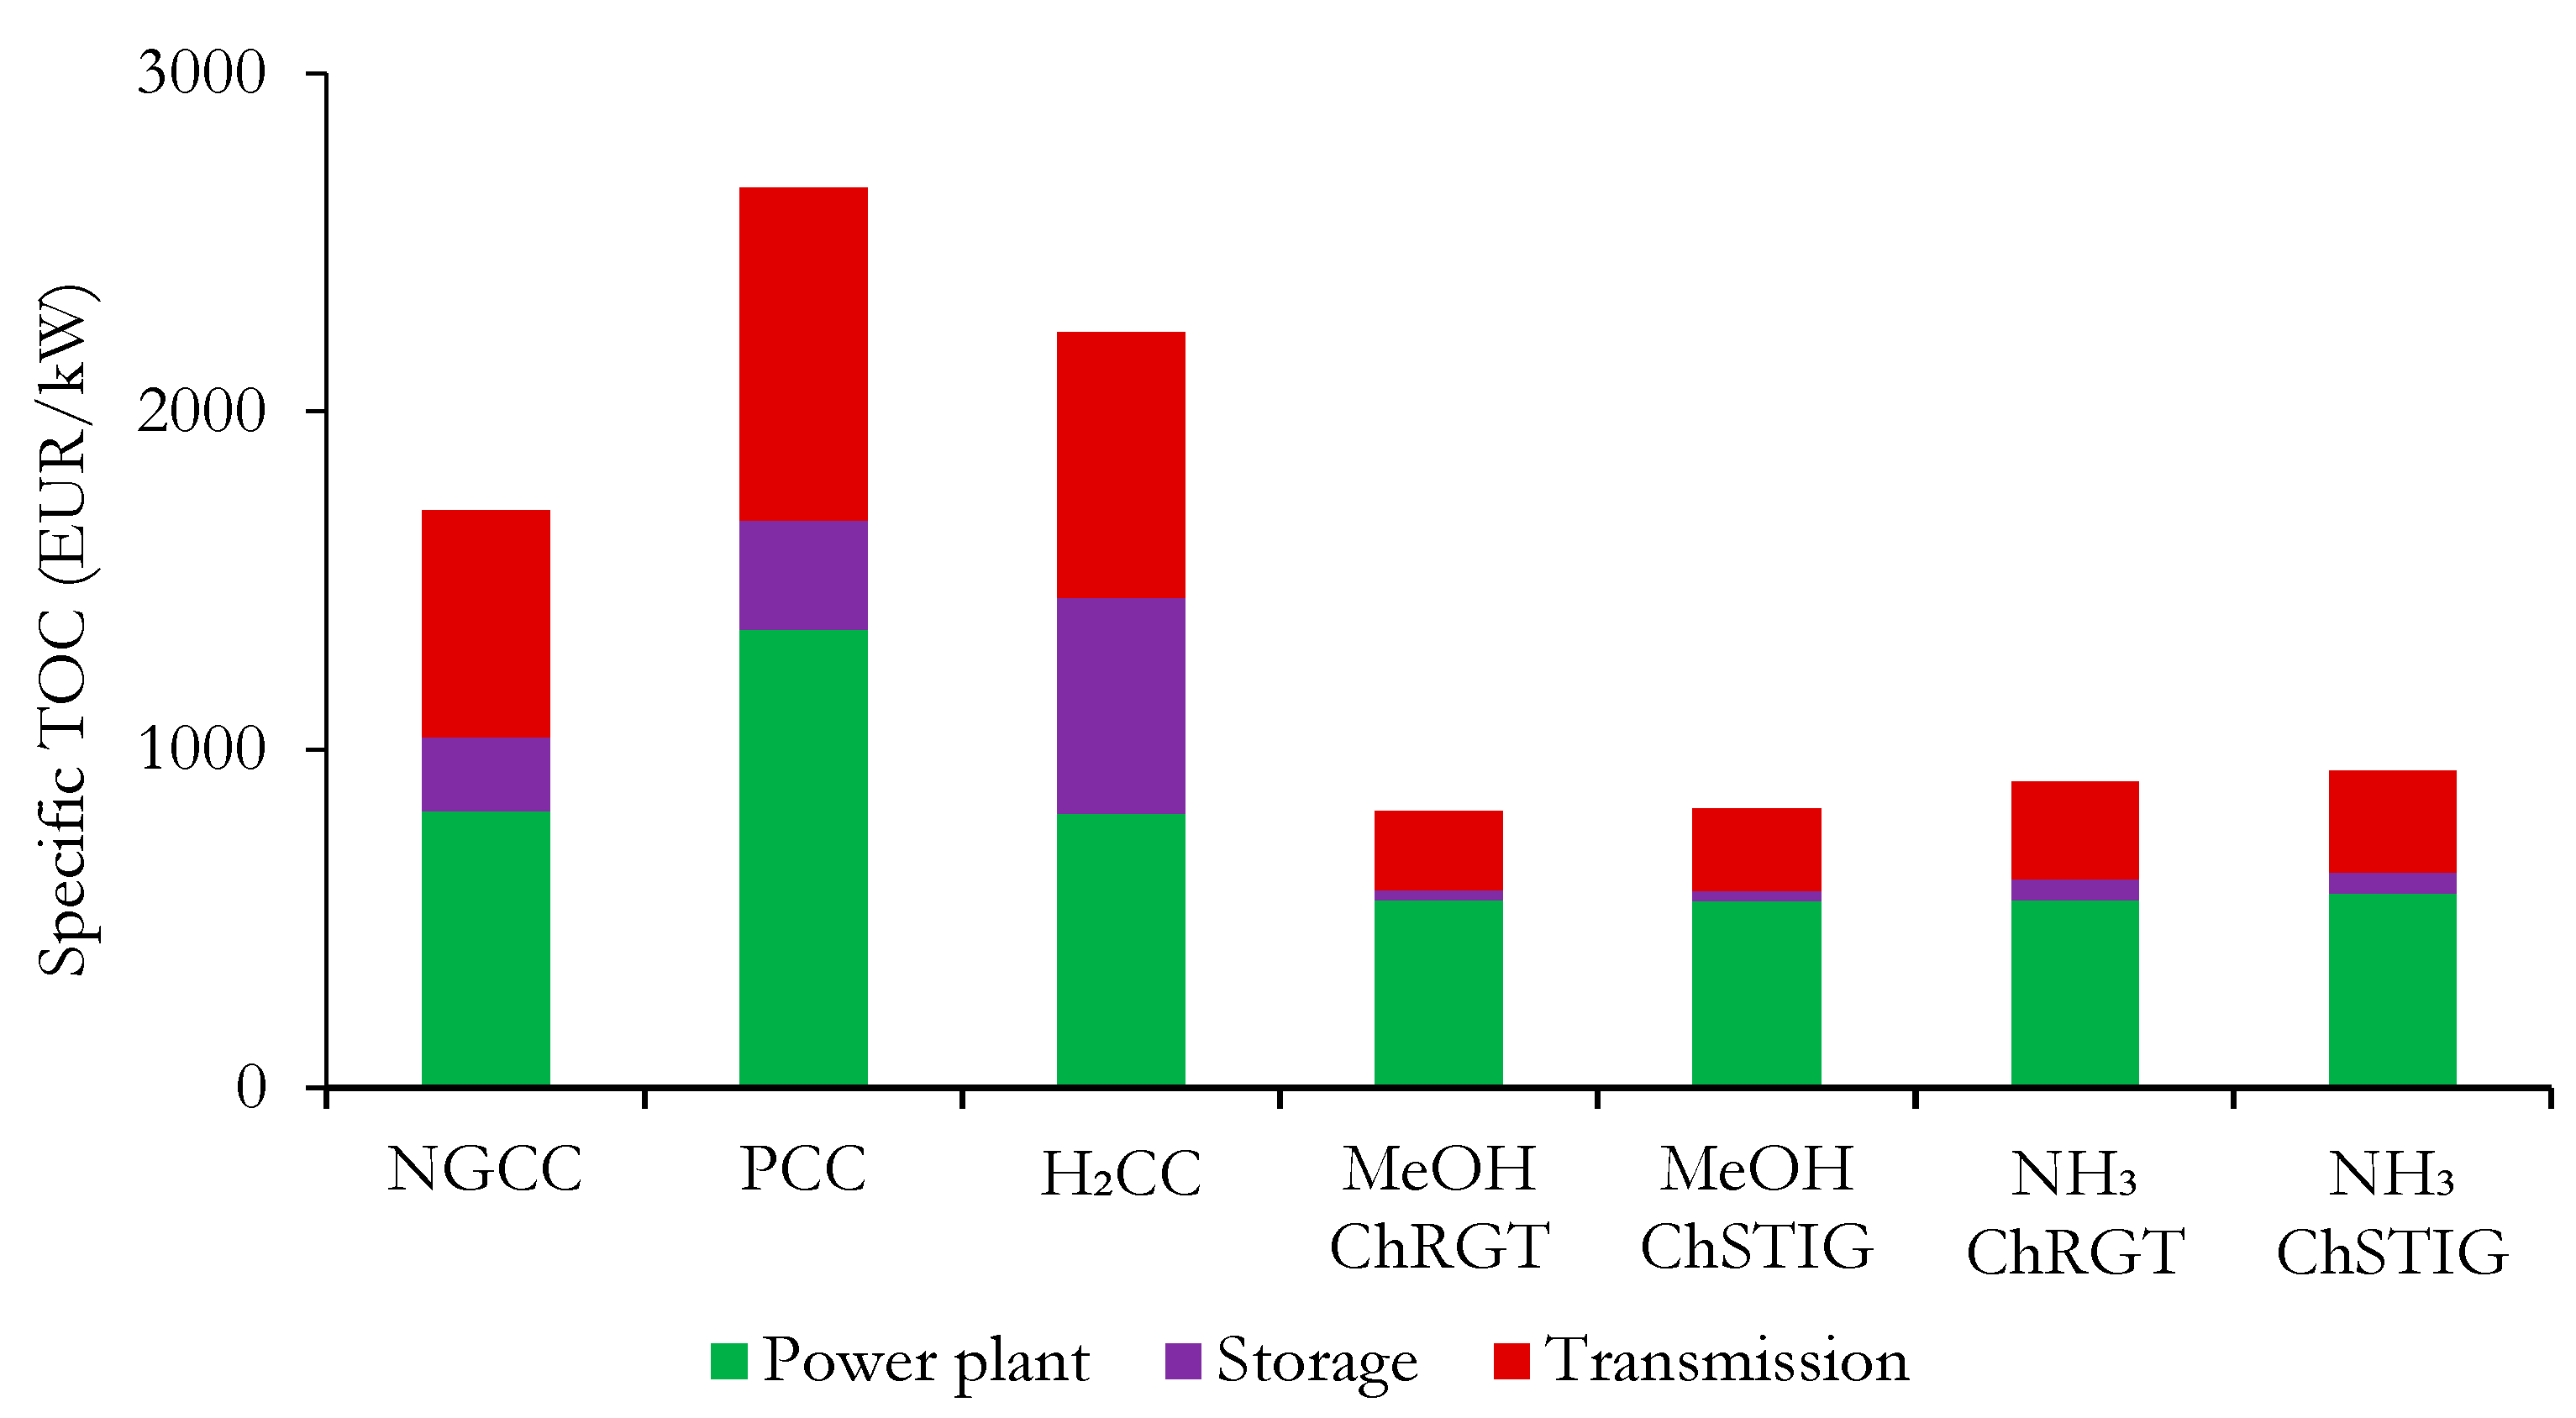
3.3. Economic
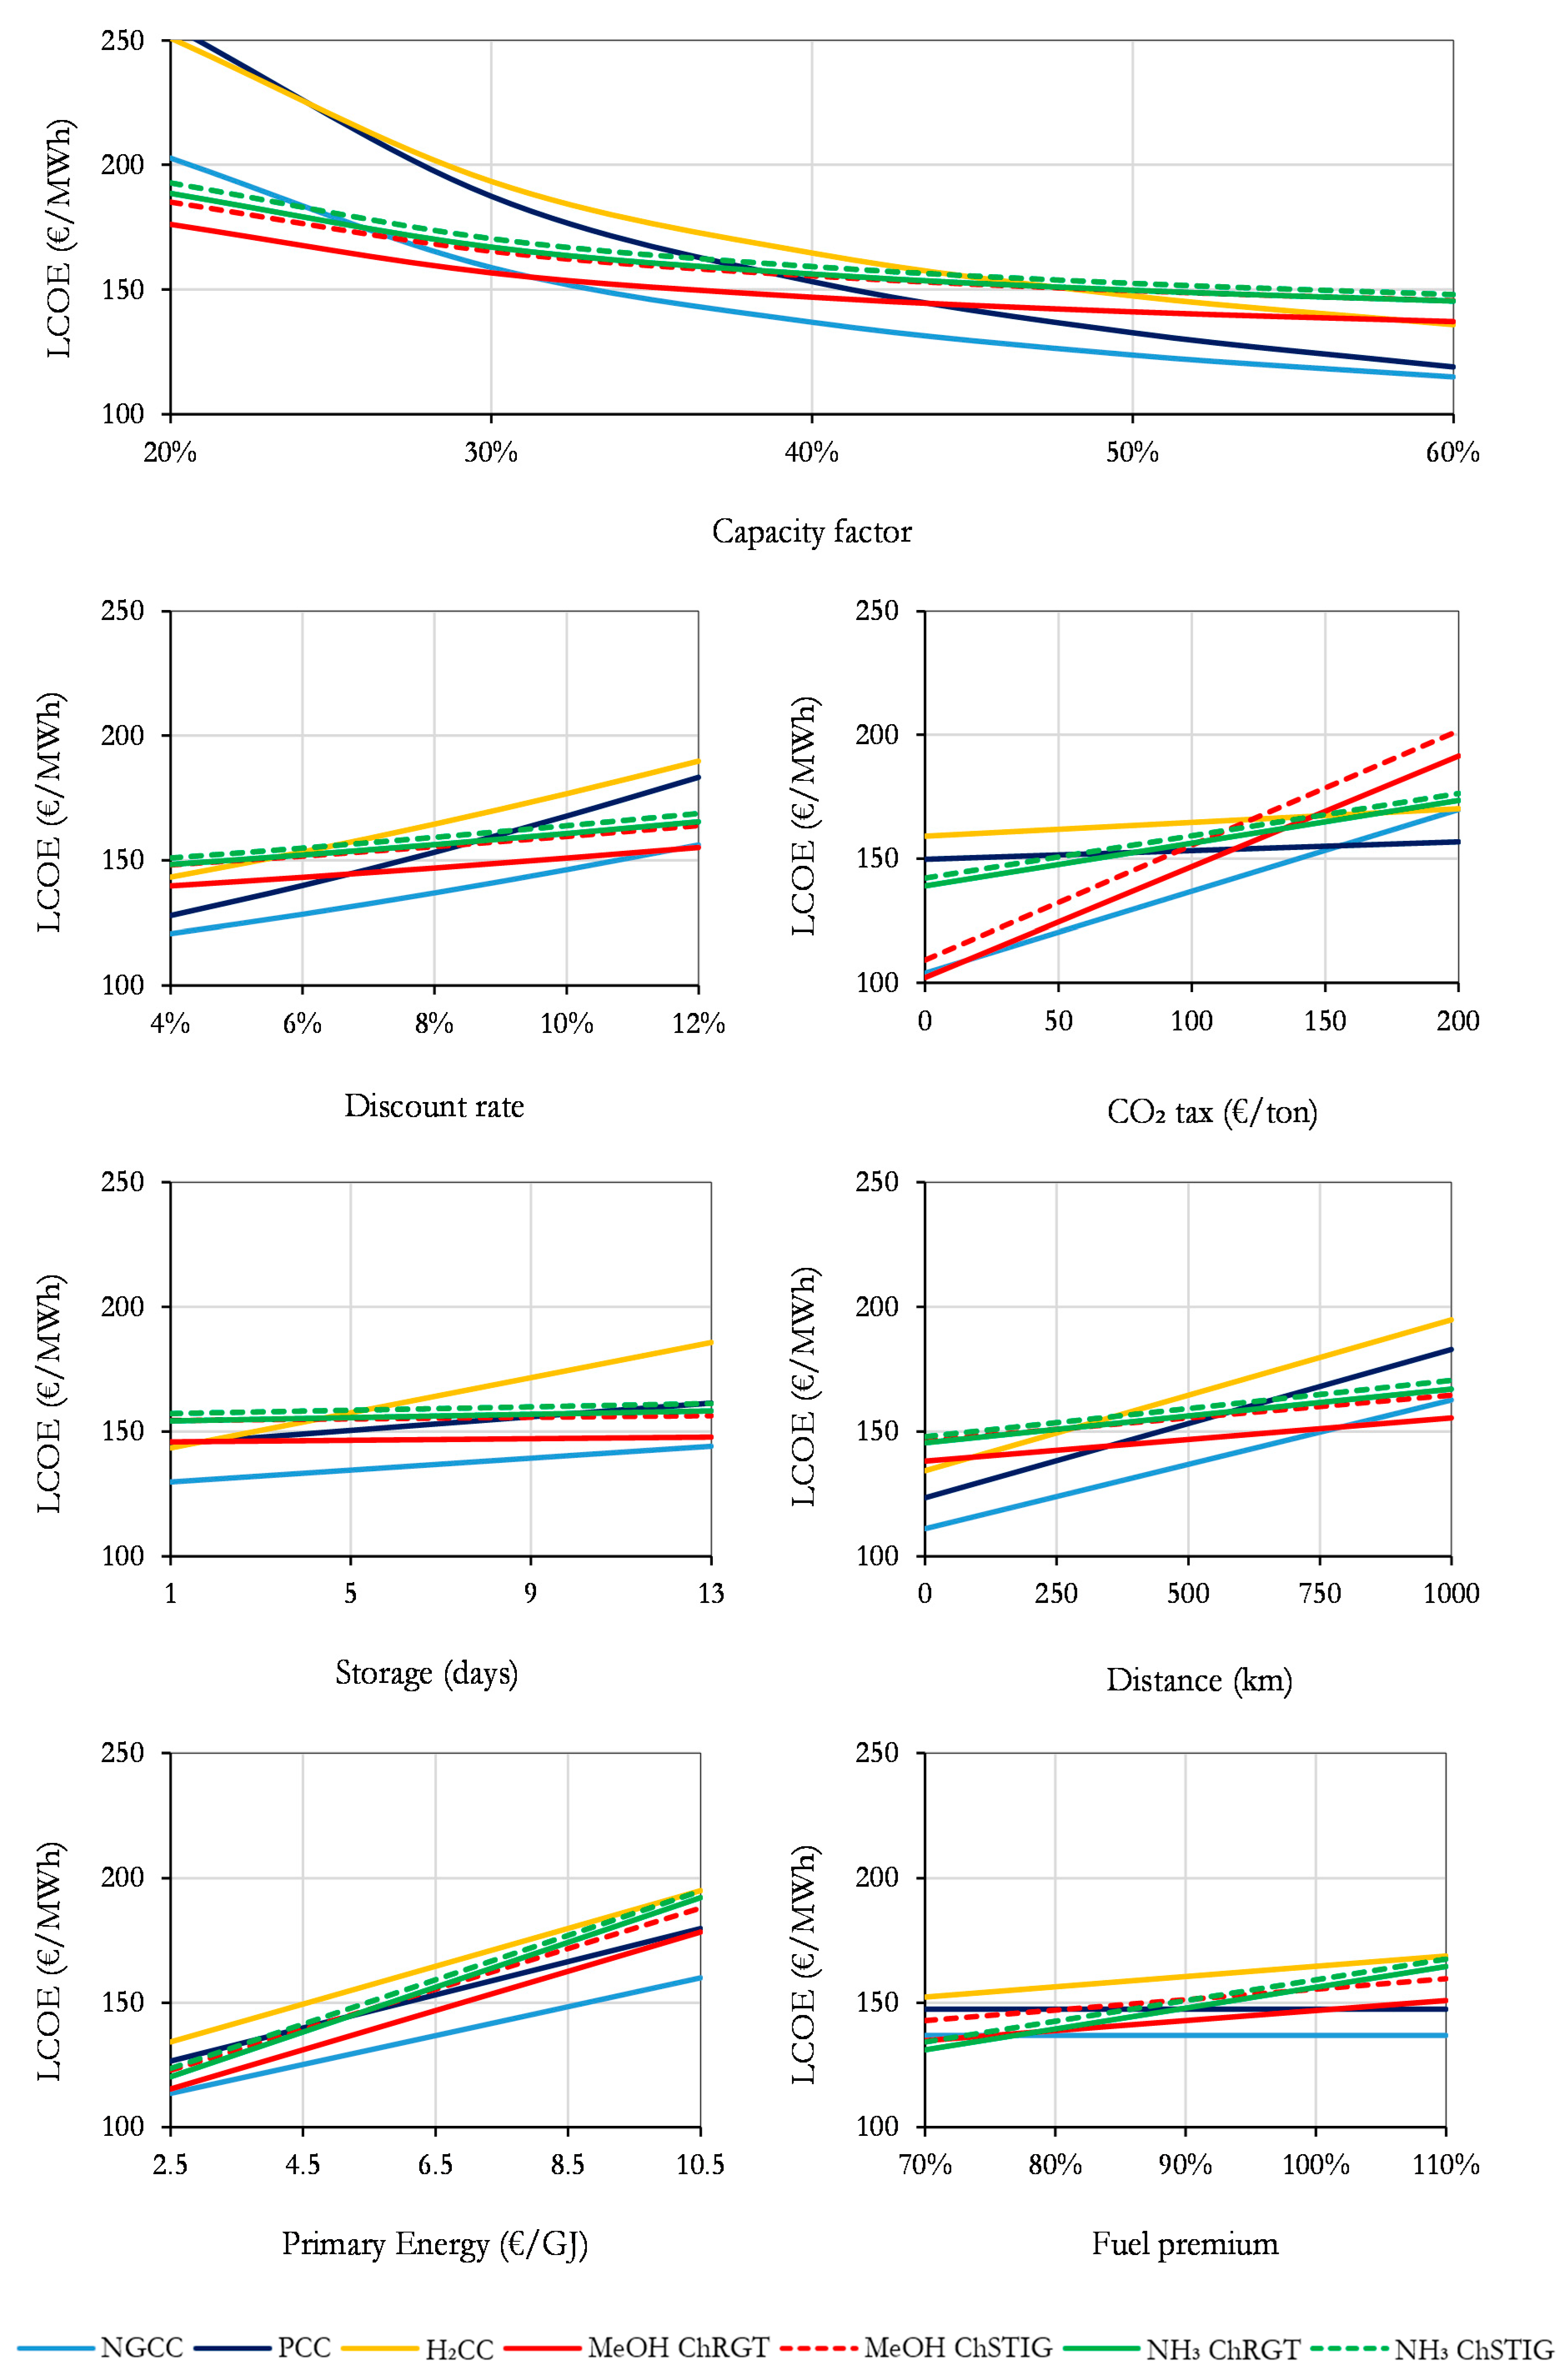
3.4. Sensitivity Analysis
4. Conclusions
Author Contributions
Funding

Data Availability Statement
Acknowledgments
Conflicts of Interest
Abbreviations
| Acronyms | |
| NG | Natural gas |
| Sc | Scenario |
| TOC | Total overnight cost |
| TOT | Turbine outlet temperature |
| ACF | Annualized cash flows |
| ASME | American Society of Mechanical Engineers |
| BEC | Bare erected cost |
| CCS | Carbon capture and storage |
| CC | Combined cycle |
| CF | Capacity factor |
| Ch | Chemical |
| COT | Combustor outlet temperature |
| EPC | Engineering, procurement and construction |
| Eva | Evaporator |
| Eco | Economizer |
| FOM | Fixed operating and maintenance costs |
| GHG | Greenhouse gas |
| HAT | Humid air turbine |
| HP | High pressure |
| HRSG | Heat recovery steam generator |
| IP | Intermediate pressure |
| LP | Low pressure |
| LCOE | Levelized cost of electricity |
| LHV | Lower heating value |
| MEA | Methyl-ethanol amine |
| MITA | Minimal internal temperature approach |
| NPV | Net present value |
| OC | Owners costs |
| PC | Process contingency |
| PT | Project contingency |
| RES | Renewable energy sources |
| RGT | Recuperated gas turbine |
| Rh | Reheater |
| Sh | Superheater |
| STIG | Steam injection cycle |
| SEA | Standardized economic assessment |
| TIT | Turbine inlet temperature |
| TOT | Turbine outlet temperature |
| TOC | Total overnight cost |
| T&S | Transport and storage |
| tpd | Tons per day |
| VOM | Variable operating and maintenance cost |
| List of Symbols | |
| Exergy (J) | |
| Specific emissions (kg/MWh) | |
| Exergy flow (J/mol) | |
| Exergy destruction (J) | |
| Mass flow (kg/s) | |
| Pressure (bar) | |
| Time (s) | |
| Temperature (K) | |
| Volume (m3) | |
| Heat (J) | |
| Work (J) | |
| Exergy efficiency | |
| Thermal efficiency (%) | |
References
- International Energy Agency. World Energy Outlook; IEA: Paris, France, 2022. [Google Scholar]
- National Renewable Energy Lab (NREL). Flexibility in 21st Century Power Systems; National Renewable Energy Lab: Golden, CO, USA, 2014. [Google Scholar]
- Nazir, H.; Muthuswamy, N.; Louis, C.; Jose, S.; Prakash, J.; Buan, M.E.; Flox, C.; Chavan, S.; Shi, X.; Kauranen, P. Is the H2 economy realizable in the foreseeable future? Part II: H2 storage, transportation, and distribution. Int. J. Hydrog. Energy 2020, 45, 20693–20708. [Google Scholar] [CrossRef]
- Loschan, C.; Schwabeneder, D.; Maldet, M.; Lettner, G.; Auer, H. Hydrogen as Short-Term Flexibility and Seasonal Storage in a Sector-Coupled Electricity Market. Energies 2023, 16, 5333. [Google Scholar] [CrossRef]
- Moradi, R.; Groth, K.M. Hydrogen storage and delivery: Review of the state of the art technologies and risk and reliability analysis. Int. J. Hydrog. Energy 2019, 44, 12254–12269. [Google Scholar] [CrossRef]
- Blanco, E.C.; Sánchez, A.; Martín, M.; Vega, P. Methanol and ammonia as emerging green fuels: Evaluation of a new power generation paradigm. Renew. Sustain. Energy Rev. 2023, 175, 113195. [Google Scholar] [CrossRef]
- Valera-Medina, A.; Xiao, H.; Owen-Jones, M.; David, W.I.F.; Bowen, P.J. Ammonia for power. Prog. Energy Combust. Sci. 2018, 69, 63–102. [Google Scholar] [CrossRef]
- Luo, C.; Zhang, N.; Lior, N.; Lin, H. Proposal and analysis of a dual-purpose system integrating a chemically recuperated gas turbine cycle with thermal seawater desalination. Energy 2011, 36, 3791–3803. [Google Scholar] [CrossRef]
- Pashchenko, D.; Mustafin, R.; Karpilov, I. Efficiency of chemically recuperated gas turbine fired with methane: Effect of operating parameters. Appl. Therm. Eng. 2022, 212, 118578. [Google Scholar] [CrossRef]
- Sun, Z.; Sun, Z. Hydrogen generation from methanol reforming for fuel cell applications: A review. J. Cent. South Univ. 2020, 27, 1074–1103. [Google Scholar] [CrossRef]
- Araya, S.S.; Liso, V.; Cui, X.; Li, N.; Zhu, J.; Sahlin, S.L.; Jensen, S.H.; Nielsen, M.P.; Kær, S.K. A Review of The Methanol Economy: The Fuel Cell Route. Energies 2020, 13, 596. [Google Scholar]
- Jeerh, G.; Zhang, M.; Tao, S. Recent progress in ammonia fuel cells and their potential applications. J. Mater. Chem. A 2021, 9, 727–752. [Google Scholar] [CrossRef]
- Cesaro, Z.; Ives, M.; Nayak-Luke, R.; Mason, M.; Bañares-Alcántara, R. Ammonia to power: Forecasting the levelized cost of electricity from green ammonia in large-scale power plants. Appl. Energy 2021, 282, 116009. [Google Scholar] [CrossRef]
- Pashchenko, D.; Mustafin, R.; Karpilov, I. Ammonia-fired chemically recuperated gas turbine: Thermodynamic analysis of cycle and recuperation system. Energy 2022, 252, 124081. [Google Scholar] [CrossRef]
- Shen, Y.; Nazir, S.M.; Zhang, K.; Duwig, C. Waste heat recovery optimization in ammonia-based gas turbine applications. Energy 2023, 280, 128079. [Google Scholar] [CrossRef]
- Pashchenko, D. Low-grade heat utilization in the methanol-fired gas turbines through a thermochemical fuel transformation. Therm. Sci. Eng. Prog. 2022, 36, 101537. [Google Scholar] [CrossRef]
- Tola, V.; Lonis, F. Low CO2 emissions chemically recuperated gas turbines fed by renewable methanol. Appl. Energy 2021, 298, 117146. [Google Scholar] [CrossRef]
- Zhao, H.; Yue, P. Performance analysis of humid air turbine cycle with solar energy for methanol decomposition. Energy 2011, 36, 2372–2380. [Google Scholar] [CrossRef]
- Liu, T.; Liu, Q.; Lei, J.; Sui, J.; Jin, H. Solar-clean fuel distributed energy system with solar thermochemistry and chemical recuperation. Appl. Energy 2018, 225, 380–391. [Google Scholar] [CrossRef]
- Arnaiz del Pozo, C.; Cloete, S.; Jiménez Álvaro, Á. Techno-economic assessment of long-term methanol production from natural gas and renewables. Energy Convers. Manag. 2022, 266, 115785. [Google Scholar] [CrossRef]
- Arnaiz del Pozo, C.; Cloete, S. Techno-economic assessment of blue and green ammonia as energy carriers in a low-carbon future. Energy Convers. Manag. 2022, 255, 115312. [Google Scholar] [CrossRef]
- Cloete, S.; Arnaiz del Pozo, C.; Jiménez Álvaro, Á. System-friendly process design: Optimizing blue hydrogen production for future energy systems. Energy 2022, 259, 124954. [Google Scholar] [CrossRef]
- Anantharaman, R.; Bolland, O.; Booth, N.; Van Dorst, E.; Sanchez Fernandez, E.; Franco, F.; Macchi, E.; Manzolini, G.; Nikolic, D.; Pfeffer, A.; et al. Cesar Deliverable D2.4.3. European Best Practice Guidelines for Assessment of CO2 Capture Technologies. 2018. Available online: https://zenodo.org/record/1312801 (accessed on 5 October 2023).
- Khan, M.N.; Cloete, S.; Amini, S. Efficiency Improvement of Chemical Looping Combustion Combined Cycle Power Plants. Energy Technol. 2019, 7, 1900567. [Google Scholar] [CrossRef]
- Romano, M.C.; Chiesa, P.; Lozza, G. Pre-combustion CO2 capture from natural gas power plants, with ATR and MDEA processes. Int. J. Greenh. Gas Control. 2010, 4, 785–797. [Google Scholar] [CrossRef]
- Chiesa, P.; Macchi, E. A Thermodynamic Analysis of Different Options to Break 60% Electric Efficiency in Combined Cycle Power Plants. J. Eng. Gas Turbines Power (Trans. ASME) 2004, 126, 770–785. [Google Scholar] [CrossRef]
- Chiesa, P.; Lozza, G.; Mazzocchi, L. Using Hydrogen as Gas Turbine Fuel. J. Eng. Gas Turbines Power (Trans. ASME) 2005, 127, 73–80. [Google Scholar] [CrossRef]
- Arnaiz del Pozo, C.; Cloete, S.; Chiesa, P.; Jiménez Álvaro, Á.; Amini, S. Integration of gas switching combustion and membrane reactors for exceeding 50% efficiency in flexible IGCC plants with near-zero CO2 emissions. Energy Convers. Manag. X 2020, 7, 100050. [Google Scholar] [CrossRef]
- Jonsson, M.; Bolland, O.; Bücker, D.; Rost, M. Gas turbine cooling model for evaluation of novel cycles. In Proceedings of the ECOS 2005, Trondheim, Norway, 20–22 June 2005. [Google Scholar]
- Zhang, F.; Shi, Y.; Yang, L.; Du, X. Kinetics for hydrogen production by methanol steam reforming in fluidized bed reactor. Sci. Bull. 2016, 61, 401–405. [Google Scholar] [CrossRef]
- Kishimoto, M.; Furukawa, N.; Kume, T.; Iwai, H.; Yoshida, H. Formulation of ammonia decomposition rate in Ni-YSZ anode of solid oxide fuel cells. Int. J. Hydrog. Energy 2017, 42, 2370–2380. [Google Scholar] [CrossRef]
- Gazzani, M.; Chiesa, P.; Martelli, E.; Sigali, S.; Brunetti, I. Using Hydrogen as Gas Turbine Fuel: Premixed Versus Diffusive Flame Combustors. J. Eng. Gas Turbines Power Trans. ASME 2014, 136, 051504. [Google Scholar] [CrossRef]
- Cecere, D.; Giacomazzi, E.; Di Nardo, A.; Calchetti, G. Gas Turbine Combustion Technologies for Hydrogen Blends. Energies 2023, 16, 6829. [Google Scholar] [CrossRef]
- Arnaiz del Pozo, C.; Jiménez Álvaro, Á.; Rodríguez Martín, J.; López Paniagua, I.; Sánchez Orgaz, S.; González Fernández, C.; Nieto Carlier, R. Exergy Calculation Modelling Tool for Mixtures in Power Generation: Application to WGS and ASU units of an IGCC Power Plant with Pre-combustion CO2 Capture. In Proceedings of the XI Congreso Nacional y II Internacional de Ingeniería Termodinámica (11-CNIT), Albacete, Spain, 12–28 June 2019. [Google Scholar]
- DeSantis, D.; James, B.D.; Houchins, C.; Saur, G.; Lyubovsky, M. Cost of long-distance energy transmission by different carriers. iScience 2021, 24, 103495. [Google Scholar] [CrossRef]
- Walker, I.; Madden, B.; Tahir, F. Hydrogen Supply Chain Evidence Base; Elemental Energy: Cambridge, UK, 2018. [Google Scholar]
- Ahluwalia, R.K.; Hua, T.Q.; Peng, J.K.; Kumar, R. System level analysis of hydrogen storage options. In Proceedings of the 2019 Annual Merit Review and Peer Evaluation Meeting, Washington, DC, USA, 29 April–1 May 2019. [Google Scholar]
- Nayak-Luke, R.M.; Forbes, C.; Cesaro, Z.; Bañares-Alcántara, R.; Rouwenhorst, K.H.R. Techno-economic aspects of production, storage and distribution of ammonia. In Techno-Economic Challenges of Green Ammonia as Energy Vector; Bañares-Alcántara, R., Valera-Medina, A., Eds.; Academic Press: Cambridge, MA, USA, 2020; pp. 191–208. [Google Scholar]
- Arnaiz del Pozo, C.; Cloete, S.; Jiménez Álvaro, Á. Standard Economic Assessment (SEA) Tool. Available online: https://bit.ly/3hyF1TT (accessed on 5 October 2023).
- Arnaiz del Pozo, C.; Jiménez Álvaro, Á.; Cloete, S.; García del Pozo Martín de Hijas, J.A. Fuels to Power: ChRGT SEA Files. 2023. Available online: https://bit.ly/ChemRecPower (accessed on 5 October 2023).
- IEAGHG. The Costs of CO2 Transport: Post-Demonstration CCS in the EU; European Technology Platform for Zero Emission Fossil Fuel Power Plants: Brussels, Belgium, 2011. [Google Scholar]
- IEAGHG. The Costs of CO2 Storage: Post-Demonstration CCS in the EU; European Technology Platform for Zero Emission Fossil Fuel Power Plants: Brussels, Belgium, 2011. [Google Scholar]
- Cloete, S.; García del Pozo Martínez de Hijas, J.A.; Arnaiz del Pozo, C.; Jiménez Álvaro, A. Future Fuels for Gas-Fired Power Production. A Comparative Techno-Economic Assessment; Technical Report; Universidad Politécnica de Madrid: Madrid, Spain; SINTEF Industry: Trondheim, Norway, 2023. [Google Scholar] [CrossRef]


| Item | Value | Unit |
|---|---|---|
| Compressor polytropic efficiency | 92.86 | % |
| Compressor leakage | 0.4 | % |
| Turbine polytropic efficiency (1st stage, remaining) | 90.0/89.0 | % |
| Combustor outlet temperature | 1651 | °C |
| Combustor pressure drop | 3 | % |
| Combustor heat loss | 0.4 | %LHV |
| Mechanical efficiency | 99.86 | % |
| Generator efficiency | 98.7 | % |
| Blade temperature (1st stator, 1st rotor, remaining) | 900/875/850 | °C |
| Item | Value | Unit |
|---|---|---|
| HP/IP/LP evaporator temperature approach | -/9/9 | % |
| HP/IP/LP evaporator temperature pinch | 9/10/10 | % |
| HP/IP/LP evaporator pressure | 185/43/5 | % |
| Boiler feedwater temperature | 60 | °C |
| Maximum steam temperature | 600 | °C |
| Condenser pressure | 0.04 | bar |
| HP/IP/LP steam turbine adiabatic efficiency | 98.3/92.0/87.7 | % |
| Mechanical efficiency | 99.6 | % |
| Generator efficiency | 98.7 | % |
| Fuel | Tank Storage (USD/kWh) | Cavern Storage (USD/kWh) | Pipeline Scale (GW) | Pipeline Cost (MUSD/km) |
|---|---|---|---|---|
| H2 | 15.6 | 2.1 | 8.36 | 1.29 |
| NG | 5.2 | 0.7 | 17.39 | 1.57 |
| NH3 | 0.2 | 27.41 | 1.89 | |
| MeOH | 0.1 | 37.44 | 1.78 |
| Capital Estimation Methodology | ||
|---|---|---|
| Bare Erected Cost (BEC) | SEA Tool Estimate | |
| Engineering procurement and construction (EPC) | 10% BEC | |
| Process contingency (PC) | 0–10% BEC | |
| Project contingency (PT) | 20% (BEC + EPC + PC) | |
| Owner’s costs (OC) | 15% (BEC + EPC + PT + PC) | |
| Total overnight costs (TOC) | BEC + EPC + PC + PT + OC | |
| Transmission and storage assumptions | ||
| Sc1 pipeline length | 500 | km |
| Cavern/tank pipeline ratio | 2 | - |
| Storage volume | 7 | Days at full capacity |
| Operating and maintenance costs | ||
| Fixed | ||
| Maintenance | 2.5 | %TOC |
| Insurance | 1 | %TOC |
| Labor | 60,000 | EUR/y-p |
| Operators | 2 | persons |
| Variable | ||
| NG fuel | 6.5 | EUR/GJ |
| CO2 tax | 100 | EUR/ton |
| Process water | 6 | EUR/ton |
| Make-up water | 0.35 | EUR/ton |
| Cash flow analysis assumptions | ||
| 1st year CF | 31 | % |
| Remaining years | 40 | % |
| Discount rate | 8 | % |
| Construction period | 1/2 | years |
| Plant Lifetime | 25 | years |
| Fuel | NG | H2 | MeOH | NH3 | ||||
|---|---|---|---|---|---|---|---|---|
| Power Cycle | CC | PCC | CC | ChRecGT | ChSTIG | ChRecGT | ChSTIG | |
| Heat Input | MWth | 1196.5 | 1197.1 | 1184.6 | 995.6 | 966.7 | 1075.6 | 965.0 |
| Gross Power | MWth | 753.3 | 688.8 | 760.6 | 636.7 | 597.8 | 660.0 | 599.6 |
| Auxiliaries | MWEl | 9.9 | 41.1 | 10.3 | 2.5 | 3.1 | 2.6 | 3.0 |
| MWEl | 743.4 | 647.7 | 750.3 | 634.2 | 594.7 | 657.4 | 596.7 | |
| % | 62.1% | 54.1% | 63.3% | 63.7% | 61.5% | 61.1% | 61.8% | |
| kgCO2/MWh | 330.1 | 35.2 | 0.0 | 389.8 | 403.6 | 0.0 | 0.0 | |
Disclaimer/Publisher’s Note: The statements, opinions and data contained in all publications are solely those of the individual author(s) and contributor(s) and not of MDPI and/or the editor(s). MDPI and/or the editor(s) disclaim responsibility for any injury to people or property resulting from any ideas, methods, instructions or products referred to in the content. |
© 2023 by the authors. Licensee MDPI, Basel, Switzerland. This article is an open access article distributed under the terms and conditions of the Creative Commons Attribution (CC BY) license (https://creativecommons.org/licenses/by/4.0/).
Share and Cite
Arnaiz del Pozo, C.; Jiménez Álvaro, Á.; Cloete, S.; García del Pozo Martín de Hijas, J.A. The Potential of Chemically Recuperated Power Cycles in Markets with High Shares of Variable Renewables. Energies 2023, 16, 7046. https://doi.org/10.3390/en16207046
Arnaiz del Pozo C, Jiménez Álvaro Á, Cloete S, García del Pozo Martín de Hijas JA. The Potential of Chemically Recuperated Power Cycles in Markets with High Shares of Variable Renewables. Energies. 2023; 16(20):7046. https://doi.org/10.3390/en16207046
Chicago/Turabian StyleArnaiz del Pozo, Carlos, Ángel Jiménez Álvaro, Schalk Cloete, and Jose Antonio García del Pozo Martín de Hijas. 2023. "The Potential of Chemically Recuperated Power Cycles in Markets with High Shares of Variable Renewables" Energies 16, no. 20: 7046. https://doi.org/10.3390/en16207046
APA StyleArnaiz del Pozo, C., Jiménez Álvaro, Á., Cloete, S., & García del Pozo Martín de Hijas, J. A. (2023). The Potential of Chemically Recuperated Power Cycles in Markets with High Shares of Variable Renewables. Energies, 16(20), 7046. https://doi.org/10.3390/en16207046