A Fuzzy Logic Control for Maximum Power Point Tracking Algorithm Validated in a Commercial PV System
Abstract
1. Introduction
2. Materials and Methods
2.1. PV Model
2.2. Employed Hardware
2.3. Incremental Conductance
2.4. Fuzzy Logic Control
- If (ΔV is NS) and (ΔP is Z) then (ΔD is NS);
- If (ΔV is PB) and (ΔP is PS) then (ΔD is PM).
3. Experimental Results
4. Conclusions
Author Contributions
Funding
Institutional Review Board Statement
Informed Consent Statement
Data Availability Statement
Acknowledgments
Conflicts of Interest
Abbreviations
| PV | Photovoltaic |
| MPPT | Maximum power point tracking |
| IncCond | Incremental conductance |
| FLC | Fuzzy logic control |
| HCA | Hill-climbing algorithm |
| P&O | Perturb and observation |
| HIL | Hardware in the loop |
| PSO | Particle swarm optimisation |
| EOA | Earthquake optimisation algorithm |
| VSS | Variable step size |
| PWM | Pulse-width modulation |
| MOSFET | Metal–oxide–semiconductor field-effect transistor |
| RTI | Real-time interface |
| FPGA | Field-programmable gate array |
| Maximum power point | |
| PV current | |
| PV voltage | |
| PV power | |
| ΔV | The change in voltage between k and k−1 |
| ΔI | The change in current between k and k−1 |
| ΔP | The change in power between k and k−1 |
| ΔD | The change in duty cycle between k and k−1 |
| D | Duty cycle |
| Cell current | |
| Current generated by solar irradiation | |
| Diode’s current | |
| Current of the parallel resistance | |
| Reverse saturation current | |
| K | Boltzmann constant |
| q | Elementary charge |
| Cell junction temperature | |
| Series resistance | |
| Parallel resistance | |
| G | Global irradiation |
| Global irradiation at standard rating conditions | |
| Short-circuit current | |
| Cell reference temperature | |
| A term that comprises the thermal factor of the short-circuit current | |
| Number of parallel modules | |
| Number of series cells | |
| Short-circuit current |
References
- International Energy Agency. Coal-Fired Power; Technical Report; International Energy Agency: Paris, France, 2021. [Google Scholar]
- Zhang, W.; Meng, Z.; Yang, J.; Song, Y.; Zhou, Y.; Zhao, C.; Yuan, J. Managing the phaseout of coal power: A comparison of power decarbonization pathways in Jilin Province. Resour. Conserv. Recycl. 2022, 180, 106216. [Google Scholar] [CrossRef]
- Sarmiento, L.; Burandt, T.; Löffler, K.; Oei, P.Y. Analyzing Scenarios for the Integration of Renewable Energy Sources in the Mexican Energy System—An Application of the Global Energy System Model (GENeSYS-MOD). Energies 2019, 12, 3270. [Google Scholar] [CrossRef]
- International Energy Agency. Key World Energy Statistics; Technical Report; International Energy Agency: Paris, France, 2020. [Google Scholar]
- Goman, V.; Prakht, V.; Kazakbaev, V.; Dmitrievskii, V. Comparative Study of Energy Consumption and CO2 Emissions of Variable-Speed Electric Drives with Induction and Synchronous Reluctance Motors in Pump Units. Mathematics 2021, 9, 2679. [Google Scholar] [CrossRef]
- Brauers, H.; Oei, P.Y.; Walk, P. Comparing coal phase-out pathways: The United Kingdom’s and Germany’s diverging transitions. Environ. Innov. Soc. Transitions 2020, 37, 238–253. [Google Scholar] [CrossRef]
- Hrovatin, D.; Žemva, A. Exploiting Solar Energy during an Aerial Mapping Mission on a Lightweight UAV. Electronics 2021, 10, 2876. [Google Scholar] [CrossRef]
- Hamadi, S.A.; Chouder, A.; Rezaoui, M.M.; Motahhir, S.; Kaddouri, A.M. Improved Hybrid Parameters Extraction of a PV Module Using a Moth Flame Algorithm. Electronics 2021, 10, 2798. [Google Scholar] [CrossRef]
- Bernardes, S.; Lameirinhas, R.A.M.; Torres, J.P.N.; Fernandes, C.A.F. Characterization and Design of Photovoltaic Solar Cells That Absorb Ultraviolet, Visible and Infrared Light. Nanomaterials 2021, 11, 78. [Google Scholar] [CrossRef]
- Benbouhenni, H.; Bizon, N. Terminal Synergetic Control for Direct Active and Reactive Powers in Asynchronous Generator-Based Dual-Rotor Wind Power Systems. Electronics 2021, 10, 1880. [Google Scholar] [CrossRef]
- Nazligul, A.S.; Wang, M.; Choy, K.L. Recent Development in Earth-Abundant Kesterite Materials and Their Applications. Sustainability 2020, 12, 5138. [Google Scholar] [CrossRef]
- Alsadi, S.; Khatib, T. Photovoltaic Power Systems Optimization Research Status: A Review of Criteria, Constrains, Models, Techniques, and Software Tools. Appl. Sci. 2018, 8, 1761. [Google Scholar] [CrossRef]
- Yousaf, J.; Faisal, M.; Nah, W.; Ghazal, M.; Sarmad Mahmmod, R.; Rmili, H. Effects of Random Switching Schemes on the EMI Levels of Conventional and Interleaved Buck Converters for Mobile Devices. Electronics 2022, 11, 306. [Google Scholar] [CrossRef]
- Parada-Salado, J.G.; Rodríguez-Licea, M.A.; Soriano-Sanchez, A.G.; Ruíz-Martínez, O.F.; Espinosa-Calderon, A.; Pérez-Pinal, F.J. Study on Multiple Input Asymmetric Boost Converters with Simultaneous and Sequential Triggering. Electronics 2021, 10, 1421. [Google Scholar] [CrossRef]
- Kjaerr, M.; Wang, H.; Blaabjerg, F. Adequacy Evaluation of an Islanded Microgrid. Electronics 2021, 10, 2344. [Google Scholar] [CrossRef]
- Shen, C.L.; Chen, L.Z.; Chuang, T.Y.; Liang, Y.S. Cascaded-like High-Step-Down Converter with Single Switch and Leakage Energy Recycling in Single-Stage Structure. Electronics 2022, 11, 352. [Google Scholar] [CrossRef]
- Vankadara, S.K.; Chatterjee, S.; Balachandran, P.K.; Mihet-Popa, L. Marine predator algorithm (MPA)-based MPPT technique for solar PV systems under partial shading conditions. Energies 2022, 15, 6172. [Google Scholar] [CrossRef]
- Oliver, J.S.; David, P.W.; Balachandran, P.K.; Mihet-Popa, L. Analysis of Grid-Interactive PV-Fed BLDC Pump Using Optimized MPPT in DC–DC Converters. Sustainability 2022, 14, 7205. [Google Scholar] [CrossRef]
- Udayakumar, M.D.; Sabarish, P.; Indragandhi, V.; Rajkumar, A. An advanced control technique for a Grid-Tied Hybrid Renewable energy system with Reciprocated sinusoidal PWM methodology. IOP Conf. Ser. Mater. Sci. Eng. 2019, 623, 012018. [Google Scholar] [CrossRef]
- Liu, H.D.; Lu, S.D.; Lee, Y.L.; Lin, C.H. A Novel Photovoltaic Module Quick Regulate MPPT Algorithm for Uniform Irradiation and Partial Shading Conditions. Processes 2021, 9, 2213. [Google Scholar] [CrossRef]
- Mahmod Mohammad, A.N.; Mohd Radzi, M.A.; Azis, N.; Shafie, S.; Atiqi Mohd Zainuri, M.A. An Enhanced Adaptive Perturb and Observe Technique for Efficient Maximum Power Point Tracking Under Partial Shading Conditions. Appl. Sci. 2020, 10, 3912. [Google Scholar] [CrossRef]
- Yildirim, M.A.; Nowak-Ocłoń, M. Modified Maximum Power Point Tracking Algorithm under Time-Varying Solar Irradiation. Energies 2020, 13, 6722. [Google Scholar] [CrossRef]
- Zafar, M.H.; Al-shahrani, T.; Khan, N.M.; Feroz Mirza, A.; Mansoor, M.; Qadir, M.U.; Khan, M.I.; Naqvi, R.A. Group Teaching Optimization Algorithm Based MPPT Control of PV Systems under Partial Shading and Complex Partial Shading. Electronics 2020, 9, 1962. [Google Scholar] [CrossRef]
- Verma, D.; Nema, S.; Agrawal, R.; Sawle, Y.; Kumar, A. A Different Approach for Maximum Power Point Tracking (MPPT) Using Impedance Matching through Non-Isolated DC-DC Converters in Solar Photovoltaic Systems. Electronics 2022, 11, 1053. [Google Scholar] [CrossRef]
- Ko, J.S.; Huh, J.H.; Kim, J.C. Overview of Maximum Power Point Tracking Methods for PV System in Micro Grid. Electronics 2020, 9, 816. [Google Scholar] [CrossRef]
- Ahmed, J.; Salam, Z. An Enhanced Adaptive P & O MPPT for Fast and Efficient Tracking Under Varying Environmental Conditions. IEEE Trans. Sustain. Energy 2018, 9, 1487–1496. [Google Scholar] [CrossRef]
- Macaulay, J.; Zhou, Z. A Fuzzy Logical-Based Variable Step Size P & O MPPT Algorithm for Photovoltaic System. Energies 2018, 11, 1340. [Google Scholar] [CrossRef]
- Farhat, M.; Barambones, O.; Sbita, L. A Real-Time Implementation of Novel and Stable Variable Step Size MPPT. Energies 2020, 13, 4668. [Google Scholar] [CrossRef]
- Alagammal, S.; Prabha, N.R. Combination of Modified P&O with Power Management Circuit to Exploit Reliable Power from Autonomous PV-Battery Systems. Iran. J. Sci. Technol. Trans. Electr. Eng. 2020, 45, 97–114. [Google Scholar] [CrossRef]
- Bouarroudj, N.; Benlahbib, B.; Houam, Y.; Sedraoui, M.; Batlle, V.F.; Abdelkrim, T.; Boukhetala, D.; Boudjema, F. Fuzzy based incremental conductance algorithm stabilized by an optimal integrator for a photovoltaic system under varying operating conditions. Energy Sources Part A Recover. Util. Environ. Eff. 2021, 1–26. [Google Scholar] [CrossRef]
- Mendez, E.; Ortiz, A.; Ponce, P.; Macias, I.; Balderas, D.; Molina, A. Improved MPPT Algorithm for Photovoltaic Systems Based on the Earthquake Optimization Algorithm. Energies 2020, 13, 3047. [Google Scholar] [CrossRef]
- Ajani, T.S.; Imoize, A.L.; Atayero, A.A. An Overview of Machine Learning within Embedded and Mobile Devices–Optimizations and Applications. Sensors 2021, 21, 4412. [Google Scholar] [CrossRef]
- Ye, S.P.; Liu, Y.H.; Liu, C.Y.; Ho, K.C.; Luo, Y.F. Artificial Neural Network Assisted Variable Step Size Incremental Conductance MPPT Method with Adaptive Scaling Factor. Electronics 2022, 11, 43. [Google Scholar] [CrossRef]
- Giurgi, G.I.; Szolga, L.A.; Giurgi, D.V. Benefits of Fuzzy Logic on MPPT and PI Controllers in the Chain of Photovoltaic Control Systems. Appl. Sci. 2022, 12, 2318. [Google Scholar] [CrossRef]
- Chuang, M.T.; Liu, Y.H.; Ye, S.P. A Novel Variable Step Size Incremental Conductance Method with an Adaptive Scaling Factor. Appl. Sci. 2020, 10, 5214. [Google Scholar] [CrossRef]
- Owusu-Nyarko, I.; Elgenedy, M.A.; Abdelsalam, I.; Ahmed, K.H. Modified variable step-size incremental conductance MPPT technique for photovoltaic systems. Electronics 2021, 10, 2331. [Google Scholar] [CrossRef]
- Pradhan, C.; Senapati, M.K.; Ntiakoh, N.K.; Calay, R.K. Roach Infestation Optimization MPPT Algorithm for Solar Photovoltaic System. Electronics 2022, 11, 927. [Google Scholar] [CrossRef]
- Mustafić, D.; Jokić, D.; Lale, S.; Lubura, S. Implementation of Incremental Conductance MPPT Algorithm in Real Time in Matlab/Simulink Environment with Humusoft MF634 Board. In Proceedings of the 2020 9th Mediterranean Conference on Embedded Computing (MECO), Budva, Montenegro, 8–11 June 2020; pp. 1–5. [Google Scholar]
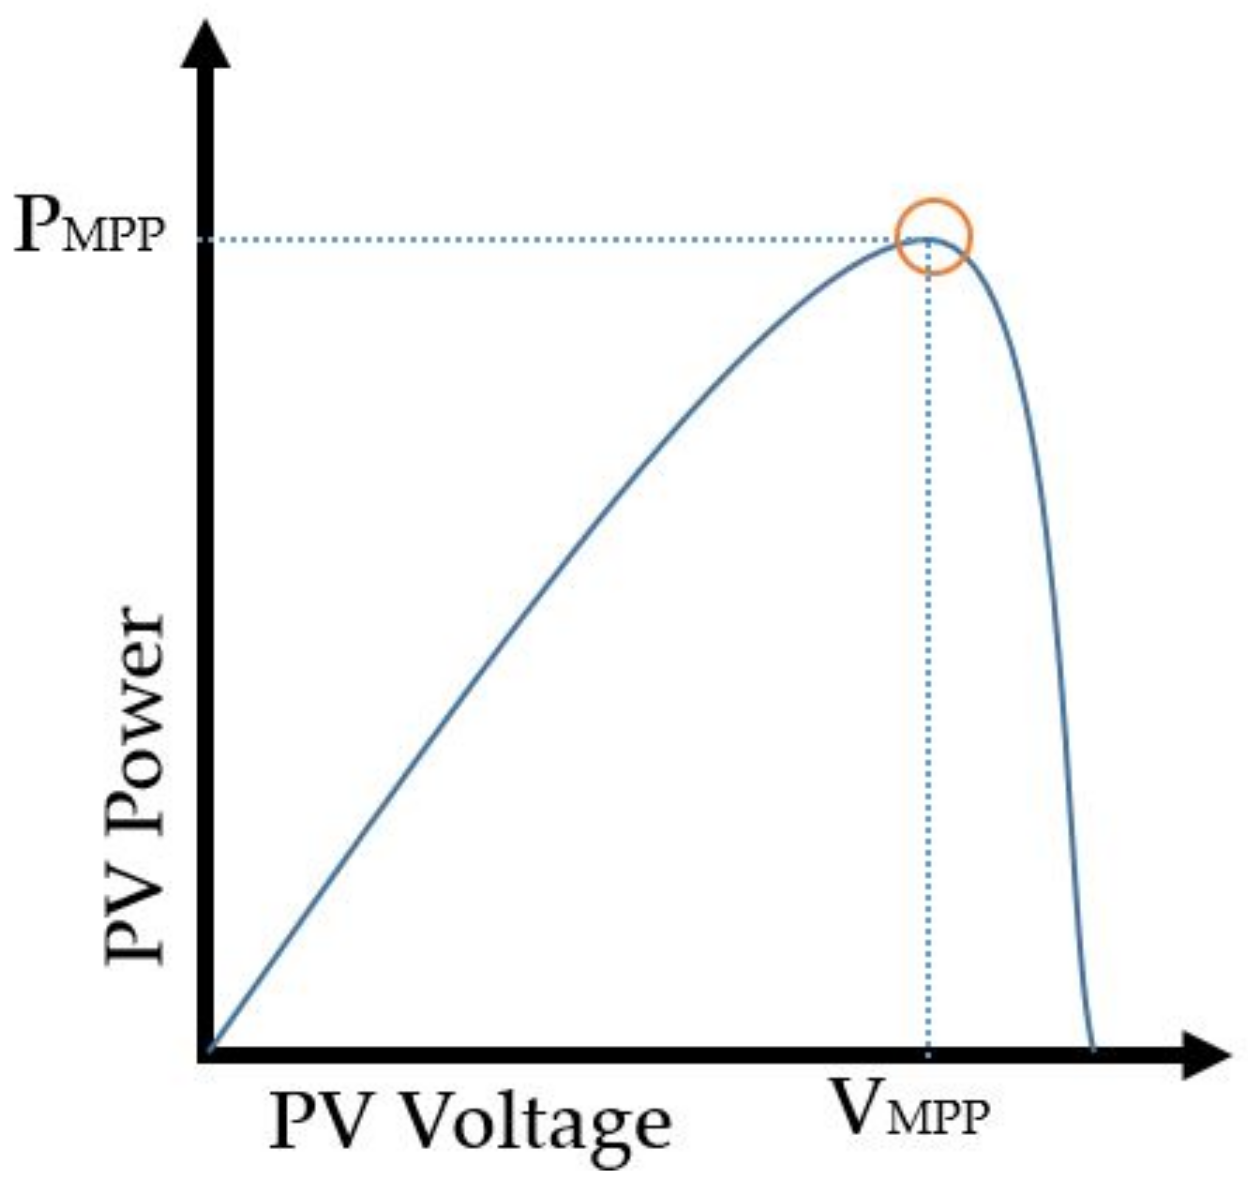

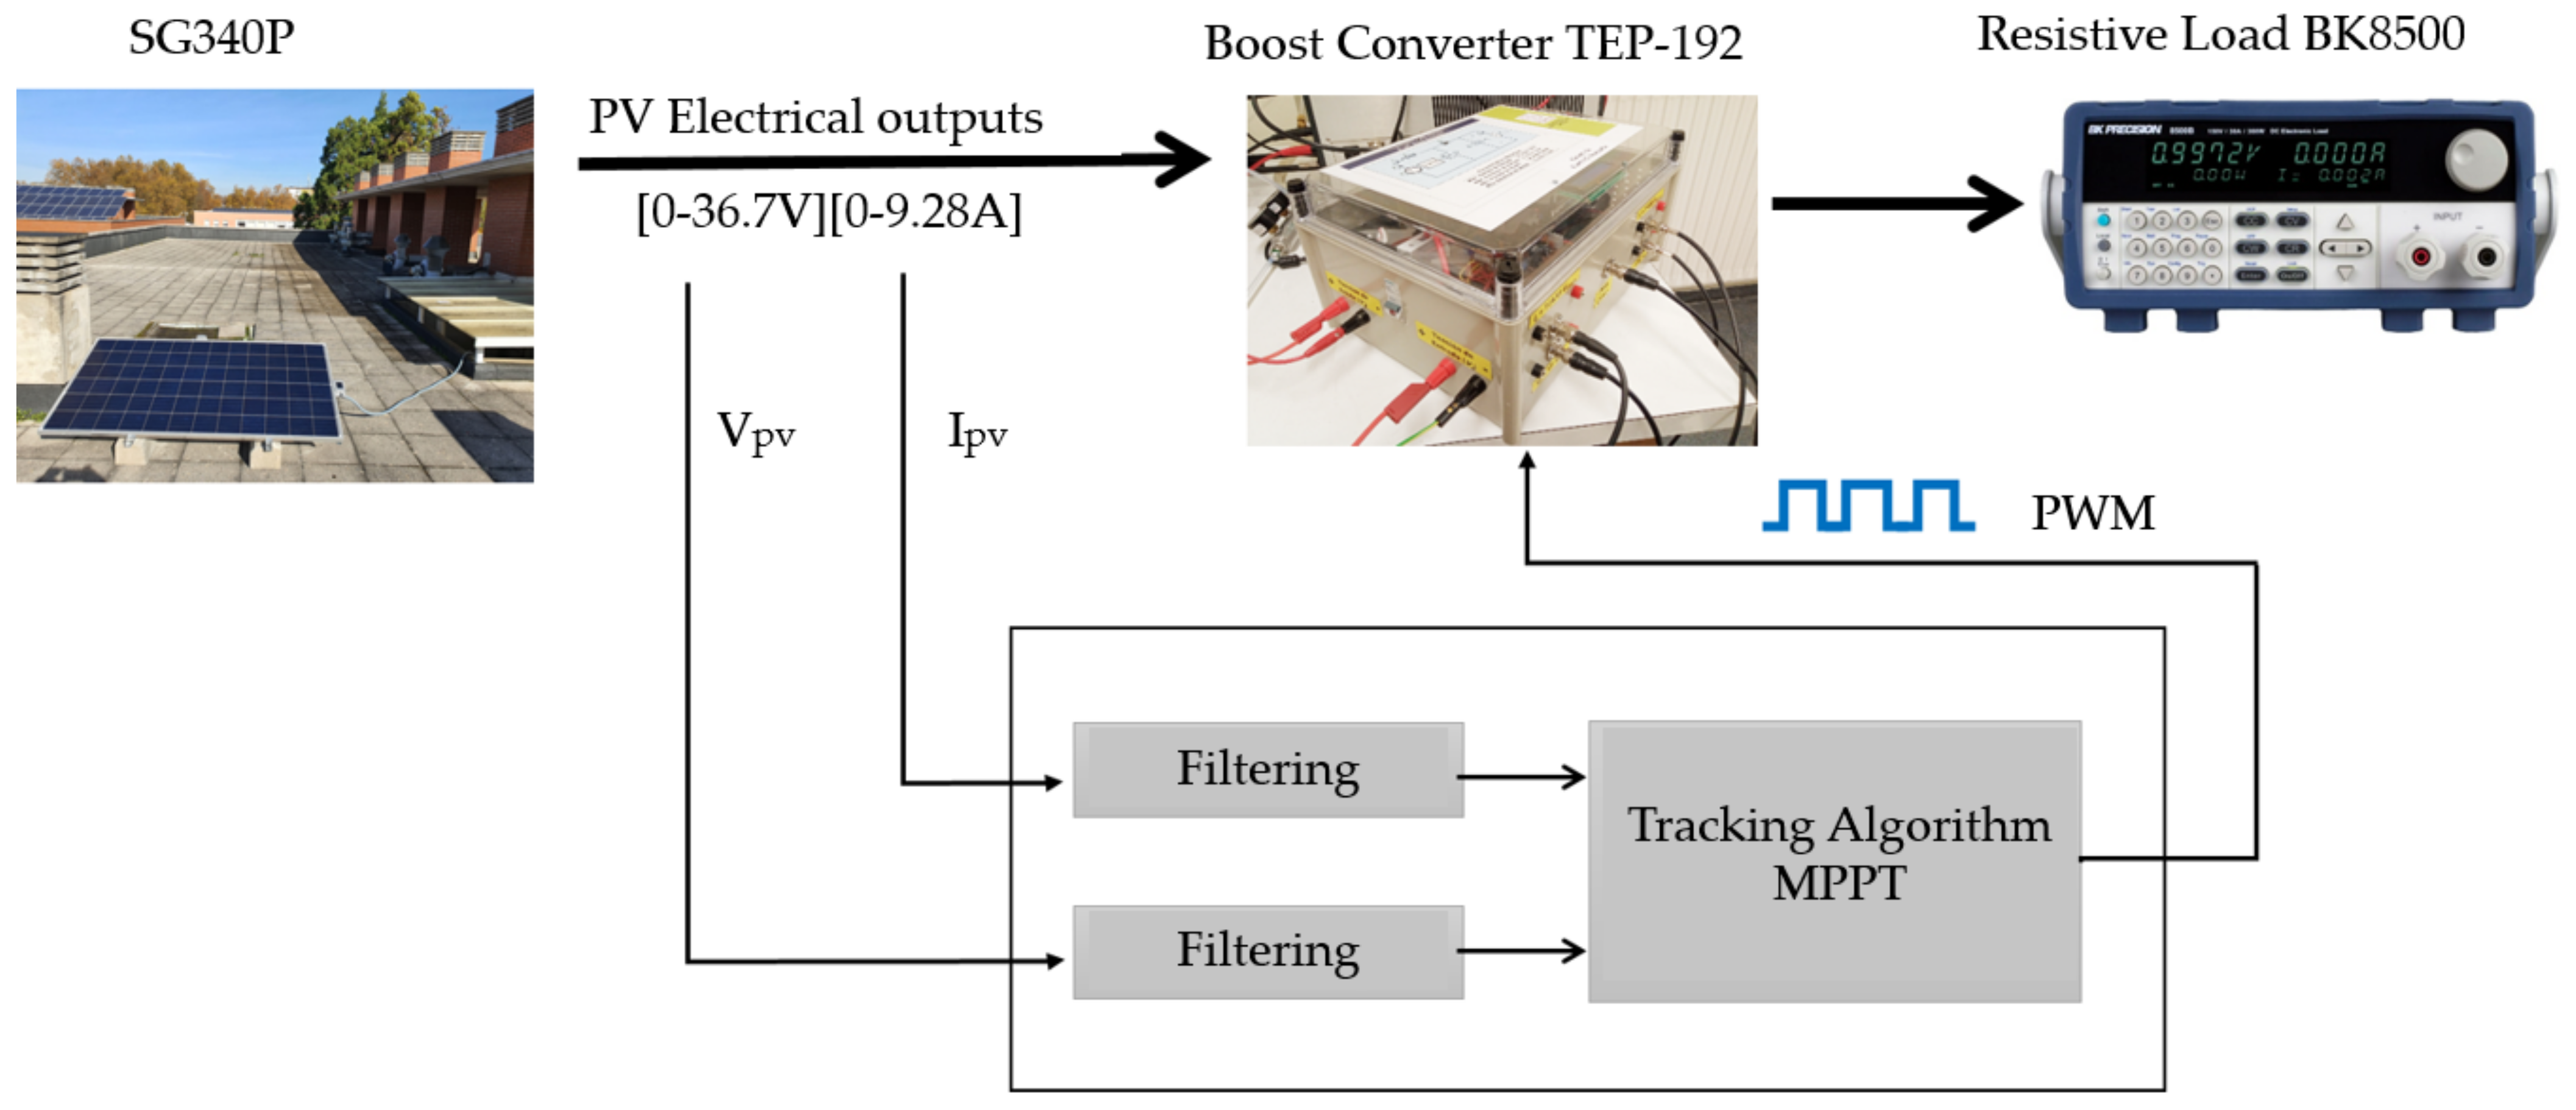


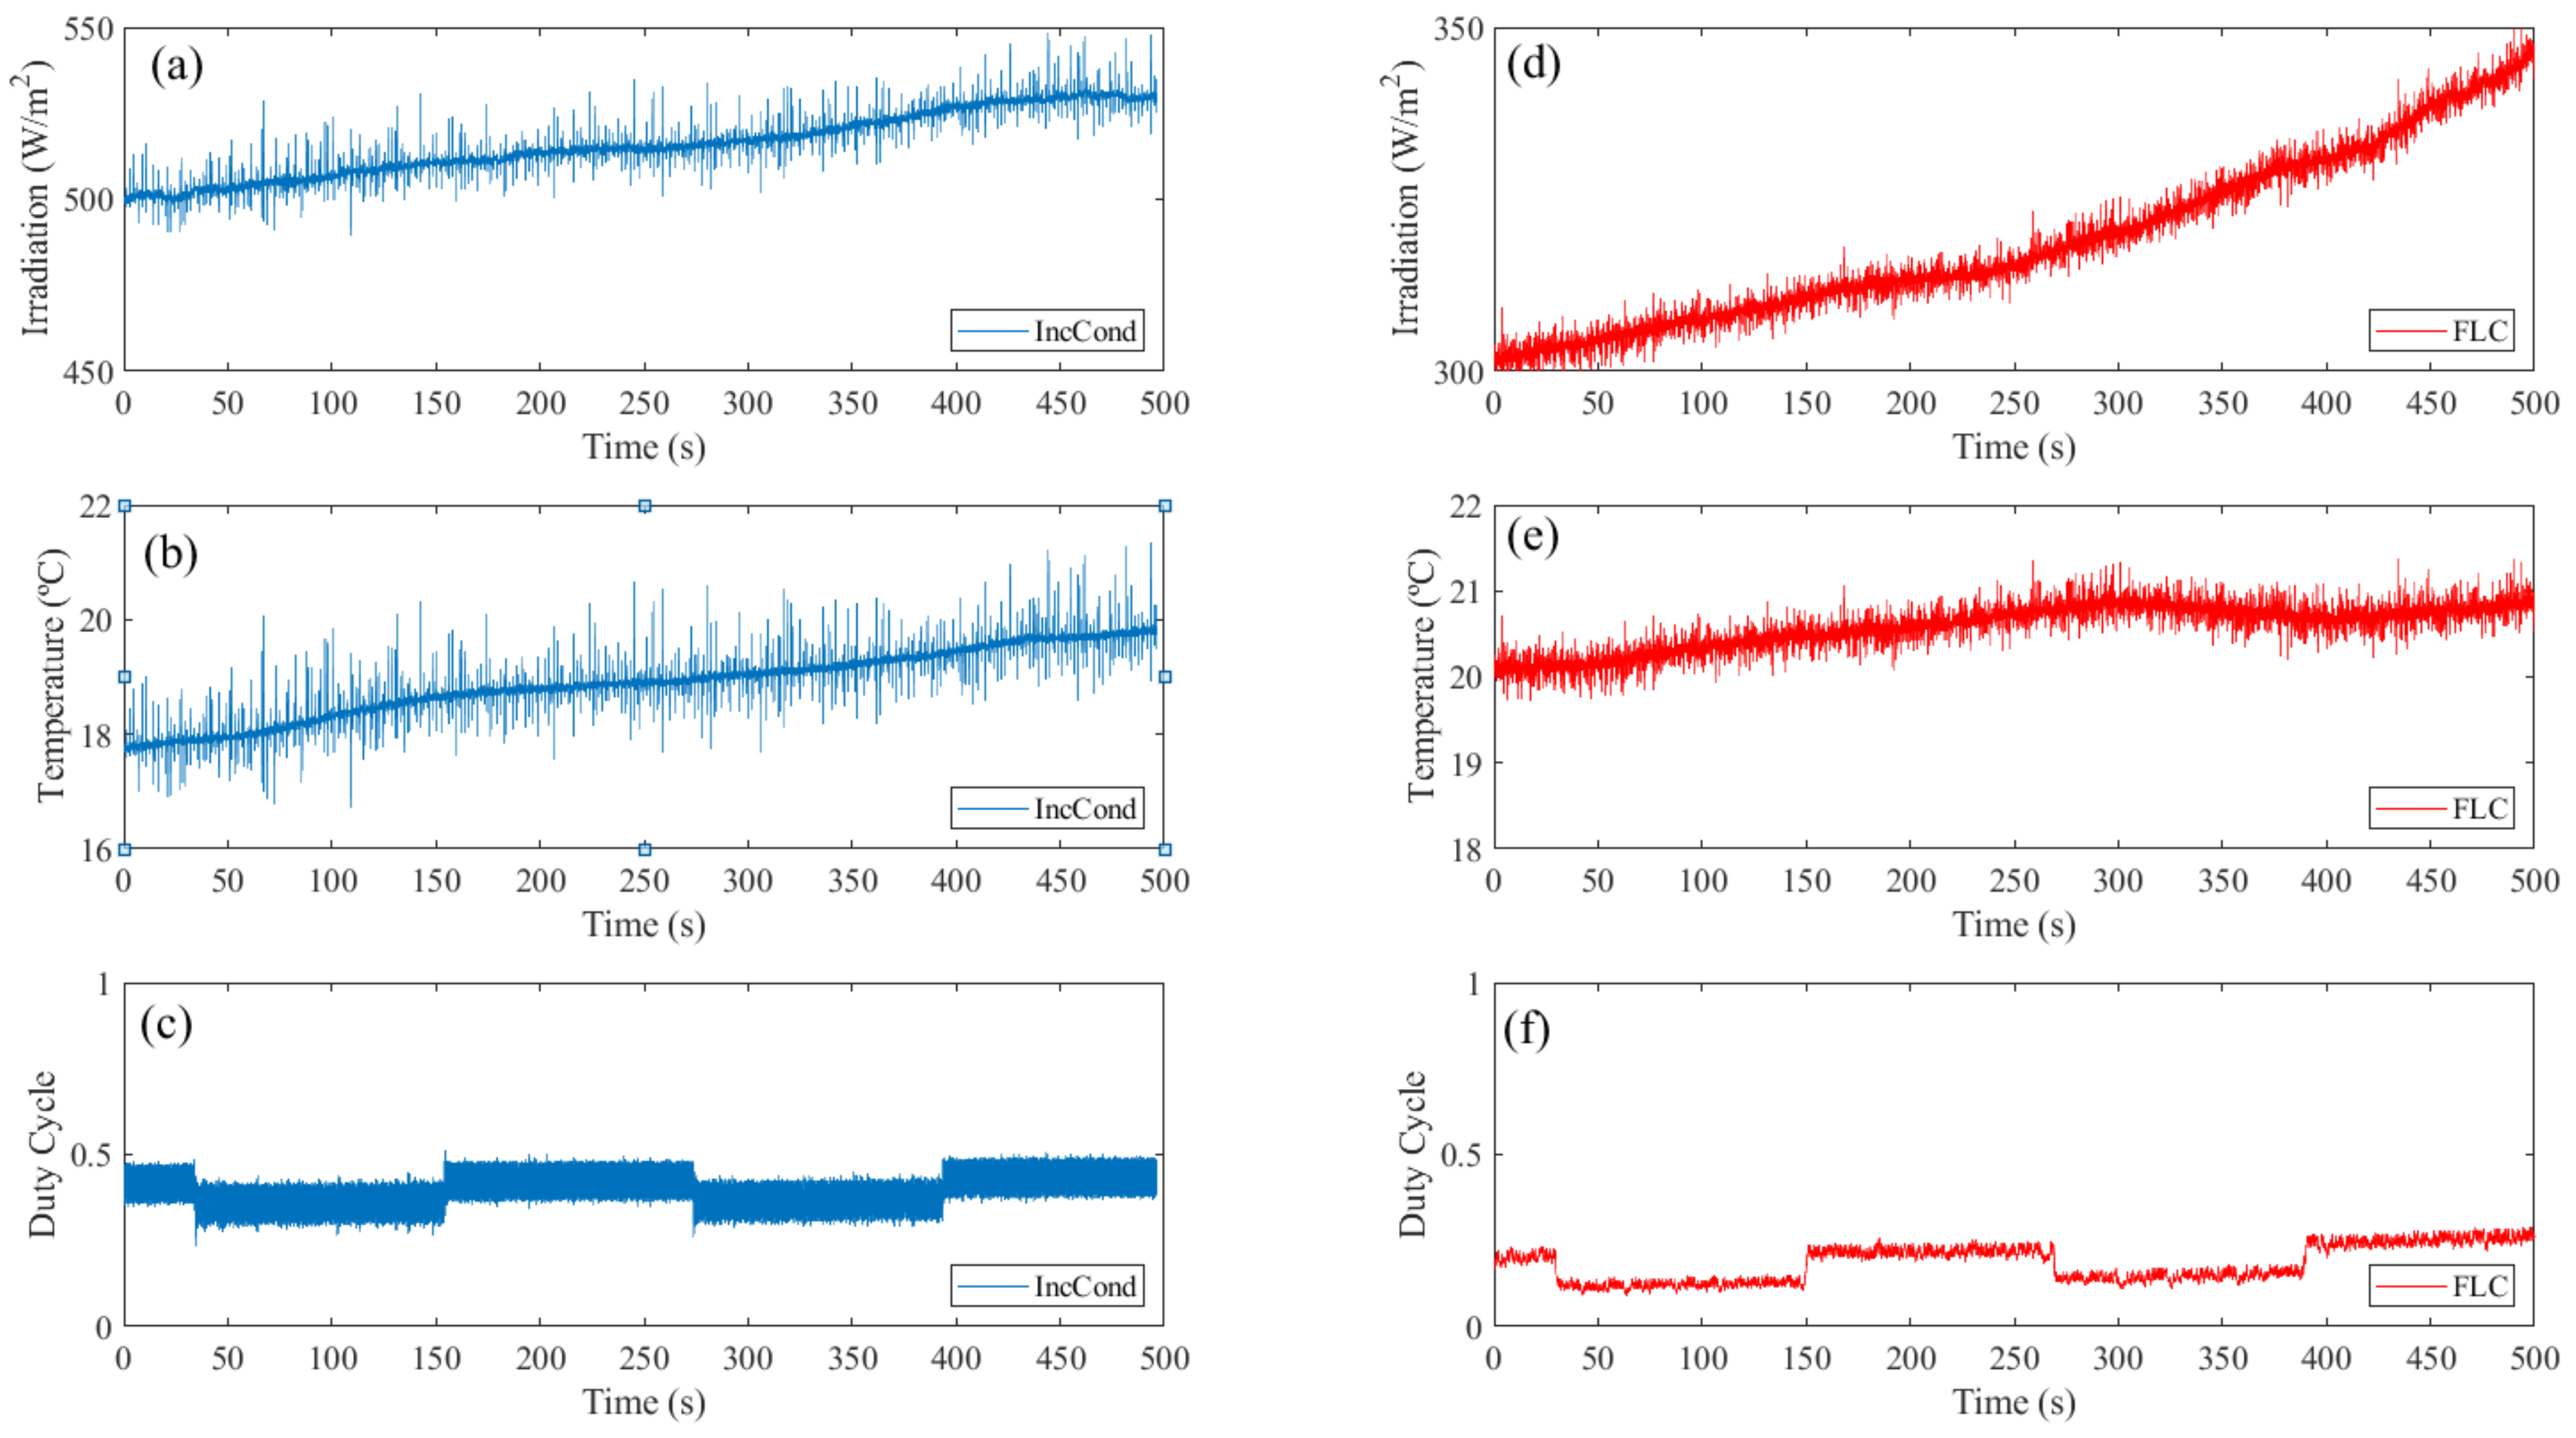

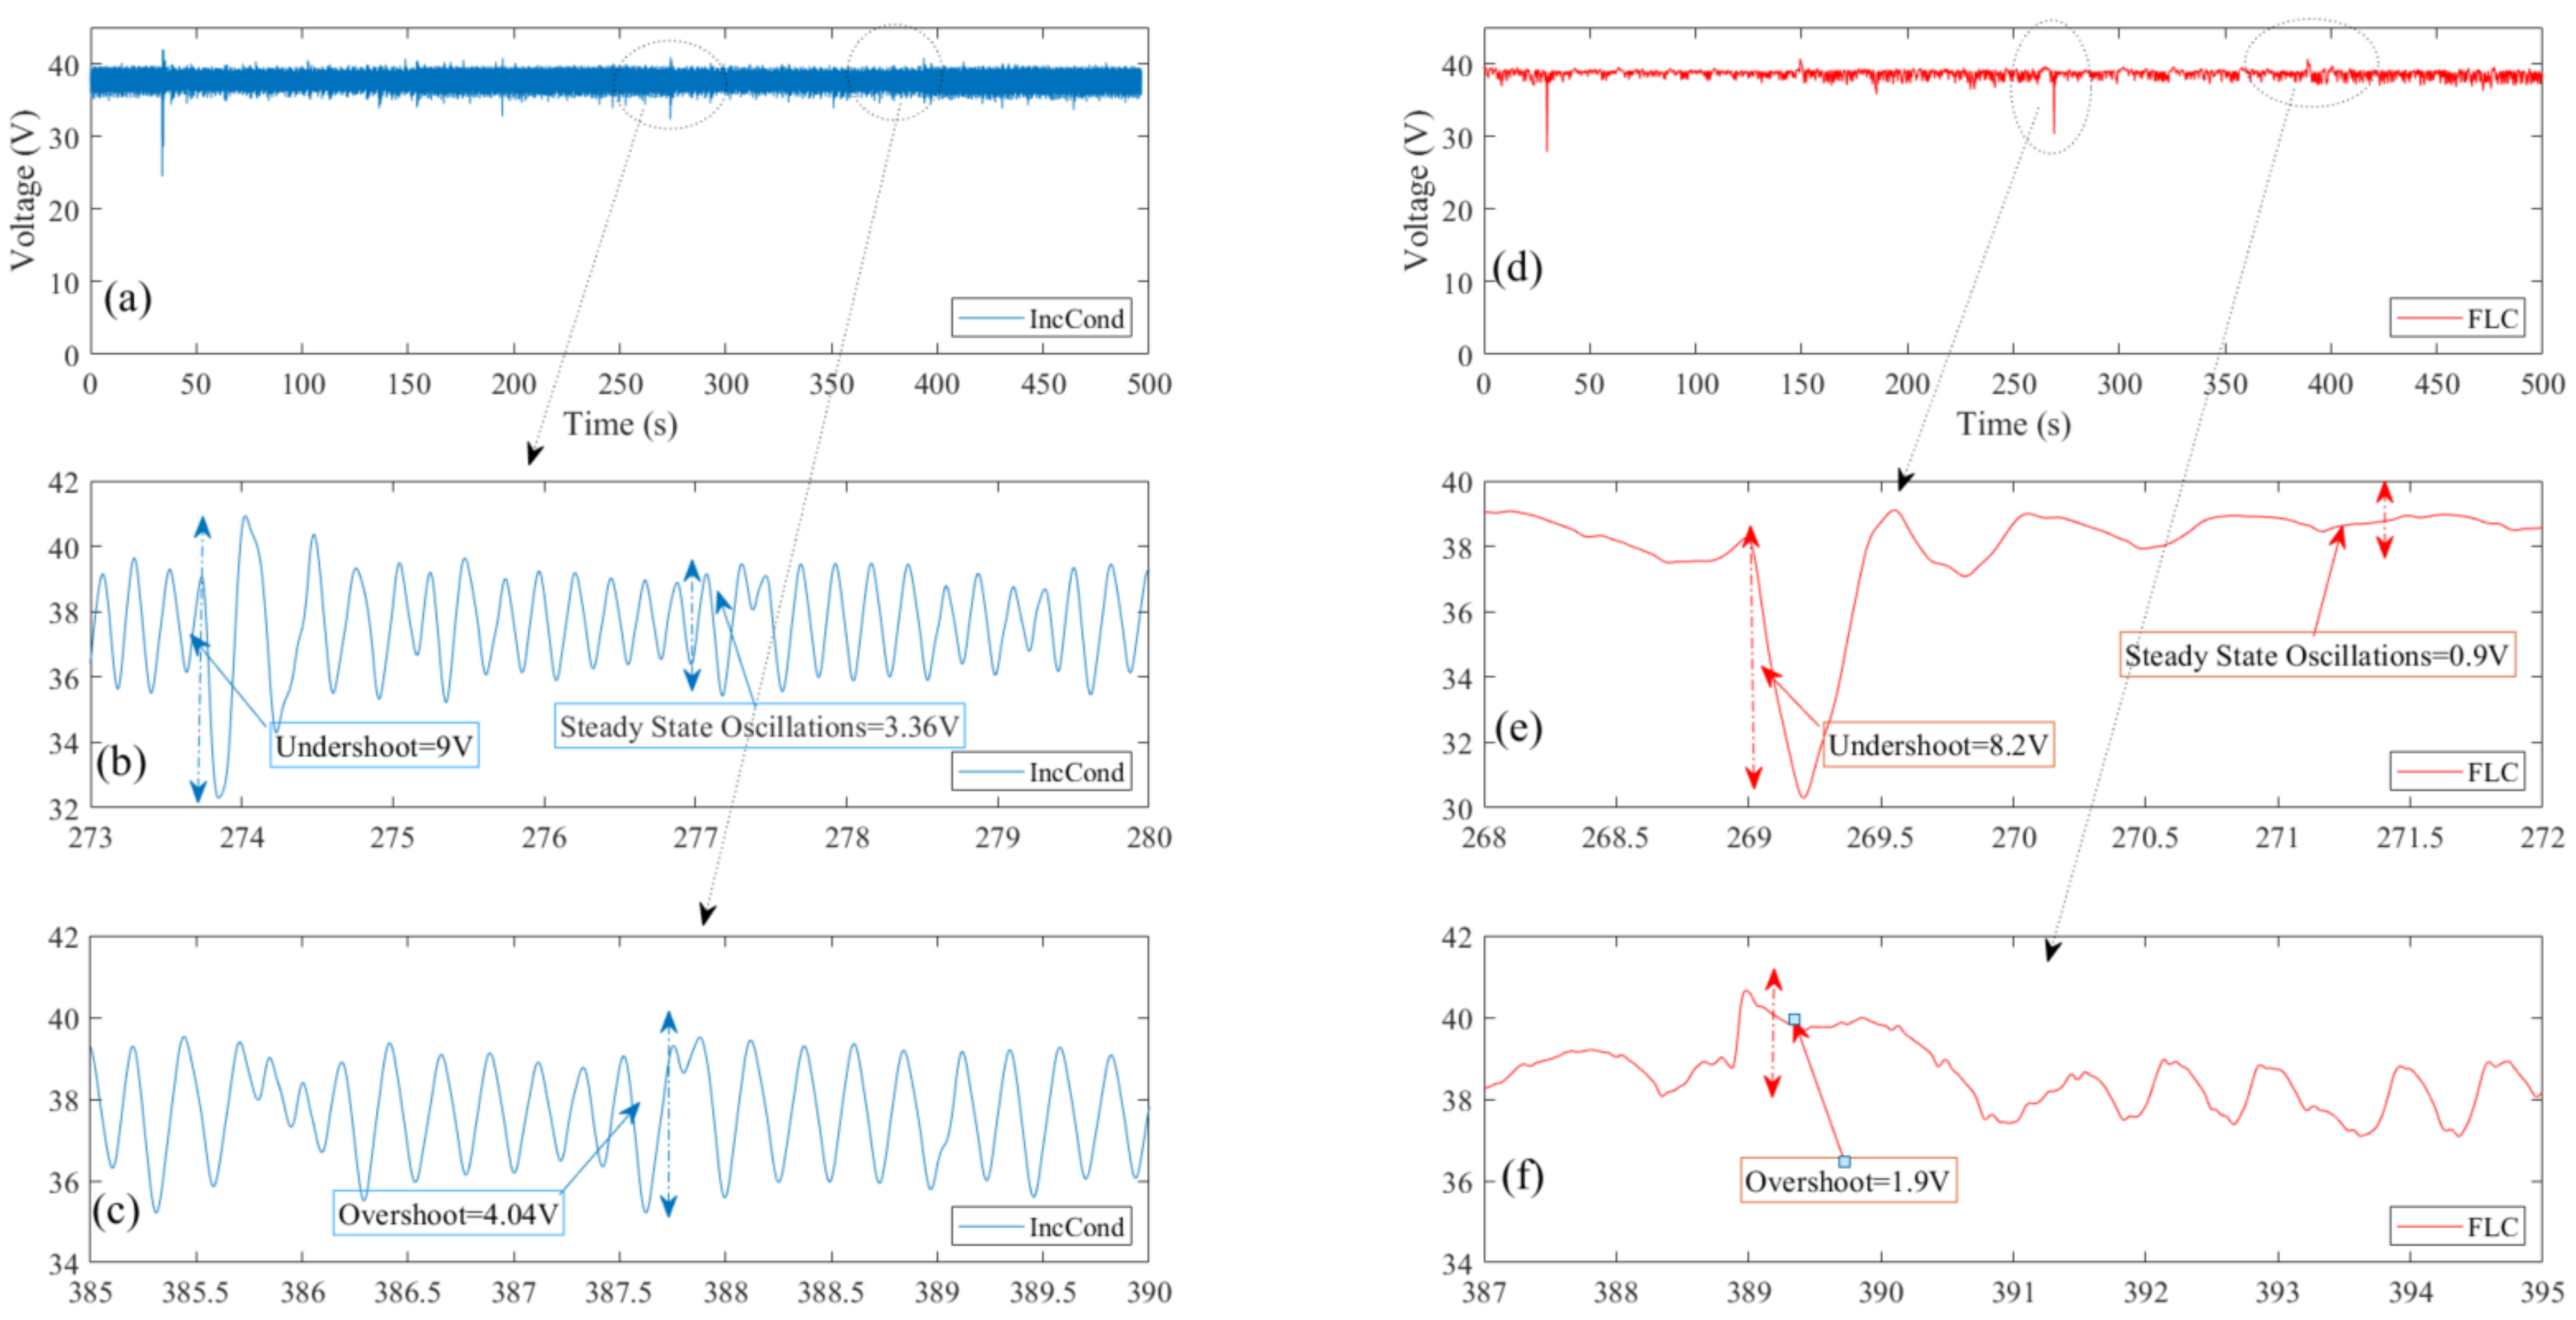
| Properties | Values | Units |
|---|---|---|
| Dimensions | 156 × 156 | mm |
| Open-circuit voltage | 45 | V |
| Max power voltage | 37 | V |
| Max power current | 9 | A |
| Maximum power | 340 | W |
| Number of parallel cells | 12 | units |
| Number of series cells | 6 | unit |
| 9.9 | A |
| Properties | Value | Unit |
|---|---|---|
| Switching frequency | 20 | kHz |
| Max input voltage | 60 | V |
| Max output voltage | 250 | V |
| Max input current | 30 | A |
| Max output current | 30 | A |
| Properties | Value | Unit |
|---|---|---|
| Power | 300 | W |
| Input Voltage | 0–150 | V |
| Input Current | 0–15 A | A |
| Resistance range | 0.05–10 | Ω |
| Rated Voltage | 500 | V |
| Rated Current | 15 | A |
| Case | ΔP | ΔV | Research Direction | Duty Ratio |
|---|---|---|---|---|
| 1 | + | + | Right direction | D(k) = D(k − 1) − ΔD |
| 2 | + | - | Right direction | D(k) = D(k − 1) + ΔD |
| 3 | - | - | Wrong direction | D(k) = D(k − 1) − ΔD |
| 4 | - | + | Wrong direction | D(k) = D(k − 1) + ΔD |
| ΔV∖ΔP | NB | NS | Z | PS | PB |
|---|---|---|---|---|---|
| NB | NB | NM | NM | NS | Z |
| NS | NM | NM | NS | Z | Z |
| Z | NM | NS | Z | PS | PM |
| PS | Z | Z | PS | PM | PM |
| PB | Z | PS | PM | PM | PB |
Disclaimer/Publisher’s Note: The statements, opinions and data contained in all publications are solely those of the individual author(s) and contributor(s) and not of MDPI and/or the editor(s). MDPI and/or the editor(s) disclaim responsibility for any injury to people or property resulting from any ideas, methods, instructions or products referred to in the content. |
© 2023 by the authors. Licensee MDPI, Basel, Switzerland. This article is an open access article distributed under the terms and conditions of the Creative Commons Attribution (CC BY) license (https://creativecommons.org/licenses/by/4.0/).
Share and Cite
Derbeli, M.; Napole, C.; Barambones, O. A Fuzzy Logic Control for Maximum Power Point Tracking Algorithm Validated in a Commercial PV System. Energies 2023, 16, 748. https://doi.org/10.3390/en16020748
Derbeli M, Napole C, Barambones O. A Fuzzy Logic Control for Maximum Power Point Tracking Algorithm Validated in a Commercial PV System. Energies. 2023; 16(2):748. https://doi.org/10.3390/en16020748
Chicago/Turabian StyleDerbeli, Mohamed, Cristian Napole, and Oscar Barambones. 2023. "A Fuzzy Logic Control for Maximum Power Point Tracking Algorithm Validated in a Commercial PV System" Energies 16, no. 2: 748. https://doi.org/10.3390/en16020748
APA StyleDerbeli, M., Napole, C., & Barambones, O. (2023). A Fuzzy Logic Control for Maximum Power Point Tracking Algorithm Validated in a Commercial PV System. Energies, 16(2), 748. https://doi.org/10.3390/en16020748


