Abstract
Photovoltaic (PV) panels are devices capable of transforming solar energy into electricity without emissions. They are still a trending technology in the market not only because of the renewable features but also due to the avoidance of movable parts, which makes them an option with low maintenance. If the output voltage is insufficient or needs to be regulated, a boost converter is commonly connected to a PV panel. In this article, a commercial PV with a boost converter is controlled through a dSPACE platform for a maximum power point tracking (MPPT) task. Due to previous related experience, a fuzzy logic technique is designed and tested in real-time. The results are compared with an incremental conductance (IncCond) algorithm because it is a feasible and reliable tool for MPPT purposes. The outcomes show enhancement (in comparison with IncCond) in the steady-state oscillation, response time and overshoot values, which are 73.2%, 81.5% and 52.9%, respectively.
1. Introduction
According to the International Energy Agency [1], unabated coal consumption for power generation has made a slight reduction since 2015, but still, in 2020, it was 35.2%. A phase-out by 2040 is estimated, provided that the decline has an average of 11% each year from now onwards [2]. On the other hand, in the United States only, the natural gas consumption for electricity generation was 53% in 2015 [3]. The latter is a critical point since it was observed that, during the last years, the consumption tendency had increased [4]. These facts are important to take into account, as these sources are major producers of CO2—one of the main greenhouse gases that generate climate change [5]. These are also predictions that are important for the Paris Agreement, which states a global temperature limit of up to 2 ºC in order to restrict global warming [6].
Renewable energies are part of the alternatives that could replace the above-mentioned sources of energy. In this sense, solar energy can be used for electricity generation by means of a photovoltaic (PV) panel [7]. This device is an arrangement of solar cells, which produce electric energy when they are exposed to solar light [8]. Applications are not only limited to renewable energies on Earth, but these are also well used in space applications, which induces a high interest in improving efficiency [9,10]. This is an important task, as the established record is 26.7% for crystalline silicon solar cells (ci-S) [11]. Nevertheless, in comparison to other alternatives with higher efficiencies (such as wind generators or hydropower), the main PV asset is the avoidance of moving parts, which allows low maintenance, silent energy production and a long life span of the components [12].
The output voltage of a PV may need to be regulated not only according to end-user values but also to seek the maximum power point (MPP) at which the system can work appropriately at its best efficiency (this can be seen in Figure 1). This role can be performed by using a power converter, the topology of which depends on if the user requires a higher or lower voltage from the PV panel. When a low voltage is necessary, a buck converter is an option, and in the case of a high value, a boost converter is another alternative [13,14,15]; additionally, if both options are required, a buck–boost converter is available as well [16]. Hence, these devices can be configured for maximum power point tracking (MPPT) of a PV system to achieve the best overall efficiency. The main tools for this task are the designed algorithms that can help the system to work at MPP [17,18].
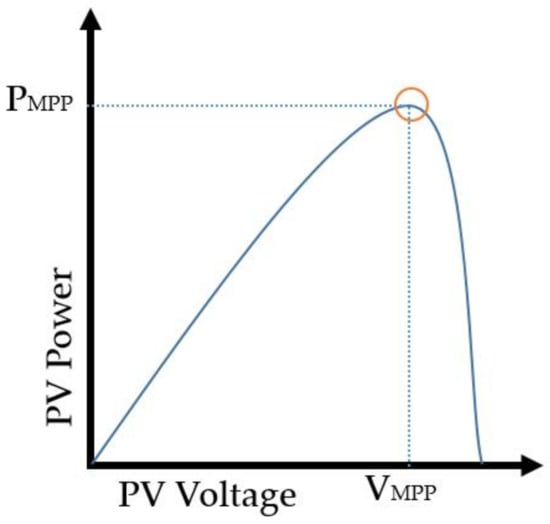
Figure 1.
Maximum power point description.
A typical PV curve of power versus voltage is schematised in Figure 1, where the MPP is located as a maximum of a parabolic curve [19]. Hence, hill-climbing algorithms (HCAs) are MPPT tools, and their main role is to know if an ongoing position is on the right- or left-hand side of the MPP based on the relation between voltage and power [20]. Perturb and observation (P&O), which belongs to HCA group, is a low-cost and reliable algorithm and one of the most used for the mentioned tasks [21]. P&O reads first the PV current and voltage to calculate the PV power; hence, it is possible to evaluate the slope sign in order to find out if the ongoing position is on the right- or left-hand side of the MPP [22]. On the basis of the previous observation, the boost converter control signal is regulated with a small change to perturb the system, and the power of the following time step is read again [23]. An example of implementation in PV systems was produced by Verma et al. [24], where they employed P&O for hardware in the loop (HIL), with suitable results for MPPT. Despite the fact that the computational requirement of P&O is low, there are two main disadvantages: (1) environmental shadow over the PV, which can induce a local MPP, and the algorithm may fall at this point and (2) the oscillation around the MPP when it is reached [25].
Despite the fact that the oscillation of P&O is a natural characteristic of the algorithm, issues such as energy loss and system divergence reduce its performance [26]. The aforementioned problems can be reduced provided that a low-value step size is chosen, but this implies reducing the algorithm speed [27]. Hence, improved versions of P&O have been developed in recent years to enhance the above-mentioned phenomena. The authors of [28] proposed an analytical solution with a variable step size, which was generated through incremental calculations as an extra step. They also contributed experimental results and a demonstration of stability of the proposal. A similar approach was designed by Alagammal and Prabha [29], where they used a scaling factor dependent on the power change to make a variable step size. The outcomes showed improvements in terms of MPPT when it was contrasted with P&O. However, the previously mentioned techniques required a gain finding task, which can be complex to find [30]. Optimisation algorithms have also been a matter of discussion to find an appropriate step size; in this sense, Mendez et al. [31] studied P&O that was optimised through particle swarm optimisation (PSO) and the earthquake optimisation algorithm (EOA). The simulated results showed significant energy improvements in which EOA produced the best performance. Nevertheless, it is important to take into account that many optimisation algorithms are highly computational demanding and, for these reasons, undertake complex calculations [32].
In the same group of HCA, another technique is IncCond, which is more accurate than P&O because it evaluates the change increment in voltage and current; thus, the sign of the slope is more precise [33]. The control signal generation is evaluated under the same mechanism as P&O. Even though the computational demand of IncCond is greater than P&O, it is faster and more precise [34]. Nevertheless, IncCond still requires a step size to be found, and several alternatives have been developed to achieve better controllers with a variable step-size (VSS) method. The authors of [35] studied an IncCond with a variable step size, whose strategy involved the inclusion of a scaling factor, but its mechanism depended on the estimation of irradiance levels. Despite its advantages, which take into account the shadowing phenomenon, the irradiation approximation was through a Jacobian matrix, which implies a complex calculation and, thus, a high computational demand. Another VSS strategy was developed by Owusu-Nyarko et al. [36] in which they proposed a variable scaling factor in terms of open-circuit voltage through an analytical expression. The results of the implementation unveiled fast tracking with low oscillations near the MPP in comparison to the conventional VSS methods of IncCond. However, the parameters of the open-circuit voltage estimator were dependent on standard conditions, which can change in real-time experiments.
In the reviewed background, it was found that IncCond works much better than P&O for MPPT, although it carries the problem of finding the step size. Hence, VSS had appeared to solve this issue, but still with certain complications, because the solutions are dependent on analytical variables that are in terms of other parameters. Hence, in this article, a fuzzy logic method based on the described tools is designed with the authors’ knowledge about MPPT techniques. Further details about the proposal are explained in the following sections. The structure is compared to an IncCond because it was found to have better accuracy than the alternatives. All contrasts are developed for a commercial PV system linked to a boost converter.
The structure of this article is arranged as follows. Section 2 provides an explanation of the employed commercial hardware and the design of the test rig. Furthermore, it includes an explanation of the IncCond algorithm and the proposed fuzzy logic strategy. The outcomes of the implementation for the commercial PV are shown in Section 3 where the main features are highlighted. Finally, a summary of the research generated is provided in Section 4.
2. Materials and Methods
2.1. PV Model
A single-diode model was used for the study because it is simple and accurate. This theory implies treating the PV as a DC source from an electric circuit, as shown in Figure 2. The PV produces a current generated by solar irradiation. In addition, two resistances are modelled, where is related to the diode’s current leakage at the p-n interface; represents the resistance athwart the PV. The latter causes a detrimental phenomenon on the maximum power of the system.
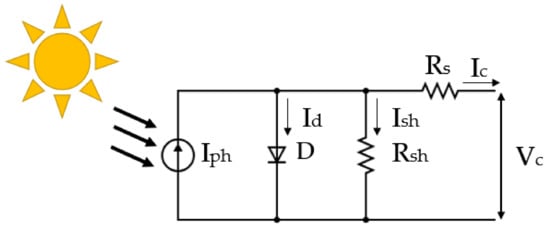
Figure 2.
PV Model.
Using Kirchhoff’s current law, Equation (1) is provided, where and are defined according to the following expressions:
where , K, q and are the reverse saturation current, Boltzmann constant, elementary charge and the operating temperature, respectively. The current that the PV generates is also expressed in Equation (3), where is the relation between the solar radiance measured and the radiance at standard rating conditions (SRCs). is the short-circuit current of the PV, and is the PV temperature, both at SRC. The term comprises a thermal factor of the short-circuit current.
A PV panel is built with several modules in parallel () and in series (), which leads to an output current () and voltage () of the whole module based on Equation (4). Therefore, with the previous equations, the output current of the PVG can be expressed as the following.
2.2. Employed Hardware
The implementation of the proposed control structures was performed in commercial hardware. A polycrystalline solar panel, SG340P, manufactured by Peimar, was the main source. This device has 72 high-quality module cells disposed in an array of 12 by 6. Its main purpose is aimed at residential and small industrial placements. It has also a front cover of low-iron tempered glass and a double-wall aluminium frame on the sides to protect it and provide mechanical stiffness. Additional details related to the electrical properties are provided in Table 1. The irradiance and temperature are measured using the irradiance sensor, Si-V-010-T, manufactured by Meteo Control.

Table 1.
Technical data of SG340P.
Linked to the PV panel, a TEP-192 boost converter was used. This device allows a voltage increment, and it regulates the output voltage for any usage. It also provides measurements of input–output current and voltage for monitoring. Through the implementation of a metal–oxide–semiconductor field-effect transistor (MOSFET), an input PWM signal can control this boost converter. Further technical details are specified in Table 2.
Table 2.
TEP-192 Details.
The PWM signal was produced through a DS1104, which is a robust hardware developed by dSPACE for mechatronics development. Its purpose signal can be settled as analogue, digital and PWM. A programmable FPGA with a dual-core processor is the engine of this device that allows up to 250 MHz. It also supports Real-Time Interface (RTI)—a platform for fast and automatic C code generation that grants help to the designer to concentrate only on the Simulink interface. Additionally, dSPACE provided ControlDesk, which not only displays measured variables but can also be configured for the manipulation of control signals.
The circuit was closed by an external load that was simulated by a BK8500 Precision whose technical details are specified in Table 3. This programmable resistance can be configured between 0.1 Ω and 1000 Ω. It can support up to 120 W whenever the voltage is below 115 V and 47 Hz. A brief description of the hardware used and its linkage is provided in Figure 3.
Table 3.
BK 8500B Specifications.
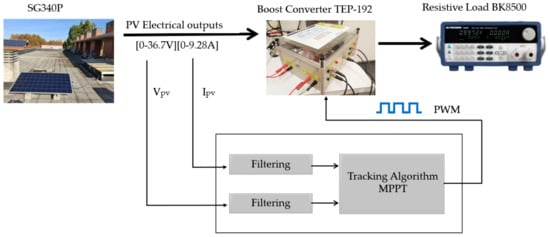
Figure 3.
Stand-alone photovoltaic energy conversion system.
2.3. Incremental Conductance
The IncCond tracking algorithm is one of the most widely used techniques due to its simplicity and its high accuracy when compared to the well-known P&O [33,36,37]. It controls the duty cycle, D, of the power converter by evaluating the state of voltage and current and applying increment/decrement changes, as presented in Figure 4. This technique was designed and implemented experimentally by the authors of [38], where they used a slightly regulated step size. A duty cycle with a small step-size value contributes to soft power oscillations at a steady state, but it also leads to a slow dynamic response with sensitivity against external disturbances. An opposite scenario occurs when a larger step size is applied, which leads to excessive power oscillation at a steady state. Therefore, although the obtained results from [38] showed a suitable performance in terms of tracking accuracy, the algorithm was not tested against external disturbance, which makes the performance questionable. Actually, without a variable step-size value, which is the case of most conventional MPPT algorithms, both fast dynamics and steady-state accuracy cannot be attained simultaneously because a variable step size performs smaller increments as long as the algorithm approaches the desired operating power point.
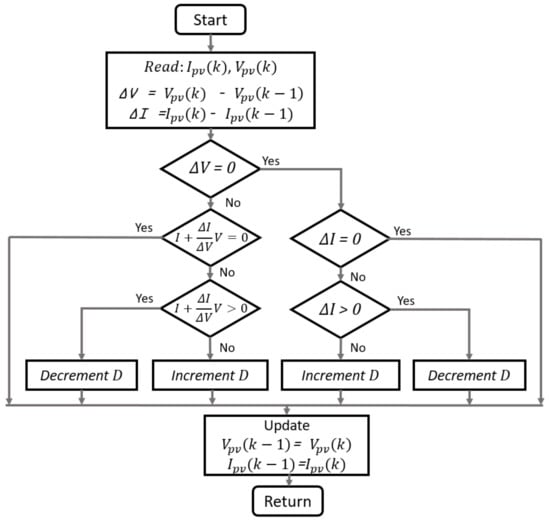
Figure 4.
Flowchart of IncCond algorithm.
2.4. Fuzzy Logic Control
The fuzzy logic control (FLC)-based MPPT algorithm is an intelligent technique that tracks the maximum operating power point of a PV system. It is based on the human experience rather than the system’s mathematical model. Thus, the proposed tracking technique is designed based on a step-by-step adaptive search. Table 4 summarises the MPP search rules, which were built based on the the slope of the power–voltage curve ().
Table 4.
MPP Search Rules.
The FLC control structure is displayed in Figure 5, where its mechanism is composed of three functional blocks: a fuzzification, an inference engine and a defuzzification. The role of the first functional block is mapping the inputs ΔV and ΔP, which are defined in Equations (6) and (7), to fuzzy variables.
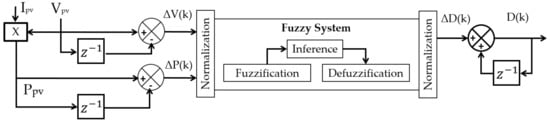
Figure 5.
FLC control structure.
The second functional block contains the membership rules, where the main logic from the user is interpreted. The entire set of fuzzy linguistic rules, which is composed of 25 distinct conditions, is presented in Table 5, where NB, NM, NS, Z, PS, PM and PB denote negative big, negative medium, negative small, zero, positive small, positive medium and positive big, respectively. These rules were set based on the if–then statement, as explained in the following two examples:
Table 5.
FLC linguistic rules.
- If (ΔV is NS) and (ΔP is Z) then (ΔD is NS);
- If (ΔV is PB) and (ΔP is PS) then (ΔD is PM).
Finally, the third functional block, ”defuzzification”, has the role of translating the linguistic rules of the inference block into numerical crisp values. The input and output membership functions were configured and designed using the fuzzy toolbox of Matlab software, and they are presented in Figure 6.
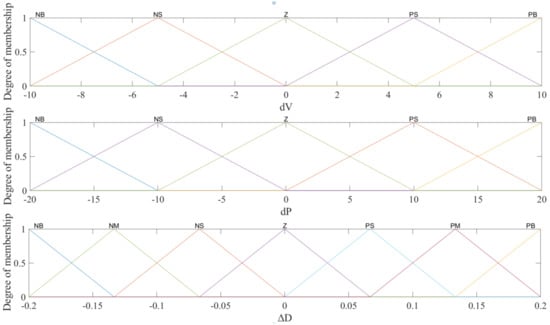
Figure 6.
FLC membership functions.
3. Experimental Results
The results of the IncCond and FLC tracking methods applied for the SG340P panel are displayed in Figure 7, Figure 8, Figure 9 and Figure 10. Figure 7 shows the weather conditions (irradiation and temperature) for both experiments, as long as the duty cycle signals were generated by both tracking methods. The irradiation and temperature used for the IncCond tracking algorithm varied approximately between 500 W/m2 and 550 W/m2 and between 18 °C and 20 °C, respectively, whereas the irradiation and temperature used for the FLC tracking algorithm varied approximately between 300 W/m2 and 350 W/m2 and between 20 °C and 21 °C, respectively. On the other hand, in order to test the robustness of the algorithms, sharp load variations from 20 Ω to 25 Ω and from 25 Ω to 20 Ω were applied, each for 240 s. It should be noted that high load resistance could not be applied due to the limited voltage of the BK 8500B Precision. The effect of load changes can be noticed in the duty cycle signals, which are displayed in Figure 7c,f; however, a detailed analysis of these effects will be studied later.
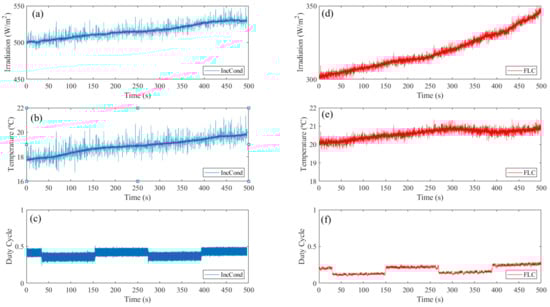
Figure 7.
Weather conditions and duty cycle signals generated by IncCond and FLC tracking algorithms: (a) irradiation (W/m2) used for the experiment of the IncCond; (b) temperature (°C) used for the experiment of the IncCond; (c) duty cycle signal generated by IncCond; (d) irradiation (W/m2) used for the experiment of the FLC; (e) temperature (°C) used for the experiment of the FLC; and (f) duty cycle signal generated by FLC.
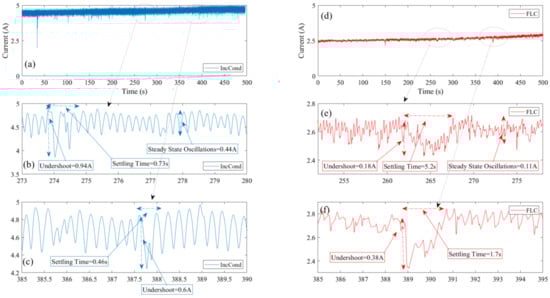
Figure 8.
PV panel current signals correspond to the maximum power point: (a) current signal under the use of the IncCond; (b) influence of the first load variation for the case of the IncCond; (c) influence of the second load variation for the case of the IncCond; (d) current signal under the use of the FLC; (e) influence of the first load variation for the case of the FLC; and (f) influence of the second load variation for the case of the FLC.
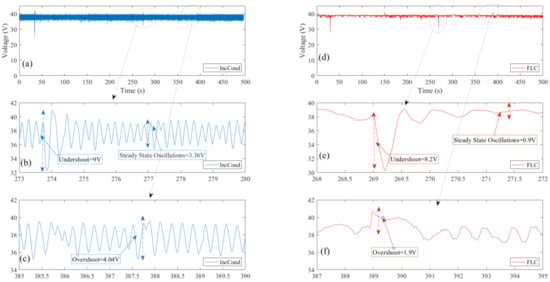
Figure 9.
PV panel voltage signals correspond to the maximum power point: (a) voltage signal under the use of the IncCond; (b) influence of the first load variation for the case of the IncCond; (c) influence of the second load variation for the case of the IncCond; (d) voltage signal under the use of the FLC; (e) influence of the first load variation for the case of the FLC; and (f) influence of the second load variation for the case of the FLC.
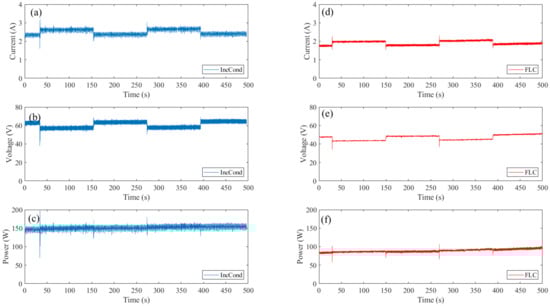
Figure 10.
Boost converter output signals based on IncCond and FLC: (a) output current signal based on IncCond; (b) output voltage signal based on IncCond; (c) output power signal based on IncCond; (d) output current signal based on FLC; (e) output voltage signal based on FLC; and (f) output power signal based on FLC.
The current signals of the PV panel under the application of the IncCond and FLC tracking algorithms are presented in Figure 8. By changing the load resistance from 25 Ω to 20 Ω, the IncCond showed an undershoot current of 0.94 A and a settling time of 0.73 s, whereas the FLC showed an undershoot current of only 0.18 A and a settling time of 5.2 s. Therefore, a reduction of 0.76 A in the undershoot was achieved via the use of the proposed FLC tracking algorithm. Regarding the settling time, the IncCond showed a better result of 4.47 s, and this is reasonable because the increment of fuzzy became small around the steady state. During the second change, from 20 Ω to 25 Ω, the IncCond showed an undershoot current of 0.6 A and a settling time of 0.46 s, whereas the FLC showed an undershoot current of only 0.38 A and a settling time of 1.7 s. Therefore, a reduction of 0.22 A in the undershoot was achieved via the use of the proposed FLC tracking algorithm; however, in terms of settling time, the IncCond showed results that were 1.24 s faster. Regarding the steady-state oscillations, the IncCond showed a value of 0.44 A, whereas the FLC showed a value of only 0.11 A, which means that a reduction of 0.33 A was achieved via the use of the proposed tracking algorithm.
The voltage signals of the PV panel under the use of both tracking algorithms are presented in Figure 9. During the first load variation, undershoots of 9 V and 8.2 V occurred in IncCond and FLC, respectively, which means that the latter succeeded in reducing the undershoot by 0.8 V. During the second load variation, overshoots of 4.04 V and 1.9 V occurred in IncCond and FLC, respectively, which means that the FLC succeeded in reducing the overshoot by 2.14 V. Therefore, reductions of 8.9% and 52.9% were achieved via the use of the FLC tracking algorithm for the first and second load variations, respectively. Regarding the steady-state oscillations, the proposed FLC also succeeded in reducing the value from 3.36 V to 0.9 V, which represents a value of 73.2%.
The output signals of the DC–DC boost converter under the application of the IncCond and FLC tracking algorithms are displayed in Figure 10. According to these graphs, it is clear that the proposed FLC tracking algorithm shows better performance in terms of robustness and steady-state oscillations, which will result in increasing tracking efficiency.
4. Conclusions
In this article, two different tracking techniques were studied. First, the hardware components were explained in detail, as well as their integration in a closed-loop system. Then, the IncCond and proposed FLC tracking techniques were designed for the high-step-up power converter. It was found that both techniques were characterised by low-complexity designs. Moreover, easy implementation was obtained because only a few parameters were tuned.
Comparative studies between the two tracking methods were performed based on robustness, accuracy and dynamic response speed. Load variations from 20 Ω to 25 Ω and from 25 Ω to 20 Ω were applied to display these performances, each for a period of 240 s. On the other hand, experiments were performed under unstable weather conditions to test the tracking capability of each algorithm. The obtained results demonstrated the success of both methods in tracking the maximum power point, even under unstable weather conditions and large load variations. However, high tracking performance, in terms of robustness and accuracy, was obtained via the use of the proposed FLC algorithm. Hence, a reduction of 52.9 % and 73.2 % in overshoots and steady-state oscillations, respectively, were achieved via the application of the proposed FLC tracking algorithm.
Author Contributions
Conceptualisation, M.D., C.N. and O.B.; methodology, M.D. and C.N.; software, M.D and C.N.; validation, M.D.; formal analysis, M.D. and C.N.; investigation, M.D., C.N. and O.B.; resources, O.B.; writing—original draft preparation, M.D. and C.N.; writing—review and editing, M.D., C.N. and O.B.; supervision, O.B.; project administration, O.B. All authors have read and agreed to the published version of the manuscript.
Funding
This research received no external funding.
Institutional Review Board Statement
Not applicable.
Informed Consent Statement
Not applicable.
Data Availability Statement
Not applicable.
Acknowledgments
The authors wish to express their gratitude to the Basque Government, through the project EKOHEGAZ (ELKARTEK KK-2021/00092), to the Diputación Foral de Álava (DFA), through the project CONAVANTER, and to the UPV/EHU, through the project GIU20/063, for supporting this work.
Conflicts of Interest
The authors declare no conflict of interest.
Abbreviations
The following abbreviations and nomenclatures are used in this manuscript:
| PV | Photovoltaic |
| MPPT | Maximum power point tracking |
| IncCond | Incremental conductance |
| FLC | Fuzzy logic control |
| HCA | Hill-climbing algorithm |
| P&O | Perturb and observation |
| HIL | Hardware in the loop |
| PSO | Particle swarm optimisation |
| EOA | Earthquake optimisation algorithm |
| VSS | Variable step size |
| PWM | Pulse-width modulation |
| MOSFET | Metal–oxide–semiconductor field-effect transistor |
| RTI | Real-time interface |
| FPGA | Field-programmable gate array |
| Maximum power point | |
| PV current | |
| PV voltage | |
| PV power | |
| ΔV | The change in voltage between k and k−1 |
| ΔI | The change in current between k and k−1 |
| ΔP | The change in power between k and k−1 |
| ΔD | The change in duty cycle between k and k−1 |
| D | Duty cycle |
| Cell current | |
| Current generated by solar irradiation | |
| Diode’s current | |
| Current of the parallel resistance | |
| Reverse saturation current | |
| K | Boltzmann constant |
| q | Elementary charge |
| Cell junction temperature | |
| Series resistance | |
| Parallel resistance | |
| G | Global irradiation |
| Global irradiation at standard rating conditions | |
| Short-circuit current | |
| Cell reference temperature | |
| A term that comprises the thermal factor of the short-circuit current | |
| Number of parallel modules | |
| Number of series cells | |
| Short-circuit current |
References
- International Energy Agency. Coal-Fired Power; Technical Report; International Energy Agency: Paris, France, 2021. [Google Scholar]
- Zhang, W.; Meng, Z.; Yang, J.; Song, Y.; Zhou, Y.; Zhao, C.; Yuan, J. Managing the phaseout of coal power: A comparison of power decarbonization pathways in Jilin Province. Resour. Conserv. Recycl. 2022, 180, 106216. [Google Scholar] [CrossRef]
- Sarmiento, L.; Burandt, T.; Löffler, K.; Oei, P.Y. Analyzing Scenarios for the Integration of Renewable Energy Sources in the Mexican Energy System—An Application of the Global Energy System Model (GENeSYS-MOD). Energies 2019, 12, 3270. [Google Scholar] [CrossRef]
- International Energy Agency. Key World Energy Statistics; Technical Report; International Energy Agency: Paris, France, 2020. [Google Scholar]
- Goman, V.; Prakht, V.; Kazakbaev, V.; Dmitrievskii, V. Comparative Study of Energy Consumption and CO2 Emissions of Variable-Speed Electric Drives with Induction and Synchronous Reluctance Motors in Pump Units. Mathematics 2021, 9, 2679. [Google Scholar] [CrossRef]
- Brauers, H.; Oei, P.Y.; Walk, P. Comparing coal phase-out pathways: The United Kingdom’s and Germany’s diverging transitions. Environ. Innov. Soc. Transitions 2020, 37, 238–253. [Google Scholar] [CrossRef]
- Hrovatin, D.; Žemva, A. Exploiting Solar Energy during an Aerial Mapping Mission on a Lightweight UAV. Electronics 2021, 10, 2876. [Google Scholar] [CrossRef]
- Hamadi, S.A.; Chouder, A.; Rezaoui, M.M.; Motahhir, S.; Kaddouri, A.M. Improved Hybrid Parameters Extraction of a PV Module Using a Moth Flame Algorithm. Electronics 2021, 10, 2798. [Google Scholar] [CrossRef]
- Bernardes, S.; Lameirinhas, R.A.M.; Torres, J.P.N.; Fernandes, C.A.F. Characterization and Design of Photovoltaic Solar Cells That Absorb Ultraviolet, Visible and Infrared Light. Nanomaterials 2021, 11, 78. [Google Scholar] [CrossRef]
- Benbouhenni, H.; Bizon, N. Terminal Synergetic Control for Direct Active and Reactive Powers in Asynchronous Generator-Based Dual-Rotor Wind Power Systems. Electronics 2021, 10, 1880. [Google Scholar] [CrossRef]
- Nazligul, A.S.; Wang, M.; Choy, K.L. Recent Development in Earth-Abundant Kesterite Materials and Their Applications. Sustainability 2020, 12, 5138. [Google Scholar] [CrossRef]
- Alsadi, S.; Khatib, T. Photovoltaic Power Systems Optimization Research Status: A Review of Criteria, Constrains, Models, Techniques, and Software Tools. Appl. Sci. 2018, 8, 1761. [Google Scholar] [CrossRef]
- Yousaf, J.; Faisal, M.; Nah, W.; Ghazal, M.; Sarmad Mahmmod, R.; Rmili, H. Effects of Random Switching Schemes on the EMI Levels of Conventional and Interleaved Buck Converters for Mobile Devices. Electronics 2022, 11, 306. [Google Scholar] [CrossRef]
- Parada-Salado, J.G.; Rodríguez-Licea, M.A.; Soriano-Sanchez, A.G.; Ruíz-Martínez, O.F.; Espinosa-Calderon, A.; Pérez-Pinal, F.J. Study on Multiple Input Asymmetric Boost Converters with Simultaneous and Sequential Triggering. Electronics 2021, 10, 1421. [Google Scholar] [CrossRef]
- Kjaerr, M.; Wang, H.; Blaabjerg, F. Adequacy Evaluation of an Islanded Microgrid. Electronics 2021, 10, 2344. [Google Scholar] [CrossRef]
- Shen, C.L.; Chen, L.Z.; Chuang, T.Y.; Liang, Y.S. Cascaded-like High-Step-Down Converter with Single Switch and Leakage Energy Recycling in Single-Stage Structure. Electronics 2022, 11, 352. [Google Scholar] [CrossRef]
- Vankadara, S.K.; Chatterjee, S.; Balachandran, P.K.; Mihet-Popa, L. Marine predator algorithm (MPA)-based MPPT technique for solar PV systems under partial shading conditions. Energies 2022, 15, 6172. [Google Scholar] [CrossRef]
- Oliver, J.S.; David, P.W.; Balachandran, P.K.; Mihet-Popa, L. Analysis of Grid-Interactive PV-Fed BLDC Pump Using Optimized MPPT in DC–DC Converters. Sustainability 2022, 14, 7205. [Google Scholar] [CrossRef]
- Udayakumar, M.D.; Sabarish, P.; Indragandhi, V.; Rajkumar, A. An advanced control technique for a Grid-Tied Hybrid Renewable energy system with Reciprocated sinusoidal PWM methodology. IOP Conf. Ser. Mater. Sci. Eng. 2019, 623, 012018. [Google Scholar] [CrossRef]
- Liu, H.D.; Lu, S.D.; Lee, Y.L.; Lin, C.H. A Novel Photovoltaic Module Quick Regulate MPPT Algorithm for Uniform Irradiation and Partial Shading Conditions. Processes 2021, 9, 2213. [Google Scholar] [CrossRef]
- Mahmod Mohammad, A.N.; Mohd Radzi, M.A.; Azis, N.; Shafie, S.; Atiqi Mohd Zainuri, M.A. An Enhanced Adaptive Perturb and Observe Technique for Efficient Maximum Power Point Tracking Under Partial Shading Conditions. Appl. Sci. 2020, 10, 3912. [Google Scholar] [CrossRef]
- Yildirim, M.A.; Nowak-Ocłoń, M. Modified Maximum Power Point Tracking Algorithm under Time-Varying Solar Irradiation. Energies 2020, 13, 6722. [Google Scholar] [CrossRef]
- Zafar, M.H.; Al-shahrani, T.; Khan, N.M.; Feroz Mirza, A.; Mansoor, M.; Qadir, M.U.; Khan, M.I.; Naqvi, R.A. Group Teaching Optimization Algorithm Based MPPT Control of PV Systems under Partial Shading and Complex Partial Shading. Electronics 2020, 9, 1962. [Google Scholar] [CrossRef]
- Verma, D.; Nema, S.; Agrawal, R.; Sawle, Y.; Kumar, A. A Different Approach for Maximum Power Point Tracking (MPPT) Using Impedance Matching through Non-Isolated DC-DC Converters in Solar Photovoltaic Systems. Electronics 2022, 11, 1053. [Google Scholar] [CrossRef]
- Ko, J.S.; Huh, J.H.; Kim, J.C. Overview of Maximum Power Point Tracking Methods for PV System in Micro Grid. Electronics 2020, 9, 816. [Google Scholar] [CrossRef]
- Ahmed, J.; Salam, Z. An Enhanced Adaptive P & O MPPT for Fast and Efficient Tracking Under Varying Environmental Conditions. IEEE Trans. Sustain. Energy 2018, 9, 1487–1496. [Google Scholar] [CrossRef]
- Macaulay, J.; Zhou, Z. A Fuzzy Logical-Based Variable Step Size P & O MPPT Algorithm for Photovoltaic System. Energies 2018, 11, 1340. [Google Scholar] [CrossRef]
- Farhat, M.; Barambones, O.; Sbita, L. A Real-Time Implementation of Novel and Stable Variable Step Size MPPT. Energies 2020, 13, 4668. [Google Scholar] [CrossRef]
- Alagammal, S.; Prabha, N.R. Combination of Modified P&O with Power Management Circuit to Exploit Reliable Power from Autonomous PV-Battery Systems. Iran. J. Sci. Technol. Trans. Electr. Eng. 2020, 45, 97–114. [Google Scholar] [CrossRef]
- Bouarroudj, N.; Benlahbib, B.; Houam, Y.; Sedraoui, M.; Batlle, V.F.; Abdelkrim, T.; Boukhetala, D.; Boudjema, F. Fuzzy based incremental conductance algorithm stabilized by an optimal integrator for a photovoltaic system under varying operating conditions. Energy Sources Part A Recover. Util. Environ. Eff. 2021, 1–26. [Google Scholar] [CrossRef]
- Mendez, E.; Ortiz, A.; Ponce, P.; Macias, I.; Balderas, D.; Molina, A. Improved MPPT Algorithm for Photovoltaic Systems Based on the Earthquake Optimization Algorithm. Energies 2020, 13, 3047. [Google Scholar] [CrossRef]
- Ajani, T.S.; Imoize, A.L.; Atayero, A.A. An Overview of Machine Learning within Embedded and Mobile Devices–Optimizations and Applications. Sensors 2021, 21, 4412. [Google Scholar] [CrossRef]
- Ye, S.P.; Liu, Y.H.; Liu, C.Y.; Ho, K.C.; Luo, Y.F. Artificial Neural Network Assisted Variable Step Size Incremental Conductance MPPT Method with Adaptive Scaling Factor. Electronics 2022, 11, 43. [Google Scholar] [CrossRef]
- Giurgi, G.I.; Szolga, L.A.; Giurgi, D.V. Benefits of Fuzzy Logic on MPPT and PI Controllers in the Chain of Photovoltaic Control Systems. Appl. Sci. 2022, 12, 2318. [Google Scholar] [CrossRef]
- Chuang, M.T.; Liu, Y.H.; Ye, S.P. A Novel Variable Step Size Incremental Conductance Method with an Adaptive Scaling Factor. Appl. Sci. 2020, 10, 5214. [Google Scholar] [CrossRef]
- Owusu-Nyarko, I.; Elgenedy, M.A.; Abdelsalam, I.; Ahmed, K.H. Modified variable step-size incremental conductance MPPT technique for photovoltaic systems. Electronics 2021, 10, 2331. [Google Scholar] [CrossRef]
- Pradhan, C.; Senapati, M.K.; Ntiakoh, N.K.; Calay, R.K. Roach Infestation Optimization MPPT Algorithm for Solar Photovoltaic System. Electronics 2022, 11, 927. [Google Scholar] [CrossRef]
- Mustafić, D.; Jokić, D.; Lale, S.; Lubura, S. Implementation of Incremental Conductance MPPT Algorithm in Real Time in Matlab/Simulink Environment with Humusoft MF634 Board. In Proceedings of the 2020 9th Mediterranean Conference on Embedded Computing (MECO), Budva, Montenegro, 8–11 June 2020; pp. 1–5. [Google Scholar]
Disclaimer/Publisher’s Note: The statements, opinions and data contained in all publications are solely those of the individual author(s) and contributor(s) and not of MDPI and/or the editor(s). MDPI and/or the editor(s) disclaim responsibility for any injury to people or property resulting from any ideas, methods, instructions or products referred to in the content. |
© 2023 by the authors. Licensee MDPI, Basel, Switzerland. This article is an open access article distributed under the terms and conditions of the Creative Commons Attribution (CC BY) license (https://creativecommons.org/licenses/by/4.0/).