Abstract
The effect of intrinsic metal mineral elements in the combustion process of pulverized coal on the formation and transformation mechanism of PM was investigated in a drop-tube furnace in air atmospheres at 1200 °C, which laid a solid foundation for the control of particulate pollutants. The results show that reducing the evaporation of mineral elements or the generated PM1 aggregating to form PM1–10 or particles bigger than 10µm can reduce the emission of PM1 in the coal combustion process. The amount of PM0.2, PM0.2–1, PM1–2.5 and PM2.5 produced by the raw coal-carrying Mg are reduced by 36.7%, 17.4%, 24.6% and 21.6%, respectively. The amount of PM10 is almost unchanged. The addition of Mg increases the viscosity of submicron particles effectively, making it easier to aggregate and bond together to form ultra-micron particles. The amount of PM0.2, PM0.2–1, PM1–2.5, PM2.5 and PM10 produced by the raw coal-carrying Ca are reduced by 36.3%, 33.0%, 42.8%, 38% and 17.7%, respectively. The effect of adding Ca compounds on the particles is better than that of Mg. The amount of PM0.2, PM0.2–1, PM1–2.5, PM2.5 and PM10 produced by the raw coal-carrying Fe are reduced by 15.6%, 16.2%, 31.1%, 22.4% and 5%, respectively. While the production of PM2.5–10 increased from 0.17 mg/g to 0.34 mg/g, it is clear that a significant fraction of the submicron particles produced during the combustion of the raw coal-carrying Fe are transformed into ultra-micron particles. After comparing the particulate matter produced by raw coal-carrying Mg, Ca and Fe, it shows that the addition of these three elements can effectively reduce the ash melting point, so that during the process of coal combustion, part of the sub-micron are transformed into ultra-micron particles, which are easy to remove.
1. Introduction
Currently, China’s air quality situation is extremely severe, particulate matter (PM) pollution is the main reason. Particulate matter (PM) has become a major air pollutant in urban China in recent years and is a leading factor contributing to decreased atmospheric visibility, global climate change and photochemical smog [1]. Particulate matter emitted from coal combustion is one of the sources of atmospheric particulates [2]. Fine particles generated during coal combustion are easy to enrich toxic heavy metals such as Pb, Cd, As, Se and organic pollutants such as PAHs [3,4,5]. In addition, the electrostatic precipitator has relatively low collection efficiency for these fine particles [6]. Coal burning particulates easily accumulate heavy metal trace elements, which are harmful to the environment and human health [7,8]. Reducing particulate matter generated by coal combustion is one of the key points of pollutant emission. The premise of a number of pollutant control means playing a role is fully understanding the PM formation and transformation mechanism. In the process of PM formation, the presence of mineral elements largely controls the formation of PM, which occupies a large proportion of PM particulates after combustion [9,10]. The particulate matter formation process is more complex; it is generally believed that the volatile part of atomic inorganic elements in coal and the external minerals on the surface of the coal will gasify due to high temperature and reducing atmosphere, mainly in the form of atomic or in the form of sub-oxide [11]. Submicron particles (<1 µm) are composed of the following three components: metal oxides (Na2O and K2O), refractory oxides (SiO2, Fe2O3, CaO), sulfides and so on [12,13]. The submicron particles of high-rank bituminous coal are mainly composed of refractory oxide SiO2, followed by Na2O, Fe2O3 or SO3. The content of refractory oxides in low-grade lignite submicron particles is low, and the main components are alkali metal and the oxidation of alkaline earth metal and sulfides. The results show that the content of Si in Zhundong coal ultrafine particles is very small [14], mainly S and Na (more than 15%) and volatile elements such as K, Ca, Mg, Cl and F. The main component in submicron particles is sulfate and aluminosilicate based on Na and Ca; the spherical particles of micron particles are mostly aluminosilicate based on Ca, Mg and Na [15]. In the process of pulverized coal combustion, volatiles are internally oxidized by the outward diffusion of oxygen into the corresponding oxide. If the steam in the flue gas reaches the supersaturation state, the steam will form a large number of fine particles (<0.01 µm) by homogeneous nucleation. Small particles grow mainly in two ways, one way is the formation of inorganic vapors on the surface of fine particles in the condensation, so that the particulate matter volume increases [16], another way is the collision of fine particles with each other, forming larger particles [11]. The presence of Na, K and the easy gasified elements enriched on the submicron particles and other difficult gasified elements like Si, Al, Fe, Ca and Mg existed on the submicron particles indicates that the gasification-condensation mechanism of inorganic mineral elements is the most important form of submicron particulate formation [17,18,19]. The direct conversion of intrinsic minerals in raw coal and the polymerization of volatile mineral vapors are the two kinds of main ways to form ultrafine particles [20]. The gasification of Ca and Mg has an important influence on the formation of submicron particles during the combustion of low-order sub-bituminous coal and lignite. The occurrence of Ca and Mg in low-rank coal is the main reason for its gasification behavior. Ca and Mg in subbituminous coal mainly exist in the form of carbonate, and the amount of gasification is very low. Ca and Mg in the lignite mainly exist in the atomic state, which is prone to gasification in the combustion process; therefore, they occupy a higher content in the fine particles [21].
The above studies have proved the effect of intrinsic metal mineral elements in the combustion process of pulverized coal on the formation and transformation mechanism of PM, which laid a solid foundation for the control of particulate pollutants [22]. However, there is little research on the mechanism of PM formation and transformation and its subsequent control mechanism under the condition of externally added mineral elements [23]. In this paper, we use the method of external loading mineral elements was adopted to study the physical and chemical characteristics of the particles formed during the burning process of the Chinese Zhundong coal with external mineral load in the one-dimensional settling furnace reactor [24].
2. Experiment
2.1. Sample Preparation
Chinese Zhundong coal, which was first dried at 80 °C for 12 h, was used in the experiment. The proximate and ultimate analyses of the coal sample are shown in Table 1. In order to explore the influence of different mineral elements on the particles generated in the combustion process of Zhundong coal, the compound loading was carried out. The sample was loaded with compounds of different metal elements by the immersion method. The loading steps are as follows. The Zhundong coal particles were mixed thoroughly with 1 mol/L of mineral salts (Fe(NO3)3·9H2O, MgAc2, CaAc2) at a liquid to solid ratio of 30:1 [25]. The mixture was stirred for 24 h in an inert atmosphere, and then the mixed slurry was filtered and the precipitation was dried in a vacuum oven at 80 °C for 24 h, crushed and collected, then stored it at 4 °C. After carrying out an analytical test on the Zhundong coal sample carrying the compound, the content of Mg in the coal was increased from 1.26 mg/g to 2.61 mg/g in the raw coal after carrying MgAc2. The content of Ca was increased from 2.61 mg/g to 4.12 mg/g after loading CaAc2, the content of Fe increased from 2.83 mg/g to 4.21 mg/g after carrying Fe(NO3)3·9H2O.

Table 1.
Proximate and ultimate analyses of raw Zhundong coal.
2.2. Experimental System
A drop-tube furnace (shown in Figure 1) was used for experiments with Chinese Zhundong coal. The experiment was carried out in air atmospheres at 1200 °C. The furnace was composed of an 80 mm diameter corundum tube of length 2000 mm. It can withstand high temperatures above 1500 °C. The B indexing thermocouple is arranged on the outer surface for temperature monitoring and control. The experimental system is provided with two air supplies. The primary air is mainly used for conveying pulverized coal and the oxygen demand at the initial stage of pulverized coal combustion. The secondary air is fully mixed and preheated inside the burner to supplement the oxygen required for complete combustion of pulverized coal to enable the pulverized coal to burn out. The pulverized coal sample was pneumatically conveyed into the furnace chamber at a constant rate of 1.0 g/min by a primary air stream. A secondary air stream was then mixed in at the burner to ensure complete combustion occurred during the coal’s residence in the furnace. Fly ash was collected at the bottom of the reactor to investigate the PM [26].
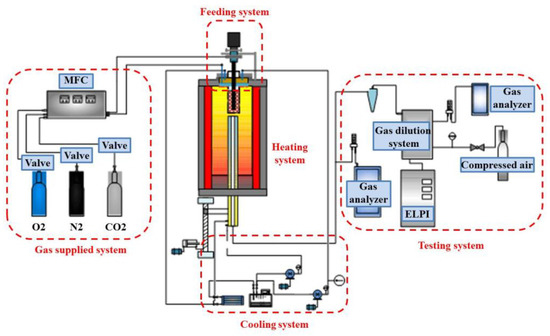
Figure 1.
Schematic diagram of the experimental furnace.
2.3. Sampling System and Characteristics Analysis
The experimental set up employed the fixed combustion particle dilution sampling system developed by Tsinghua University. PM samples were simultaneously sampled from the collected ash and classified for analysis [27]. To study the morphology and composition, a poly-ammonia carbonate membrane was used for imaging and electron microscope analysis [28]. An electrical low-pressure impactor (ELPI) (97 2E, NO.24423, Dekati Ltd., Kangasala, Finland) was used to measure the ash particle size distribution. The particle morphology and composition were analyzed using a combined scanning electron microscopy–energy dispersive X-ray spectroscopy approach (SEM–EDX; EVO18).
3. Results and Discussion
3.1. Effect of Magnesium on the Formation of Fine Particles
3.1.1. Effect of Magnesium on the Particle Morphology and Particle Size Distribution
Morphologies of the particulate matter generated by the combustion of raw coal and raw coal-carrying Mg are shown in Figure 2 and Figure 3, respectively. Compared with raw coal combustion, the particulates generated by the combustion of raw coal-carrying Mg shows accumulation state [29], and it is evident that a part of the submicron particles adhered to the surface of the coarse-mode particles, which makes the particle size generally increase. Yoshihiko [30] observed the coal-carrying magnesium-based compounds by scanning electron microscopy, and it showed that magnesium-based compounds uniformly dispersed in the coal surface, the average particle size was among the sub-micron level, the magnesium-based additive is an intrinsic mineral element in coal and not an external mineral in physically mixed form (this extraneous mineral and coal particles have relatively few connections). Therefore, it can be considered that the loaded magnesium element exists mainly in the form of an intrinsic mineral [31,32,33].
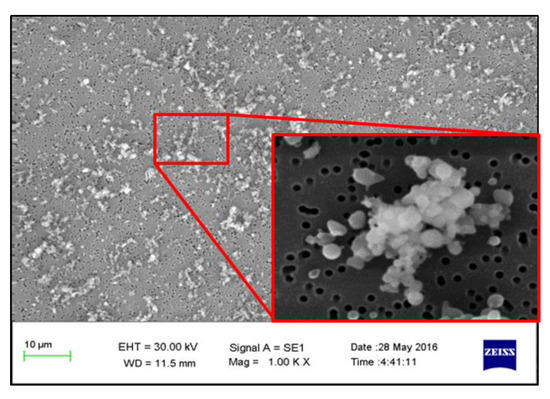
Figure 2.
Particle morphology of raw coal.
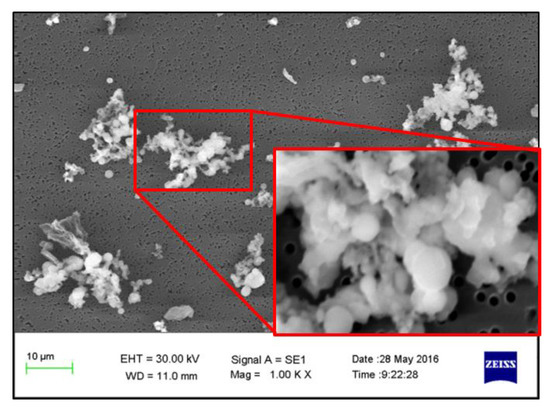
Figure 3.
Morphology of particles after carrying magnesium.
Figure 4 is the generating particulate matter mass size distribution by the original coal and the original coal with the addition of Mg. It can be seen that the addition of Mg element shows the changes in particle size. Primitive minerals (including particle size and chemical composition) to some extent affect the effect of adding Mg minerals. Figure 5 shows the amounts of PM0.2, PM0.2–1, PM1–2.5 generated from raw coal and Mg-carrying raw coal. The production of PM0.2, PM0.2–1, PM1–2.5 were reduced from 0.32 mg/g, 0.31 mg/g, 0.45 mg/g to 0.25 mg/g, 0.26 mg/g and 0.34 mg/g, respectively. After adding Mg, the amount of PM0.2, PM0.2–1, PM1–2.5 decreased by 36.7%, 17.4% and 24.6%, respectively, and the amount of PM2.5 was reduced by 21.6%. While the PM2.5–10 production increased from 0.17 mg/g to 0.41 mg/g. The total mass of PM10 was 1.24 mg/g and 1.26 mg/g, almost no changes at all. It is clear that the chemical composition of PM10 has changed.
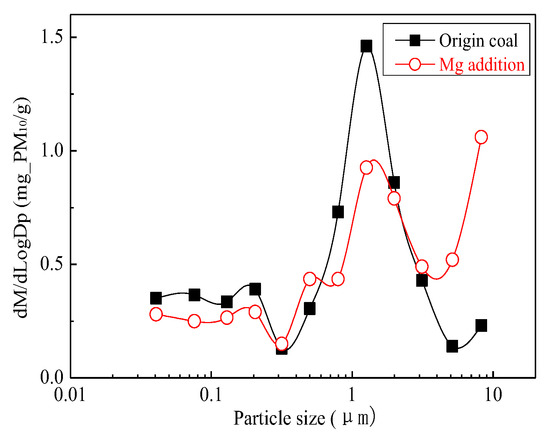
Figure 4.
Particle size distribution (Mg addition).
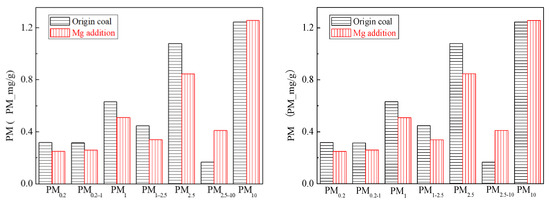
Figure 5.
Particulate matter production (Mg addition).
3.1.2. Effect of Magnesium on the Chemical Composition of Particles
The main elemental compositions of the particulates generated by the combustion of pulverized coal-carrying Mg are Fe, Mg, Ca, Al and Si, and the main volatile elements is Na, which are shown in Figure 6, Figure 7, Figure 8, Figure 9, Figure 10 and Figure 11. The decrease in PM1 is mainly due to the decrease in Fe, Ca, Al and Si, and the reduction of volatile elements also play a certain role. The reduction of PM1–2.5 is mainly due to the reduction of the insoluble Al, Si and Fe elements, and the reduction of volatile elements is little, which is almost negligible [34]. The Al, Si and Fe elements in part of the particles below 1 µm transformed coarse mode particles above 2.5 µm, which is the main reason for the decrease in PM 2.5 generation [35,36]. According to the analysis of particle composition under different particle sizes, the results show that the main reason for the decrease in PM1 is the transfer of Ca, Mg, Al and Si from submicron particles to ultra-micrometer particles.
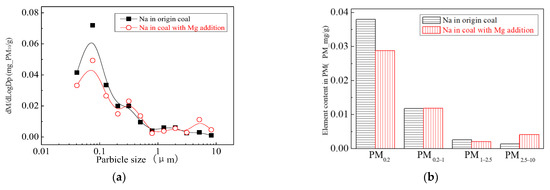
Figure 6.
Mass particle size distribution of Na (Mg addition). (a) The curves of mass particle size distribution. (b) Sectional size distribution.
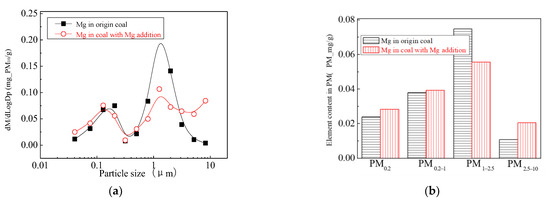
Figure 7.
Mass particle size distribution of Mg (Mg addition). (a) The curves of mass particle size distribution. (b) Sectional size distribution.
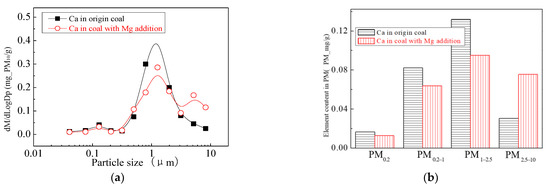
Figure 8.
Mass particle size distribution of Ca (Mg addition). (a) The curves of mass particle size distribution. (b) Sectional size distribution.
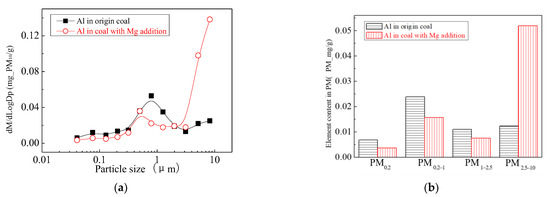
Figure 9.
Mass particle size distribution of Al (Mg addition). (a) The curves of mass particle size distribution. (b) Sectional size distribution.
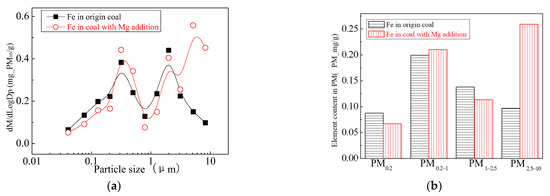
Figure 10.
Mass particle size distribution of Fe (Mg addition). (a) The curves of mass particle size distribution. (b) Sectional size distribution.
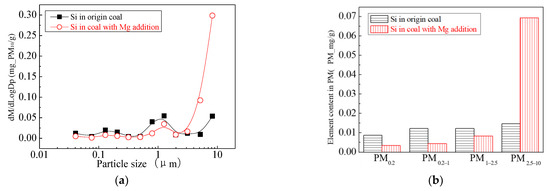
Figure 11.
Mass particle size distribution of Si (Mg addition). (a) The curves of mass particle size distribution. (b) Sectional size distribution.
The addition of Mg-based compounds can significantly affect the mineral conversion during pulverized coal combustion. The morphology of the particle and energy spectrum are shown in Figure 12. The SEM results show that the spherical particles indicate that they are formed by droplets in the combustion process; semi-molten irregular particles show that they are from the transition of the solid or incomplete liquid particles. The forming liquid material may provide a viscosity that allows the submicron particles or fine particles to adhere to the coarse mode particles, which allows the conversion of these elements to particles of different particle sizes. The fine particle morphology indicates that they are formed by the accumulation of small particles, the increase in the mass percentage of the liquid material is the primary reason for the formation of suitable viscosities [37], the submicron particles adhere to the coarse mode particles and they can capture submicron particles which can reduce the amount of sub-micron particulate matter. From the three points of the first figure, the Mg content is the highest at point 1 which can reach 87%, the Mg content at point 2 is 30%, and the Mg content at point 3 is 33%. Mg-Ca-Fe-Al-Si, Mg-Ca-Al-Si and Mg-Al-Si are the main components of the magnesium-containing particles [38].

Figure 12.
Morphology and Spectra of Particles after adding Mg. (a) Spectral Scanning Position. (b) Elements of Scan position. (c) Spectral Scanning Position. (d) Elements of Scan position. (e) Spectral Scanning Position. (f) Elements of Scan position.
Mg-based additives reduce the amount of PM1 and PM2.5, this is because the compositions of molten liquid during the combustion process of pulverized coal changes [30,39], which is an important condition to control the accumulation of mineral particles under high-temperature conditions. The addition of a soluble magnesium compound makes the magnesium element penetrate the coal particles and distribute evenly in the coal, and decompose into MgO forming submicron particles during combustion [40,41]. Submicron particles contained Al, Si in the coal blend and agglomerate with MgO to form large particles. Magnesium and refractory elements form co-materials like Mg-Ca-Fe-Al-Si, Mg-Ca-Al-Si, Mg-Al-Si and magnesium oxide. Its main mechanism is as follows:
MgO + SiO2 → Mg2SiO4
MgO + 3Al2O3·2SiO2 → MgO·Al2O3·2SiO2
MgO·Al2O3·2SiO2 + MgO → Mg3Al2(SiO4)3 + Mg2 Al4Si5O18
MgO + Ca2SiO4 → CaMgSiO4
Yoshihiko [30] conducted a FactSage simulation of fly ash with different Mg contents. The results show that the adding magnesium significantly increases the amount of molten liquid in the fly ash. The combustion of coal with magnesium-containing additives compared to the direct combustion of coal shows a great increase in the accumulation of fine particles and a considerable part of the submicron particles attached to the coarse-mode particles surface. Magnesium-based additives promote ash accumulation, which shows a good potential to reduce particulate emissions during coal combustion [42], especially through the formation of the fused liquid form to promote the accumulation of fine-grain dust, thereby reducing the amount of PM1 and PM2.5.
3.2. Effect of Calcium on the Formation of Fine Particles
3.2.1. Effect of Calcium on the Particle Morphology and Particle Size Distribution
The morphology of the particulate matter produced by the combustion of raw coal-carrying Ca is shown in Figure 13. The SEM results show that the spherical particles formed by coal combustion indicate that they are transformed from droplets in the combustion process. Semi-molten irregular particles show that they are transformed from solid or incomplete liquid particles. Compared with the raw coal combustion, coals with Ca-based additives are burned to form accumulation state; a part of the submicron particles are accumulated to form larger particles.
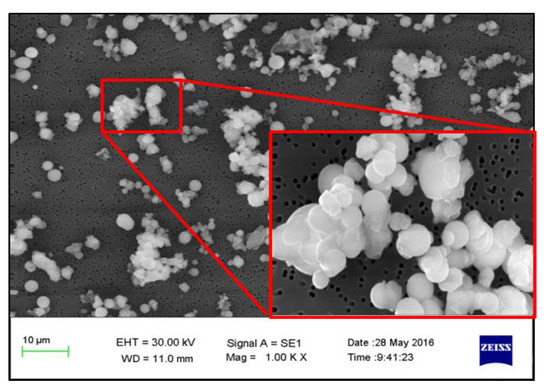
Figure 13.
Morphology of particles after carrying calcium.
Figure 14 and Figure 15 are the particulate matter mass size distributions for the particles generated by raw coal and raw coal with Ca-based addition [43]. From the figures, we can see the particle size changes after adding the Ca element. Raw minerals (including particle size and chemical composition) to some extent affect the effect of adding Ca minerals by comparing the effects of Ca minerals addition on the production of PM0.2, PM0.2–1 and PM1–2.5.The production of PM0.2, PM0.2–1 and PM1–2.5 were reduced from 0.32 mg/g, 0.31 mg/g, 0.45 mg/g to 0.20 mg/g, 0.21 mg/g, 0.26 mg/g, respectively. After adding Ca, the amount of PM0.2, PM0.2–1 and PM1–2.5 decreased by 36.3%, 33.0% and 42.8%, and the total amount of PM2.5 was reduced by 38%. While the PM2.5–10 production increased from 0.17 mg/g to 0.35 mg/g. The production of PM10 generated by raw coal was 1.24 mg/g and 1.02 mg/g after the raw coal-carrying Ca, a decrease of 17.7%. The effect of adding Ca compounds on the particles is better than that of Mg.
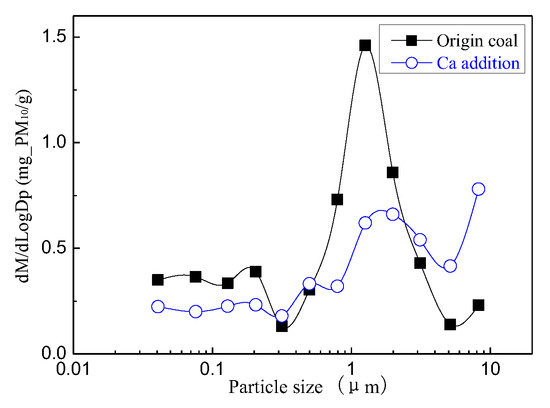
Figure 14.
Particle size distribution (Ca addition).
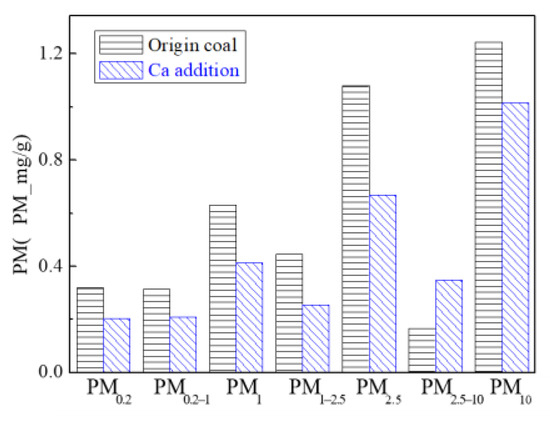
Figure 15.
Particulate matter production (Ca addition).
3.2.2. Effect of Calcium on the Chemical Composition of Particles
The addition of Ca-containing compounds can significantly affect the conversion of minerals during pulverized coal combustion. The main element compositions of the particulate generated by pulverized coal combustion are shown in Figure 16, Figure 17, Figure 18, Figure 19, Figure 20 and Figure 21. The composition analysis of particles with different particles show that the main reason for the decrease in PM1 is the transfer of Ca, Mg, Al, Si and other elements from submicron particles to ultra-micrometer particles. The following figures show several major elements composition changes of the particles generated by original coal and original coal-carrying Ca. It can be seen that the total amount of Na and Mg elements on the submicron particles is reduced due to the decrease in the amount of submicron particulate formation. The changes of distribution on Al and Si in different particles indicate that the Al and Si in the submicron particles were transferred to the ultra-micron particles after carrying the Ca [44]. Especially the content of particulate matter around10 µm increased significantly.

Figure 16.
Mass particle size distribution of Na (Ca addition). (a) The curves of mass particle size distribution. (b) Sectional size distribution.
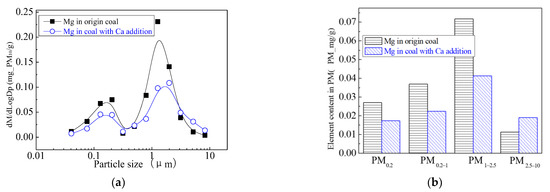
Figure 17.
Mass particle size distribution of Mg (Ca addition). (a) The curves of mass particle size distribution. (b) Sectional size distribution.
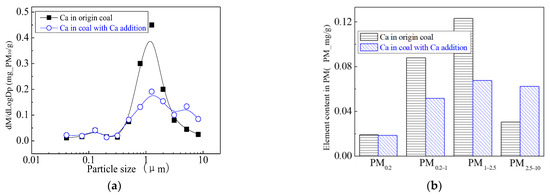
Figure 18.
Mass particle size distribution of Ca (Ca addition). (a) The curves of mass particle size distribution. (b) Sectional size distribution.
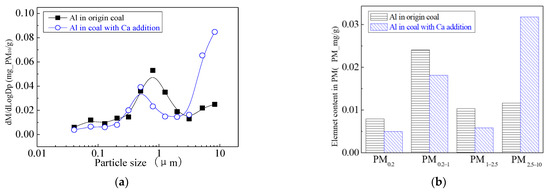
Figure 19.
Mass particle size distribution of Al (Ca addition). (a) The curves of mass particle size distribution. (b) Sectional size distribution.
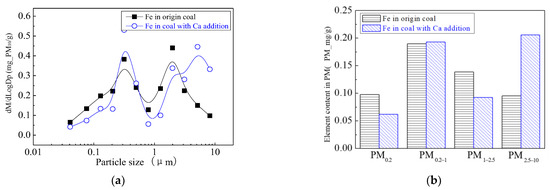
Figure 20.
Mass particle size distribution of Fe (Ca addition). (a) The curves of mass particle size distribution. (b) Sectional size distribution.
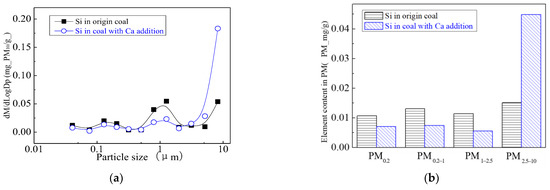
Figure 21.
Mass particle size distribution of Si (Ca addition). (a) The curves of mass particle size distribution. (b) Sectional size distribution.
The morphology and the energy spectrum of the large particles are shown in Figure 22. The SEM results show that the shape of semi-molten irregular particle shows that they are the transition from the solid or incomplete liquid particles. The addition of Ca contributes to the formation of low-temperature eutectic materials, which can bind submicron particles or fine particles together to form coarse-mode particles. The mass percentage of the liquid material is the primary cause for the formation of suitable viscosities, and the submicron particles are bound to the surface of the coarse mode particles, which can capture submicron particles during the combustion process. The addition of the Ca-containing compound acts as a binder and coalesces the generated submicron particles together to form ultra-micron particles. The main points of the spectrum scanning are located near the bonding sites of different particles, and the morphology is semi-melting irregular. From the three points of the spectrum scanning, it can be seen that the Ca content is the highest at point 1 where the Mg content is 76%, the content of Mg and Ca are 38% and 30% at point 2, respectively. At point 3, the content of Ca can reach 70%. Mg-Ca-Fe-Al-Si, Mg-Ca-Al-Si and Ca-Al-Si are the main constituents in the Ca-containing particles. These low-temperature eutectics bond small submicron particles together to form ultra-micron particles. Studies have found that coal with more calcium and iron generated less PM1 during combustion. The main reason is that the intrinsic minerals such as calcite (CaCO3) and pyrite (FeS) in the coal in the initial stage of pulverized coal combustion broke down into small particles. The aluminosilicates and fine particles released from the char combustion phase form a low-melting compound by collision bonding and condensed into aluminosilicates containing calcium and iron [45]. In the early stages of combustion, these minerals decompose to CaO and Fe2O3, both of which react with the aluminosilicic acid to form calcium aluminosilicate and iron aluminosilicate or complex compounds containing both [46,47], which reduces the melting point of the aluminosilicate.
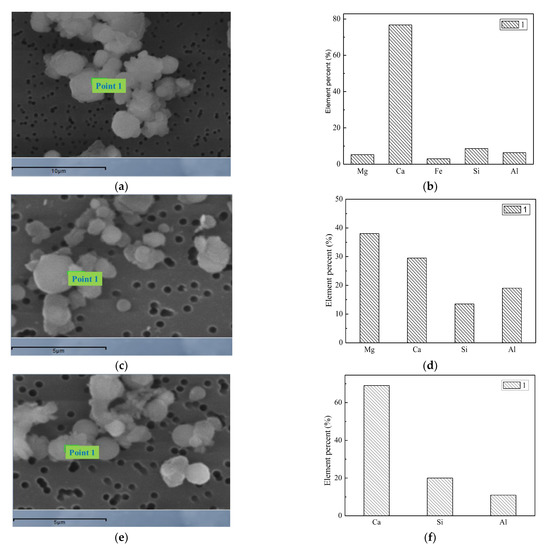
Figure 22.
Morphology and spectra of particles after adding Ca. (a) Spectral scanning position. (b) Elements of scan position. (c) Spectral scanning position. (d) Elements of scan position. (e) Spectral scanning position. (f) Elements of scan position.
CaO is an alkaline-oxide and easy to react with SiO2 to form a kind of silicate with a low melting point [48]. In addition, since the CaO monomer has a high melting point of 2590 °C, CaO cannot reduce the ash melting point when the CaO content is increased to a certain extent (40% to 50% or more), but will increase the melting point of ash instead. The results show that the mass ratio of SiO2/Al2O3 in coal ash is above 3.0 for most coal species in China, and the melting point of ash is the lowest when the mass fraction of CaO in coal ash is 20~25%, the mass fraction of SiO2/Al2O3 in coal ash is below 3.0, the mass fraction of CaO in coal ash is 30%~35%, the ash has the lowest melting point. When the mass fraction of CaO exceeds 30%~35%, CaO not only can reduce the melting point of ash, but play the role of increasing the ash melting point [49,50].
After carrying calcium acetate, calcium acetate changes in the coal combustion process [51]; minerals containing calcium may react with 10 µm or less Al-Si compound to form a molten Ca-Al-Si, then unite larger than 10 µm aluminosilicate salt. The internal mineral releases Al-Si, which carries minerals that release Ca, these elements collide under gaseous conditions to form widely dispersed melting droplets which adhere to large Al-Si surfaces or to each other to form ultra- particles or particles larger than 10 µm. Step 1. Adding minerals (calcium acetate) in the early stage of coal heat, when the temperature is 160 °C it began to decompose to CaCO3, and CaCO3 will decompose at about 825 °C to generate CaO. Step 2. Burned coke releases Al-Si (eg, mullite, quartz). Step 3. CaO reacts with the released Al-Si to form Ca-Al-Si, which either condenses into fine particles or is converted to PM1+. Step 4. Most of the molten Ca-Al-Si aggregates together or agglomerate on the surfaces of unreacted Al-Si, CaO, or enhance their cohesive ability (unreacted Al-Si, CaO) to agglomerate into ultra-micron particles or particles bigger than 10 µm. The main chemical reaction is as following:
(CH3COO)2Ca → CH3COCH3 + CaCO3
CaCO3 → CaO + CO2
3Al2O3·2SiO2 + CaO → CaO·Al2O3·2SiO2
CaO·Al2O3·2SiO2 + CaO → 2CaO·Al2O3·2SiO2
CaO·SiO2 + SiO2 → 3CaO·2SiO2
SiO2 + CaO → CaO·SiO2
By adding calcium in the coal minerals, the content of the calcium improves the proportion of liquid components, improving the surface adhesion of mineral elements Al, Si, Fe and others on the big particles during the combustion process, which makes submicron particles transform to PM1+, and aggregated to form large particles of Ca-Fe-Al-Si and Ca-Al-Si components by collision. By changing the composition of ash, the ash melting point can be reduced, which makes PM2.5 accumulate into bigger particles, increasing the production of PM2.5+ and reducing PM2.5 emissions [52].
3.3. Effect of Iron on the Formation of Fine Particles
3.3.1. Effect of Iron on the Particle Morphology and Particle Size Distribution
Figure 2 and Figure 23 show the morphology of particles by the combustion of raw coal and raw coal-carrying Fe. Compared with the raw coal combustion, the particles produced by combustion of Fe-contained compounds showed more accumulation, and a part of the submicron particles adhered to the surface of the coarse-mode particles. The SEM results show that the spherical particles indicate that they are formed by droplets in the combustion process; semi-molten irregular particles show that they are from the transition of solid or incomplete liquid particles.
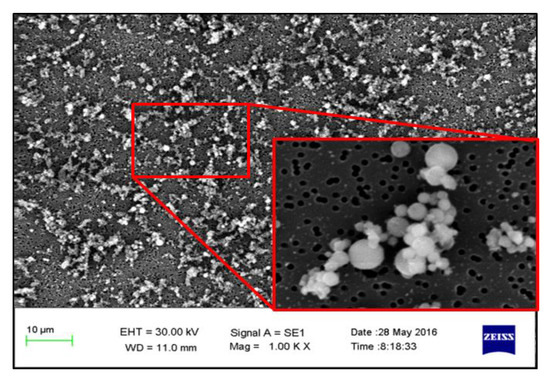
Figure 23.
Morphology of particles after carrying Fe.
Figure 24 shows the particle size distribution of the particles by combustion of raw coal and raw coal-carrying Fe. It can be seen that, after adding Fe element, the mass particle size of the generated particle changes. Raw minerals (including particle size and chemical composition) affect the effect of adding Fe minerals to some extent [53]. As shown in Figure 25, by comparing the effects of raw coal and raw coal adding Fe on the formation of PM0.2, PM0.2–1 and PM1–2.5; the production of PM0.2, PM0.2–1 and PM1–2.5 were reduced from 0.32 mg/g, 0.31 mg/g, 0.45 mg/g to 0.27 mg/g, 0.26 mg/g and 0.31 mg/g. After adding Fe, the production of PM0.2, PM0.2–1 and PM1–2.5 decreased by 15.6%, 16.2% and 31.1%, respectively, and the production of PM2.5 was reduced by 22.4%. While the production of PM2.5–10 increased from 0.17 mg/g to 0.34 mg/g, the production of PM10 was reduced from 1.24 m/g to 1.18 mg/g. It is clear that a significant fraction of the submicron particles produced during coal combustion are converted into ultra-micron particles after the addition of Fe minerals.
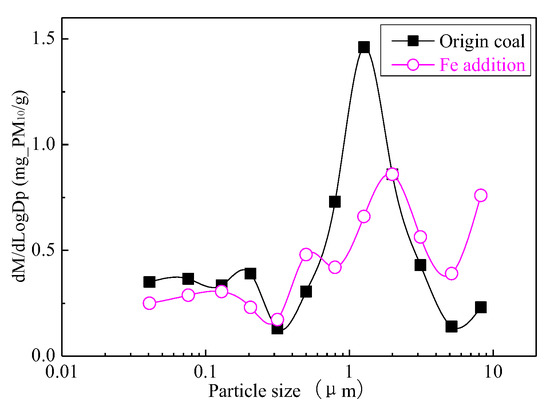
Figure 24.
Particle size distribution (Fe addition).
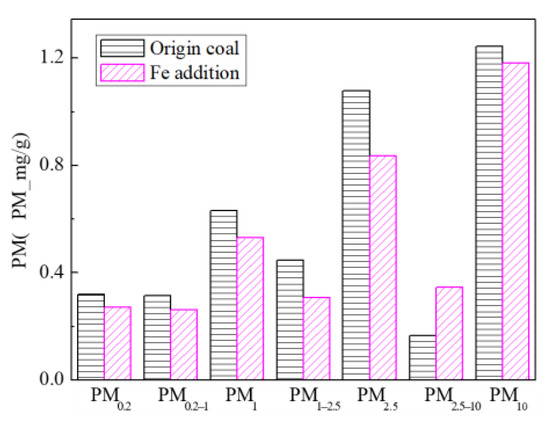
Figure 25.
Particulate matter production (Fe addition).
3.3.2. Effect of Iron on the Chemical Composition of Particles
The addition of Fe-containing compounds can significantly affect the conversion of minerals during pulverized coal combustion. The main elemental compositions of pulverized coal combustion after carrying Fe are shown in Figure 26, Figure 27, Figure 28, Figure 29, Figure 30 and Figure 31. The results show that the main reason for the decrease in PM1 is the transfer of Ca, Mg, Al and Si from submicron particles to ultra-micrometer particles. The following figure is the changes of several major elements composition in the particulate matter generated by the original coal and the original coal carrying Ca element. It can be seen that the total amount of Na and Mg elements on the submicron particles is reduced due to the decrease in the amount of submicron particulate formation. Distribution changes of Al and Si in different particles indicate that the Al and Si in the submicron particles are transferred to the ultra-micron particles after the addition of Fe; especially the particles in the vicinity of 10 µm have remarkably increased. The composition of particle generated by raw coal-carrying Fe is similar to that carrying Ca and Mg.
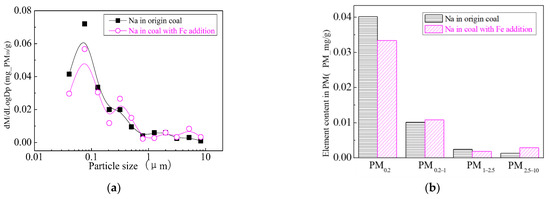
Figure 26.
Mass particle size distribution of Na (Fe addition). (a) The curves of mass particle size distribution. (b) Sectional size distribution.
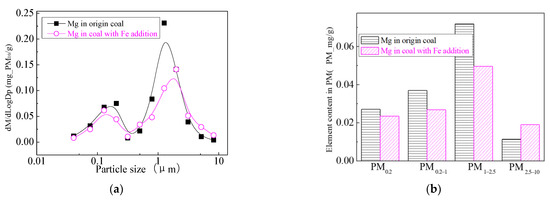
Figure 27.
Mass particle size distribution of Mg (Fe addition). (a) The curves of mass particle size distribution. (b) Sectional size distribution.
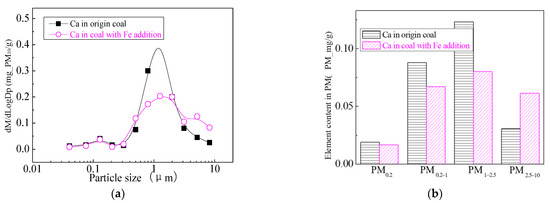
Figure 28.
Mass particle size distribution of Ca (Fe addition). (a) The curves of mass particle size distribution. (b) Sectional size distribution.
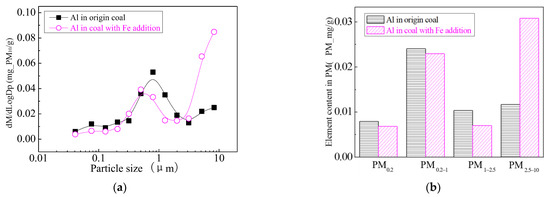
Figure 29.
Mass particle size distribution of Al (Fe addition). (a) The curves of mass particle size distribution. (b) Sectional size distribution.
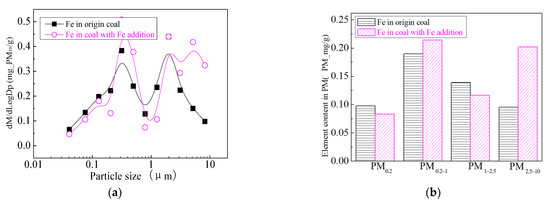
Figure 30.
Mass particle size distribution of Fe (Fe addition). (a) The curves of mass particle size distribution. (b) Sectional size distribution.
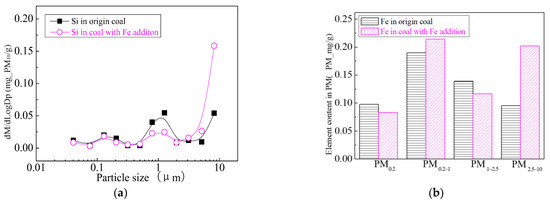
Figure 31.
Mass particle size distribution of Si (Fe addition). (a) The curves of mass particle size distribution. (b) Sectional size distribution.
The main reason for the decrease in PM1 generated by iron-added coal is that in the initial stage of pulverized coal combustion, the intrinsic minerals in coal are decomposed into fine Fe2O3 particles, the aluminosilicates released from the char combustion stage, Fe2O3 fine particles and aluminosilicates undergo a series of chemical reactions to form iron-containing minerals which can react with Al-Si compounds below 10 µm to form molten Fe-Al-Si, which aggregates into more than 10 µm aluminosilicates salt. The main processes are as follows: Step one. The carrying compound decomposes to produce Fe2O3; Step two. The burning coke releases fine particles such as Al-Si; Step three. Fe2O3 reacts with the released Al-Si to form Fe-Al-Si which either condenses into fine particles or is converted into PM1+; Step four. Most of the molten Fe-Al-Si aggregates together or agglomerates on the surface of unreacted Al-Si, Fe2O3, or improves their cohesive ability (unreacted Al-Si, Fe2O3) to agglomerate to the particle more than 10 µm. By changing the content of the ash and reducing the melting point of the ash, PM2.5 accumulated into bigger particles, increasing the production of PM2.5+, which finally reduces the emission of PM2.5.
Figure 32 is a diagram showing the morphology and the energy spectrum of particles formed after carrying Fe. At the two points of the first spectrum, the content of Fe is 11% and 22%, respectively. The content of Fe in the second spectrum is 27% and 47%, respectively. The main components compositions of Fe-containing particles are Fe-Al-Si, Fe-Ca-Al-Si and so on. The flux effect of Fe2O3 is largely affected by the atmosphere because Fe has different valence states in different atmospheres which have different effects on the silicate. The main reason is that Fe2+ is connected with an oxygen atom through octahedral structure, and Fe3+ is connected with oxygen through the tetrahedral structure. As a result of the charge balance, the tetrahedral structure of Fe3+ is easy to connect with four-sided structure of the SiO2, which makes the Si-O bond brake, and part of the three-dimensional network structure decompose to form a new three-dimensional network structure, and the viscosity of the silicate at high temperatures decreased on the macro performance. The octahedral structure of Fe2+ is more likely to make the original three-dimensional network structure loose and disintegrate which leads to a significant reduction in viscosity. Due to the role of charge balance, Fe ions can participate in the formation of complex chelates. Fe3+ cations and O-containing anions (FeO2− and ) can form complex anions, and this complex structure can increase the viscosity of coal ash.
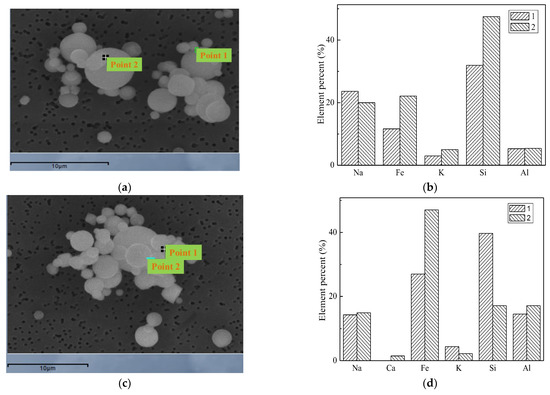
Figure 32.
Morphology and spectra of particles after adding Fe. (a) The curves of mass particle size distribution. (b) Sectional size distribution. (c) Spectral scanning position. (d) Elements of scan position.
Fe2O3 in weak reduction or oxidation atmosphere systems can play a role in reducing ash melting point. Especially in the weak reducing atmosphere, Fe2O3 (1560 °C) can exist in the form of FeO (1420 °C), compared with Fe of other valence, it is easier to form low-temperature eutectic compounds with SiO2 and other substances, which have the strongest flux effect. In the reducing atmosphere, when the temperature is 900 °C, hematite (Fe2O3) and siderite (FeCO3) can decompose to FeO when they are heated. When the temperature is higher, 1000~1200 °C, FeO and other minerals began to react, such as quartz (SiO2), mullite (3Al2O3·2SiO2, when the temperature is 1810 °C it decomposes to Al2O3, SiO2 of liquid phase) and anorthite (The melting point of CaO·Al2O3·2SiO2 is 1553 °C). After the reaction, iron olivine (2FeO·SiO2, The melting point is 1065 °C), iron spinel (FeO·Al2O3) and so on with a lower melting point is produced. It is found that anorthite (CaO·Al2O3·2SiO2) began to partially decompose at 1000~1100 °C and react with FeO to produce 2FeO·SiO2 (melting point 1065 °C) with a low melting point. Studies have shown that iron-based minerals, especially those containing Al, Si, Fe minerals generally have a relatively low melting point. The flux effect of FeO is close to that of CaO. When the content of FeO exceeds 10%, the fluxing effect is better than that of CaO. Zhang [54] used frontier orbital theory from the view of quantum chemistry to show that the melting point of iron olivine (2FeO·SiO2) is 1065 °C lower than that of mullite (3Al2O3·2SiO2) and kaolinite (Al2O3·2SiO2·2H2O).
After the addition of the Fe compound, the following main reaction can reduce the formation of fine particles:
Fe(NO3)3 → Fe2O3 + 12NO2 + 3O2
Fe2O3 → FeO + O2
SiO2 + FeO → FeO SiO2
FeO + Al2O3 → Fe2Al2O4
FeO·SiO2 + FeO → 2FeO·SiO2
3Al2O3·2SiO2 + FeO → 2FeO·SiO2 + FeO·Al2O3
CaO·Al2O3·2SiO2 + FeO → 2FeO·SiO2 + FeO·Al2O3 + 3FeO·Al2O3·3SiO2
From these chemical reactions we can see that after the addition of Fe, the generated sub-micron particles aggregated and bonded to form big particles, thereby reducing the amount of submicron particulate matter.
3.4. Comparison of the Effect on Adding Several Inorganic Compounds
The addition of three minerals had some similarity to the control mechanism of the formation of submicron particles. Aiming to the control of PM1, the amount of produced PM1 was 0.63 mg/g coal. After adding Mg, Ca and Fe, the amount of PM1 was 0.51 mg/g coal, 0.41 mg/g coal and 0.53 mg/g coal, respectively. The amount of PM1 was reduced by 19%, 35% and 16%, respectively, when the raw coal was loaded with Mg, Ca and Fe. The effect of the three mineral elements in the control of PM1 is Ca > Mg > Fe. Aiming to the control of PM2.5, the amount of PM1 was reduced by 19%, 35% and 16%, respectively, when the raw coal was loaded with Mg, Ca and Fe. The effect of the three mineral elements in the control of PM2.5 is Ca > Fe > Mg, this is mainly due to Fe in the control of PM1–2.5 is slightly better than the effect of Mg. After the addition of Mg, the amount of PM10 was almost unchanged, and the amount of PM10 decreased 17.7% and 5% after the addition of Ca and Fe, respectively, compared with the raw coal. These three kinds of minerals can make coal-generated PM1 to some extent in the combustion process by aggregating and bonding ways to form bigger particles.
The amount of PM1 generated by coal adding the mineral element is reduced, the main reason is that in the initial stage of pulverized coal combustion, the intrinsic minerals (carrying compounds containing Mg, Ca, Fe) in coal are decomposed into fine MgO, CaO and Fe2O3 particles. The aluminosilicates, fine MgO, CaO and Fe2O3 particles released from the coal combustion stage underwent a series of chemical reactions to form the corresponding aluminosilicates or complex materials containing the above three compounds, collide and bond to form a low melting point material, aggregate into aluminosilicate containing Mg, Ca and Fe.
The added minerals can react with the fine particles to form molten ash particles which can agglomerate into bigger aluminosilicates. The whole process is as follows: Step one. After the loading of mineral elements, the coal decompose combustion to release fine particles of MgO, CaO and Fe2O3 during combustion process; these substances collide under gaseous conditions to form the widely distribution of molten droplets. Step two. The burning coke releases fine particles containing Al-Si and so on. Step three. Mg-Ca-Al-Si, Ca-Al-Si and Fe-Al-Si in the molten state are formed by the reaction of MgO, CaO and Fe2O3 with the released fine particles of Al-Si, which either agglomerate into fine particles or convert to PM1+.Step four. Most of the molten Mg-Ca-Al-Si, Ca-Al-Si and Fe-Al-Si aggregate together or aggregate on the surface of the unreacted Al-Si and oxide fine particles or improve their cohesive ability to make them condense into bigger particles. Therefore, by adding minerals to change the ash composition, reducing the ash melting point makes the sub-micron particles accumulate into larger particles, increasing the amount of ultra-microns and effectively reducing sub-micron particulate matter emissions.
These three mineral elements, Mg, Ca and Fe, can reduce the formation of submicron particles, mainly due to the decrease in the ash melting point [55] and contribute to the formation of low-temperature eutectic material which can bond the sub-micron particles or fine particles together to form coarse mode particulates. Scholars usually describe the composition of ash as 11 kinds of oxides: SiO2, Al2O3, Fe2O3, CaO, MgO, TiO2, Na2O, K2O, SO3, MnO2 and P2O5. In the study of the effect of ash composition on the melting point, the former several oxides are generally considered. These oxides are generally divided into two categories, one can increase the ash melting point of the acidic oxides, including SiO2, Al2O3, TiO2, etc., whereas the other can reduce the ash melting point of alkaline oxides, including Fe2O3, CaO, MgO, Na2O, K2O and so on.
It was proposed that the behavior of acidic and alkaline components is mainly affected by the chemical structure of ions [56]. The concept of “ion potential” is proposed. The ion potential is the ratio of ion valence to ionic radius. The ion potential of Mg2+, Fe2+, Ca2+, Na+ and K+ are 3.0, 2.7, 2.0, 1.1 and 0.75, respectively. The ion potentials of Si4+, Al3+, Ti4+and Fe3+ are 9.5, 5.9, 5.9 and 4.7, respectively. The ionic potential of the acidic oxide is high and the ionic potential of the basic oxide is low. Cations with high ionic potential are easily bound to O and form complexes or complex ions, and acidic components form a polymer in the ash. Alkaline components can prevent the formation of polymer, which play a role in reducing ash melting point. Ion potential of Na+, K+, Ca2+, Mg2+ are the lowest, which can destroy the formation of polymer, which can help the role of melting. Some studies have shown that the total alkali content and ash fusion temperature have a good correlation (r = 0.84).When the content of Fe2O3 in coal ash is less than 20%, the average melting point of ash decreases by 18 °C for every 1% increase in Fe2O3 [56]. From the point of ionic potential, the ion potential of Fe3+ is 4.7 and the ion potential of Fe2+ is 2.7; Fe2+ is more effective than Fe3+ in reducing ash fusion temperature.
4. Conclusions
The production of PM1 is mainly affected by the evaporation of mineral elements in the coal combustion process, which reduces the evaporation of the mineral elements or the generated PM1, aggregating to form PM1–10 or particles bigger than 10 µm which can reduce the emission of PM1.
- (1)
- The amount of PM0.2, PM0.2–1 and PM1–2.5 produced by the raw coal-carrying Mg are reduced by 36.7%, 17.4% and 24.6%, respectively, and the amount of PM2.5 is reduced by 21.6%. The amount of PM10 is almost unchanged. Adding Mg can effectively increase the viscosity of submicron particles, making it easier to aggregate and bond together to form ultra-micron particles.
- (2)
- The amount of PM0.2, PM0.2–1 and PM1–2.5 produced by the raw coal-carrying Ca are reduced by 36.3%, 33.0% and 42.8%, respectively, and the amount of PM2.5 is reduced by 38%. The production of PM10 is reduced by 17.7%. The effect of adding Ca compounds on the particles is better than that of Mg.
- (3)
- The amount of PM0.2, PM0.2–1 and PM1–2.5 produced by the raw coal-carrying Fe are reduced by 15.6%, 16.2% and 31.1%, respectively, and the amount of PM2.5 is reduced by 22.4%. While the production of PM2.5–10 increased from 0.17 mg/g to 0.34 mg/g, the production of PM10 is reduced by 5%. It is clear that a significant fraction of the submicron particles produced during the combustion of the raw coal are transformed into ultra-micron particles after the addition of Fe minerals.
- (4)
- After comparing the particulate matter produced by raw coal after carrying Mg, Ca and Fe, it can be found that the addition of these three mineral elements can effectively reduce the ash melting point, so that part of the sub-microns generated during the process of coal combustion can be aggregated, bonded or adhered to other particles to form ultra-micron particles.
- (5)
- In the process of coal combustion, some submicron particles form submicron particles, which are easy to be removed by dust removal equipment, which is conducive to simplifying the control process of coal-fired particles and reducing the cost of particle control. At the same time, compared with many particle removal technologies, the cost of mineral-element-modified coal is lower, the dedusting equipment is simpler and the dedusting efficiency is higher, which has a broader application prospect.
Author Contributions
Methodology, L.D.; Formal analysis, H.D. and Q.D.; Data curation, J.W.; Writing—original draft, S.W.; Writing—review & editing, Y.Z. and J.G. All authors have read and agreed to the published version of the manuscript.
Funding
This work is supported by the National Natural Science Foundation of China (52006047) and the Fundamental Research Funds for the Central Universities.
Data Availability Statement
Date openly available in a public repository.
Conflicts of Interest
The authors declare no conflict of interest.
References
- Zhang, H.; Sun, W.; Li, W.; Wang, Y. Physical and chemical characterization of fugitive particulate matter emissions of the iron and steel industry. Atmos. Pollut. Res. 2022, 13, 101272. [Google Scholar] [CrossRef]
- Yao, Q.; Li, S.; Xu, H.; Zhuo, J.; Song, Q. Studies on formation and control of combustion particulate matter in China: A review. Energy 2010, 35, 4480–4493. [Google Scholar] [CrossRef]
- Yu, D.; Xu, M.; Yi, F.; Huang, J.; Li, G. A review of particle formation mechanisms during coal combustion. Coal Convers. 2004, 27, 7–12. [Google Scholar]
- Yue, M.; Gu, X.; Zou, H.; Zhu, R.; Su, W. Killer of healthr polycyclic aromatic hydrocarbons. J. Cap. Norm. Univ. (Nat. Sci. Ed.) 2003, 24, 40–44. [Google Scholar]
- Meij, R. Trace element behavior in coal fired power plants. Fuel Process. Technol. 1994, 39, 199–217. [Google Scholar] [CrossRef]
- Yi, H.; Guo, X.; Hao, J.; Duan, L.; Li, X. Characteristics of inhalable particulate matter concentration and size distri bution from power plants in China. J. Air Waste Manag. Assoc. 2006, 56, 1243–1251. [Google Scholar] [CrossRef]
- Xu, M.; Yan, R.; Zheng, C.; Qiao, Y.; Han, J.; Sheng, C. Status of trace element emission in a coal combustion process: A review. Fuel Process. Technol. 2004, 85, 215–237. [Google Scholar] [CrossRef]
- Lu, B.; Kong, S.; Han, B.; Li, Z.; Bai, Z. Source profile of TSP and PM10 from coal-fired boilers. J. China Coal Soc. 2011, 36, 1928–1933. [Google Scholar]
- Wu, Y.; Xu, Z.; Liu, S.; Tang, M.; Lu, S. Emission characteristics of PM2.5 and components of condensable particulate matter from coal-fired industrial plants. Sci. Total Environ. 2021, 796, 148782. [Google Scholar] [CrossRef]
- Rönkkö, T.J.; Hirvonen, M.-R.; Happo, M.S.; Leskinen, A.; Koponen, H.; Mikkonen, S.; Bauer, S.; Ihantola, T.; Hakkarainen, H.; Miettinen, M.; et al. Air quality intervention during the Nanjing youth olympic games altered PM sources, chemical composition, and toxicological responses. Environ. Res. 2020, 185, 109360. [Google Scholar] [CrossRef]
- Xu, M.; Yu, D.; Yao, H.; Liu, X.; Qiao, Y. Coal combustion-generated aerosols: Formation and properties. Proc. Combust. Inst. 2011, 33, 1681–1697. [Google Scholar] [CrossRef]
- Buhre, B.; Elliott, L.; Sheng, C.; Gupta, R.; Wall, T. Oxy-fuel combustion technology for coal-fired power generation. Prog. Energy Combust. Sci. 2005, 31, 283–307. [Google Scholar] [CrossRef]
- Buhre, B.; Hinkley, J.; Gupta, R.; Nelson, P.; Wall, T. Fine ash formation during combustion of pulverised coal–coal property impacts. Fuel 2006, 85, 185–193. [Google Scholar] [CrossRef]
- Qiu, X.; Duan, L.; Duan, Y.; Li, B.; Lu, D.; Zhao, C. Ash deposition during pressurized oxy-fuel combustion of Zhundong coal in a lab-scale fluidized bed. Fuel Process. Technol. 2020, 204, 106411. [Google Scholar] [CrossRef]
- Li, G. Expermental Study on Formation, Evilution and Deposition Charctreistics of Pulverized Coal Combustion; Tsinghua University: Beijing, China, 2014. [Google Scholar]
- Galgani, L.; Tsapakis, M.; Pitta, P.; Tsiola, A.; Tzempelikou, E.; Kalantzi, I.; Esposito, C.; Loiselle, A.; Tsotskou, A.; Zivanovic, S.; et al. Microplastics increase the marine production of particulate forms of organic matter. Environ. Res. Lett. 2019, 14, 124085. [Google Scholar] [CrossRef]
- Zhan, Z.; Chiodo, A.; Zhou, M.; Davis, K.; Wang, D.; Beutler, J.; Cremer, M.; Wang, Y.; Wendt, J.O.L. Modeling of the submicron particles formation and initial layer ash deposition during high temperature oxy-coal combustion. Proc. Combust. Inst. 2021, 38, 4013–4022. [Google Scholar] [CrossRef]
- Oleschko, H.; Schimrosczyk, A.; Lippert, H.; Müller, M. Influence of coal composition on the release of Na-, K-, Cl-, and S-species during the combustion of brown coal. Fuel 2007, 86, 2275–2282. [Google Scholar] [CrossRef]
- Thomson, L.L. Abstracts of Papers and Posters Presented at the Sixteenth Annual Education Conference of the National Society of Genetic Counselors (Baltimore, Maryand). J. Genet. Couns. 1997, 6, 433–512. [Google Scholar] [CrossRef]
- Zhang, L.; Ninomiya, Y.; Yamashita, T. Formation of submicron particulate matter (PM 1) during coal combustion and influence of reaction temperature. Fuel 2006, 85, 1446–1457. [Google Scholar] [CrossRef]
- Quann, R.J.; Sarofim, A.F. Vaporization of refractory oxides during pulverized coal combustion. Symp. (Int.) Combust. 1982, 19, 1429–1440. [Google Scholar] [CrossRef]
- Liu, Y.; Guan, Y.; Zhang, Y.; Xiong, Y. Effects of atmosphere on mineral transformation of Zhundong coal during gasification in CO2/H2O conditions. Fuel 2022, 310, 122428. [Google Scholar] [CrossRef]
- Li, M.; Yu, S.; Chen, X.; Li, Z.; Zhang, Y.; Song, Z.; Liu, W.; Li, P.; Zhang, X.; Zhang, M.; et al. Impacts of condensable particulate matter on atmospheric organic aerosols and fine particulate matter (PM2.5) in China. Atmos. Chem. Phys. 2022, 22, 11845–11866. [Google Scholar] [CrossRef]
- Zhang, H.; Wu, S.; Yang, Y.; Cheng, J.; Lun, F.; Wang, Q. Mineral Distribution in Pulverized Blended Zhundong Coal and Its Influence on Ash Deposition Propensity in a Real Modern Boiler Situation. ACS Omega 2020, 5, 4386–4394. [Google Scholar] [CrossRef]
- Feng, D.; Zhao, Y.; Zhang, Y.; Sun, S.; Meng, S.; Guo, Y.; Huang, Y. Effects of K and Ca on reforming of model tar compounds with pyrolysis biochars under H2O or CO2. Chem. Eng. J. 2016, 306, 422–432. [Google Scholar] [CrossRef]
- Mlonka-Mędrala, A.; Dziok, T.; Magdziarz, A.; Nowak, W. Composition and properties of fly ash collected from a multifuel fluidized bed boiler co-firing refuse derived fuel (RDF) and hard coal. Energy 2021, 234, 121229. [Google Scholar] [CrossRef]
- Tositti, L. Physical and Chemical Properties of Airborne Particulate Matter. In Clinical Handbook of Air Pollution-Related Diseases; Capello, F., Gaddi, A.V., Eds.; Springer International Publishing: Cham, Switzerland, 2018; pp. 7–32. [Google Scholar]
- Ruan, R.; An, Q.; Tan, H.; Jia, S.; Wang, X.; Peng, J.; Li, P. Effect of calcined kaolin on PM0.4 formation from combustion of Zhundong lignite. Fuel 2022, 319, 123622. [Google Scholar] [CrossRef]
- Zhao, J.; Zhang, Y.; Wei, X.; Li, T.; Qiao, Y. Chemisorption and physisorption of fine particulate matters on the floating beads during Zhundong coal combustion. Fuel Process. Technol. 2020, 200, 106310. [Google Scholar] [CrossRef]
- Ninomiya, Y.; Wang, Q.; Xu, S.; Teramae, T.; Awaya, I. Evaluation of a Mg-Based Additive for Particulate Matter (PM)2.5 Reduction during Pulverized Coal Combustion. Energy Fuels 2010, 24, 199–204. [Google Scholar]
- Wei, Y.; Wang, Q.; Zhang, L.; Awaya, I.; Ji, M.; Li, H.; Yamada, N.; Sato, A.; Ninomiya, Y. Effect of magnesium additives on PM 2.5 reduction during pulverized coal combustion. Fuel Process. Technol. 2013, 105, 188–194. [Google Scholar] [CrossRef]
- Cao, X.; Zhang, T.-A.; Zhang, W.; Lv, G. Solvent Extraction of Sc(III) by D2EHPA/TBP from the Leaching Solution of Vanadium Slag. Metals 2020, 10, 790. [Google Scholar] [CrossRef]
- Wang, H.; Zhang, X.; Wu, W.; Liaw, P.K.; An, K.; Yu, Q.; Wu, P. On the torsional and coupled torsion-tension/compression behavior of magnesium alloy solid rod: A crystal plasticity evaluation. Int. J. Plast. 2022, 151, 103213. [Google Scholar] [CrossRef]
- Yang, Y.; Lin, X.; Li, S.; Luo, M.; Yin, J.; Wang, Y. Formation factors and emission characteristics of ultrafine particulate matters during Na-rich char gasification. Fuel 2019, 253, 781–791. [Google Scholar] [CrossRef]
- Hu, W.; Wang, Y.; Wang, T.; Ji, Q.; Jia, Q.; Meng, T.; Ma, S.; Zhang, Z.; Li, Y.; Chen, R.; et al. Ambient particulate matter compositions and increased oxidative stress: Exposure-response analysis among high-level exposed population. Environ. Int. 2021, 147, 106341. [Google Scholar] [CrossRef]
- Liu, J.; Banerjee, S.; Oroumiyeh, F.; Shen, J.; del Rosario, I.; Lipsitt, J.; Paulson, S.; Ritz, B.; Su, J.; Weichenthal, S.; et al. Co-kriging with a low-cost sensor network to estimate spatial variation of brake and tire-wear metals and oxidative stress potential in Southern California. Environ. Int. 2022, 168, 107481. [Google Scholar] [CrossRef]
- Ninomiya, Y.; Wang, Q.; Xu, S.; Mizuno, K.; Awaya, I. Effect of Additives on the Reduction of PM2. 5 Emissions during Pulverized Coal Combustion†. Energy Fuels 2009, 23, 3412–3417. [Google Scholar] [CrossRef]
- Zhu, N.Y.; Sun, C.Y.; Li, Y.L.; Qian, L.Y.; Hu, S.Y.; Cai, Y.; Feng, Y.H. Modeling discontinuous dynamic recrystallization containing second phase particles in magnesium alloys utilizing phase field method. Comput. Mater. Sci. 2021, 200, 110858. [Google Scholar] [CrossRef]
- Zeng, K.; Yang, Q.; Zhang, Y.; Mei, Y.; Wang, X.; Yang, H.; Shao, J.; Li, J.; Chen, H. Influence of torrefaction with Mg-based additives on the pyrolysis of cotton stalk. Bioresour. Technol. 2018, 261, 62–69. [Google Scholar] [CrossRef]
- Sezer, N.; Evis, Z.; Kayhan, S.M.; Tahmasebifar, A.; Koç, M. Review of magnesium-based biomaterials and their applications. J. Magnes. Alloy. 2018, 6, 23–43. [Google Scholar] [CrossRef]
- Pi, S.; Zhang, Z.; He, D.; Qin, C.; Ran, J. Investigation of Y2O3/MgO-modified extrusion–spheronized CaO-based pellets for high-temperature CO2 capture. Asia-Pac. J. Chem. Eng. 2019, 14, e2366. [Google Scholar] [CrossRef]
- Seetharaman, S.; Jayalakshmi, S.; Arvind Singh, R.; Gupta, M. The Potential of Magnesium-Based Materials for Engineering and Biomedical Applications. J. Indian Inst. Sci. 2022, 102, 421–437. [Google Scholar] [CrossRef]
- Yang, Y.; Jiang, C.; Guo, X.; Peng, S.; Zhao, J.; Yan, F. Experimental investigation on the permeability and damage characteristics of raw coal under tiered cyclic unloading and loading confining pressure. Powder Technol. 2021, 389, 416–429. [Google Scholar] [CrossRef]
- Pallarés, S.; Gómez, E.T.; Martínez-Poveda, Á.; Jordán, M.M. Distribution Levels of Particulate Matter Fractions (<2.5 µm, 2.5–10 µm and >10 µm) at Seven Primary Schools in a European Ceramic Cluster. Int. J. Environ. Res. Public Health 2021, 18, 4922. [Google Scholar] [PubMed]
- Shin, N.; Velmurugan, K.; Su, C.; Bauer, A.K.; Tsai, C.S.J. Assessment of fine particles released during paper printing and shredding processes. Environ. Sci. Process. Impacts 2019, 21, 1342–1352. [Google Scholar] [CrossRef] [PubMed]
- Torres-Luna, J.A.; Carriazo, J.G. Porous aluminosilicic solids obtained by thermal-acid modification of a commercial kaolinite-type natural clay. Solid State Sci. 2019, 88, 29–35. [Google Scholar] [CrossRef]
- Sun, J.; Guo, Y.; Yang, Y.; Li, W.; Zhou, Y.; Zhang, J.; Liu, W.; Zhao, C. Mode investigation of CO2 sorption enhancement for titanium dioxide-decorated CaO-based pellets. Fuel 2019, 256, 116009. [Google Scholar] [CrossRef]
- Hu, Y.; Lu, H.; Liu, W.; Yang, Y.; Li, H. Incorporation of CaO into inert supports for enhanced CO2 capture: A review. Chem. Eng. J. 2020, 396, 125253. [Google Scholar] [CrossRef]
- Song, W.; Tang, L.; Zhu, X.; Wu, Y.; Rong, Y.; Zhu, Z.; Koyama, S. Fusibility and flow properties of coal ash and slag. Fuel 2009, 88, 297–304. [Google Scholar] [CrossRef]
- Gao, N.; Chen, K.; Quan, C. Development of CaO-based adsorbents loaded on charcoal for CO2 capture at high temperature. Fuel 2020, 260, 116411. [Google Scholar] [CrossRef]
- Zhu, S.; Zhang, M.; Li, Z.; Zhang, Y.; Yang, H.; Sun, J.; Lyu, J. Influence of combustion temperature and coal types on alumina crystal phase formation of high-alumina coal ash. Proc. Combust. Inst. 2019, 37, 2919–2926. [Google Scholar] [CrossRef]
- Wang, Q.; Zhang, L.; Sato, A.; Ninomiya, Y.; Yamashita, T. Interactions among inherent minerals during coal combustion and their impacts on the emission of PM10. 1. Emission of micrometer-sized particles. Energy Fuels 2007, 21, 756–765. [Google Scholar] [CrossRef]
- Pongrac, P.; McNicol, J.W.; Lilly, A.; Thompson, J.A.; Wright, G.; Hillier, S.; White, P.J. Mineral element composition of cabbage as affected by soil type and phosphorus and zinc fertilisation. Plant Soil 2019, 434, 151–165. [Google Scholar] [CrossRef]
- Zhang, Z.; Wu, X.; Zhou, T.; Chen, Y.; Hou, N.; Piao, G.; Kobayashi, N.; Itaya, Y.; Mori, S. The effect of iron-bearing mineral melting behavior on ash deposition during coal combustion. Proc. Combust. Inst. 2011, 33, 2853–2861. [Google Scholar] [CrossRef]
- Guo, F.; Liu, Y.; Wang, Y.; Li, X.; Li, T.; Guo, C. Pyrolysis kinetics and behavior of potassium-impregnated pine wood in TGA and a fixed-bed reactor. Energy Convers. Manag. 2016, 130, 184–191. [Google Scholar] [CrossRef]
- Dai, X.; Bai, J.; Yuan, P.; Du, S.; Li, D.; Wen, X.; Li, W. The application of molecular simulation in ash chemistry of coal. Chin. J. Chem. Eng. 2020, 28, 2723–2732. [Google Scholar] [CrossRef]
Disclaimer/Publisher’s Note: The statements, opinions and data contained in all publications are solely those of the individual author(s) and contributor(s) and not of MDPI and/or the editor(s). MDPI and/or the editor(s) disclaim responsibility for any injury to people or property resulting from any ideas, methods, instructions or products referred to in the content. |
© 2023 by the authors. Licensee MDPI, Basel, Switzerland. This article is an open access article distributed under the terms and conditions of the Creative Commons Attribution (CC BY) license (https://creativecommons.org/licenses/by/4.0/).