Article

Techno-Economic Analysis of Carbon Dioxide Separation for an Innovative Energy Concept towards Low-Emission Glass Melting

by
Sebastian Gärtner
1,2,*,
Thomas Marx-Schubach
3,4,
Matthias Gaderer
2,
Gerhard Schmitz
4 and
Michael Sterner
1
1
Research Center on Energy Transmission and Energy Storage (FENES), Technical University of Applied Sciences (OTH) Regensburg, Seybothstrasse 2, 93053 Regensburg, Germany
2
Chair of Regenerative Energy Systems (RES), Campus Straubing for Biotechnology and Sustainability, Technical University Munich, Schulgasse 16, 94315 Straubing, Germany
3
XRG Simulation GmbH, Harburger Schlossstrasse 6-12, 21079 Hamburg, Germany
4
Institute of Engineering Thermodynamics, Hamburg University of Technology, Denickestrasse 15, 21073 Hamburg, Germany
*
Author to whom correspondence should be addressed.
Energies 2023, 16(5), 2140; https://doi.org/10.3390/en16052140
Submission received: 13 January 2023 / Revised: 8 February 2023 / Accepted: 10 February 2023 / Published: 22 February 2023
(This article belongs to the Special Issue Carbon Dioxide Capture, Utilization and Storage (CCUS))

Abstract

:
The currently still high fossil energy demand is forcing the glass industry to search for innovative approaches for the reduction in CO 2 emissions and the integration of renewable energy sources. In this paper, a novel power-to-methane concept is presented and discussed for this purpose. A special focus is on methods for the required CO 2 capture from typical flue gases in the glass industry, which have hardly been explored to date. To close this research gap, process simulation models are developed to investigate post-combustion CO 2 capture by absorption processes, followed by a techno-economic evaluation. Due to reduced flue gas volume, the designed CO 2 capture plant is found to be much smaller (40 m 3 absorber column volume) than absorption-based CO 2 separation processes for power plants (12,560 m 3 absorber column volume). As there are many options for waste heat utilization in the glass industry, the waste heat required for CO 2 desorption can be generated in a particularly efficient and cost-effective way. The resulting CO 2 separation costs range between 41 and 42 EUR/t CO 2 , depending on waste heat utilization for desorption. These costs are below the values of 50–65 EUR/t CO 2 for comparable industrial applications. Despite these promising economic results, there are still some technical restrictions in terms of solvent degradation due to the high oxygen content in flue gas compositions. The results of this study point towards parametric studies for approaching these issues, such as the use of secondary and tertiary amines as solvents, or the optimization of operating conditions such as stripper pressure for further cost reductions potential.

1. Introduction

Commercial glass production is a very energy-intensive industrial process. Converting raw materials, such as silica sand, sodium carbonate, lime, dolomite, etc., into molten glass requires high process temperatures of up to 1600 °C. This melting process is the central phase of glass production and accounts for 50–80% of total energy demand in overall glass production. The dominating source for achieving the required process temperatures has been the combustion of fossil fuels such as natural gas (NG) and crude oil for a long time [1].
Due to the dominance of fossil fuels, glass production is currently still associated with high carbon dioxide (CO 2 ) emissions. The container and flat glass industry can be considered the dominating glass-producing sector and currently emit over 60 million tons of CO2-emissions a year. This is more than the annual emissions of Portugal. The glass industry in the EU, which is the world’s largest producer [2], emits more than 20 million tons of CO2-emissions a year, with an energy demand of more than 350 PJ. Approximately 75% of these emissions can be located in combustion processes, while the remaining 25% are contributed by the dissociation of carbonate raw materials [3]. The level of glass manufacturing-related CO 2 emissions in Germany has stagnated at a constant level of approximately 4 mio. t CO 2 -eq. per year since 2007 [4]. The CO2 emission budget from 2020 to 2050 of the entire German glass industry is 17.7 Mt CO2-eq. for a strict 1.5 °C climate target and 112.0 Mt CO2-eq. for a 2 °C climate target [5]. Due to the current high CO2 emissions of the global glass production, as well as these severely limited remaining emission budgets, fast and effective measures to reduce emissions in the glass industry are of vital importance.
Of course, there are efforts towards greater sustainability and climate protection in the glass industry. Accordingly, there are many research approaches and developments for the decarbonization and the integration of renewable energies into the glass-melting process. The most important concepts are all-electric melting and the switch to hydrogen (H 2 ) as combustion fuel instead of NG [6]. However, all of these concepts, despite their promising CO 2 emissions reduction potential, have certain restrictions:
All-electric melting is well established for small-scale glass melting systems, but large-scale applications are still controversial [7]. Recent all-electric melting projects have made some progress and could reach melting capacities of up to 250 t/d. However, the complex melting tank design and extensive heat control strategies of such large scale melting tanks are challenging and result in high investment and operating costs [8]. In addition, a low glass production rate (so called pull rate) flexibility, short melting tank lifetime, high electricity costs, and low operating experience are disadvantages. Besides that, not all glass types are feasible for all electric melting, for example, non-ionic glasses [6].
Recent projects, such as HyGlass [9], HyNet [10], and Kopernikus P2X [11], have investigated hydrogen as a fuel substitution option. Since the combustion of H 2 does not cause any CO 2 emissions, this would significantly reduce the CO 2 footprint of glass melting. However, the total CO 2 emissions of the glass industry are not only caused by fossil fuel combustion but also by carbonate reactions during batch to melt conversion. As a switch to H 2 -combustion will not influence the batch composition of glass manufacturing, further CO 2 emissions will remain. The CO 2 -emission reduction of H 2 -combustion-based melting systems will significantly depend on the means of hydrogen production (green, blue, grey, …H 2 ). To date, only H 2 production based on renewable energies can guarantee a large reduction in CO 2 emissions (green H 2 ). Current scientific debates mainly focus on the climate impact of blue hydrogen. Ref. [12] states that blue hydrogen comes with only 9–12% less CO 2 emissions compared to conventional (i.e., grey) hydrogen. However, according to [13], the climate impact of blue hydrogen significantly depends on the key parameters such as methane emissions during the natural gas supply chain, CO 2 capture rate during production, and the applied global warming metrics. Thus, the authors concluded that blue hydrogen can be competitive to green hydrogen production in terms of climate impacts, if state-of-the-art process technologies and metrics are applied [13].
However, both green and blue H 2 are still very cost-intensive and are therefore not fully economically competitive with established fossil fuels. In addition, H 2 shows a very different combustion behavior, including higher flame temperatures, different flame velocity, faster ignition behavior, and changed heat radiation properties [8]. Some of these effects are compensated by oxyfuel combustion, for example, changes in adiabatic flame temperature, as shown in [8]. Nevertheless, there are still some uncertainties, such as the effects of higher water content in the flue gases in the firing chamber on glass quality, and the melting tank life time.

Scope of This Work

Due the limitations of currently discussed decarbonization options, there is an urgent need for innovative energy concepts which allow the integration of renewable energies, a reduction in CO 2 emissions, and which ideally have no impact on the established melting processes. This work is the first to demonstrate the integration of a power-to-methane (PtM) system into the glass-melting process that meets all of these requirements. Since the PtM concept has been known for a long time as a sector-coupling option in energy systems [14,15], there are a lot of established technical options for most of the process steps. The state of the art of these established options is briefly described, before the remaining open process of CO 2 capture from exhaust gases is discussed in detail. Since CO 2 capture from exhaust gases in the glass industry has not yet been considered in this particular application, this process shows the most extensive research and development demand. Therefore, a technology concept for the integration of amine-based CO 2 capture processes into the already existing flue gas treatment systems of the glass industry is presented, and various possibilities of waste heat utilization are investigated. The main focus of this work was the techno-economic analysis of the CO 2 separation concept, in order to provide a basis for the economic analyses of the entire PtM system in future work.

2. Integration of Power-to-Methane into Oxyfuel Glass Melting

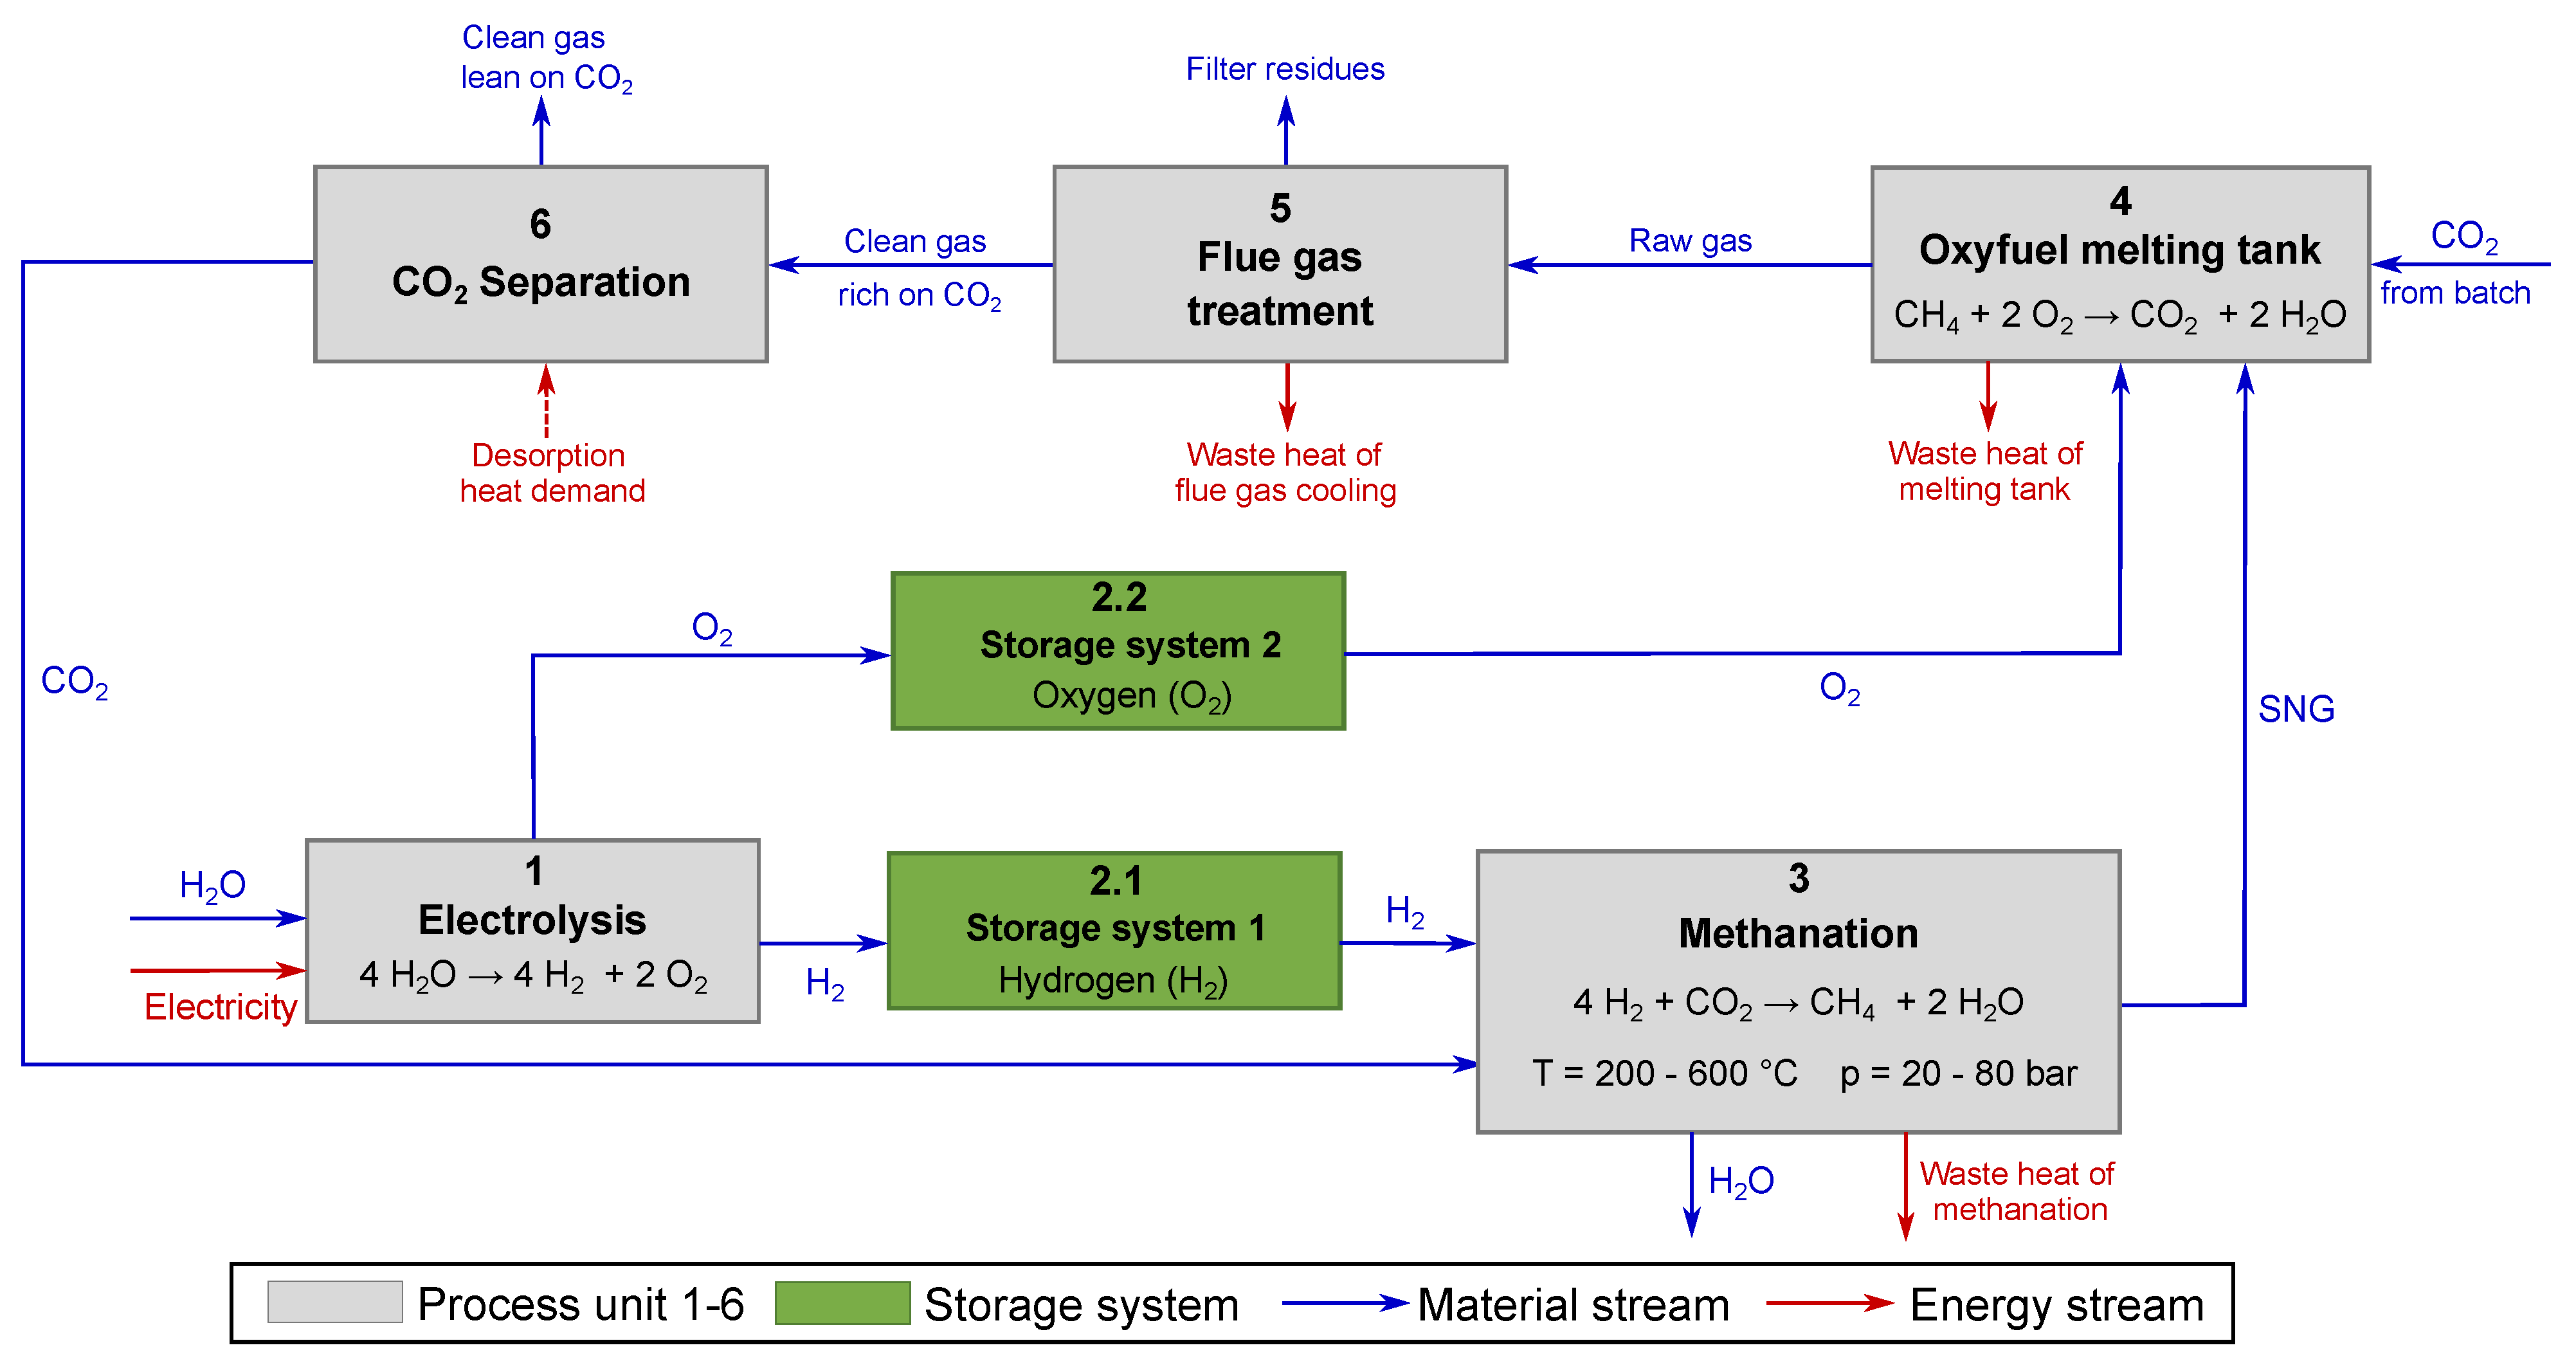
Figure 1 shows a simplified process flow sheet for the integration of PtM into oxyfuel glass melting processes.
In the first process unit (Figure 1, 1 ), water (H 2 O) is separated into (H 2 ) and oxygen (O 2 ) by electrolysis. Both H 2 and O 2 are subsequently stored in compressed gas storage systems (Figure 1, 2.1 and 2.2, details in Section 2.1.2). Besides H 2 , O 2 is also an important product for downstream PtM processes, as it can be used in oxyfuel combustion (see Section 2.1.4).
The intermediate storage of H 2 is necessary due to the technological restrictions on the flexibility of the downstream catalytic methanation process (Figure 1, 3, details on which can be found in Section 2.1.3). In methanation, H 2 reacts with CO 2 in a pressure range of 20–80 bar and a temperature range of 200–600 °C in a catalytic process to form CH 4 and steam. The exact thermodynamic characteristics of methanation reactors may vary for each specific reactor design. As CH 4 is the main component of fossil natural gas compositions, the methanation product stream is also referred to as synthetic natural gas (SNG).
SNG is subsequently used in the oxyfuel glass melting furnace (Figure 1, 4) with O 2 from electrolysis. Thus, the technique of O 2 production in glass manufacturing processes via energy intensive air separation units established to date can be avoided, by utilizing combined effects in the overall process. In oxyfuel glass melting, CO 2 is mainly emitted from combustion (approximately 90%), but also from carbonate reactions during the batch-to-melt conversion (approximately 10%, depending on batch composition) [16]. CO 2 is subsequently emitted from the melting tank by the exhaust gases.
In the flue gas treatment process (Figure 1, 5), pollutants such as NOx and SOx are removed due to regulatory air pollution control laws. Such flue gas cleaning processes were introduced in the 1990s and aim to improve air quality, protect the health of residents, and reduce environmental pollution [6]. The used technologies are scrubbers, electrostatic, and cloth filters, as well absorption-based processes [17]. Since the separation of pollutants such as NOx and SOx is important for air pollution control, but not for the described integration concept for PtM processes, the separation technology and its costs will not be discussed in detail.
However, these processes do not focus on CO 2 -separation from flue gases. Therefore, an additional separation process is included in the concept to remove CO 2 from cleaned flue gases Figure 1, 6. The separated and purified CO 2 is subsequently used as a product stream for the methanation process. Holistically, this concept for integrating PtM into glass melting processes creates an almost closed carbon cycle (depending on CO 2 capture rate), which enables a significant reduction in greenhouse gas emissions. Additionally, the established oxyfuel glass melting processes, associated with highly stable glass quality and output, can still be used. Moreover, a switch to a renewable electricity supply from fluctuating sources such as wind and solar power can be achieved, without losing proven know-how and associated process stability.
However, the multiple process steps such as electrolysis, storage, and methanation lead to losses in the overall efficiency of the system. Thus, access to low-cost energy from renewable sources, as well as high costs for natural gas or CO 2 emission certificates, are crucial for the economic viability of the overall concept. In addition, only a renewable energy supply for electrolysis will lead to a reduction in total CO 2 emissions (see [8]).
There are adequate technical options with a significant degree of technological readiness for the most important PtM process steps electrolysis, H 2 and O 2 storage, and methanation (see Section 2.1). However, CO 2 capture from the flue gases of the glass industry has not been investigated in detail yet. To close this research gap, this work discusses the technical background and options for CO 2 separation processes in the glass industry in detail (see Section 2.2, provides a simulation-based design approach for such plants, (Section 4), and investigates the techno-economic evaluation of CO 2 separation from the flue gases of the glass industry (Section 5.2).This techno-economic analysis focuses explicitly on CO 2 capture, not on the overall concept. The economic evaluation of the overall system that includes electrolysis, storage concepts, and methanation will be investigated in subsequent work.

2.1. State-of-the-Art of Process Components

2.1.1. Electrolysis

Alkaline (AEL), solid oxide (SOEC), and polymer electrolyte membrane electrolysis (PEMEL) can currently be considered the most technically established processes for this purpose [14,18]. AEL has the highest technology readiness level (TRL) 9, but only offers limited part-load capability (30–100%) due to thermal restrictions [18]. SOEC would offer the highest efficiency of all options (up to 95% [19]), but requires an operating temperature level of 600–1000 °C [18]. This temperatures can be provided in an energy-efficient way by integrating the waste heat from catalytic methanation. However, the heating and cooling creates a thermal inertia of SOEC, which impedes rapid adaptation to fluctuations of renewable energy sources. In addition, the TRL of 5–6 is the lowest of all technical options described here. The most promising technology for the application proposed in this work is PEMEL, as it has the widest part-load capability (0–100%) and can thus adapt to the fluctuations of renewable energy sources such as wind power and photovoltaic. While the TRL of AEL is considered to be mature, the TRL of PEM is slightly behind [20]. Nevertheless, PEM electrolyzers are already available in the power categories of multiple MW (e.g., Siemens Silyzer 300 [21]) and the technology can therefore be considered to be of commercial technology status [20]. Development potential is primarily focused on the industrial series production of this electrolysis technology, which is expected to result in a significant reduction in costs [14].

2.1.2. Gas Storage

In general, there are various options for H 2 storage:
  • Physical storage technologies such as compressed gas, liquid, or cryo-compressed H 2 storage [22].
  • Adsorption technologies, relying on carbon-based materials such as multi-walled carbon nanotubes (MWCNTs), metal–organic frameworks (MOFs), or zeolites [22].
  • Adsorption technologies, based on metal hydrates, like iron-oxide pellets [23].
  • Chemical H 2 storage including liquid organic hydrogen carriers (LOHCs) [24],
For the process described in this work, H 2 storage in pressurized gas tanks is currently the most suitable option. It is described as technologically mature and therefore a comparatively cost-effective option, especially in combination with battery storage systems [22]. Nevertheless, the application of innovative H 2 storage technologies within the described PtM process should be focused on in further research. The especially high waste heat potential in glass melting processes offers attractive options for an energy-efficient use of LOHC or iron-oxide based H 2 storage technologies.
Storage system 2 in Figure 1 is necessary to ensure a constant flow of O 2 for a stable combustion process in the melting tank. Various options for O 2 storage have existed at the industrial scale for a long time and can therefore be considered robust [25]. To date, the O 2 required for oxyfuel combustion in the glass industry has primarily been produced by air separation using vacuum pressure swing adsorption (VPSA) processes [25]. This is performed either directly at the industrial site, or by delivery and storage in compressed gas tanks (liquid O 2 ). In both cases, oxygen storage facilities are usually available on site.

2.1.3. Methanation

Currently, thermocatalytic and biological methanation are the main technologies being discussed for use in power-to-gas systems [18,26]. Due to its higher TRL and technical performance, catalytic methanation is mainly used in large-scale PtM plants [14].
However, this methanation process requires constant operating conditions to achieve a high CH 4 content in the synthetic natural gas (SNG). For this purpose, the feed gases CO 2 and H 2 must be supplied in the ideal stoichiometric ratio of 1:4. In addition, pressure and temperature conditions must be constant to avoid damages on the catalysts through hot-spot formation. From a thermodynamic point of view, low temperatures, and high pressure would be ideal for a high conversion rate. However, the exothermic nature of the dominant methanation reactions challenges the operation at the thermodynamic optimum. For many commercially available fixed-bed reactors, an operating temperature of 300 °C and a pressure of 20 bar have proven to be suitable operating conditions. Nevertheless, the operating temperatures of established reactor concepts vary between 200 and 600 °C and a pressures range of 20–80 bar [18,26]. In any case, the effective cooling of the reactor is required. In the PtM system described above, this waste heat could be used for SOEC or CO 2 -desorption (as can be seen in Section 2.2).
In addition to the technical properties mentioned above, the purity of CO 2 is crucial for a stable methanation process. In order to investigate the effects of CO 2 impurities on methanation, experiments investigating the direct methanation of flue gases for different types of power plants were performed. The flue gases investigated were obtained both from lignite-fired power plants with conventional combustion and from pilot plants with oxyfuel combustion. In both cases, the direct methanation of the flue gases led to heavy damage on the catalyst, so that the experiments had to be stopped. However, oxyfuel flue gases could ensure stable methanation after purification and treatment. Within these investigations, mainly SO 2 and halogen compounds (F, Cl, Br, At, TS) have been described as strong-acting catalyst toxicants [27,28].

2.1.4. Oxyfuel Glass Melting Tank

In oxyfuel combustion processes, a fuel such as natural gas is burned in a pure oxygen atmosphere instead of ambient air. Oxyfuel combustion is more energy-efficient because the nitrogen content in the furnace atmosphere is significantly reduced, thus lowering the thermal capacity of the exhaust gases. This also enables improved mass transport in the combustion chamber. In addition, a higher adiabatic flame temperature is achieved [29]. The higher overall efficiency of this combustion technology also enables a reduction in CO 2 emissions compared to the regenerative processes that are primarily used at present. A major limitation of this technology has been the energy-intensive production of oxygen and the associated higher investment costs. Nevertheless, oxyfuel furnaces are established state of the art, especially in the special glass production sector. Due to the much more energy-intensive glasses that are molten for this purpose, the higher efficiency of oxyfuel melting offers an economic advantage [8].

2.1.5. Flue Gas Purification Systems

Currently, mainly fabric filters and electrostatic precipitators are established for flue gas purification in the glass industry. These cleaning systems are primarily aimed for compliance with air pollutant limits set by country-specific regulations. The air pollutants relevant for the glass industry are mostly dust resulting from turbulence in the furnace, carbon monoxide (CO), sulfur and nitrogen oxides (SOx, NOx), as well as hydrochloride and fluoric acid (HCl, HF). While NOx and CO emissions are mainly caused by combustion, SOx-, HCl-, and HF-emissions occur due to glass batch impurities. To remove these air pollutants from the flue gas mixture, sorbents such as lime (calcium hydroxide, Ca(OH) 2 ) are used, which then deposit as so-called filter dust. In order to prevent the filter systems from being damaged by excessively high gas temperatures, a heat exchanger is usually installed upstream to cool the uncleaned flue gases. Fabric filters in particular are much more sensitive to high gas temperatures than electrostatic filters.

2.2. CO2 Separation

Technologies for CO 2 capture from combustion processes can be categorized as pre-combustion, post-combustion processes, and processes that are directly connected to combustion (in this work, further referred to as “in-combustion” processes). Pre-combustion processes primarily involve the separation of CO 2 from fuels such as natural gas or pulverized coal, in order to prevent CO 2 emissions prior to combustion. These are mainly absorption processes with solvents such as rectisol, selexol, or purisol. Such processes are widely established in the petrochemical industry, for example, to avoid the acidification of natural gas and to be able to offer a high-purity product [30].
In-combustion processes such as chemical looping or so-called oxyfuel processes are directly involved in the combustion process. In the chemical looping process, metal oxides are added to the combustion chamber in fluidized bed reactors in order to effect a redox reaction, binding the CO 2 [31]. Oxyfuel processes are closely related to the combustion process described above. When natural gas is burned in pure oxygen, the exhaust gas theoretically consists only of CO 2 and water vapor. The H 2 O can then be condensed by cooling and a highly pure CO 2 stream would remain [30]. However, both processes are unsuitable for the glass industry. Metal oxides in the combustion chamber would also react with the glass batch, thus negatively affecting the glass quality. The separation of CO 2 by cooling is unsuitable, since the exhaust gases in the glass industry also contain evaporation from the molten glass (Section 3). Accordingly, the CO 2 product stream would be contaminated after the condensation of H 2 O.
Post-combustion processes concern the capture of CO 2 from combustion flue gases. Membrane processes as well as the adsorption and absorption processes are discussed for this purpose. Membrane processes provide for the separation of CO 2 from the flue gas stream by means of molecular lattices. However, these membranes are currently not yet sufficiently temperature-stable and scalable for rapid implementation. Adsorption processes are currently mainly used for CO 2 capture from ambient air, known as direct air capture [32]. However, de- and adsorption cycles are still too slow for application in exhaust gas streams and are not available in sufficient capacity [30]. For CO 2 capture from exhaust gases, absorption processes are currently being discussed as the main option [30]. In particular, the use of monoethanolamine (MEA) as an absorbent is widely investigated and can be considered a standard. However, MEA can suffer from degradation, caused by carbamate polymerization, as well as oxidative and thermal degradation. Therefore, a switch to more stable and efficient solvents is widely discussed [33,34].
Nevertheless, CO 2 absorption processes can be considered the most promising technology for the glass industry, since they have been investigated for a long time and have already been tested in several worldwide projects for the separation of CO 2 from flue gases. They were also proposed for applications in other industry sectors, such as the cement industry [35].
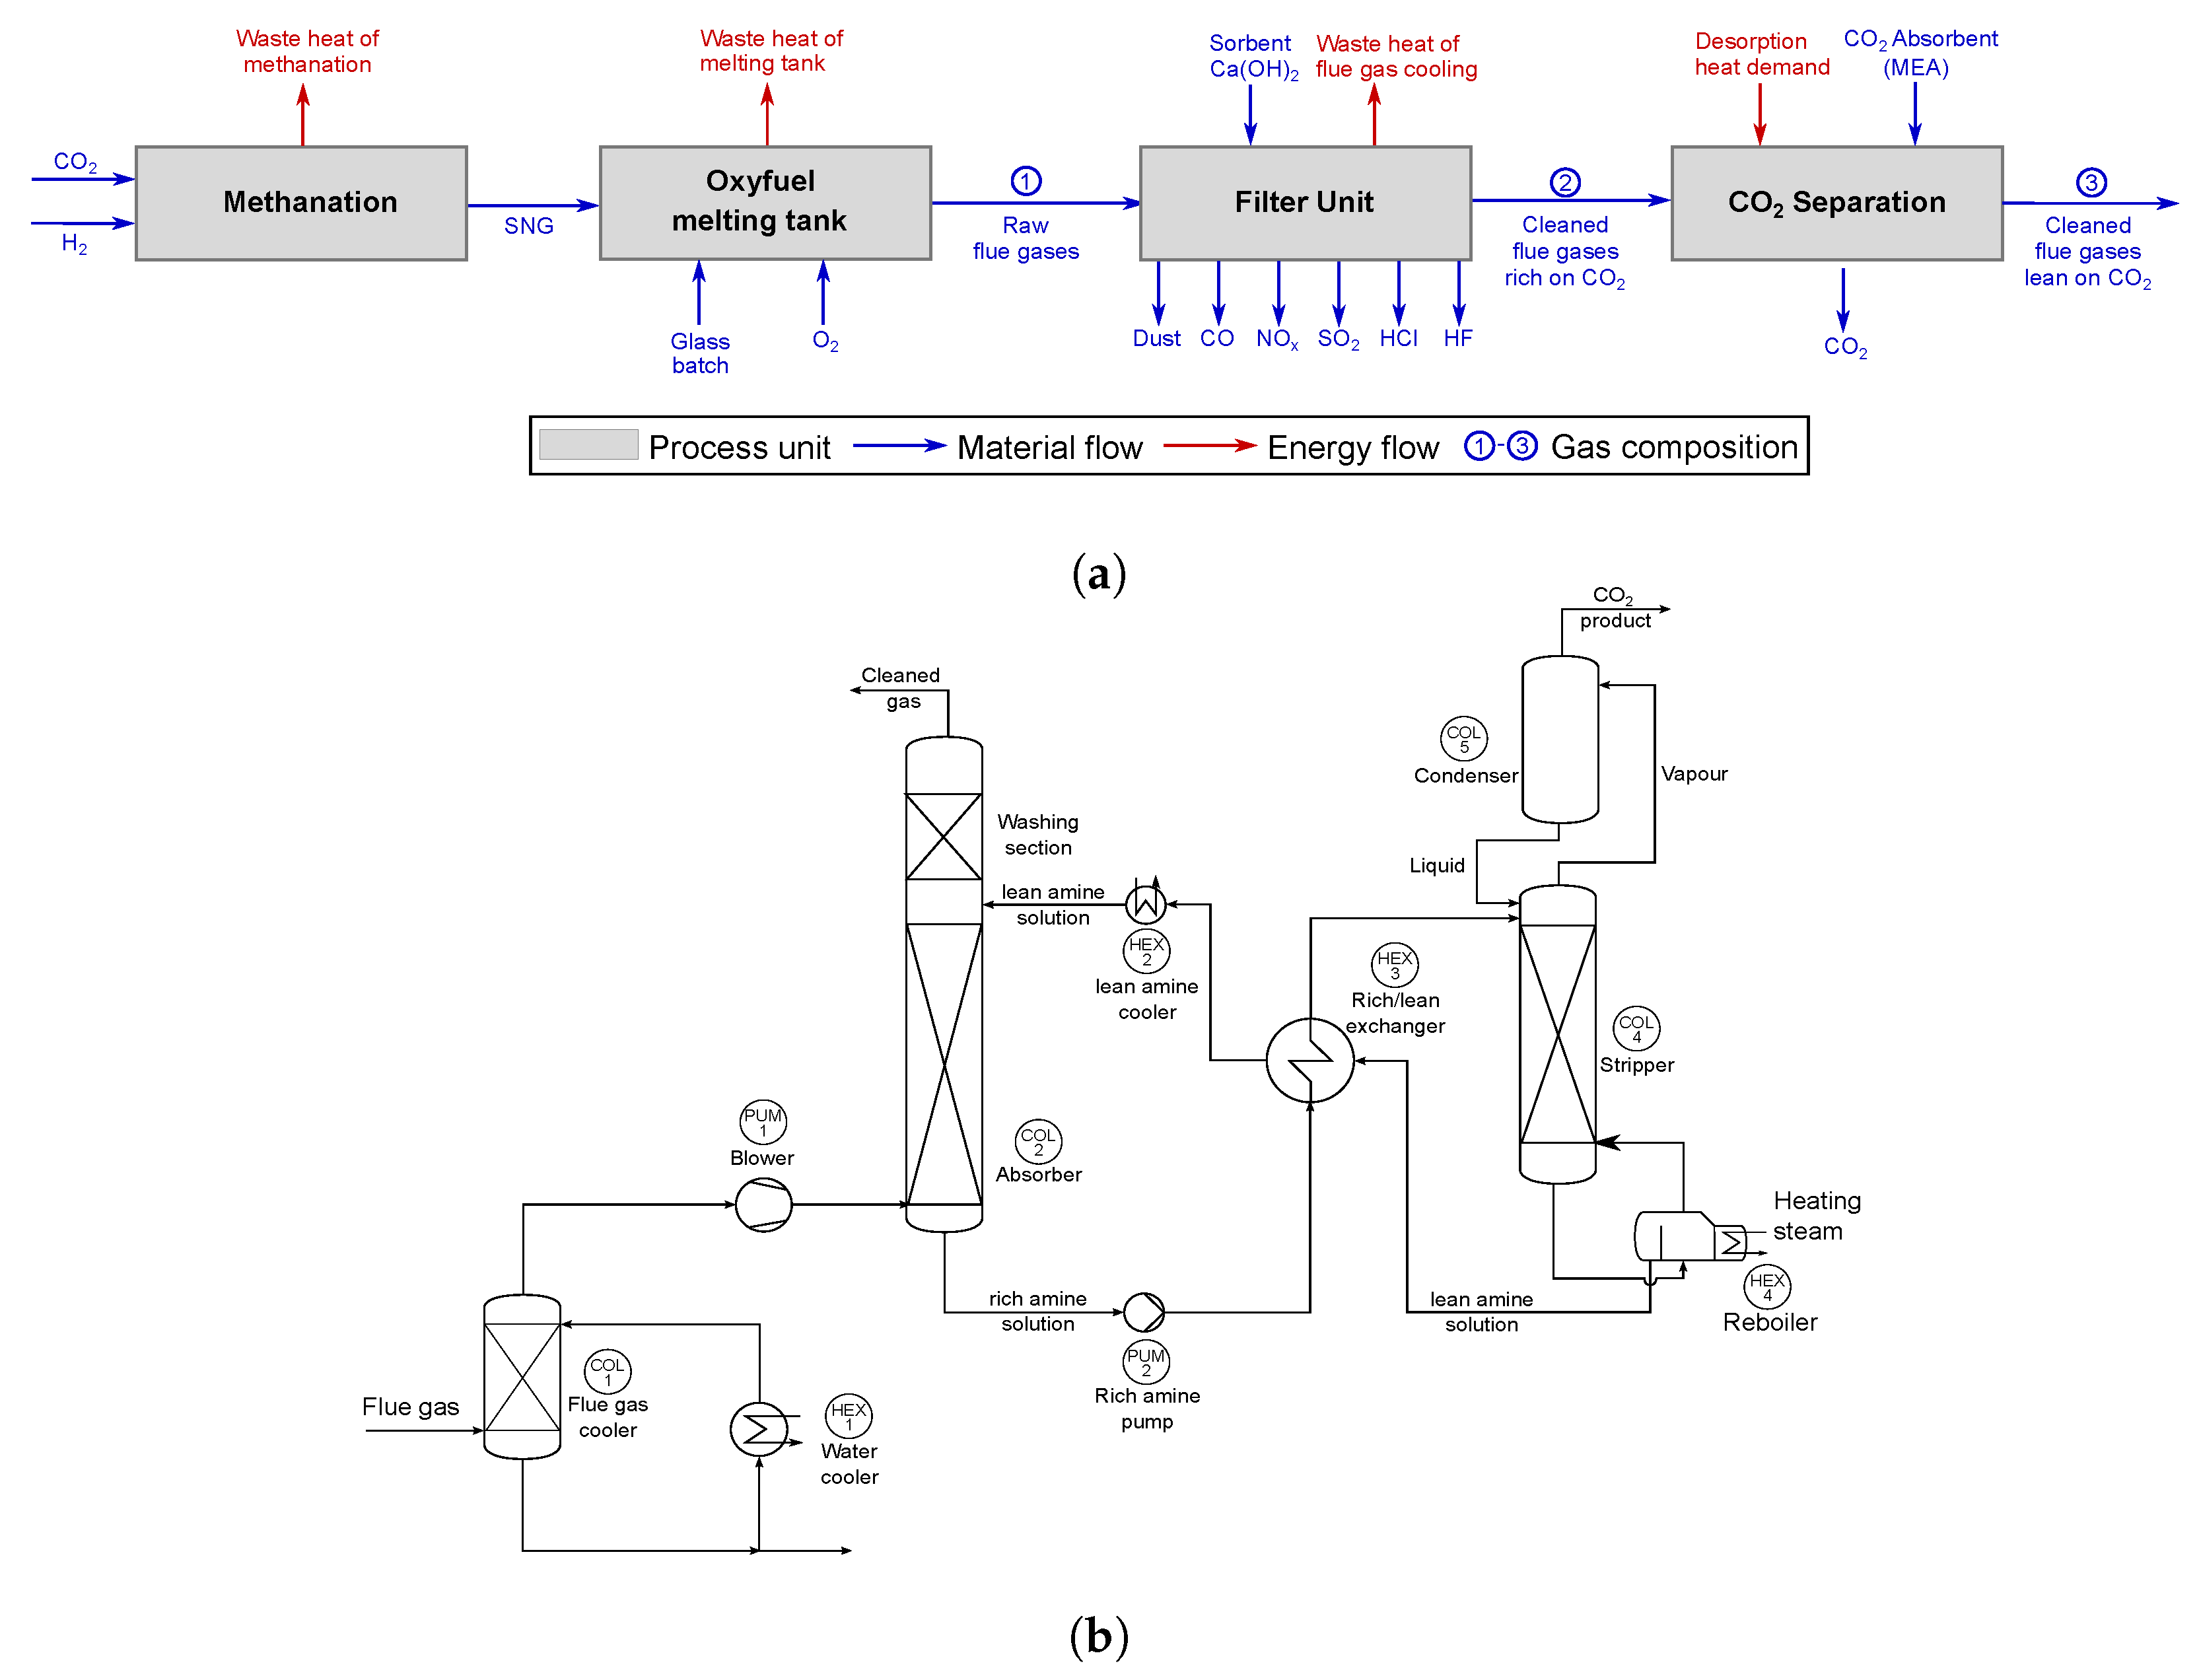
The integration of such a post-combustion CO 2 absorption plant is preferably realized after the already existing flue gas purification systems. At this point, the exhaust gases are already cleaned of harmful residues such as dust and a large proportion of the SO 2 emissions. A flowsheet for this integration is shown in Figure 2a).
CO 2 separation from flue gases using absorption process can be divided into two main process steps. First, CO 2 reacts with the lean aqueous amine solution (30 wt.-% MEA in this case), in the absorber column. The rich solvent, containing chemically bounded CO 2 , enters the stripper column by passing a lean/rich heat exchanger. This preheats the rich solution close to the stripper operating temperature of approximately 120 °C and consequently cools the lean solution. In the stripper column, the MEA solution is regenerated by an endothermic process. Therefore, low-pressure steam is supplied to the reboiler to maintain stable regeneration conditions. A temperature level of at least 150 °C and a pressure of 2 bar are required to ensure an efficient desorption process.
This thermal energy demand for the desorption of CO 2 is considered to be the main cost factor during the long-term operation of amine-based CO 2 separation plants. In power plant technology, usually steam from intermediate stages of turbines is used for this purpose. This reduces the electrical power output of the turbines and thus has a significant impact on the increased electricity production cost of carbon capture power plants. However, the PtM concept introduced in this work offers several options for waste heat utilization to meet the desorption heat demand in an energy-efficient way.

2.3. Heat Supply for CO2 Desorption

The ability to provide the necessary heat for desorption process is crucial for the economic viability of a post-combustion CO 2 absorption plant. Especially for heat-intensive processes at common temperature levels of the glass industry, the use of waste heat from these processes for steam generation is evident. Figure 2a shows the most promising waste heat sources of the PtM process for the glass industry, namely (i) methanation, (ii) melting process, and (iii) the flue gas filter unit. These options will be described in greater detail below.
It should be mentioned that waste heat is also generated during PEM electrolysis. Depending on the performance and design of PEM electrolysis systems, either water or air cooling is used. The temperature level of this waste heat is at approximately 80 °C [19]. Therefore, the utilization of this waste heat potential for steam generation is limited. Further processing, for example, by means of high-temperature heat pumps would be required to generate steam on the required temperature and pressure levels of CO 2 desorption. Due to these limitations, the waste heat option of PEM electrolysis is not considered in detail in this work.

2.3.1. Waste Heat of Thermochemical Methanation

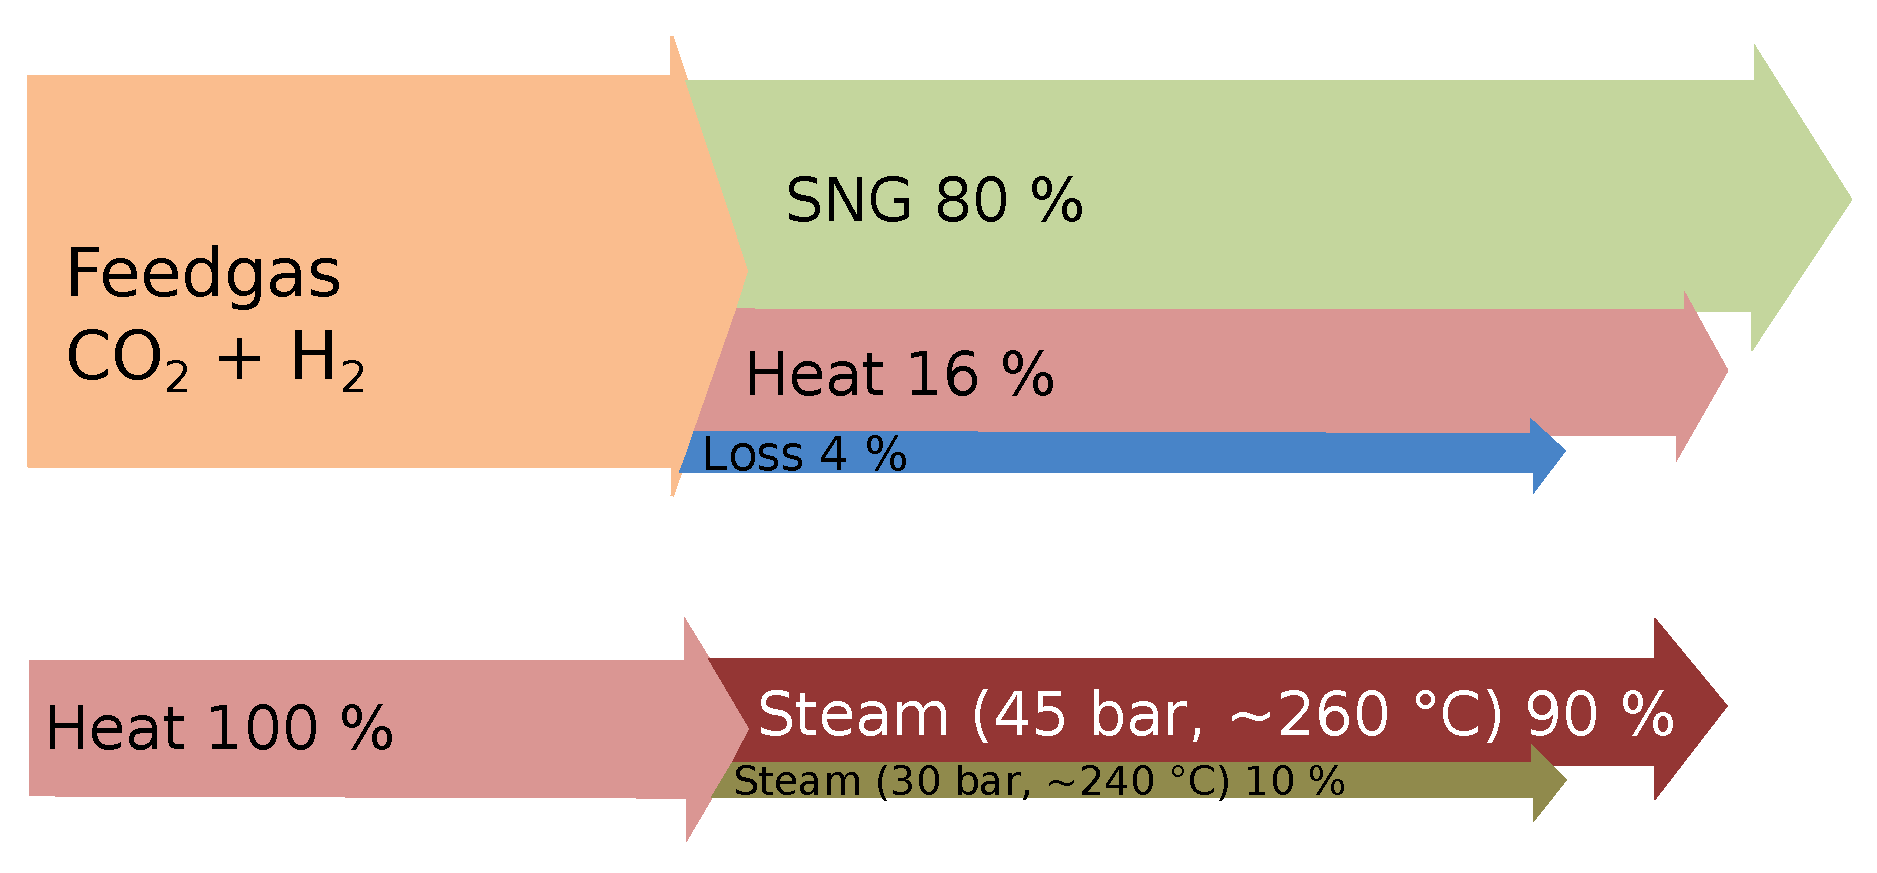
For thermochemical methanation processes, the continuous cooling of reactors is required to prevent the degeneration of established catalyst materials. Otherwise, the exothermic nature of the dominant reaction processes would lead to catalyst particle sintering. Commercially established tubular bulb reactors for methanation processes are usually operated at a temperature level of 300 °C and a pressure of 20 bar. Usually water cooling is a common way to maintain constant operating conditions in these reactors, generating steam at a temperature of approximately 260 °C and a pressure of 45 bar [36]. A Sankey diagram of tubular bulb reactors for methanation and their cooling process is shown in Figure 3.

2.3.2. Waste Heat of Melting Tank

Due to the melting temperatures of up to 1600 °C, as well as an efficiency of approximately 42% of oxyfuel furnaces [8], a high waste heat potential occurs in the direct furnace environment. However, the use of this heat reservoir is limited by a number of restrictions. For example, the installation of heat exchangers close to the furnace wall is restricted, since permanent access for industrial maintenance and servicing must be ensured. The remaining option is to use the heated ambient air close to the tank environment. However, the low-temperature level of the ambient air (below 100 °C) is an obstacle for the generation of process steam at the temperature and pressure level required for CO 2 desorption [17].

2.3.3. Waste Heat of Flue Gas Treatment

In many cases, the waste gases from the furnaces are still at too high a temperature level to be directly passed on to a filter system. In particular, the textiles in the cloth filter systems are sensitive to excessively high temperatures. Therefore, heat exchangers are installed in many flue gas cleaning systems to cool flue gases to a suitable level for filter systems. The heat recovered in this way is used, for example, to supply heat to office and administration buildings at glass industry sites [37]. In some cases, however, the reheating of the waste gases is also necessary to ensure sufficient flow conditions for the removal of waste gases through pipes and stacks [17,38].

3. Flue Gas Properties and Composition

Detailed data on the flue gas composition and properties must be available to enable an evaluation of the CO 2 separation process. However, the composition of flue gases in the glass industry is highly variable. The main influencing factors are: batch composition, cullet fraction, glass type, melting technology, and fuel, as well as flue gas treatment and cooling. Therefore, a literature screening was conducted for data from the flue gas analyses of melting systems, suitable for the application of the PtM process presented in this paper. The exhaust gas study by Roger et al. [39] was identified as the most promising source.
In this study, flue gas analyses were performed on several special glass melting tanks. The aim was to investigate the potential for the removal of boron compounds (namely boric acid (H 3 BO 3 ) and meta boric acid (HBO 2 )) from the flue gases generated during the melting of the typical borosilicate glasses. Although these investigations do not fully meet the scope of this work, several oxyfuel melting systems were investigated that would be well suited for the use of a PtM system. The most promising system is the one with the data given in Table 1. For the studies in this work, a conventional soda-lime glass, was assumed to be molten in this furnace. Compared to borosilicate glass, soda-lime glass changes the chemical composition of the glass batch while maintaining the technical design of the melting tank. Melting a soda-lime glass further results in the absence of boron compounds in the flue gas. The effects of boron compounds, such as H 3 BO 3 ) and HBO 2 , on currently established absorbents such as MEA have not been investigated to date and are therefore unpredictable.
The flue gas properties and composition shown in Table 2 were used for the examination of the CO 2 absorption plant in this work. Additional thermodynamic properties for the flue gases were calculated using the open source software Cantera with GriMech 3.0 reaction mechanism [40,41].
It should be noted that the volume fractions of CO 2 in the flue gas are very low, while N2 and O 2 are very high for an oxyfuel combustion system. It can be concluded that in this particular case, high amounts of ambient air are entering the flue gas system. The rise of O 2 fractions from raw gas to clean gas may also be explained due to ambient air leaks in the system. It should be noted, that such flue gas compositions are based on experimental results from existing glass melting plants, with no further explanations for the presumed high ambient air content provided by the study [39]. However, for the sake of the most energy-efficient overall process, this high ambient air content should be avoided, as it can result in a higher CO 2 concentration in the flue gas. This would have a positive effect on the specific heat requirement (MJ/kg CO 2 ) of the CO 2 separation.

4. Materials and Methods

4.1. Simulation Approach

The technical and economic analysis of CO 2 capture from the flue gases of the glass industry requires the design and sizing of the plant components. For this work, the process simulation tool Aspen Plus was used for component design. Numerous other studies found this approach to be useful and validated [42,43]. The most important equipment of the CO 2 capture plant, namely the absorber and stripper column (as can be seen in Figure 2), were designed in detail, using the simulation results of the Aspen Plus model (v12).
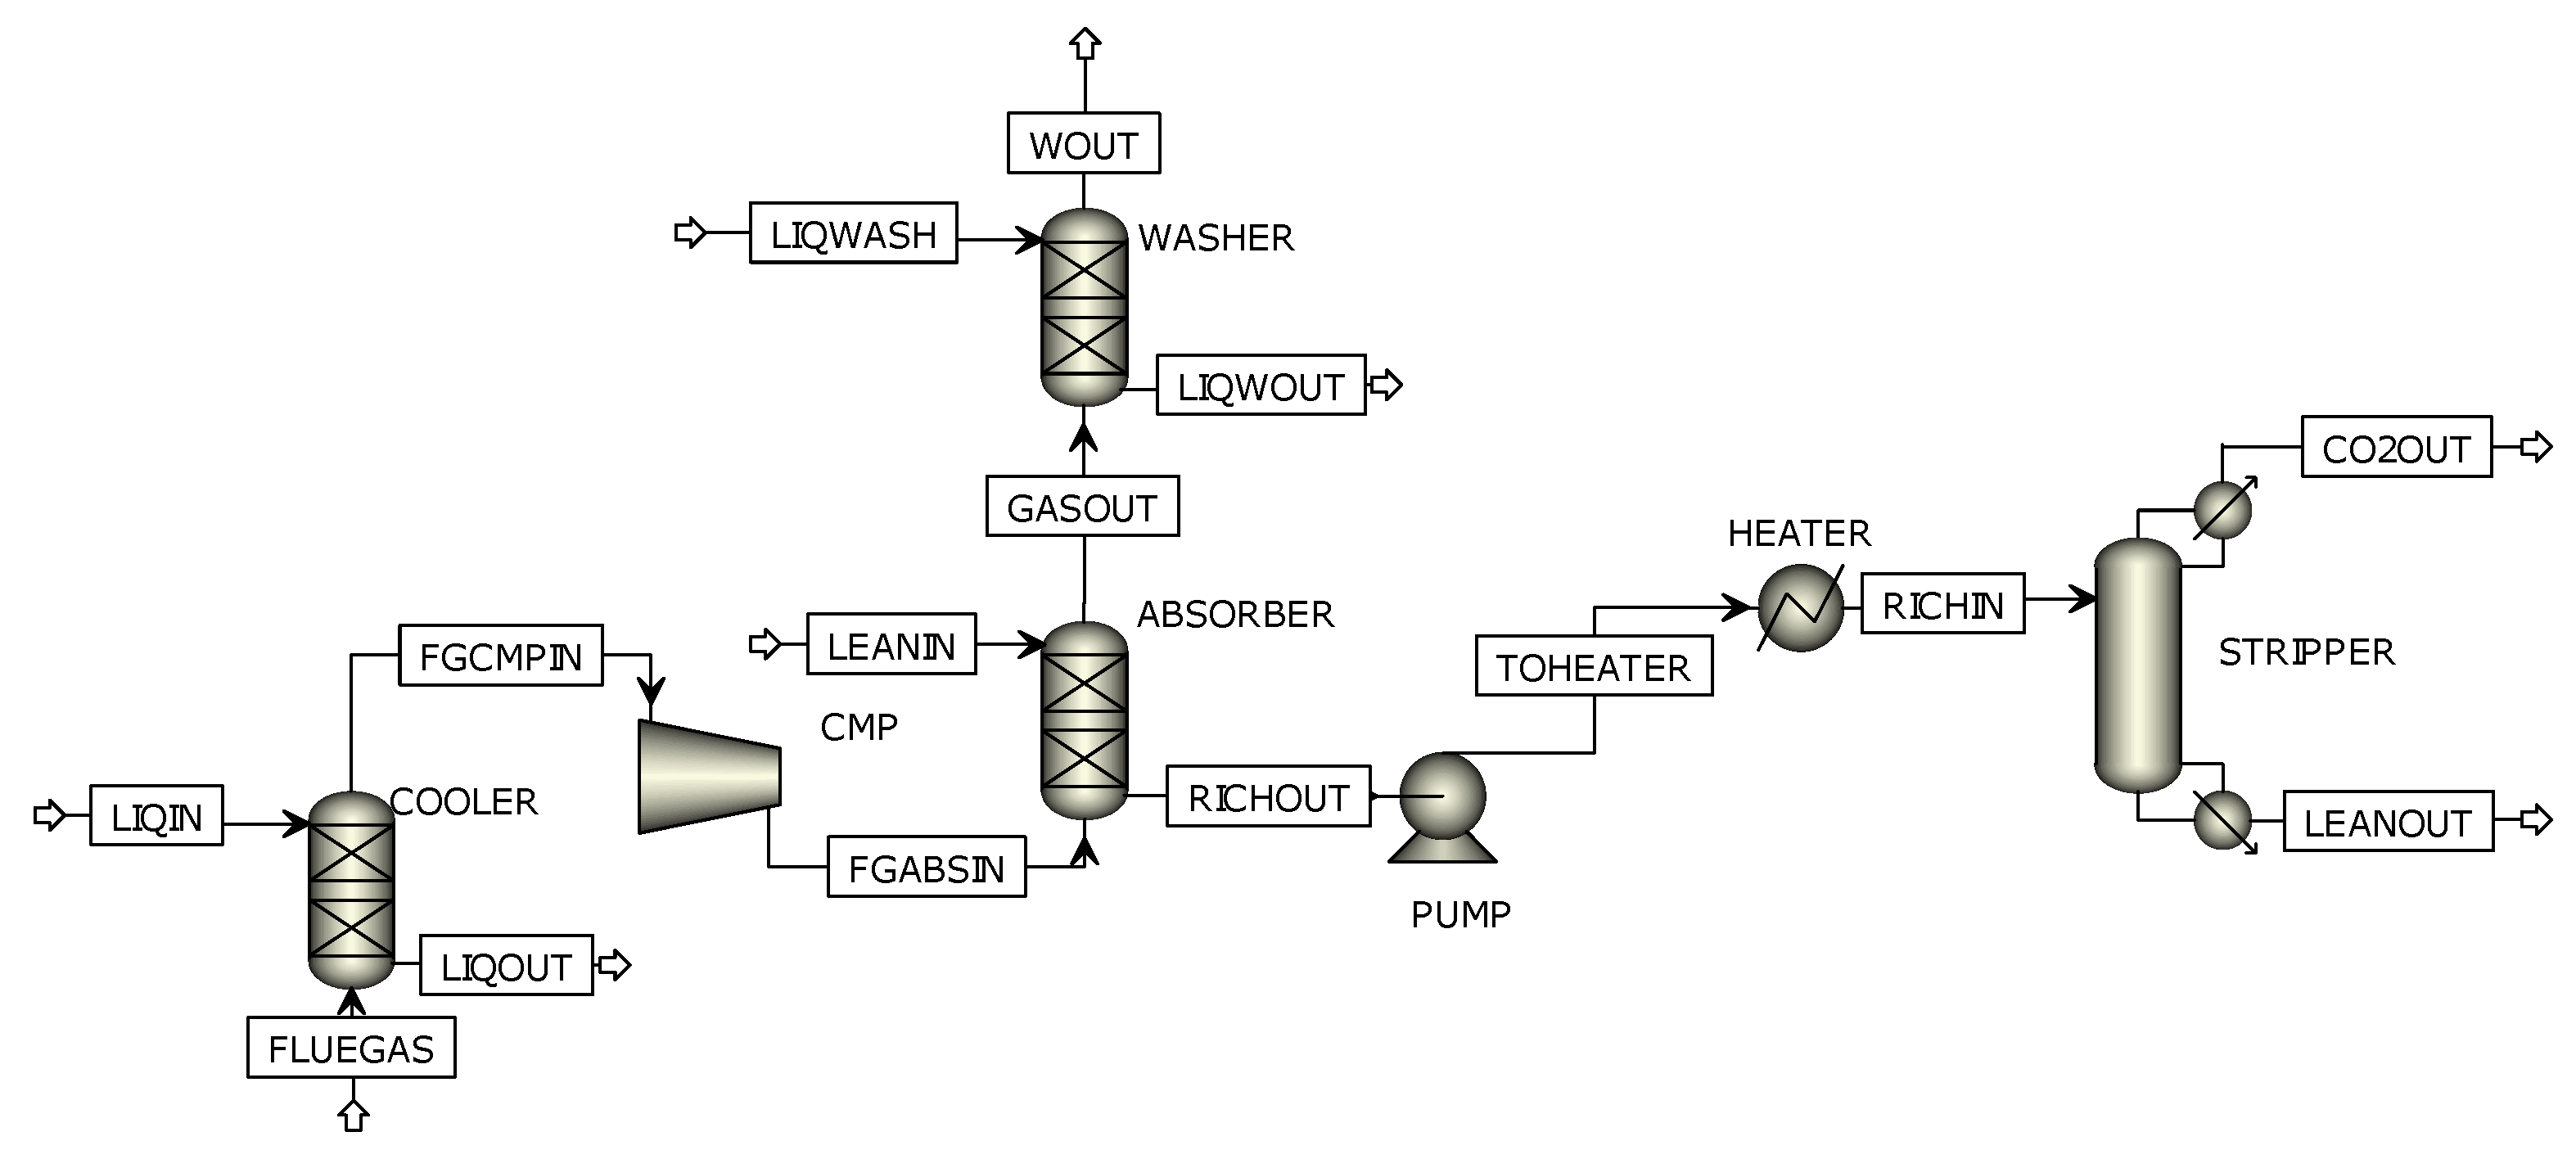
The flowsheet of the Aspen Plus model is depicted in Figure 4. The columns are modeled in detail using a rate-based approach. The other components, namely the compressor, the pump, or the heat exchanger were modeled in a simplified way. The ELECNRTL property method in Aspen is used to calculate the media data using the eNRTL model for the liquid phase and the Redlich–Kwong equation of state for the vapor phase.
The dissociation reactions are considered by defining the equilibrium reactions, whereas the kinetics are considered for all reactions including CO 2 as a reactant using built-in power laws in Aspen Plus. Because of the fast reaction of the CO 2 , the liquid film is discretized in five parts. As structured packings, the Melapak 250Y from Sulzer [44] are used in all columns. The mass transfer coefficients, interfacial areas, and column hold-up are calculated using the correlation of Bravo et al. [45,46]. The heat transfer coefficients were determined according to the theory of Chilton and Coburn [47].
In order to ensure the validity of the mass balance, it would be an obvious step to close the loop in the Aspen model. However, this significantly decreases the numerical stability of the model. Thus, the mass balance is controlled using the built-in optimizer in Aspen Plus. The CO 2 mass balance is controlled by the heat flow rate to the stripper. All other minor components such as oxygen or nitrogen are varied in such a way that the mass balance is fulfilled. The carbon capture rate is controlled by using the solvent flow rate. To ensure that the plant is operated at the optimal operation point, the lean CO 2 loading (CO 2 loading at absorber entry) is varied by the optimization function.
In order to calculate the column diameters, the fractional approach to maximum capacity is used in Aspen Plus [48]. A factor of 0.65 is chosen. A constant capture rate of 90% is set using the lean solvent mass flow. The heat flow into the reboiler in the stripper column is varied in such a way that the CO 2 mass balance is met. The lean solvent loading is varied to ensure an optimal operation point of the plant and minimum heat demand in the reboiler. The packed column height was set according to [42], and the relevant parameters of the plant are listed in Table 3.
In order to calculate the equipment costs, a comparison with an identical system is required (as can be seen in Section 4.3). Therefore, a simulation model was developed for the CO 2 separation plant with the exhaust conditions ➁ shown in Table 2 and another was developed for the reference CO 2 absorption plant described in [43,49]. In addition, the operating parameters shown in Table 4 are assumed for the CO 2 separation plant. Due to the continuously operated glass melting tank, operating hours of 8688 h/year are assumed for the CO 2 separation plant. These high operating hours are necessary to guarantee a sufficient separation rate of 90% CO 2 . This assumption for operating time is higher than the reported 7500 operating hours from [49]. However, operating hours of more than 8500 h/year are a common assumption in other studies, investigating CO 2 separation from industrial processes [50].

4.2. CO2 Compression

After the CO 2 separation unit (Figure 1, 6 ), the separated CO 2 is available at a pressure of approximately 2 bar and a temperature of approximately 26 °C. Thus, to reach the operating pressure of the methanation reactor of approximately 20 bar, CO 2 compression is required. The required pressure of the methanation reactor is much lower than the usual pressures for the underground storage of CO 2 in established carbon capture and storage concepts of up to 120 bar [51]. To date, to achieve this high compression from 2 to 120 bar, four-stage compression processes have been suggested for CCS concepts [51], which might no longer be required for the reduced compression ratio from 2 to 20 bar for the PtM concept. Due to the significant deviations in the compression processes of the PtM concept described in Figure 1 and the described process in [43], a detailed evaluation of the compression energy demand and investment cost is conducted. In [51], the required power demand for CO 2 compression is calculated as:
P e l = α e l · ln P o u t P i n · m ˙ C O 2
where P e l is the electrical power demand in kW, α e l is the compressor power constant of 87.85 kW/kg CO 2 , P i n and P o u t are the inlet and outlet pressure in Pa, respectively, and m ˙ C O 2 is the inlet CO 2 mass flow in kg/s. Moreover, the calculation of investment costs in a CO 2 compressor is suggested as [51]:
I = α 1 · m ˙ C O 2 α 2 + α 3 · ln P o u t P i n · m ˙ C O 2 α 4 · m ˙ C O 2
where I is the investment cost in EUR and m ˙ C O 2 is the CO 2 mass flow in kg/s. α n are empiric constants, determined as α 1 = 0.1 · 10 6 in EUR/(kg/s), α 2 = 0.71 , α 3 = 1.1 · 10 6 in EUR/(kg/s) and α 4 = 0.60 [51]. The results of the calculations obtained from Equations (1) and (2) were validated against vendor information [52].

4.3. Economic Analysis

The costs of the plant components were calculated using the “estimating equipment cost by scaling” method, described in [53]. For this purpose, the costs of closely related reference plant equipment k r is compared to the equipment cost of the proposed plant k e by an exponential factor m:
k e = k r G G r m
The basis of the characteristic component parameters of the reference equipment G r include, for example, the column volume, pump mass flow rate, or heat transfer area. These parameters are in relation to that of the proposed plant G. Various degression exponents m < 1 for the respective components allow the cost comparison for each equipment type.
Other components of the investment costs, such as installation, instrumentation and control, piping, or electricity supply can be subsequently calculated as a proportion of total equipment costs, such as that proposed by [53] and already used for similar approaches for cost calculations of CO 2 absorption plants [49]. The well-established equivalent annual cost (EAC) method was used to calculate the costs of owning and operating assets over their entire life time. Further assumptions for cost parameters are shown in Table 5.
According to [54], hourly gross salaries in Germany for operating labor in maintenance and repair are between 15.89 and 30.96 EUR/h, depending on the company, industry sector, and location. Ref. [55] stated a gross annual salary of EUR 47,756 for maintenance and repair operating labor. Given the standard 40 h work week in Germany, this results in a gross hourly wage of 22.26 EUR/h. In Germany, however, companies have to pay additional insurance, taxes, and levies (ITL) on top of the gross wages of employees. To account for these costs, an additional ITL-factor of 1.7 can be considered on the gross salary. The 45 EUR/h, named in Table 5 thus results in a gross hourly wage of 26.47 EUR/h, which meets both the published data of [54,55].
The “ProcessNet—Chemical Plant Price Index for Germany” was used to take inflation-related price development since 2007 as well as increased material, distribution, and logistics costs into account. According to this index, prices have risen by 21.5% since 2008. Due to the impact of the global COVID-19 pandemic, the effects of production cutbacks, and limited logistics capacities are particularly evident from 2020 onward. By 2019, the increase would have been only 16% (see Figure A1) [56].

5. Results and Discussion

5.1. Simulation Results

For CO 2 absorption plants, the absorber and stripper column, as well as the gas blower and the cooling water pump for the pre-scrubber are the main cost factors with a share of more than 80% [49]. Therefore, relevant comparative parameters for Equation (3) were considered with particular detail during simulations. The most important results are shown in Table 6. In addition, columns 4 and 6 in Table 7 show the simulation results for the CO 2 absorption plant considered in this work, as well as the reevaluation of the reference plant, considered in [43,49].
The sizing of the effective column diameters of the absorber and desorber is crucial for the adequate operation of CO 2 capture processes from flue gases. These were determined in the developed ASPEN Plus model by linear optimization with a 90% CO 2 capture rate as a boundary condition. For the desorber, this results in a diameter of 0.95 m for the flue gas volume flow rate and composition specified in Table 2. The effective desorber column diameter is determined as 0.50 m. The required heat output of the desorber of 556.5 kW, or the specific heat requirement of 3354 MJ/kg CO 2 must be provided by the reboiler. The CO 2 capture system can avoid 8641 t CO 2 /year.

5.2. Cost Calculation Results

Cost calculations for the CO 2 absorption plant were determined considering the following steps:(i) calculation of equipment cost (Section 5.2.1); (ii) calculation of capital expenditures (CAPEX, Section 5.2.2)); (iii) calculation of operational expenditures (OPEX, Section 5.2.2); and (iv) the calculation of resulting CO 2 separation cost (Section 5.4).

5.2.1. Equipment Cost

Table 7 gives an overview of the equipment cost for both the modeled CO 2 absorption plants. Details concerning the reference plant are given in [49]. The plant for this work was designed for the same CO 2 capture rate of 90% and stripper operating conditions of 2 bar and 130 °C.
The absorber column is the most cost-intensive plant component, both in the original CO2 separation plant and in the newly designed plant for the glass industry. The costs for the absorber are approximately EUR 340,000. The second most important contribution to equipment costs is related to the stripper column, at approximately EUR 110,000. Accordingly, another 20% of the total costs are contributed by the stripper. To date, 85% of the total equipment costs can be attributed to the most important columns in the process. Other important and cost-relevant items are the cold water pump, blower and DC water cooler with a combined investment cost of approximately EUR 51,000. The previously described parts cover 96% of the total component costs. The remaining plant components such as rich/lean heat exchanger, solvent pumps, reboiler, or the chiller for the exhaust gas cooler cooling supply can be attributed a total cost of EUR 20, 000, based on the given percentage share of [49]. Since these components account for only 4% of the total cost, this summarized cost estimate is sufficient for these components. This cost allocation pattern is consistent with the data in [49] and can thus be considered valid.
The total costs for CO 2 compression after separation, calculated as described in Section 4.2, were approximately EUR 153,000. Alternatively, using the second approach described in Section 4.3 would yield investment costs of EUR 69,000, but only for a single-stage compression process. A single-stage compressor, however, would have to achieve a compression ratio of 1:10. Such a high compression ratio is unfavorable for thermodynamic reasons in single-stage design and would lead to high heat generation, high compressor operating power, and thus high energy demand. Thus, the single-stage compressor is extended to a two-stage compression process, yielding a compression ratio of 1:5 in the first compressor stage. Therefore, the costs calculation of method 2 would double, yielding costs of EUR 138,000. Finally, the costs were validated against vendor information, giving estimated costs of EUR 120,000 for a two-stage reciprocating compressor [52]. For further calculations, the cost estimated by the vendor was used, as this can be considered the most practical approach.

5.2.2. Capital Expenditures

In addition to the equipment cost, additional investments for installation, control engineering, pipes, and electrical installation have to be considered. These cost are calculated according to the methodology shown in Section 4.3. The cost elements can be divided into direct costs for materials and further equipment, and indirect costs for services such as engineering and construction expenses of the plant. The direct cost elements can be further structured according to inside battery limit (ISBL) cost, and outside battery limit (OSBL) cost. ISBL includes material costs, which are directly associated to the plant, while ISBL are secondary expenses for building, yard improvement, or service facilities.
Ranges for the assumed percentages of ISBL costs are given in [53]. Table 8 shows the parameters taken into account and their influence on the total CAPEX. Due to the comparably small size of the CO 2 capture plant, the lower limits of the ranges proposed in [53] were selected. Thus, the additional costs for construction and installation, instrumentation, and control, as well as piping and electrical equipment are approximately EUR 354,000, or approximately 68% of the component costs. The total material and equipment cost of the CO 2 separation plant for the glass industry are approximately EUR 875,000.
The OSBL costs for buildings, yard improvements, and service facilities were assumed to be lower than recommended by [53]. Due to the low column volumes and the resulting compactness of the plant, a container solution for plant housing is attractive. Considering this option, OSBL costs of over EUR 100,000 building infrastructure seems justified, or even on the safe side. The excavation and concrete construction work will be limited with this simplified type of building design. Service facilities such as changing rooms and showers for personnel or workshops can be provided by the existing infrastructure at a glass manufacturer site. The total direct costs thus amount to approximately EUR 980,000.
For indirect cost, ranges suggested by [53,58] are used. This results in total indirect costs of approximately EUR 107,000. For the calculation of the total plant investment costs (FCI), the investment costs of the CO 2 compressor must also be considered. In total, the FCI add to approximately EUR 1.15 million.
In addition to the FCI, costs for labor arising in the company, start-up, and initial material costs must be taken into account. The costs for start-up and initial material costs amount to approximately EUR 92.000. The material cost is mainly for the initial loading of the solvent circuit. This consists in a 30 wt. % solution of monoethanolamine (MEA) in water.
The component costs were determined by cost comparison with a CO 2 separation plant for coal-fired power plants, which was designed as early as 2007. Since then, due to inflation, as well as global geopolitical events such as the COVID-19 pandemic, non-negligible price increases have occurred in all areas of public life, which also affected chemical engineering. In order to take these developments into account, a price index correction, based on [56] was applied. This price index correction since 2007 has a significant impact of 21% on total CAPEX. The extent to which prices developed according to current influences such as recent conflicts, should be closely examined. These effects have not yet been taken into account in the current values of [56] and may require reassessment for future works.
The CAPEX of plants for CO 2 capture from flue gases of power plants are far above the values calculated in this study. Abu-Zahra and Singh proposed EUR 147 million and EUR 179 million, respectively [49,59]. With respect to CAPEX, there is a factor of 90 between both plants, and with respect to the absorber column dimensions, there is even a factor of 300. This is mainly due to the significantly lower flue gas mass flow of the investigated glass melting tank. In the investigated case study, 0.569 kg/s are present at the glass industrial plant, while 616.0 kg/s are present at the reference plant of the coal-fired power plant. To allow a more specific comparison, the required absorber column volume per ton of CO2 captured is calculated. The glass industry plant needs 4.54 · 10 3 m3 absorber/t CO 2 captured, while the reference plant needs only 3.44 · 10 3 m3 absorber/t CO 2 captured. Accordingly, for the specific amount of flue gas occurring in the glass industry, a larger absorber column is necessary. This is most likely due to the high levels of ambient air flowing into the investigated flue gas filter unit. The ambient air increases the exhaust gas volume while reducing the CO2 partial pressure in the cleaned flue gases rich on CO2.
Nevertheless, the large scaling factor between the reference plant and the designed plant is outside the limit proposed by [53] for the applicability of the cost comparison method. However, the determined cost frameworks appear plausible by comparing specific CAPEX to other literature sources. Ref. [35] investigated the CO 2 capture for carbon-intensive industrial processes and reported a specific CAPEX of 160 EUR/t CO 2 and year for amine-based post-combustion CO 2 capture in cement industry processes. The resulting specific CAPEX of this work is 188 EUR/t CO 2 per year. Considering the price increases since 2012 (approximately 16% according to [56], as can also be seen in Figure A1), the deviation of 15% calculated in this work seems justified.
It should be noted that the applied boundary conditions and assumptions of this work may have a significant impact on the implementation costs of a CO 2 capture plant in glass melting processes. However, the figures proposed herein should provide a sufficiently detailed basis for an initial cost estimation that could serve as a valuable basis for further investigations.

5.2.3. Operational Expenditures

The operating expenses (OPEX) for the CO 2 capture plant can be further divided into fixed charge, direct production costs, plant overhead costs, and general expenses. Table 9 shows an overview of the calculated OPEX. According to the methodology described in [53,58], ranges or fixed percentages for the respective cost categories are given.
The fixed costs of the CO 2 capture plant include local taxes, fees, and charges, as well as insurance rates. Lower percentages of the range suggested in references [53,58] were specified for this purpose, as there are currently no specific tax rates or fees for such plants in Germany. The insurance coverage will primarily include fire insurance, the costs of which are based on the investment volume, fire risk, and the business activity. Based on the investment costs of EUR 1.63 million determined in Section 5.2.2, the low fire risk of the plant (essentially short circuit and cable fire, hardly flammable materials) and the low fire-prone glass industry, the resulting fixed costs of approximately 18,000 EUR/year (1.1% of CAPEX) appear sufficient.
The direct production cost included the material requirements for plant operation, such as the cooling water, MEA makeup caused by degradation, and maintenance materials. The cooling water demand is based on simulation results. The MEA degradation was calculated based on the data given in Table 3 and Table 5. The cost of the MEA makeup is approximately 14,000 EUR/year or 18% of the total OPEX. Other sources have reported an OPEX cost share of up to 32% [49,59]. Due to the size of the plant, the reduced cost share for the CO 2 separation plant in the glass industry seems plausible. However, the high O 2 content in the flue gas (see Table 2) may cause increased MEA degradation due to oxidation. For this reason, switching to more stable absorbents such as secondary or tertiary amines appears promising. These exhibit increased thermal and chemical stability against oxidative degeneration, as well as increased energy efficiency (as can be seen in Section 5.5). Besides these beneficial effects on operating parameters, the reduced energy demand and increased stability of advanced amines may result in a significant cost reduction.
The operating labor cost for the maintenance, operation, and monitoring of the plant, amounting to approximately EUR 39,000 per year, is the largest cost component (approximately 27%) in the annual OPEX. For this work, we assumed a 0.1 job per shift for the operation of the CO 2 separation plant. In the glass industry, a three-shift operation of 8 h each for 365 days per year is common to maintain labor supply. The assumption that 10% of the working time of a maintenance employee per shift is spent on the maintenance and servicing of the CO 2 separation plant thus corresponds to a total time expenditure of approximately 2.5 h/day or 912.5 h/year. Other studies such as [49,59] assumed a two job per shift staff expenditure for plant operation. However, as the separation plant discussed in this work is much smaller, such a reduction in OL expenses seems justified. In addition, OL costs influence supervision and support labor costs, laboratory charges, and plant overhead costs. Taking all of this influence into account, OL costs contribute to approximately 60% of total OPEX.
Additionally, general expenses for distribution and marketing, as well as ongoing research and development, add up to approximately EUR 11,000 per year. As a result, the annual operating expenses (OPEX) amount to approximately EUR 148,000 in total. This represents approximately 9% of the total CAPEX. [35] assumed an OPEX range of 7–12% of total CAPEX for a post-combustion MEA separation plant in the cement industry. Therefore, the OPEX calculated in this work can be considered consistent with other literature sources and even indicate potential for further optimization.

5.3. Cost for Desorption Heat Generation

The supply of the necessary heat for desorption is crucial for the economic viability of a post-combustion CO 2 absorption plant (Section 2.3). As shown in Table 4, the heat demand for the designed CO 2 separation process is 928 kW, at a steam temperature and pressure of 150 °C and 2 bar.
In particular, the methanation process as well as the flue gas filtration systems are the most promising options regarding the use of waste heat for steam generation.

5.3.1. Methanation Waste Heat Utilization

Considering the thermal power demand of the melting tank described in Table 1, a 7.60 MW methanation reactor is required to ensure a constant heat supply. Such a reactor can provide high pressure and temperature steam (HP-steam) and low pressure and temperature steam (LP-steam, see Figure 3). Table 10 shows the power distribution of a tubular bulb reactor based on vendor information [36]. It is evident that the HP steam of the methanation reactor can already cover approximately 120% of the heat demand for CO 2 desorption. According to vendor information, a specific CAPEX of 40 EUR/kW thermal can be expected for the cooling equipment of the methanation reactor. Based on the total steam power of 1.22 MW, a total CAPEX of approximately EUR 49,000 can be considered for the cooling equipment of the methanation reactor in the considered PtM system of this work. Thus, assuming a lifetime of 20 years and an interest rate of 5%, an exact thermal cost of 0.0004 EUR/kWh was achieved.

5.3.2. Flue Gas Treatment Waste Heat Utilization

In addition to methanation, waste heat recovery from flue gas cleaning for desorption heat demand is a promising option. However, considering the properties shown in Table 2, the enthalpy content in the investigated flue gas is approximately 850 kW for a Δ T of 247 °C. This is not sufficient to provide the required thermal power of the reboiler of 915 kW.
The flue gas needs to be cooled to approximately 130 °C to ensure sufficient heat output for adequate steam generation. At this Δ T of 340 °C, an enthalpy of 1171 kW can be used. Based on vendor information and calculations, a five bundle plain tube heat exchanger is sufficient to generate steam at the required desorption conditions. Depending on the exhaust gas properties, conventional steel or, in the case of highly corrosive exhaust gases, stainless steel would be suitable as a construction material for this heat exchanger. A cost estimate for these material options is approximately EUR 40,000 for conventional steel, and EUR 90,000 for stainless steel, respectively, [37]. Assuming a lifetime of 20 years and an interest rate of 5%, specific costs of 0.0007 EUR/kWh thermal for common steel and 0.001 EUR/kWh thermal for stainless steel are achieved.
The lower outlet temperature of the flue gases from the filter system would also affect the CO 2 separation system. As a result, the capacity of the flue gas cooler could be reduced, which in turn would result in lower investment costs. However, this would also influence flow characteristics in the flue gas channel. Consequently, existing flue gas systems may no longer be able to achieve the required flow capacities and may require re-planning and design.

5.4. Cost of CO2 Separation

With a lifetime of 20 years and an interest rate of 5%, the annual depreciation or EAC costs of the CO 2 separation plant designed in this work are approximately 135,000 EUR/year. As shown in Table 9, there are additional OPEX of approximately 146,000 EUR/year. The power required for CO 2 compression can be calculated to 73 kW using the method described in Section 4.2. However, vendor information named a compressor peak power of 55 kW and an operating power of 41 kW. Using the vendor information, CO 2 compression has an energy demand of approximately 357 MWh/year, or approximately 41 kWh/t of CO 2 captured, for the compressor operating hours of Table 4. Specific electricity costs are taken from [8] where 0.12 EUR/kWh were assumed for glass industry companies. The three cost factors EAC of CAPEX, OPEX, and electricity demand for the CO 2 compression add up to an annual cost of EUR 353,000 for the CO 2 separation plant designed in this work.
The heat demand for desorption in year-round operation is 8017 MWh/year, or 928 kWh/t CO 2 . The described CO 2 capture plant can avoid 8641 t CO 2 /year (Table 4). The three options for waste heat utilization, described in Section 5.3, were used to investigate their influence on CO 2 separation costs. The results are shown in Table 11. The CO 2 separation costs are 38.07 EUR/t CO 2 for the waste heat utilization of the methanation process. For the flue gas heat exchanger option, slightly higher costs of 38.42 EUR/t CO 2 or 38.73 EUR/t CO 2 were achieved. Above all, the lower heat output that these heat exchangers can generate, but also the higher material costs for the stainless steel version have an impact on additional costs. Nevertheless, these cost increases are very small and illustrate the potential for cost-effective waste heat utilization for absorption-based CO 2 capture in the glass industry.
Other studies reported CO 2 separation costs from industrial waste gases to range from 25 to 135 EUR/t CO 2 . However, these reported values depend very much on the used CO 2 capture technology. Comparable process designs in the cement industry with post-combustion CO 2 capture using MEA, assume short- to mid-term CO 2 separation costs to be approximately 65 EUR/t CO 2 at a low cost for external steam import [35]. In studies investigating CO 2 capture from industrial point sources for methanation, 50 EUR/t CO 2 was found [60]. However, they assumed a lower CO 2 compression level of 10 bar and no detailed specification of industrial point sources was given.

5.5. Options for CO2 Separation Process Improvement

The CO 2 separation costs of 38–39 EUR/t CO 2 found indicate the promising potential for low-cost and energy-efficient integration options for the post combustion CO 2 separation within the introduced PtM process for the glass industry. In addition, there are further options for optimizing the CO 2 capture process that have not yet been investigated:
In this work, a 30 wt. % aqueous solution of MEA was assumed. Other studies have shown that increasing the MEA content in the aqueous solution up to 40 wt.l% can further reduce the CO 2 separation costs. This can be achieved by the reduction in the energy requirement for desorption and lower investment cost for the plant equipment because of reduced liquid flow rates [49].
MEA is considered to be the standard solvent for post-combustion CO 2 absorption. However, as mentioned in Section 2.2, MEA shows disadvantages in terms of thermal and chemical stability. Chemical degradation caused by oxidation can especially be an issue for the application of MEA-based CO 2 separation processes in the glass industry. The high O 2 -content of 20.5 vol-% in the investigated flue gas composition might increase oxidative degeneration (see Table 2). These effects can be avoided by changing the absorbent. The substitution of the primary amine MEA with secondary or tertiary amines such as methyl-diethanolamine (MDEA) or mixtures such as methyl-diethanolamine with piperazine (MDEA-PZ) are discussed in the literature for more stable CO 2 absorption processes. These solvents are not improved with regard to higher thermal or chemical resistance, but also enable a higher CO 2 loading capacities, while at the same time reducing the desorption heat demand. For example, the desorption heat demand of MDEA-PZ is reported as 2.6 GJ/t CO 2 , while the heat demand of MEA is 3.4 GJ/t CO 2 [61,62]. Thus, a change of absorbents could not only improve the chemical stability but also further reduce the energy demand and CO 2 capture costs, respectively.
In addition to solvent replacement and changing solution properties, an advanced process design could also positively influence the costs of CO 2 separation. Improved designs for the rich/lean heat exchanger [63], vapor recompression, and split-stream processes [64], have been investigated and shown promising potential for enhancing the CO 2 removal capacity for reduced energy demand.
Combinations of these improved process designs and careful solvent selection could even further optimize the costs and performance of absorption-based CO 2 separation from flue gases of glass melting processes.

6. Conclusions

In this work, an innovative concept for the integration of a PtM process into oxyfuel glass melting processes is presented. The state of the art of the main process components is described and recommendations for suitable technology options are given. The required capture of CO 2 from the glass industry flue gases were identified as the process that requires more detailed research, as it has not been discussed before. Post-combustion CO 2 absorption capture processes, which have also been applied in power plant technology, were identified as the most promising option. A process simulation of this technology allowed a detailed design of the most important plant components and their cost evaluation. The following conclusions can be drawn:
  • Amine-based CO 2 capture processes allow a reduction of 90 % of CO 2 emissions of combustion-based glass melting processes. The designed CO 2 absorption plant for the glass industry is approximately 400 times smaller than the comparable concepts for power plants, due to the much lower volume of produced flue gas.
  • This enables cost reductions in the required building infrastructure, as well as in staff costs for maintenance and monitoring. At the same time, cost-reducing scaling effects for large plants have a negative impact on the small plant described here.
  • Various options for waste heat utilization are available within the introduced PtM process for oxyfuel glass melting. For CO 2 desorption, the methanation process can be seen as the most suitable option as it provides steam at sufficient temperature and pressure, with no impact on the existing glass industry infrastructure.
  • The resulting low operating costs result in low CO 2 separation costs of 38–39 EUR/t CO 2 . These could be further reduced by described optimization approaches, such as changes in solvent loading, the use of advanced solvents, and/or advanced CO 2 absorption processes.
Further studies should start with these optimization approaches and can thus provide a basis for later cost-efficient experiments on real glass melting plants.

Author Contributions

Conceptualization, S.G.; methodology, S.G. and T.M.-S.; software, S.G., T.M.-S., G.S. and M.S.; validation, S.G. and T.M.-S.; formal analysis, S.G. and M.S.; investigation, S.G.; resources, M.G., G.S. and M.S.; data curation, S.G. and T.M.-S.; writing—original draft preparation, S.G. and T.M.-S.; writing—review and editing, T.M.-S., M.G., G.S. and M.S.; visualization, S.G.; supervision, M.G., G.S. and M.S.; project administration, M.G., G.S. and M.S.; funding acquisition, M.G., G.S. and M.S. All authors have read and agreed to the published version of the manuscript.

Funding

This research was funded by a scholarship from the Nagelschneider Foundation, Munich. The authors would like to acknowledge the financial support received from the Nagelschneider Foundation.

Acknowledgments

Christian Schuhbauer of MAN Energy Solutions SE, Germany, should be thanked for their valuable advice on methanation reactor designs, energetic analysis, and cost evaluations. The authors would also like to thank Bernhard Lattner and Rudolf Steiner of Kelvion Ltd., Austria, for their contribution on flue gas heat exchanger design and cost evaluation. We would also like to thank Jörg Mehrer and the Mehrer Compression GmbH for the valuable advice on CO 2 compressor design and evaluation.

Conflicts of Interest

The authors declare no conflict of interest.

Appendix A

Figure A1. Quarterly development of the ProcessNet—Chemical Plant Price Index Germany since 2008.
Energies 16 02140 g0a1

References

  1. Scalet, B.M.; Garcia Muñoz, M.; Sissa Aivi, Q.; Roudier, S.; Luis, D.S. Best Available Techniques (BAT) Reference Document for the Manufacture of Glass; Publication Office of the Eurpoean Union: Luxembourg, 2013; p. 485. [Google Scholar] [CrossRef]
  2. Schmitz, A.; Kamiński, J.; Maria Scalet, B.; Soria, A. Energy consumption and CO2 emissions of the European glass industry. Energy Policy 2011, 39, 142–155. [Google Scholar] [CrossRef]
  3. Rio, D.D.F.D.; Sovacool, B.K.; Foley, A.M.; Griffiths, S.; Bazilian, M.; Kim, J.; Rooney, D. Decarbonizing the glass industry: A critical and systematic review of developments, sociotechnical systems and policy options. Renew. Sustain. Energy Rev. 2022, 155, 111885. [Google Scholar] [CrossRef]
  4. Deutsche Emissionshandelsstelle (DEHSt). Treibhausgasemissionen 2021. Emissionshandelspflichtige Stationäre Anlagen und Luftverkehr in Deutschland (VET-Bericht 2021); DEHst im Umweltbundesamt: Berlin, Germany, 2022. [Google Scholar]
  5. Zier, M.; Pflugradt, N.; Stenzel, P.; Kotzur, L.; Stolten, D. Industrial decarbonization pathways: The example of the German glass industry. Energy Convers. Manag. X 2023, 17, 100336. [Google Scholar] [CrossRef]
  6. Zier, M.; Stenzel, P.; Kotzur, L.; Stolten, D. A review of decarbonization options for the glass industry. Energy Convers. Manag. X 2021, 10, 100083. [Google Scholar] [CrossRef]
  7. Wesseling, J.H.; Lechtenböhmer, S.; Åhman, M.; Nilsson, L.J.; Worrell, E.; Coenen, L. The transition of energy intensive processing industries towards deep decarbonization: Characteristics and implications for future research. Renew. Sustain. Energy Rev. 2017, 79, 1303–1313. [Google Scholar] [CrossRef]
  8. Gärtner, S.; Rank, D.; Heberl, M.; Gaderer, M.; Dawoud, B.; Haumer, A.; Sterner, M. Simulation and techno-economic analysis of a power-to-hydrogen process for oxyfuel glass melting. Energies 2021, 14, 8603. [Google Scholar] [CrossRef]
  9. NRW Energy 4 Climate. HyGlas Project. 2022. Available online: https://www.energy4climate.nrw/themen/best-practice/hyglass (accessed on 17 February 2022).
  10. Glass International. NSG to Test Hydrogen Fuel for Glassmaking at St Helens Site. 2020. Available online: https://www.glass-international.com/news/nsg-to-use-hydrogen-fuel-for-glassmaking-at-st-helens-site (accessed on 17 February 2022).
  11. Bundesminsterium für Bildung und Forschung (BMBF); Projekte: Kopernikus-Projekt: P2X. 2022. Available online: https://www.kopernikus-projekte.de/projekte/p2x (accessed on 17 February 2022).
  12. Howarth, R.W.; Jacobson, M.Z. How green is blue hydrogen? Energy Sci. Eng. 2021, 9, 1676–1687. [Google Scholar] [CrossRef]
  13. Bauer, C.; Treyer, K.; Antonini, C.; Bergerson, J.; Gazzani, M.; Gencer, E.; Gibbins, J.; Mazzotti, M.; McCoy, S.T.; McKenna, R.; et al. On the climate impacts of blue hydrogen production. Sustain. Energy Fuels 2021, 6, 66–75. [Google Scholar] [CrossRef]
  14. Thema, M.; Bauer, F.; Sterner, M. Power-to-Gas: Electrolysis and methanation status review. Renew. Sustain. Energy Rev. 2019, 112, 775–787. [Google Scholar] [CrossRef]
  15. Sterner, M.; Specht, M. Power-to-Gas and Power-to-X—The History and Results of Developing a New Storage Concept. Energies 2021, 14, 6594. [Google Scholar] [CrossRef]
  16. Conradt, R. The industrial glass melting process. In The SGTE Casebook: Thermodynamics at Work; Hack, K., Ed.; Elsevier: Amsterdam, The Netherlands, 2008; Chapter II.24; pp. 282–303. [Google Scholar]
  17. Brenner, W.; Weig, M.; Schott AG, Business Unit Tubing, Mitterteich, Germany. Personal communication, 2022.
  18. Ghaib, K.; Ben-Fares, F.Z. Power-to-Methane: A state-of-the-art review. Renew. Sustain. Energy Rev. 2018, 81, 433–446. [Google Scholar] [CrossRef]
  19. Sterner, M.; Stadler, I. Handbook of Energy Storage: Demand, Technologies, Integration; Springer: Berlin/Heidelberg, Germany, 2018. [Google Scholar]
  20. Miller, H.A.; Bouzek, K.; Hnat, J.; Loos, S.; Bernäcker, C.I.; Weißgärber, T.; Röntzsch, L.; Meier-Haack, J. Green hydrogen from anion exchange membrane water electrolysis: A review of recent developments in critical materials and operating conditions. Sustain. Energy Fuels 2020, 4, 2114–2133. [Google Scholar] [CrossRef]
  21. Siemens Energy. Hydrogen Solutions-Renewable Energy-Siemens Energy Global. 2022. Available online: https://www.siemens-energy.com/global/en/offerings/renewable-energy/hydrogen-solutions.html (accessed on 17 February 2022).
  22. Hassan, I.A.; Ramadan, H.S.; Saleh, M.A.; Hissel, D. Hydrogen storage technologies for stationary and mobile applications: Review, analysis and perspectives. Renew. Sustain. Energy Rev. 2021, 149, 111311. [Google Scholar] [CrossRef]
  23. Gamisch, B.; Gaderer, M.; Dawoud, B. On the Development of Thermochemical Hydrogen Storage: An Experimental Study of the Kinetics of the Redox Reactions under Different Operating Conditions. Appl. Sci. 2021, 11, 1623. [Google Scholar] [CrossRef]
  24. Teichmann, D.; Arlt, W.; Wasserscheid, P.; Freymann, R. A future energy supply based on Liquid Organic Hydrogen Carriers (LOHC). Energy Environ. Sci. 2011, 4, 2767–2773. [Google Scholar] [CrossRef]
  25. Linde AG. Liquid Air Oxygen Storage. 2022. Available online: https://www.linde-gas.de/shop/de/de-ig/fluessigluftenergiespeicherung (accessed on 2 February 2022).
  26. Götz, M.; Lefebvre, J.; Mörs, F.; Koch, A.M.; Graf, F.; Bajohr, S.; Reimert, R.; Kolb, T. Renewable Power-to-Gas: A technological and economic review. Renew. Energy 2016, 85, 1371–1390. [Google Scholar] [CrossRef] [Green Version]
  27. Rachow, F. Prozessoptimierung für die Methanisierung von CO2. Ph.D. Dissertation, Brandenburgischen Technischen Universität Cottbus–Senftenberg, Cottbus, Germany, 2017. [Google Scholar]
  28. Fleige, M. Direkte Methanisierung von CO2 aus dem Rauchgas Konventioneller Kraftwerke; Springer: Berlin/Heidelberg, Germany, 2015. [Google Scholar] [CrossRef]
  29. Conradt, R. Prospects and physical limits of processes and technologies in glass melting. J. Asian Ceram. Soc. 2019, 7, 377–396. [Google Scholar] [CrossRef] [Green Version]
  30. Bui, M.; Adjiman, C.S.; Bardow, A.; Anthony, E.J.; Boston, A.; Brown, S.; Fennell, P.S.; Fuss, S.; Galindo, A.; Hackett, L.A.; et al. Carbon capture and storage (CCS): The way forward. Energy Environ. Sci. 2018, 11, 1062–1176. [Google Scholar] [CrossRef] [Green Version]
  31. Zerobin, F.; Bertsch, O.; Penthor, S.; Pröll, T. Concept Study for Competitive Power Generation from Chemical Looping Combustion of Natural Gas. Energy Technol. 2016, 4, 1299–1304. [Google Scholar] [CrossRef]
  32. ClimeWorks AG. Direct Air Capture Technology and Carbon Removal. 2022. Available online: https://climeworks.com/direct-aircapture(accessed on 2 February 2022).
  33. Davidson, R.M. Post-Combustion Carbon Capture from Coal Fired Plants—Solvent Scrubbing; IEA Clean Coal Centre: London, UK, 2007. [Google Scholar]
  34. Shan, Z.; Shujuan, W.; Chenchen, S.; Changhe, C. SO2 effect on degradation of MEA and some other amines. Energy Procedia 2013, 37, 896–904. [Google Scholar] [CrossRef] [Green Version]
  35. Kuramochi, T.; Ramírez, A.; Turkenburg, W.; Faaij, A. Comparative assessment of CO2 capture technologies for carbon-intensive industrial processes. Prog. Energy Combust. Sci. 2012, 38, 87–112. [Google Scholar] [CrossRef]
  36. Schuhbauer, C.; MAN Energy Solutions SE, Deggendorf, Germany. Personal communication, 2022.
  37. Lattner, B.; Steiner, R.; Kelvion GmbH, Heat Exchanger, Gaspoltshofen, Austria. Personal communication, 2022.
  38. Weißert, T.; Luehr Filter GmbH, Technology Management, Stadthagen, Germany. Personal communication, 2022.
  39. Roger, U.; Conradt, R. Schlussbericht IGF Vorhaben: Effiziente Abgasreinigung von Boro-Silicatglas-Schmelzanlagen; Technical Report; Hüttentechnische Vereinigung der Glasindustrie (HVG) e.V.: Offenbach, Germany, 2014. [Google Scholar]
  40. Goodwin, D.G.; Speth, R.L.; Moffat, H.K.; Weber, B.W. Cantera: An Object-Oriented Software Toolkit for Chemical Kinetics, Thermodynamics, and Transport Processes. Version 2.5.1. 2021. Available online: https://www.cantera.org (accessed on 22 February 2022).
  41. Smith, G.P.; Golden, D.M.; Frenklach, M.; Moriarty, N.W.; Eiteneer, B.; Goldenberg, M.; Bowman, C.T.; Hanson, R.K.; Song, S.; Gardiner, W.C.; et al. GRI-MECH 3.0. Available online: http://combustion.berkeley.edu/gri-mech/version30/text30.html#cite (accessed on 11 February 2022).
  42. Marx-Schubach, T.; Schmitz, G. Modeling and simulation of the start-up process of coal fired power plants with post-combustion CO2 capture. Int. J. Greenh. Gas Control. 2019, 87, 44–57. [Google Scholar] [CrossRef]
  43. Abu-Zahra, M.R.; Schneiders, L.H.; Niederer, J.P.; Feron, P.H.; Versteeg, G.F. CO2 capture from power plants. Part I. A parametric study of the technical performance based on monoethanolamine. Int. J. Greenh. Gas Control. 2007, 1, 37–46. [Google Scholar] [CrossRef]
  44. Mellapak and MellapakPlus; Sulzer Ltd.: Winterthur, Switzerland, 2022. Available online: https://www.sulzer.com/en/shared/products/mellapak-and-mellapakplus (accessed on 20 February 2023).
  45. Bravo, J.L.; Rocha, J.A.; Fair, J.R. Mass Transfer in Gauze Packings. Hydrocarb. Process. 1985, 64, 91–95. [Google Scholar]
  46. Bravo, J.L.; Rocha, J.A.; Fair, J.R. A comprehensive model for the performance of columns containing structured packings. Inst. Chem. Eng. Symp. Ser. 1992, 129, A439–A657. [Google Scholar]
  47. Chilton, T.H.; Colburn, A.P. Mass Transfer (Absorption) Coefficients: Prediction from Data on Heat Transfer and Fluid Friction. Ind. Eng. Chem. 1934, 26, 1183–1187. [Google Scholar] [CrossRef]
  48. Agbonghae, E.O.; Hughes, K.J.; Ingham, D.B.; Ma, L.; Pourkashanian, M. Optimal Process Design of Commercial-Scale Amine-Based CO2 Capture Plants. Ind. Eng. Chem. Res. 2014, 53, 14815–14829. [Google Scholar] [CrossRef]
  49. Abu-Zahra, M.R.; Niederer, J.P.; Feron, P.H.; Versteeg, G.F. CO2 capture from power plants: Part II. A parametric study of the economical performance based on mono-ethanolamine. Int. J. Greenh. Gas Control. 2007, 1, 135–142. [Google Scholar] [CrossRef]
  50. Kuramochi, T.; Faaij, A.; Ramírez, A.; Turkenburg, W. Prospects for cost-effective post-combustion CO2 capture from industrial CHPs. Int. J. Greenh. Gas Control. 2010, 4, 511–524. [Google Scholar] [CrossRef]
  51. Hendriks, C.; Crijns-Graus, W.H.J.; van Bergen, F. Global Carbon Dioxide Storage Potential and Costs. Ecofys, Rijksinstituut voor Volksgezondheid en Milieu. 2004. Available online: https://www.researchgate.net/publication/260095614 (accessed on 3 October 2022).
  52. Mehrer, J.; Mehrer Compression GmbH, Rosenfelder Strasse 35, 72336 Balingen, Germany. Personal communication, 2022.
  53. Peters, M.; Timmerhaus, K.; West, R. Plant Design and Economics for Chemical Engineers; McGraw-Hill Chemical Engineering Series; McGraw-Hill Education: New York, NY, USA, 2003. [Google Scholar]
  54. Indeed.com. Maintainance Labour Vages in Germany Based on 2600 Average Salerys in Relevant Industries. 2022. Available online: https://https://de.indeed.com/career/mitarbeiter-instandhaltung/salaries (accessed on 22 February 2022).
  55. Stepstone. Stepstone Gehaltsreport 2021-Deutschland. 2022. Available online: https://www.stepstone.de/Ueber-StepStone/wp-content/uploads/2021/02/StepStone-Gehaltsreport-2021.pdf (accessed on 20 December 2022).
  56. DECHEMA; VDI-ECG. ProcessNet-ProcessNet Chemieanlagenindex Deutschland PCD. 2022. Available online: https://processnet.org/pcd.html (accessed on 22 February 2022).
  57. Lühe, C. Modulare Kostenschätzung als Unterstützung der Anlagenplanung für die Angebots- und frühe Basic Engineering Phase. Ph.D. Dissertation, Faculty for Process Engineering, Technical University of Berlin, Berlin, Germany, 2012. [Google Scholar]
  58. Ripperger, S.; Nikolaus, K. Entwicklung und Planung Verfahrenstechnischer Anlagen; VDI-Buch; Springer: Berlin/Heidelberg, Germany, 2020. [Google Scholar]
  59. Singh, D.; Croiset, E.; Douglas, P.L.; Douglas, M.A. Techno-economic study of CO2 capture from an existing coal-fired power plant: MEA scrubbing vs. O2/CO2 recycle combustion. Energy Convers. Manag. 2003, 44, 3073–3091. [Google Scholar] [CrossRef]
  60. Gorre, J.; Ruoss, F.; Karjunen, H.; Schaffert, J.; Tynjälä, T. Cost benefits of optimizing hydrogen storage and methanation capacities for Power-to-Gas plants in dynamic operation. Appl. Energy 2020, 257, 113967. [Google Scholar] [CrossRef]
  61. Closmann, F.; Nguyen, T.; Rochelle, G.T. MDEA/Piperazine as a solvent for CO2 capture. Energy Procedia 2009, 1, 1351–1357. [Google Scholar] [CrossRef] [Green Version]
  62. Leung, D.Y.; Caramanna, G.; Maroto-Valer, M.M. An overview of current status of carbon dioxide capture and storage technologies. Renew. Sustain. Energy Rev. 2014, 39, 426–443. [Google Scholar] [CrossRef] [Green Version]
  63. Aromada, S.A.; Eldrup, N.H.; Normann, F.; Øi, L.E. Techno-Economic Assessment of Different Heat Exchangers for CO2 Capture. Energies 2020, 13, 6315. [Google Scholar] [CrossRef]
  64. Øi, L.E.; Brathen, T.; Berg, C.; Brekne, S.K.; Flatin, M.; Johnsen, R.; Moen, I.G.; Thomassen, E. Optimization of Configurations for Amine based CO2 Absorption Using Aspen HYSYS. Energy Procedia 2014, 51, 224–233. [Google Scholar] [CrossRef] [Green Version]
Figure 1. Simplified flow sheet of the integration of power-to-methane (PtM) into oxyfuel glass melting processes.
Energies 16 02140 g001
Figure 2. (a) Flowsheet for the conceptual integration of a CO 2 separation processes in glass melting systems. (b) Principal flow sheet of the components of a CO 2 absorption plant with an amine-based solvent.
Energies 16 02140 g002
Figure 3. Sankey diagram of a tubular bundle methanation reactor [36].
Energies 16 02140 g003
Figure 4. Main flow sheet overview of Aspen Plus Model used for the simulation.
Energies 16 02140 g004
Table 1. Key figures of the melting system investigated in [39].
ParameterValue
Melting technologyOxyfuel
Operating temperature1600 °C
Thermal power6.08 MW
FuelNatural gas H
Glass typeborosilicate
Nominal pull rate40 t/d
Operating hours8760 h/year
Table 2. Flue gas composition and properties for the examination of the CO 2 absorption plant. Based on the experimental results of [39], additional properties are calculated using [40,41]. STP = standard temperature and pressure conditions (0 °C; 1.0135 bar). Numbers of gas compositions refer to Figure 2. ➀ raw gas before flue gas treatment. ➁ cleaned gas after flue gas treatment unit, entering the CO 2 separation process. ➂ clean gas composition after CO 2 separation.
PropertiesUnitRaw GasClean GasClean Gas
Rich on CO 2 Lean on CO 2
Temperature°C47022626
Volume flow rate:
 - Drym 3 /h478069104290
 - Wetm 3 /h591080204437
Density at STPkg/m 3 1.2661.2681.161
Spec. heat capacity ( c p )J/(kg·K)1219.21138.41022.5
Composition
H 2 OVol%19.113.82.3
O 2 Vol%19.820.524.8
CO 2 Vol%11.37.00.8
N 2 Vol%49.858.771.1
Trace Substances
Dustmg/m 3 14820.3-
HClmg/m 3 2.60.2-
HFmg/m 3 72.70.5-
SO 2 mg/m 3 19.08.1-
Table 3. Assumed design parameters of amine scrubbing plant.
ParameterValue
Solvent temperature at absorber inlet35 °C
MEA-concentration30 w. %
Desorber pressure2 bar
Absorber flue gas outlet pressure1 bar
CO 2 product temperature25 °C
Washing fluid temperature25 °C
Desorber solvent inlet temperature105 °C
Carbon capture rate (set point)90%
Table 4. Operation parameter of the designed CO 2 absorption plant. All parameters are based on [49], unless indicated otherwise. * Own simulations.
ParameterValue
Specific desorption heat demand928 kWh/t CO 2
Reboiler heat power915 kW
Life time20 years
Operating hours8688 h/year
MEA degradation rate1.5 kg/t CO 2
Cooling water make up1.0 m 3 / GJ thermal
Water cooler duty640 kW
CO 2 product temperature26 °C
CO 2 product pressure2 bar
CO 2 emissions before [8]9601 t CO 2 /year
CO 2 separation rate90%
CO 2 avoided *8641 t CO 2 /year
CO 2 emissions after *960 t CO 2 /year
Table 5. Assumptions for cost calculations of CO 2 absorption plant. All parameters are based on [49], unless indicated otherwise.
ParameterValue
Interest rate5.0% p.a.
Maintenance cost4.0% of FCI
MEA price1000 EUR/t
Cooling water cost0.20 EUR/m 3
Operating labor cost, based on [54,55]45.00 EUR/h
Electricity costs [8]0.12 EUR/kWh
Table 6. Major simulation results for the design of the amine scrubbing plant.
ParameterValue
Absorber diameter0.95 m
Desorber diameter0.5 m
Scrubber diameter0.95 m
Solvent flow rate2.28 kg/s
Heat demand in stripper556.5 kW
Specific heat demand in stripper3.354 MJ/kg CO 2
CO 2 purity99.3%
CO 2 product mass flow0.167 kg/s
Washing fluid temperature25 °C
Desorber solvent inlet temperature105 °C
Carbon capture rate90%
Table 7. Equipment cost calculation. Indicators (Ind.) refer to Figure 2b for the easier identification of equipment. * Remaining heat exchanger and pumps with less significant influence on the total component costs.
Ind.EquipmentTypeExponentReference PlantOwn Plant
m G r k r in millions of EURG k e in EUR
COL 2AbsorberColumn0.60 [57]12,560 m 3 10.9439.25 m 3 340,000
COL 4StripperColumn0.60 [57]3391 m 3 3.438.75 m 3 110,000
Cold water pumpPump, reciprocating0.34 [53]1.21 m 3 /s2.040.0015 m 3 /s21,000
PUM 1BlowerBlower, centrifugal0.59 [53]485.44 m 3 /s3.102.236 m 3 /s13,000
COL 1Flue gas coolerColumn0.60 [53]1570 m 3 0.544.75 m 3 17,000
Others *mixed--3.89-20,000
Total equipment cost:23.94 521,000
CO 2 compressorCompressor, rotary, 31.49 m 3 /s31.730.07761 m 3 /s120,000
two stage  [52] 0.167 kg/s
Table 8. Total capital investment (CAPEX) for MEA CO 2 separation plant.
Range [53]UsedCost
%%EUR
Direct cost
  Inside battery limit (ISBL) cost
  Total equipment cost (EC)--521,000
  Installation25–5525130,250
  Instrumentation and control8–50841,680
  Pipes20–8020104,200
  Electrical equipment15–301578,150
Total ISBL:875,250
Outside battery limit (OSBL) cost
  Building and building services10–80526,050
  Yard improvements10–20526,050
  Service facilities30–801052,100
Total OSBL:104,200
Total direct cost:979,480
Indirect cost
  Engineering101052,100
  Construction expenses101052,100
  Contractor’s fee0.50.52605
  Contingency171788,570
Total indirect cost:106,805
CO 2 compressor equipment [52] 120,000
Fixed capital investment (FCI):1,155,285
Working investment12–2812136,634
Start-up cost and MEA cost8–10892,423
Price index correction (2007–2022);% of 21.5248,386
total direct and indirect cost
Total capital investment (CAPEX):1,634,278
Table 9. Total operating expenditures (OPEX) for MEA CO 2 separation plant. Ranges are from [53], others are named.
RangeUsedCost
%%EUR/Year
Fixed charge
  Local taxes1.0–4.0% of FCI1.0%12,063
  Insurance0.5–1.0 % of FCI0.5%6031
18,094
Direct production cost
  Cooling water 4003
  MEA makeup  [49] 1.5 kg/t CO 2 14,401
  Maintenance (M)1.0–10% of FCI1.0%12,063
  Operating labor (OL) [54]0.1 job/shift45 EUR/h39,096
  Supervision and support labor (S)30% of total labor cost30%11,729
  Operating supplies15% of maintenance15%1809
  Laboratory charges10–20% of operating labor10%3910
87,012
Plant overhead cost50–70% of M + OL + S50%31,444
General expenses
  Administrative cost15–20% of OL15%5864
  Distribution and marketing2–20% of OPEX2%2848
  Research and development cost2–20% of OPEX2%2848
Total operating expenditures (OPEX):148,111
Table 10. Waste heat potential of the methanation reactor equipment. HP = high pressure and temperature; LP = low pressure and temperature.
Reference PointPower
MW
Thermal powerHeating value of SNG6.08
HP-steam45 bar, 260 °C1.09
LP-steam30 bar, 240 °C0.12
Power lossHeat losses0.30
Methanation reactorCombined7.60
Table 11. Calculation of CO 2 separation costs for different waste heat utilization options. EAC = equivalent annual costs of CAPEX.
Specific CostTotal Cost
EUR/Year
EAC of CAPEX 189 EUR/(t CO 2 ·year)134,895
OPEX 146,440
Electricity for CO 2 compression0.12 EUR/kWh4,95 EUR/t CO 2 42,745
Fixed costs:325,751
Heat supply cost options
  1. Methanation reactor0.0004 EUR/kWh0.37 EUR/t CO 2 3207
Total annual costs:328,958
CO 2 separation cost:38.07 EUR/t CO 2
  2. Flue gas heat exchanger
      conventional steel
0.0007 EUR/kWh0.65 EUR/t CO 2 6235
Total annual costs:331,986
CO 2 separation cost:38.42 EUR/t CO 2
  3. Flue gas heat exchanger
      stainless steel
0.0010 EUR/kWh0.93 EUR/t CO 2 8908
Total annual costs:334,659
CO 2 separation cost:38.73 EUR/t CO 2
Disclaimer/Publisher’s Note: The statements, opinions and data contained in all publications are solely those of the individual author(s) and contributor(s) and not of MDPI and/or the editor(s). MDPI and/or the editor(s) disclaim responsibility for any injury to people or property resulting from any ideas, methods, instructions or products referred to in the content.