1. Introduction
Public transportation by trams is a popular way to get around the city. Recently, there has been an intensive expansion of tram infrastructure in cities around the world, from Asia [
1] to North America [
2] to Europe [
3,
4,
5] and Australia [
6]. In Poland, trams are currently operating in 15 cities: Bydgoszcz, Częstochowa, Elbląg, Gdańsk, Gorzów Wielkopolski, Grudziądz, Kraków, Olsztyn, Poznań, Szczecin, Toruń, Warsaw, Łódź, Wrocław and Katowice. Trams have a role beyond transportation; they are also a city-forming factor. Along with the construction of tram lines, the philosophy of the functioning of urban areas is changing; they are being adapted more for pedestrians, as trams influence the reduction of car traffic in cities. The tram infrastructure is adapted to the urban fabric in the form of its architecture. Almost 86 km of new tram routes have been built since 2004, when Poland joined the European Union. The fastest tram route in Poland is the Poznań Fast Tram, on the route whose current exploitation speed is 70 km/h, and most of the trams there travel at this speed. The average speed of these vehicles is 20.8 km/h, which is related to stops at stops. There are a total of nine stops including the final loop, the route is 8.1 km long, and it is virtually collision-free.
With the development of smart cities, intelligent transport systems [
7,
8] are being developed to improve traffic flow [
9], improve road safety, and reduce congestion. New digital technologies, ranging from driver assistance systems [
10] to autonomous driving, are increasingly being used in trams [
11,
12]. In 2014, the Society of Automotive Engineers International (SAE) classified six levels of driving automation, from the most basic systems (level 0) to a 100% autonomous driving one (level 6) [
13,
14]. Habib at all in [
13] presents a state-of-the-art model of levels of automation by comparing different transport industries. Grades/Levels of Automation in automotive, aeronautics, maritime, and railway systems are presented and compared with each other. Then, defining the allocation of driving tasks among tram drivers and assistance systems, Grades of Automation (GoA) for trams are proposed. Di Palma et al., in [
14], provide an overview of the capabilities of advanced driver assistance systems (ADASs) by the automotive sector, and assess the feasibility of transferring them to trams, with the ultimate aim of increasing their level of safety and automation.
Systems supporting the tram driver’s work have been the subject of many publications. The authors of article [
11] presented a technique for detecting, recognizing, and tracking pedestrians, vehicles, and cyclists along the tram infrastructure in a complex urban environment using computer vision, deep learning, and the YOLOv3 algorithm. In paper [
15], on the other hand, the authors demonstrated a system to detect and track obstacles using a multilayer laser scanner. Konieczka et al., in [
16], presented a thermal camera-based system for tram drivers to increase the safety of tram traffic at night. In contrast, article [
17] presents a monitoring system to reduce the risk of the unconsciousness of the driver (commonly referred to as a “dead-man device”). La Delfa et al., in [
18], described an eco-driving assistance system designed to reduce energy consumption. Meanwhile, the authors of article [
19] developed a special mathematical model of tram propulsion to analyze the energy consumption of a tram depending on the driving style of the tram driver.
Trams usually operate under very complex conditions, with other rail vehicles, cars, buses, bicycles, and pedestrians in constant motion. Traffic is controlled by traffic lights at critical points. Driving a tram generally requires vision and hearing to drive the vehicle at a certain speed, stop at scheduled stops along the route and at other locations that require it, pay attention to passenger boarding and alighting, and respond quickly to unexpected situations or emergencies.
An experienced tram driver is able to handle most situations intuitively. On the other hand, a partially or fully autonomous tram “does not get tired”, can react faster than a human, and can have a wider field of perception. In prototype trams, sensors replace eyes and ears, and behavioral and response pattern recognition models are being implemented in tram control programs. However, human intuition and experience can only be standardized to a limited range, since not every situation can be predicted. On the one hand, systems are being developed to support tram drivers, and, on the other, there is a gradual move towards automating tram driving, but this is a long-term process.
Rapid braking and acceleration when starting and traveling at too high a speed cause overloads that are uncomfortable for passengers. In addition, rapid acceleration consumes a large amount of electrical energy [
18,
19] that (even in the newest trams) is not fully recovered. Therefore, one way to reduce energy consumption and improve passenger comfort is to monitor and limit the accelerations that affect passengers. This also promotes less wear and tear on the tram (wheel rims, pantographs, structural material fatigue) and infrastructure components (tracks, trackbed).
In view of the above, continuous training of tram drivers is important. Meanwhile, typical tram driver training is conducted using trams for driving lessons and is very limited in time. Moreover, there are practically no courses to improve the skills of tram drivers. Paying attention to correctness (smoothness of driving) requires additional personnel (instructors or experienced tram drivers), which increases costs. Therefore, it is advisable to develop an inexpensive device that allows tram drivers to verify their driving technique themselves. There are currently no such devices on the market. To the best of the authors’ knowledge, there has been no research into the feasibility of measuring acceleration and jerk and how this can be used to support tram drivers in learning to travel smoothly and safely.
Only in article [
2] were presented the results of a study on the smoothness of the ride of a tram driver, but they were obtained in a virtual reality environment rather than in real life. Callari et al., in [
2], presented a virtual tram simulator built and a haptically enhanced main controller lever developed to support drivers in achieving smooth and safe tram journeys. Unfortunately, the simulations showed that the haptic master controller and coupled viscosity feedback algorithm did not increase the smoothness of the ride. However, the drivers indicated that they would prefer a smoother ride and would like to be able to inform, control, and evaluate their tram driving technique [
2].
The aim of the paper, and also an original achievement of the authors, is to develop a prototype system that provides tram drivers with the ability to verify their driving technique and, consequently, reduce energy consumption. Furthermore, the aim of the paper is also to analyze the energy consumption of a tram depending on the way it is driven. The paper is organized as follows.
Section 2 describes an experimental study of the influence of the tram driver’s driving technique on the tram’s energy consumption.
Section 3 describes methods for assessing passenger comfort in rail vehicles according to the EN12299:2009 standard [
20,
21,
22,
23].
Section 4 presents a prototype of the developed Tram Driving Technique Assessment System (TDTAS).
Section 5 includes the results of the research of the authors on the example of a selected section of a tram route with selected trams. The discussion and conclusion are given in
Section 6 and
Section 7, respectively.
Section 7 concludes this article with final comments and future research directions.
2. Tram’s Energy Consumption
The use of modern power electronic systems in trams makes it possible to rationalize the electricity consumption of the tram fleet. Therefore, changing the structure of the rolling stock has a decisive impact on unit energy consumption. However, this article focuses on opportunities to reduce the energy consumption of trams currently in use in the city.
Traction energy consumption depends on many factors. Some of the more important ones are proper control of starting, braking, and coasting by the rail vehicle operator. A skilled tram driver has first and foremost in mind the safety of passengers being transported and other road users. In emergency situations, they do not pay attention to the correct driving technique and may brake violently to avoid danger. Subsequently, they try to ensure the punctual realization of the timetable if conditions allow. However, a smooth driving style (called eco-driving [
20,
21]) is more comfortable for the passenger and can lead to a reduction in the tram’s energy consumption, as verified in the experiment described below.
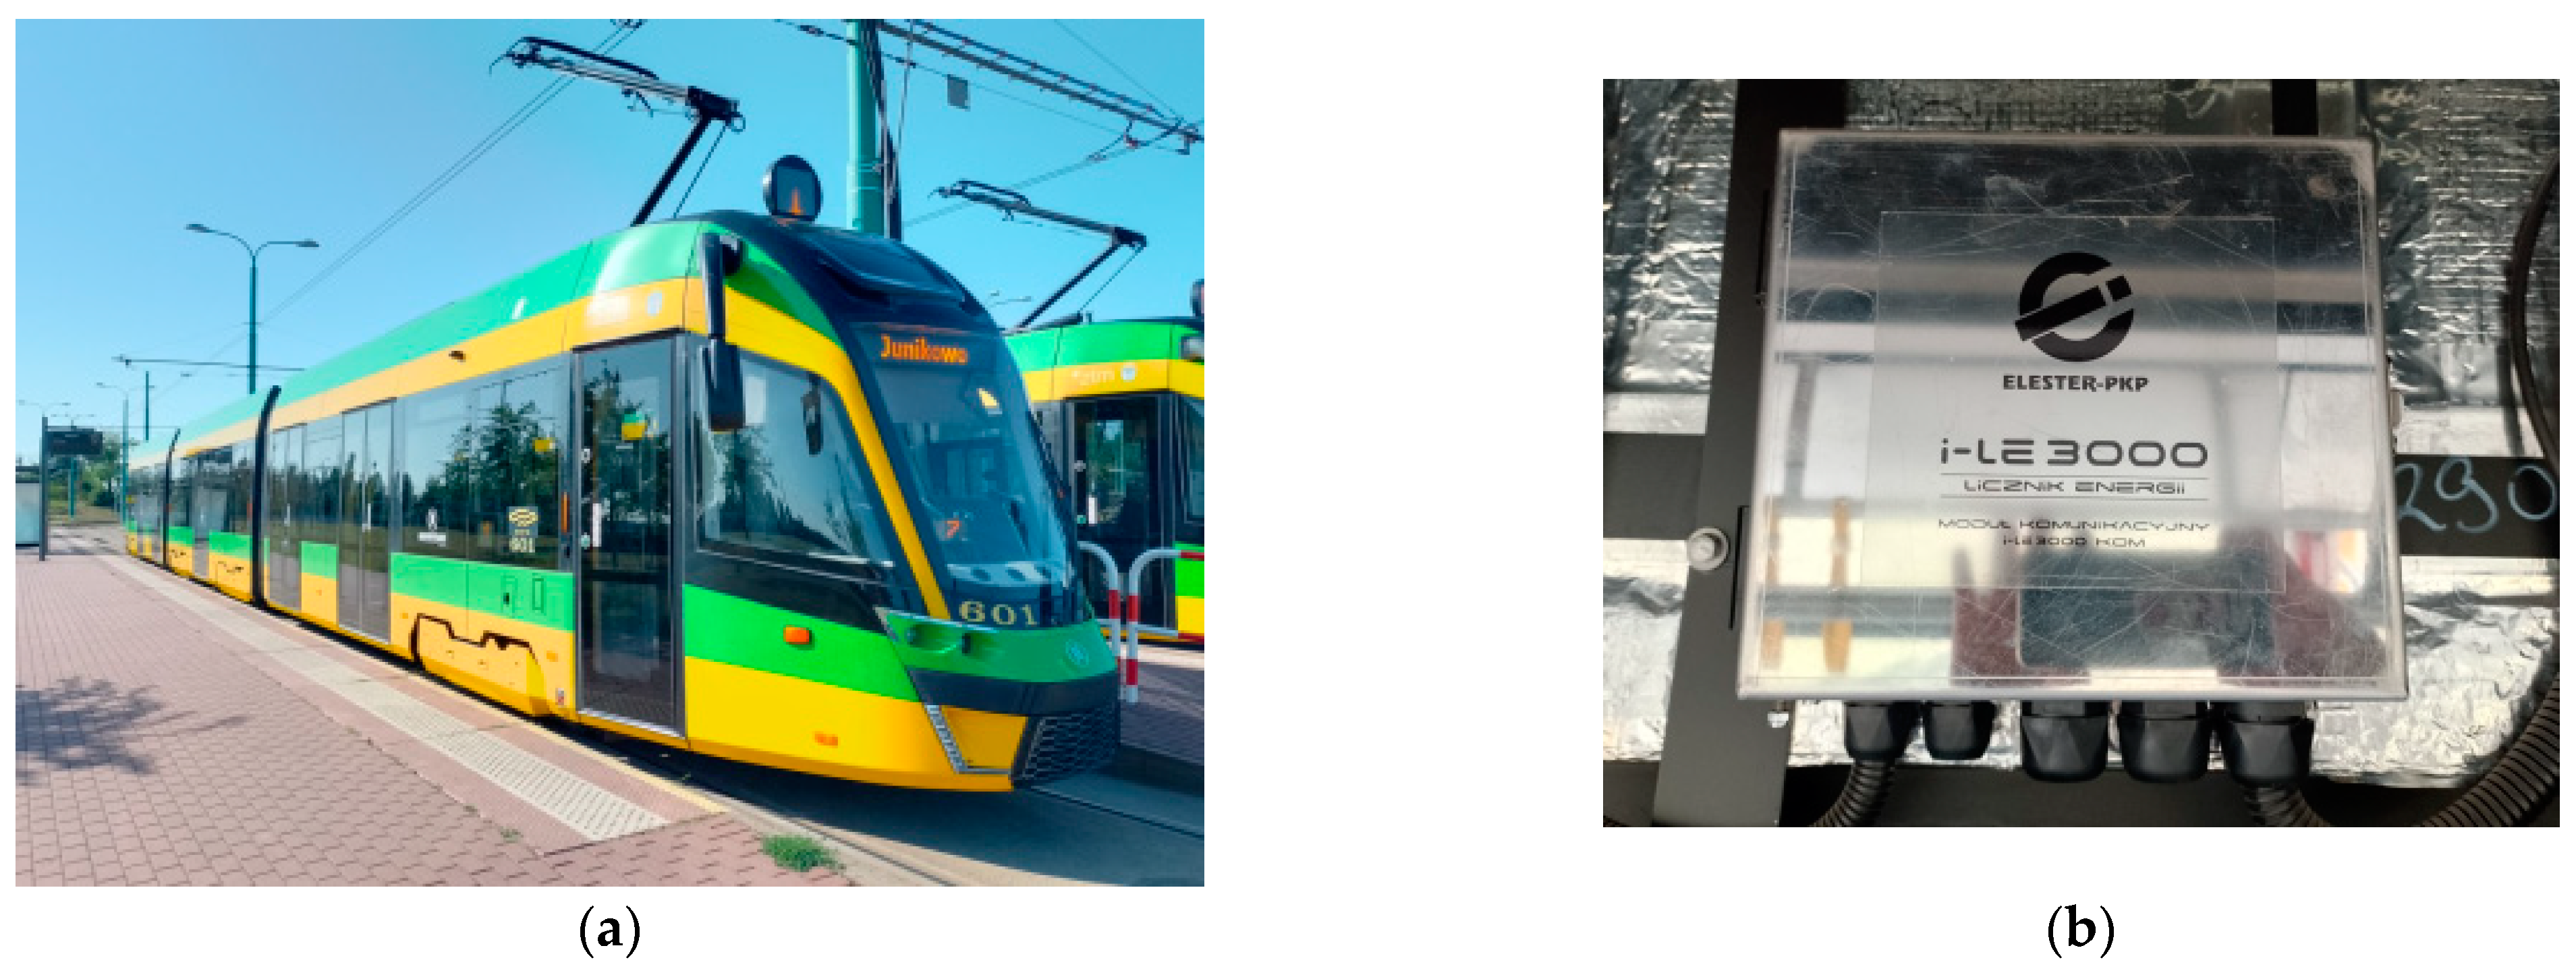
An experiment was conducted to study the electricity consumption of a tram depending on the driving technique of the tram driver. With the permission of the Poznan Municipal Transport Company (MPK Poznan Sp. z o.o., Poznań, Poland), a modern Moderus Gamma LF02AC tram manufactured by Modertrans Poznan was used (
Figure 1a), equipped with a professional ELESTER-PKP i-LE3000 energy consumption meter (
Figure 1b). This tram is equipped with an energy recuperation function—during braking, it gives back to the catenary the current generated by the braking traction motors.
Measurements were taken during normal tram operation with passengers on Line 1 that circles Poznań from the south. This line connects the districts of Junikowo (located at an altitude of 80 m above sea level) and Franowo (83 m above sea level), is 15 km long, and runs entirely on track separated from the roadway. In some sections, it was possible to drive at a maximum speed of up to 70 km/h. The experiment consisted of the same tram driver performing successive courses alternately, either in the smoothest possible way (gentle starting and braking, driving at reduced speed if possible—when it was known that it would not be possible to cross an intersection with traffic lights faster anyway, or when the timetable allowed it), or in the standard way, without paying attention to driving economy. The assumption was that in both cases, he would try to avoid delays. The scheduled time for each of the courses was from 38 to 40 min, and the measurements were made between 4.17 and 13.23. The air temperature ranged from 11 to 23 degrees Celsius, making the air conditioning inside the tram more and more intense (from about 9 a.m.). At the beginning of the experiment and upon reaching the end stops, the amount of energy taken from the grid and returned to the grid was read. The results obtained are summarized in
Table 1.
Analysis of the results shows that it was possible to maintain punctuality using a smooth-running technique. Courses made in a smooth way (taking into account the energy returned to the network) required an average of 3.05 kWh/km to be drawn from the overhead line, whereas courses made in a normal way required 4.31 kW/h/km, proving that it is possible to save as much as 29.2% of the energy drawn.
It should be noted that the overhead catenary is not always able to collect the energy produced by the tram during braking, for example, due to the lack of trams in the vicinity that happen to need a lot of energy to start. That is why the energy extracted without taking recuperation into account was also analyzed. The result calculated in this way allows for an even more precise assessment of the actual impact of the tram driving method on energy consumption. In this case, 3.83 kWh/km would be needed for smooth driving, whereas up to 5.55 kWh/km would be needed for standard driving. This shows that in this case, smooth driving saves up to 31.0% on energy.
A detailed analysis of
Table 1 leads to the conclusion that energy consumption is also significantly affected by the operating air conditioning of the passenger space (measurements were taken in July). During the runs made around noon, energy consumption increased. During four out of five trips to Franowo, power consumption (taking energy recuperation into account) was higher than during trips in the opposite direction—regardless of the driving technique. This may have been due to the difference in height (around 3 m) of the two ends of the route. Lower energy consumption during morning trips was likely due to fewer stops due to many traffic lights being turned off and the low number of passengers carried.
3. Tram Passenger Comfort
Providing passenger comfort is one of the important requirements for modern transport systems, including trams. As tram driving techniques improve, the comfort experienced by passengers increases. Comfort is measured indirectly. The movements of rail vehicles are most often measured using accelerometers and gyroscopes mounted on the vehicle body in specific positions.
The sense of traveling comfort is influenced by numerous stimuli that can be classified into three groups: (1) stimuli of a dynamic nature—these are the accelerations/decelerations acting on passengers in the longitudinal, transverse, and vertical directions, jerks (understood as acceleration/deceleration build-up), and rotational velocities relative to the X, Y, Z axes of the vehicle in which the passenger is located; (2) environmental stimuli— these include ambient temperature, pressure, air quality, ventilation, noise level in the vehicle; (3) spatio-temporal stimuli, e.g., the size and spatial distribution of the passenger compartment, traveling position, legroom, journey time, delay, etc.
Peng et al., in [
22], reviewed the assessment of passenger comfort of the railways according to the sources of discomfort. According to the source of the discomfort, passenger comfort on the train can be divided into static comfort, vibration comfort, noise comfort, thermal comfort, aural pressure comfort, and visual comfort. Among the factors affecting passenger comfort, vibrations and oscillations affecting the human body are by far the most important. For rail vehicles, research on improving vibration comfort has been ongoing for many years. Based on these, indicators and guidelines have been developed to estimate the comfort level of a railway vehicle.
The EN 12299:2009 standard [
23] defines methods for evaluating vibration comfort and its indicators in rail vehicles. However, it cannot be used directly for trams—it is necessary to modify the assumptions of the test method (e.g., driving speed) [
24]. Depending on the results obtained, it is possible to assess by means of a given indicator whether, for example, a rail vehicle is comfortable or uncomfortable for the passenger. The following comfort indicators can be distinguished [
23,
25,
26]:
- -
Average comfort: average lasting feeling evaluated using the indices NMV (mean comfort standard method), NVA, and NVD (mean comfort complete method). Average comfort is assessed by continuous measurement over a long measuring distance; accelerations are measured in three directions (the longitudinal (X-axis), lateral (Y-axis), and vertical (Z-axis)) in two ways: on the vehicle floor (basic method, in which the NMV index is determined), and on the floor and the other points of contact (precise method, in which the NVD indices are determined, floor, and NVA, other points)—for standing and sitting positions.
- -
Continuous comfort: sensations evaluated during a certain period of time using the indices CCx, CCy, and CCz (continuous comfort). Continuous comfort is assessed on the basis of effective acceleration values determined over short time intervals (5 s as standard); accelerations are measured in three directions on the vehicle floor.
- -
Comfort during rail vehicle running in a curve: discomfort experienced during entering a curve or experienced during running in opposite curves by means of the index PCT (comfort on curve transitions). The comfort on the transition curves is determined when the rail vehicle passes through the transition curves; acceleration and jerk measurements are taken in the transverse direction, and a measurement of the roll rate, the quasi-static acceleration when passing through the transition curves, is determined.
- -
Comfort during discrete events: discomfort experienced based on transient vibrations on a straight track and in curves for the index PDE (comfort on discrete events). Comfort during discrete events is determined to describe the effect of momentary events (changes in speed, jerking, etc.); accelerations are measured on the floor of the vehicle in the transverse direction.
The average and continuous comfort indices are calculated using the root mean square of the longitudinal, lateral, and vertical carbody acceleration, i.e.,
aX,
aY, and
aZ. These are determined as follows:
where
Wi denotes the weighted frequency values according to the weighting curve
i (
i =
b,
c,
d) in directions:
b—vertical,
c—longitudinal (backrest),
d—lateral/longitudinal;
j is the measuring position;
P is the floor interface,
A is the seat pan interface,
D is the seat back interface;
T is a measurement time of 5 s and
t is a multiple of this time,
,
,
denote acceleration values measured in the longitudinal, lateral, and vertical directions, respectively.
The mean comfort index
NMV is defined as the 95th percentile of five-minute frequency weighted rms values of the accelerations. The formula for the
NMV index is as follows:
where 95th is a centile of the rms values of the accelerations sampled every 5 s during the 5 min measurement.
Another type of comfort defined by the EN 12299:2009 standard [
23] is continuous comfort. It is determined by the rms values of the accelerations measured at the floor level for the
X,
Y, and
Z directions. The continuous comfort indices’ values,
CCx(
t),
CCy(
t), and
CCz(
t), are defined as follows:
A preliminary scale for the assessments of individual
CCy(
t) and
CCz(
t) values as well as an evaluation scale for the mean comfort index are given in
Table 2.
An assessment of the comfort level of curve transitions (PCT) is made when such transitions are clearly perceived by passengers and are likely to affect their feelings. The measure of the PCT index is the percentage of dissatisfied passengers in relation to passengers experiencing enjoyment when exposed to the effects of lateral acceleration, changes in the time of this acceleration, and vehicle inclination.
The assessment of the comfort level during discrete events (PDE) is used to evaluate the impact of sudden, perceptible by the passengers, dynamic changes in vehicle behavior measured in the lateral direction. The measure of the PDE index is the percentage of dissatisfied passengers relative to passengers experiencing enjoyment when exposed to peak lateral acceleration and its average values.
Generally, a higher PCT and PDE will indicate poorer passenger comfort.
4. Materials and Methods
4.1. Acceleration Measurement Devices
The aim of this study is to develop a prototype system that will allow tram drivers to verify their driving technique. It was assumed that the developed TDTAS would be freely available to the public, so the use of an accelerometer sensor and a gyroscope sensor in an IMU (inertial measurement unit) was considered for its construction.
An IMU is a device that measures and sends, i.e., to a microcontroller, a body’s specific force, angular rate, and sometimes the orientation of the body. It can use a combination of data from accelerometers, gyroscopes, and magnetometers. The different types of IMUs, whether they are an accelerometer-gyroscope IMU or an accelerometer-gyroscope-magnetometer IMU, are considered in [
27]. In this paper, several applications of IMUs in industries and human daily lives are summarized. IMU sensors are generally used in unmanned aerial vehicles (UAVs) [
28]. In [
29], it is explained how to use a very cheap MPU6050 IMU sensor in an embedded device to measure Euler angles (roll, pitch, yaw) and also G forces on different axes. This solution is designed for motorcycle riders to detect accidents, taking into account very high measurement noise and drift. The same IMU sensor was used in a device to warn the elderly when they are unstable and at risk of falling [
30]. This sensor measures the acceleration of the body and is attached to the body (hip) to collect acceleration data. A low-cost ESP8266 microchip board is used to collect data and control sensor operation. The second ESP8266 board is used to receive and send the data to a Raspberry Pi minicomputer, which is used to calculate the mean amplitude of the Fourier spectrum.
The relatively high measurement accuracy of IMU accelerometers also allows them to be used in devices to measure the acceleration and jerks of vehicles. Their advantage is also their low price of several dollars. Due to this, ready-made measuring devices can be cheap. Such an expense may be acceptable for transport companies with dozens of trams.
4.2. The Developed Test Measuring Device
It was assumed that the comfort of traveling by tram would be determined on the basis of acceleration measurements in the axis consistent with the direction of travel (X-axis) and perpendicular to it (Y-axis), detecting lateral jerks caused by driving too fast through curves and places of track damage. It was decided not to take measurements on the vertical axis because their occurrence is not related to the driver’s driving technique and the driver has no direct influence on them. Vibrations that occur in this direction are usually the result of crossing the track or areas of track damage.
The test device built for this purpose was assumed to be used by the tram driver, who would be presented with an ongoing assessment of his driving technique in a simple and legible way. In addition, it was assumed that the device must record the position of the tram using the GPS system, so that, in the future, it is possible to detect places of track damage, where the comfort of travel is particularly low.
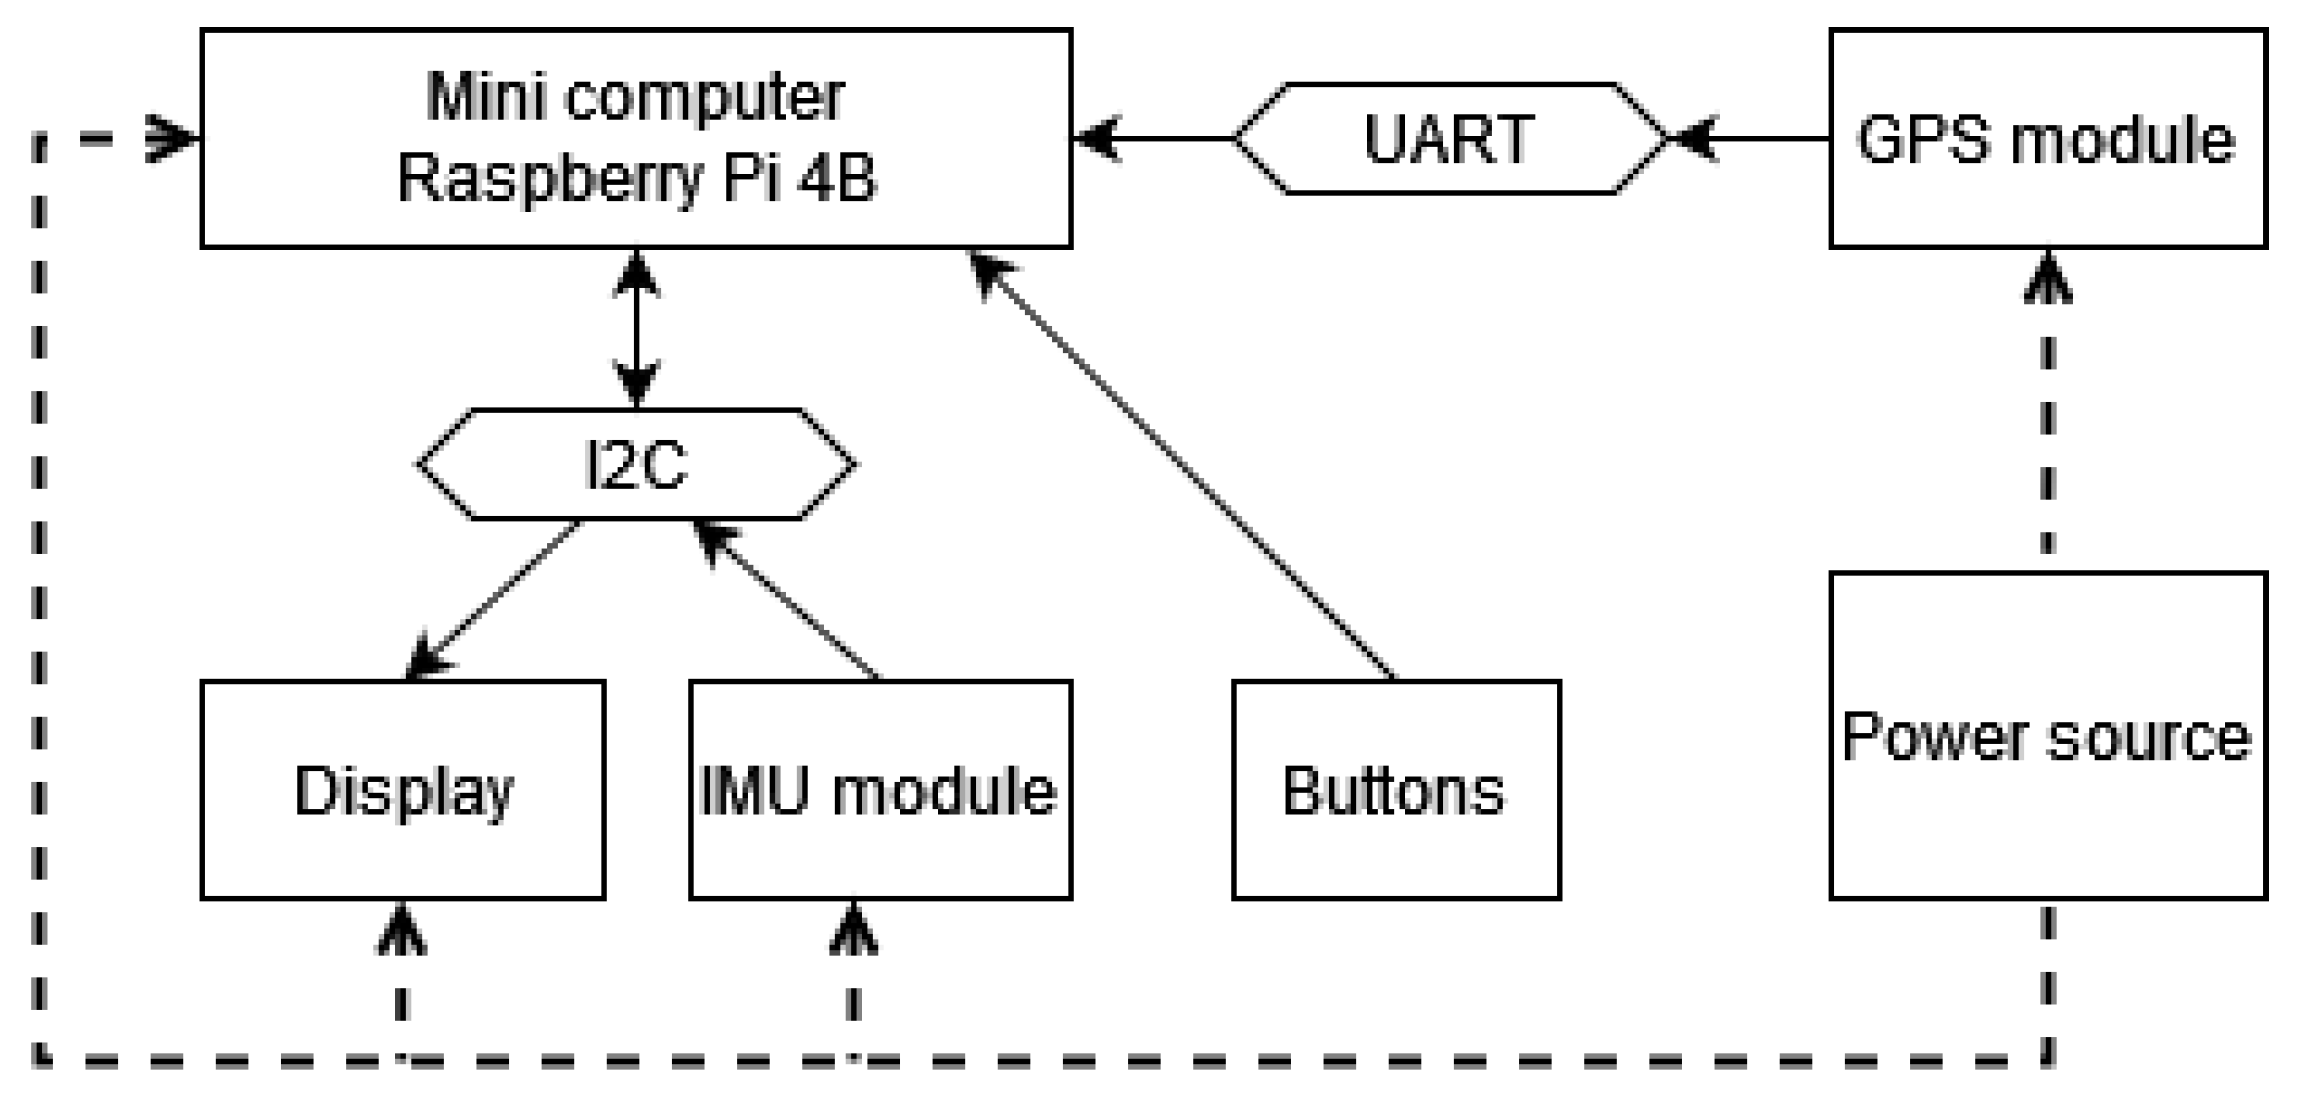
Due to the fact that public transport companies usually have many trams that can be equipped with such devices, it was decided to minimize the price of such a device. Therefore, it was decided to use possibly cheap and widely available components. Additionally, the test device could not interfere in any way with the tram systems. Therefore, it had to have its own power supply, which forced its energy efficiency. Also important was the simple assembly for the tram tests. The schematic diagram of the measuring device is shown in
Figure 2.
The mechanical part of the TDTAS consists of a housing and clamps for mounting on the vertical railing of the tram. To minimize the dimensions of the device, it was decided to make its housing in 3D printing technology from PETG material. This material is characterized by high strength, flexibility, and resistance to high temperatures [
31]. Steel clamps allow the device to be mounted on the vertical railing in the passenger area above the heads of standing passengers. A place was chosen right behind the driver’s cabin, which is located in front of the first bogie of the tram. There, the felt vibrations are the greatest.
The main element of the electronic part of the device is a small single-board Raspberry Pi 4B computer. An alternative to it was programmable microcontrollers based on ATMega328 or STM32 chips. However, they were rejected due to their relatively low computing power. Their advantages would be lower price, small dimensions, and lower energy consumption. The minicomputer we used is equipped with 2 GB of RAM and 8 GB of user memory. It is powered by 5 V through a USB-C connector through an external power bank with a capacity of 20 Ah. This battery capacity allows for approximately 20 h of continuous operation of the device. The Raspbian operating system was installed in the user’s memory along with the programs needed to run the developed software (i.e., Python v3.7.3-1, i2c-tools v4.1, python3-smbus v4.1.1, python3-numpy v1:1.16.2-1).
A cheap and popular IMU module with a built-in accelerometer and a 3-axis gyroscope was used to measure accelerations. It is powered by a voltage of 3.3 V. Communication with the minicomputer takes place via the I2C bus.
To obtain location data, a GPS system based on the NEO-6M-0-001 u-blox microcontroller was selected. It was chosen mainly because of its low price and relatively short time to update location data. This system is also powered by 3.3 V and communicates with the minicomputer via the UART bus. An external ceramic antenna is connected to the module, which is required to establish a stable connection with the satellite. It was placed in a hole in the upper wall of the device.
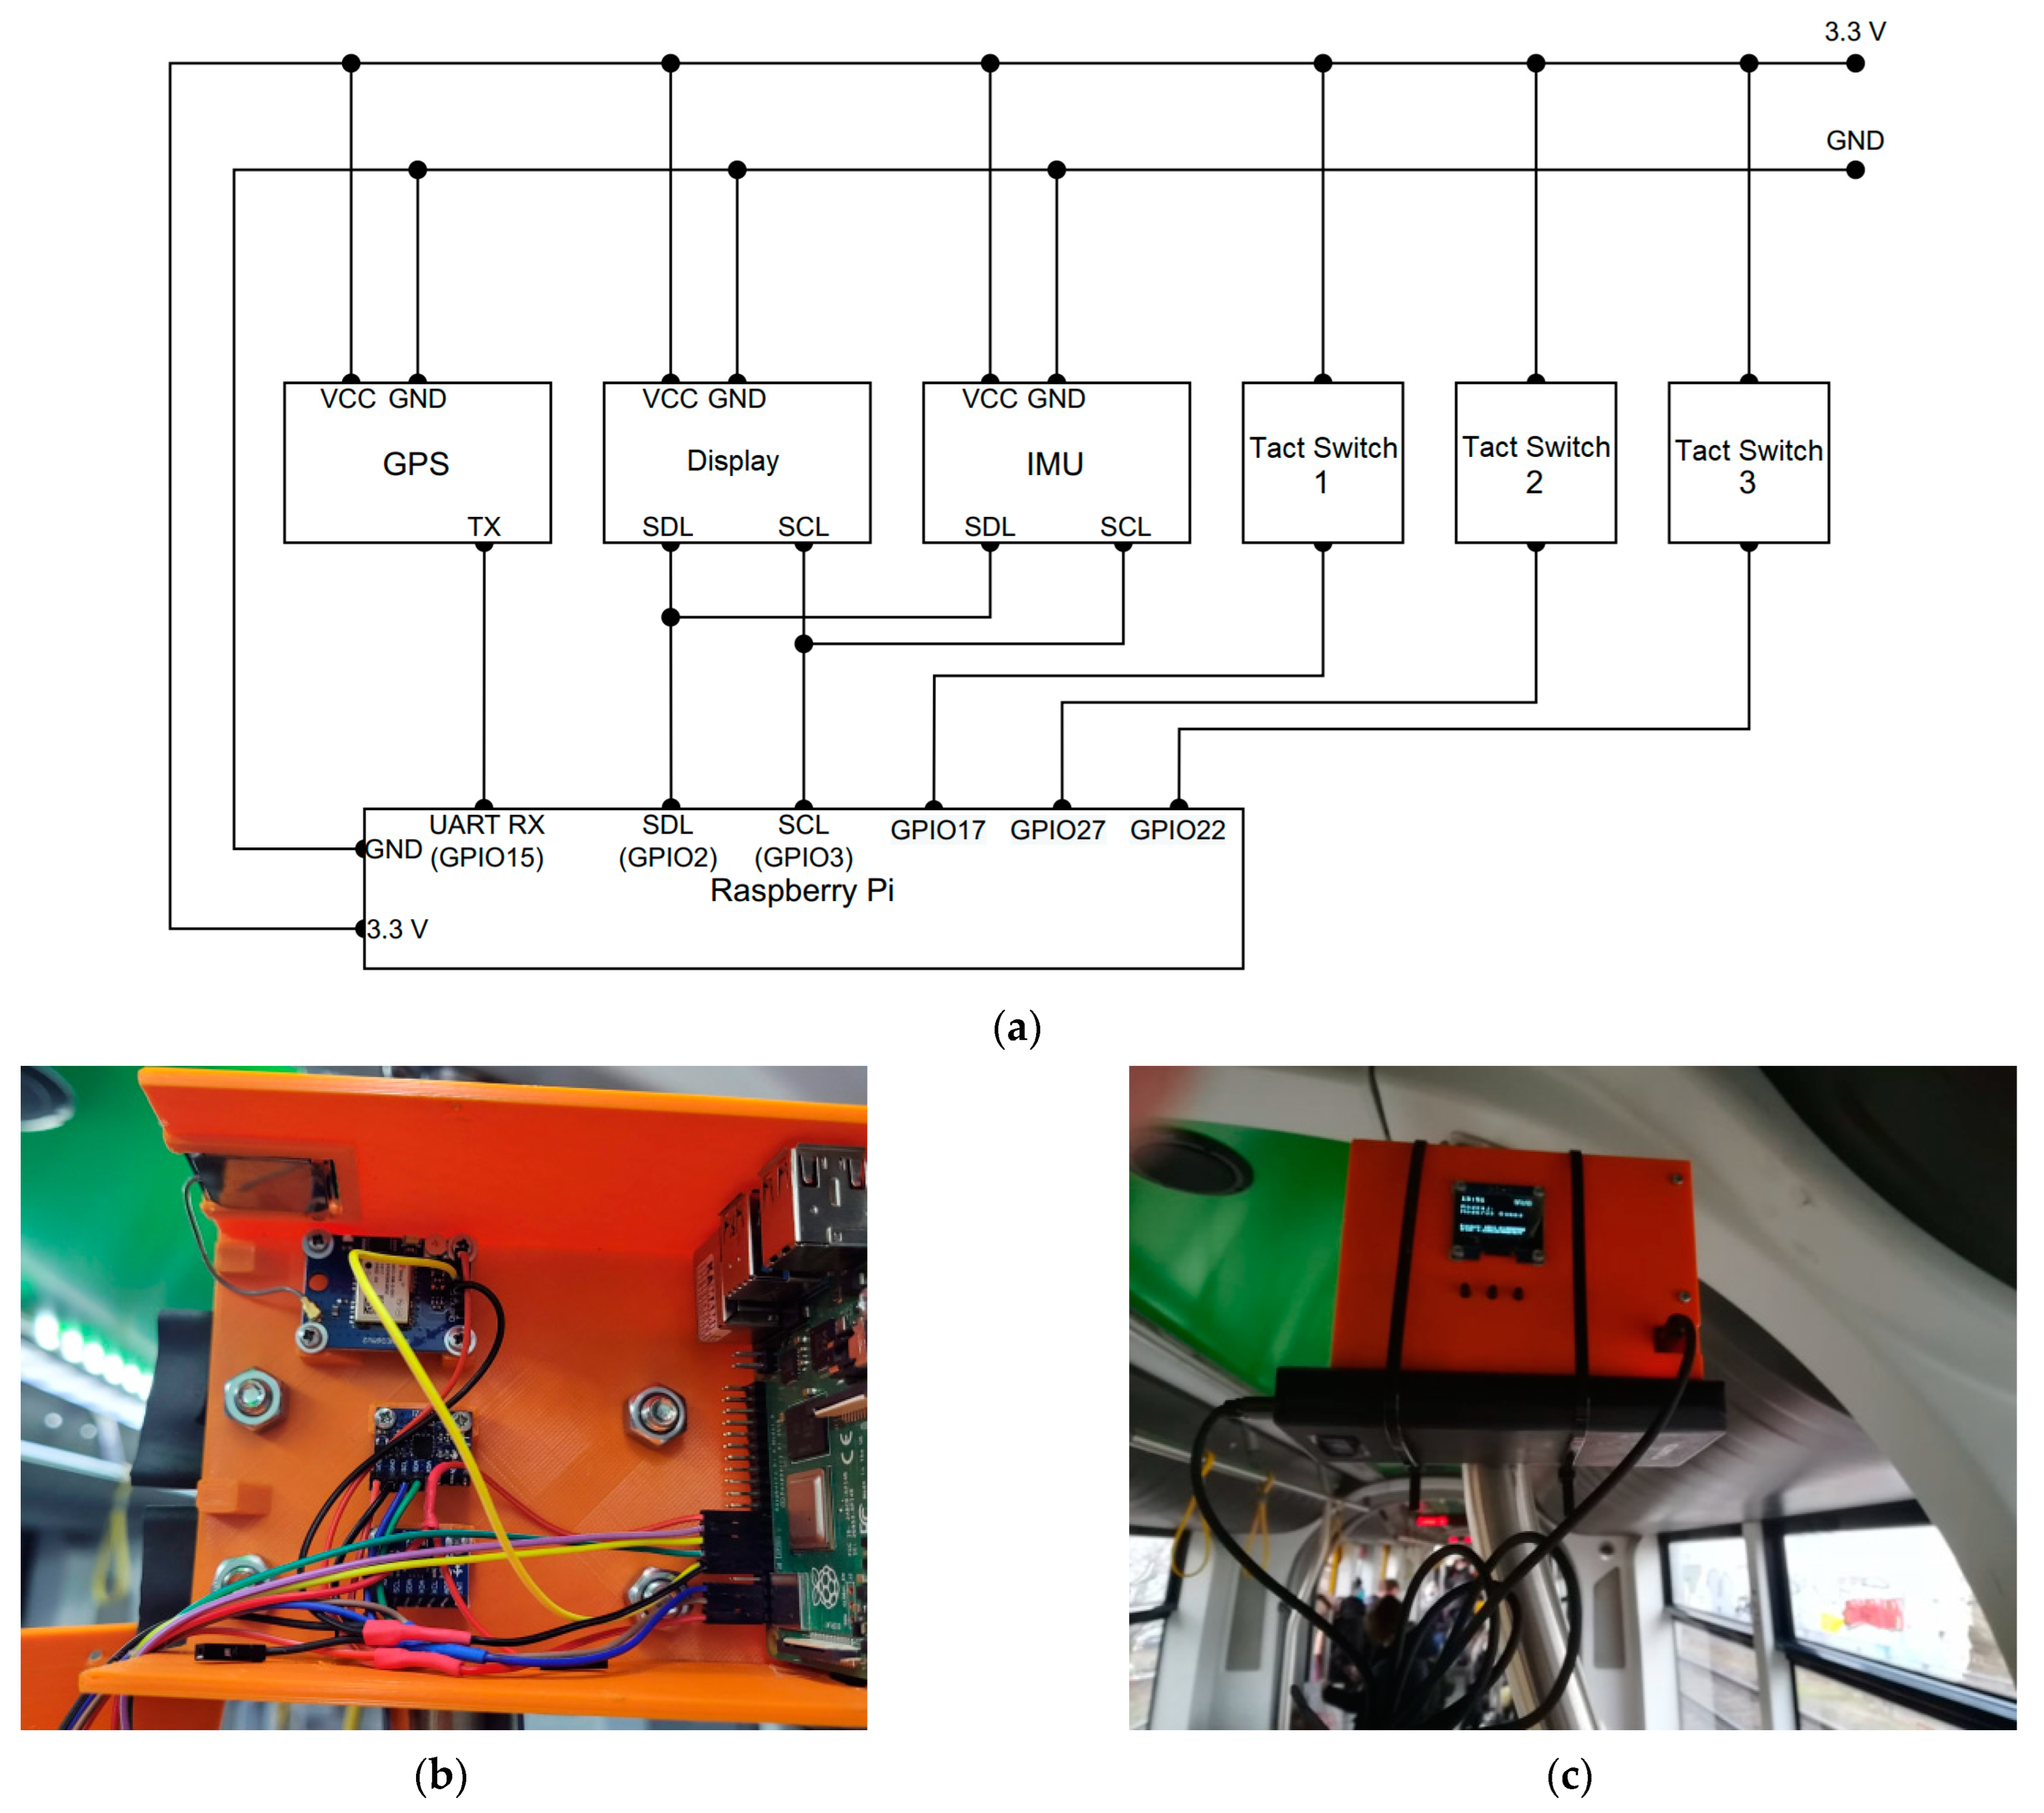
An OLED display with a diagonal of 1.3″ and a resolution of 128 × 64 pixels was used to display the measurement results. Its advantages, apart from the low price, are low power consumption, high contrast, and communication also using the I2C bus. The operation of the device is controlled by three tact switch buttons connected with pull-down resistors.
Due to the expected strong vibrations, each element of the device was firmly attached to the housing with screws and connected to the minicomputer by wires. The electrical diagram of the device and its appearance are shown in
Figure 3.
The relatively high measurement accuracy of IMU accelerometers allows them to be used in devices to measure vehicle acceleration and jerks. Their advantage is also their low price of several dollars. Due to this, ready-made measuring devices can be cheap. Such an expense may be acceptable for transport companies with dozens of trams.
The prototype TDTAS (
Figure 3) was assembled, among others, from the components listed in
Table 3.
TDTAS software (version 1) was developed to control the minicomputer. Its tasks were communication with the modules described above, recording measurement data, processing measurement data, and displaying the processed data on the screen. This software was prepared in Python version 3.9, using the Microsoft Visual Studio 2022 environment. Dedicated programming libraries were used to communicate with particular modules:
- (1)
mpu6050-raspberrypi—communication with the IMU module
- (2)
gpsd—communication with the GPS module
- (3)
luma.oled—communication with the display
Measurement data from the GPS and IMU modules were archived in the form of CSV files. They were saved in the Raspberry memory in the home directory. Due to this, it was possible to design an algorithm to evaluate the accuracy of the tram driving technique. This algorithm was later implemented on the device to display the calculated driving technique score on the built-in display.
4.3. Driving Technique Score
One of the goals was to minimize the amount of power consumed by the Raspberry. Therefore, it was decided to reduce the computational effort of the developed algorithm to a minimum. The algorithm analyzes the driver’s driving technique when the speed of the tram is higher than the set one. Due to this, the passage through the places of joining and crossing the tracks, or through the places of track damage, is not included in the assessment. There, despite the low speed of the tram (which is the result of speed limits usually up to 10–15 km/h), the vibrations are high, and the driver has no influence on minimizing them. The algorithm, separately for vibrations on the
X-axis and on the
Y-axis, calculates the average values of jerks from the last n measurements, during which the tram was moving at a speed greater than the specified one. In the tests, it was assumed that the limit speed above which the algorithm registers jerks for both axles is 10 km/h; 10 km/h is the speed allowed by the MPK Poznań service manual (the test tram was from MPK Poznan), at which the tram can enter the overrun switch. At this speed, it can also drive through the exit switch from the exit track. The permitted speed at the crossings of the track and at the exit switches crossed straight ahead is 15 km/h. Intersections are the places where the greatest vibrations occur and limiting the speed on them to 10 km/h improves passenger comfort. The evaluation of the driving technique is made on the basis of Formula (6):
where
Od is the evaluation of the driving technique’s
d-axis,
jd,i (
d,
i) is the jerk of the
d-axis measured for the sample
i,
v is the actual tram speed,
vg is the tram speed at which the algorithm is activated,
N is the number of samples used for the calculation.
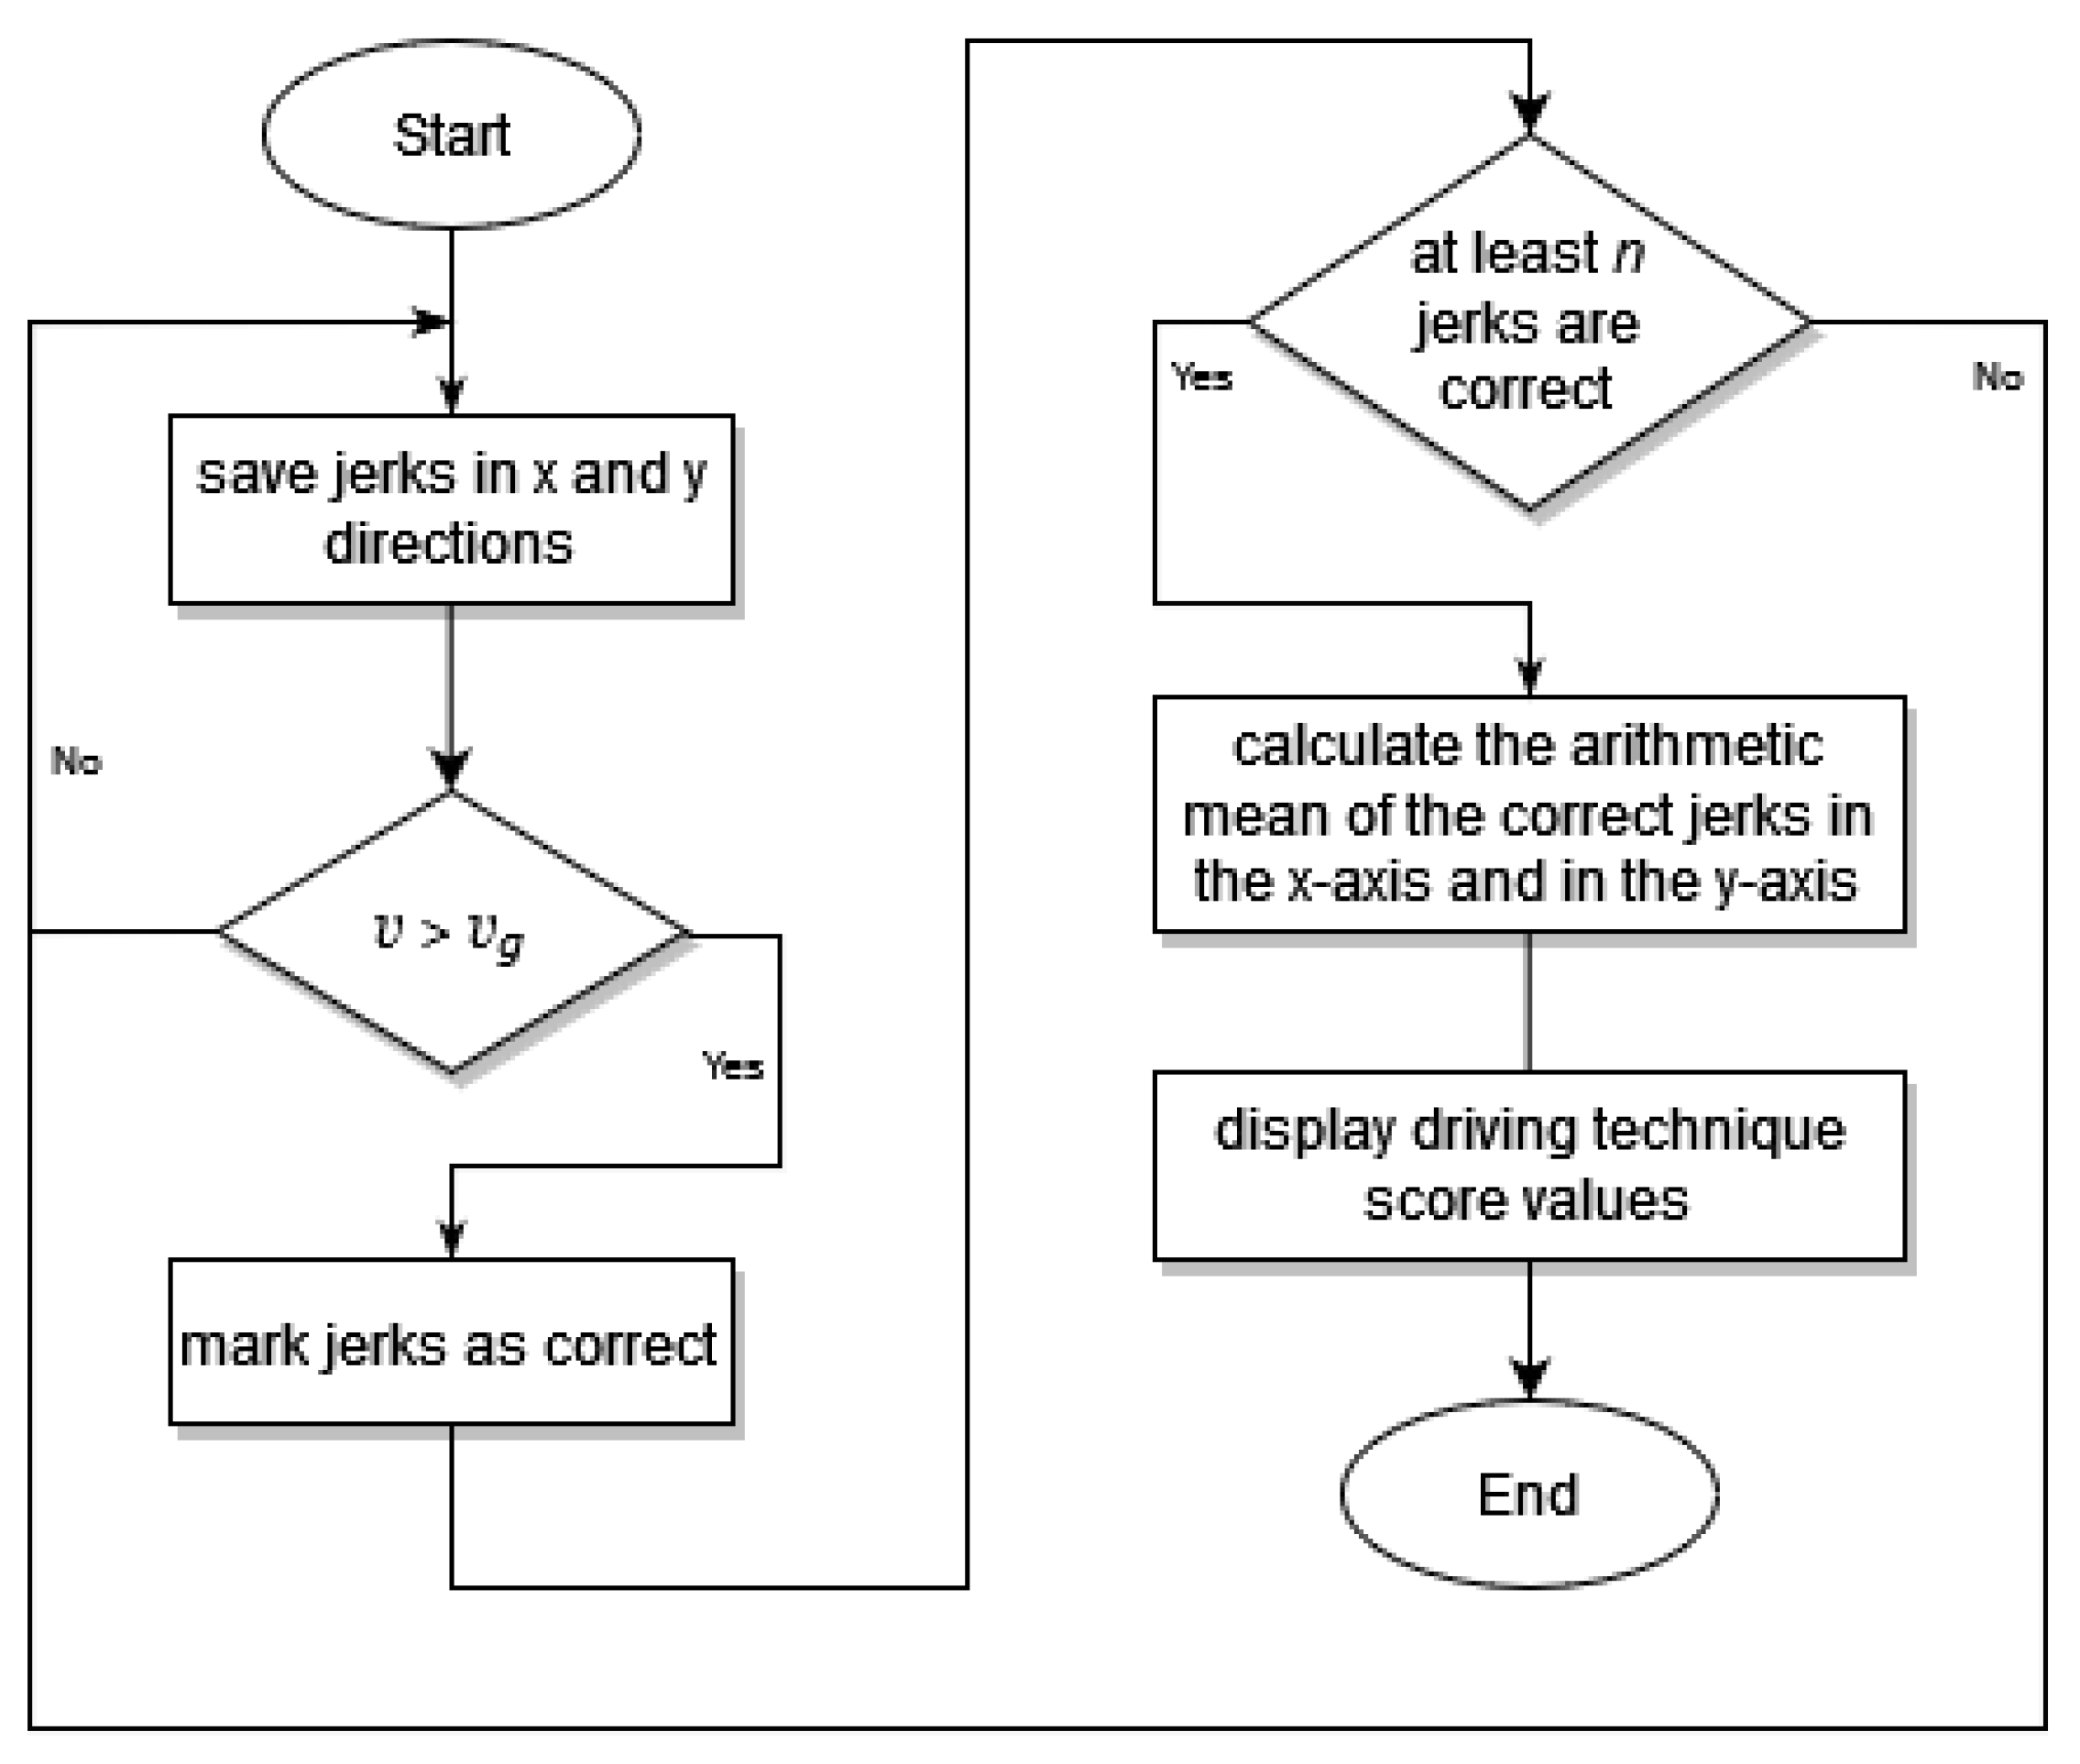
Accelerometer data were recorded at a rate of 10 samples/s, and the last 1800 samples (last 3 min of the tram ride with v > vg) were used to calculate the Od value.
A detailed block diagram of the algorithm implemented is shown in
Figure 4.
The average jerk values achieved in both directions separately are converted into values in the range of 1–10, where 1 means the worst driving technique (jerks that are dangerous for passengers) and 10 means the best (jerks are imperceptible to passengers). These two values can be easily interpreted by the tram driver. A low rating in the X-axis direction tells the tram driver that he is changing the tram’s speed too often and too quickly. A low rating on the Y-axis, on the other hand, informs the tram driver that it is going too fast, causing excessive lateral vibration.
The determined ranges of average jerks and the corresponding ratings are presented in
Table 4. These values were experimentally determined on the basis of subjective assessments of the tram driver and those performing the tests. To determine the scale, journeys along sections where the permissible speed was 60 km/h (a separate route of the Poznan Fast Tram) were also used. For this reason, the resulting scale is not completely linear.
5. Results
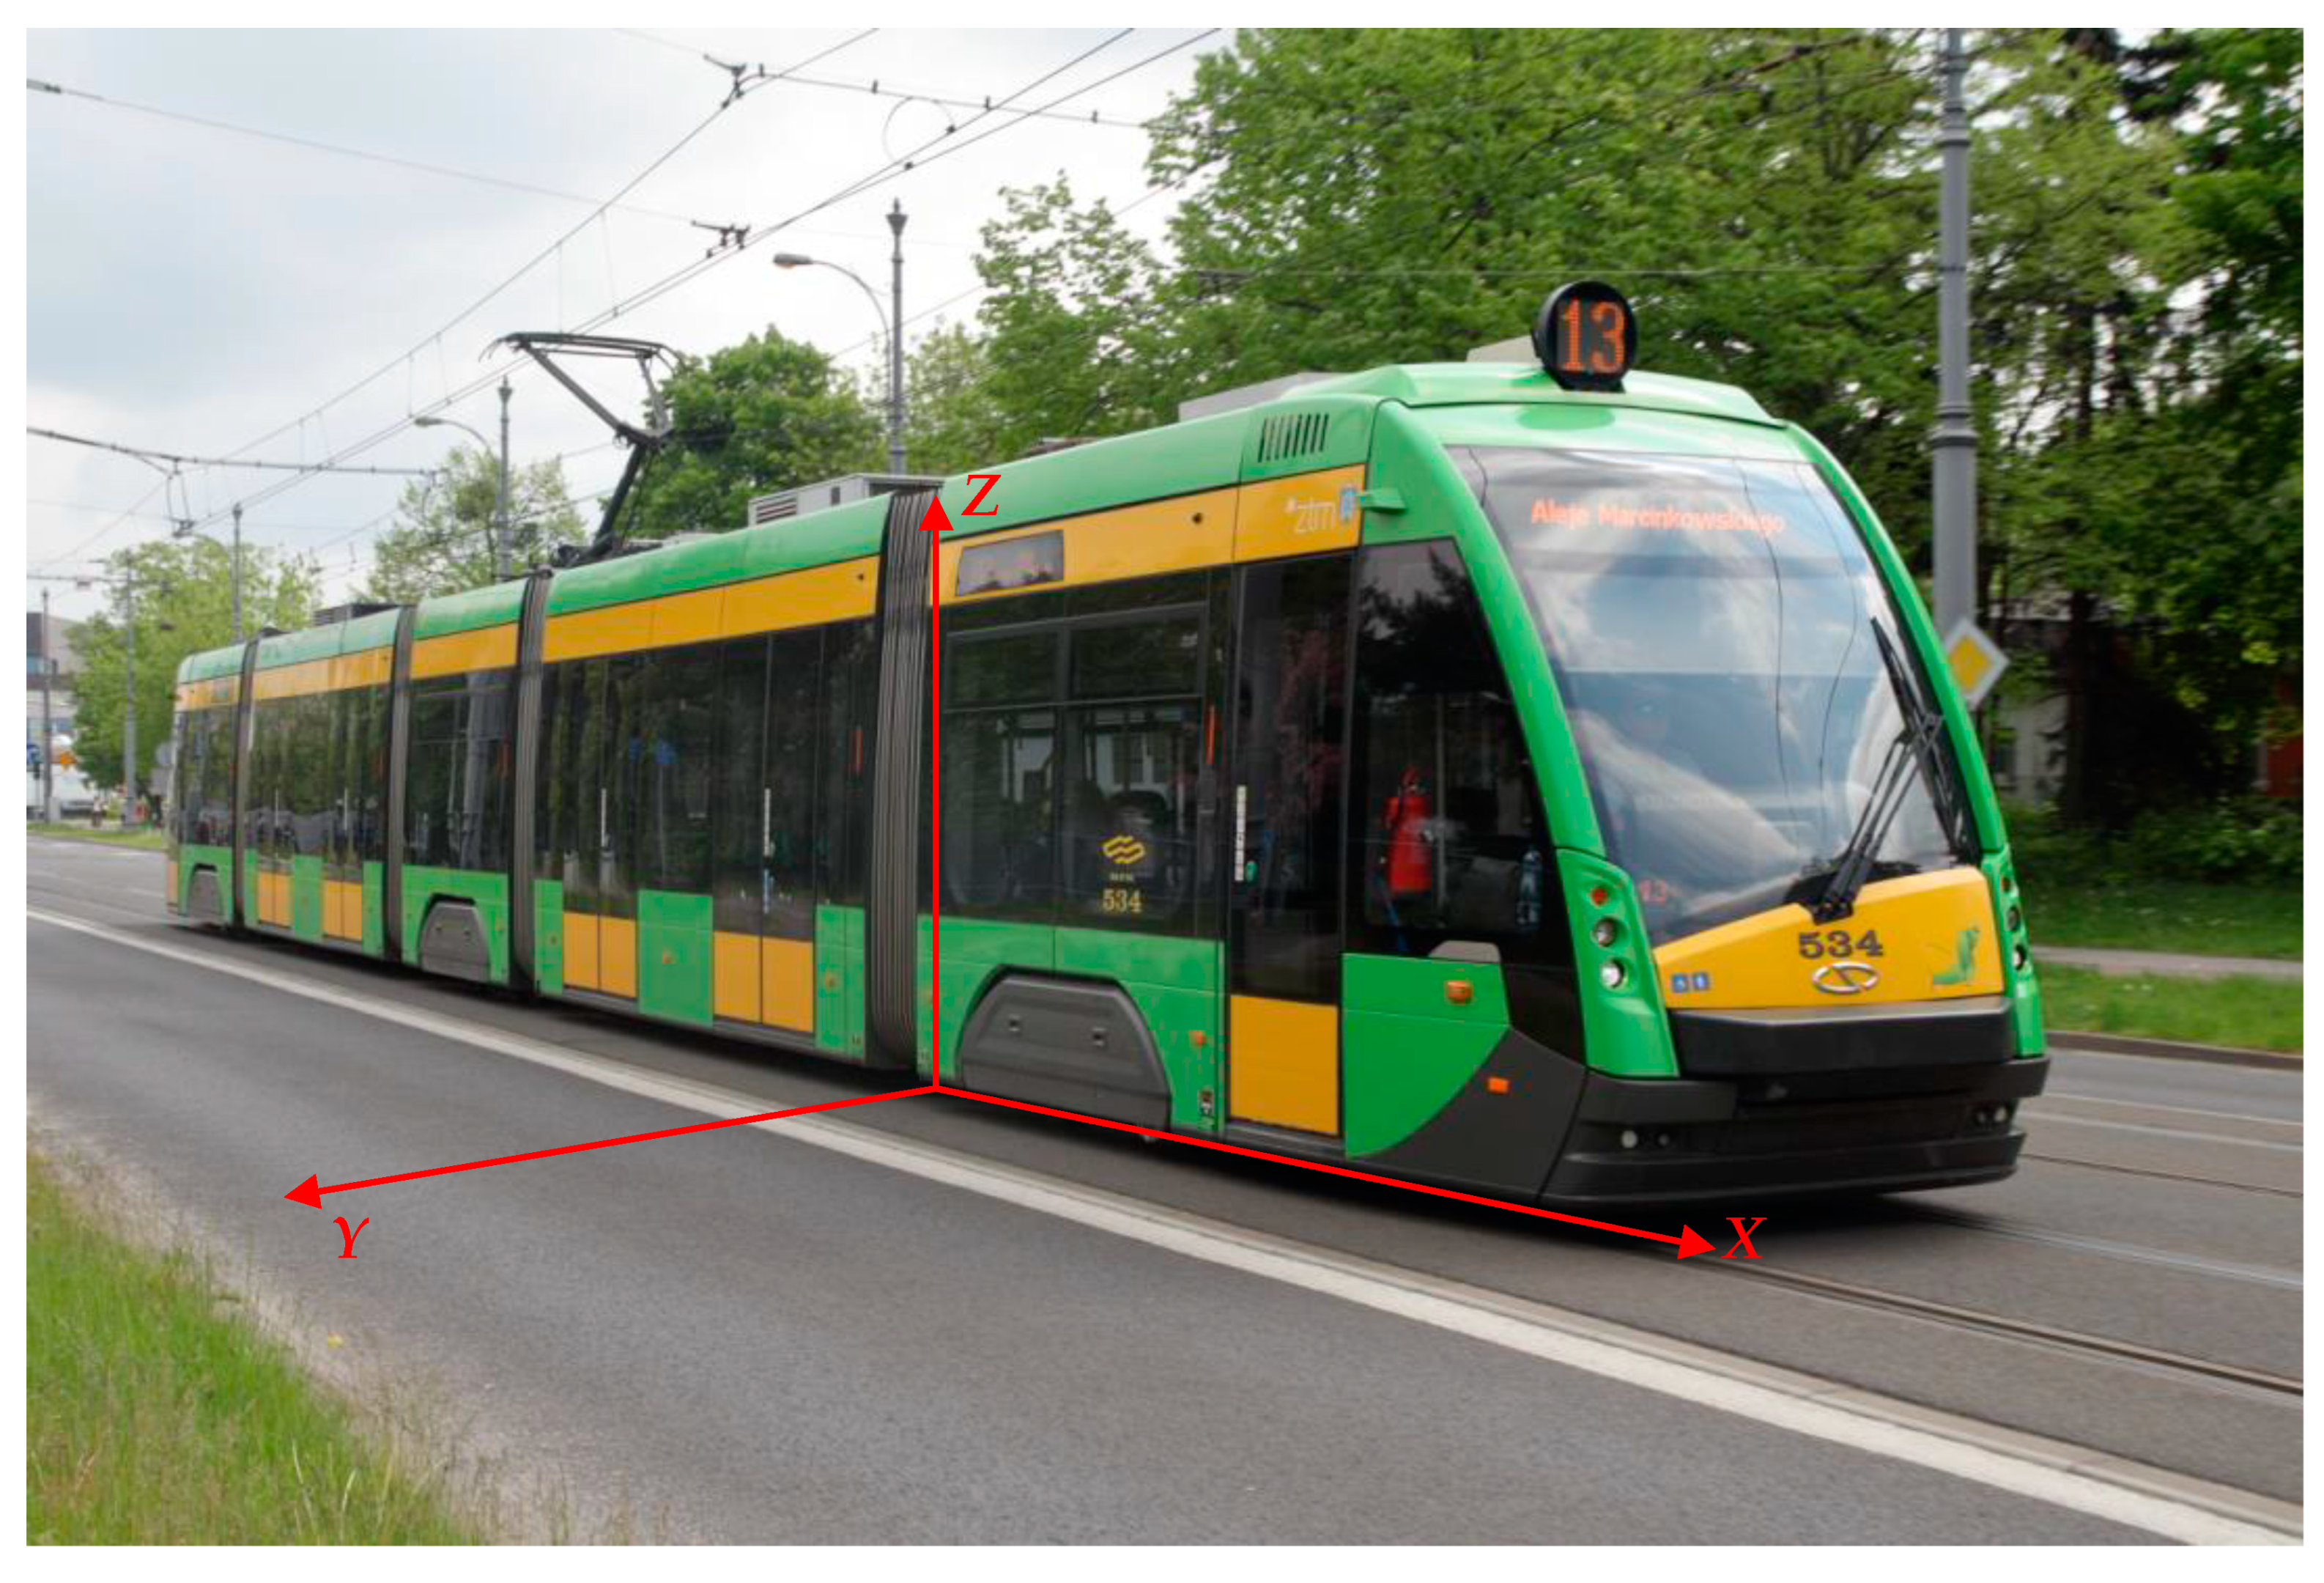
All tests were carried out in the city of Poznań (Poland), during normal tram rides with passengers. The device was tested in two Solaris Tramino S105p trams (
Figure 5) belonging to the Poznań Municipal Transport Company (MPK Poznań Sp. z o.o.).
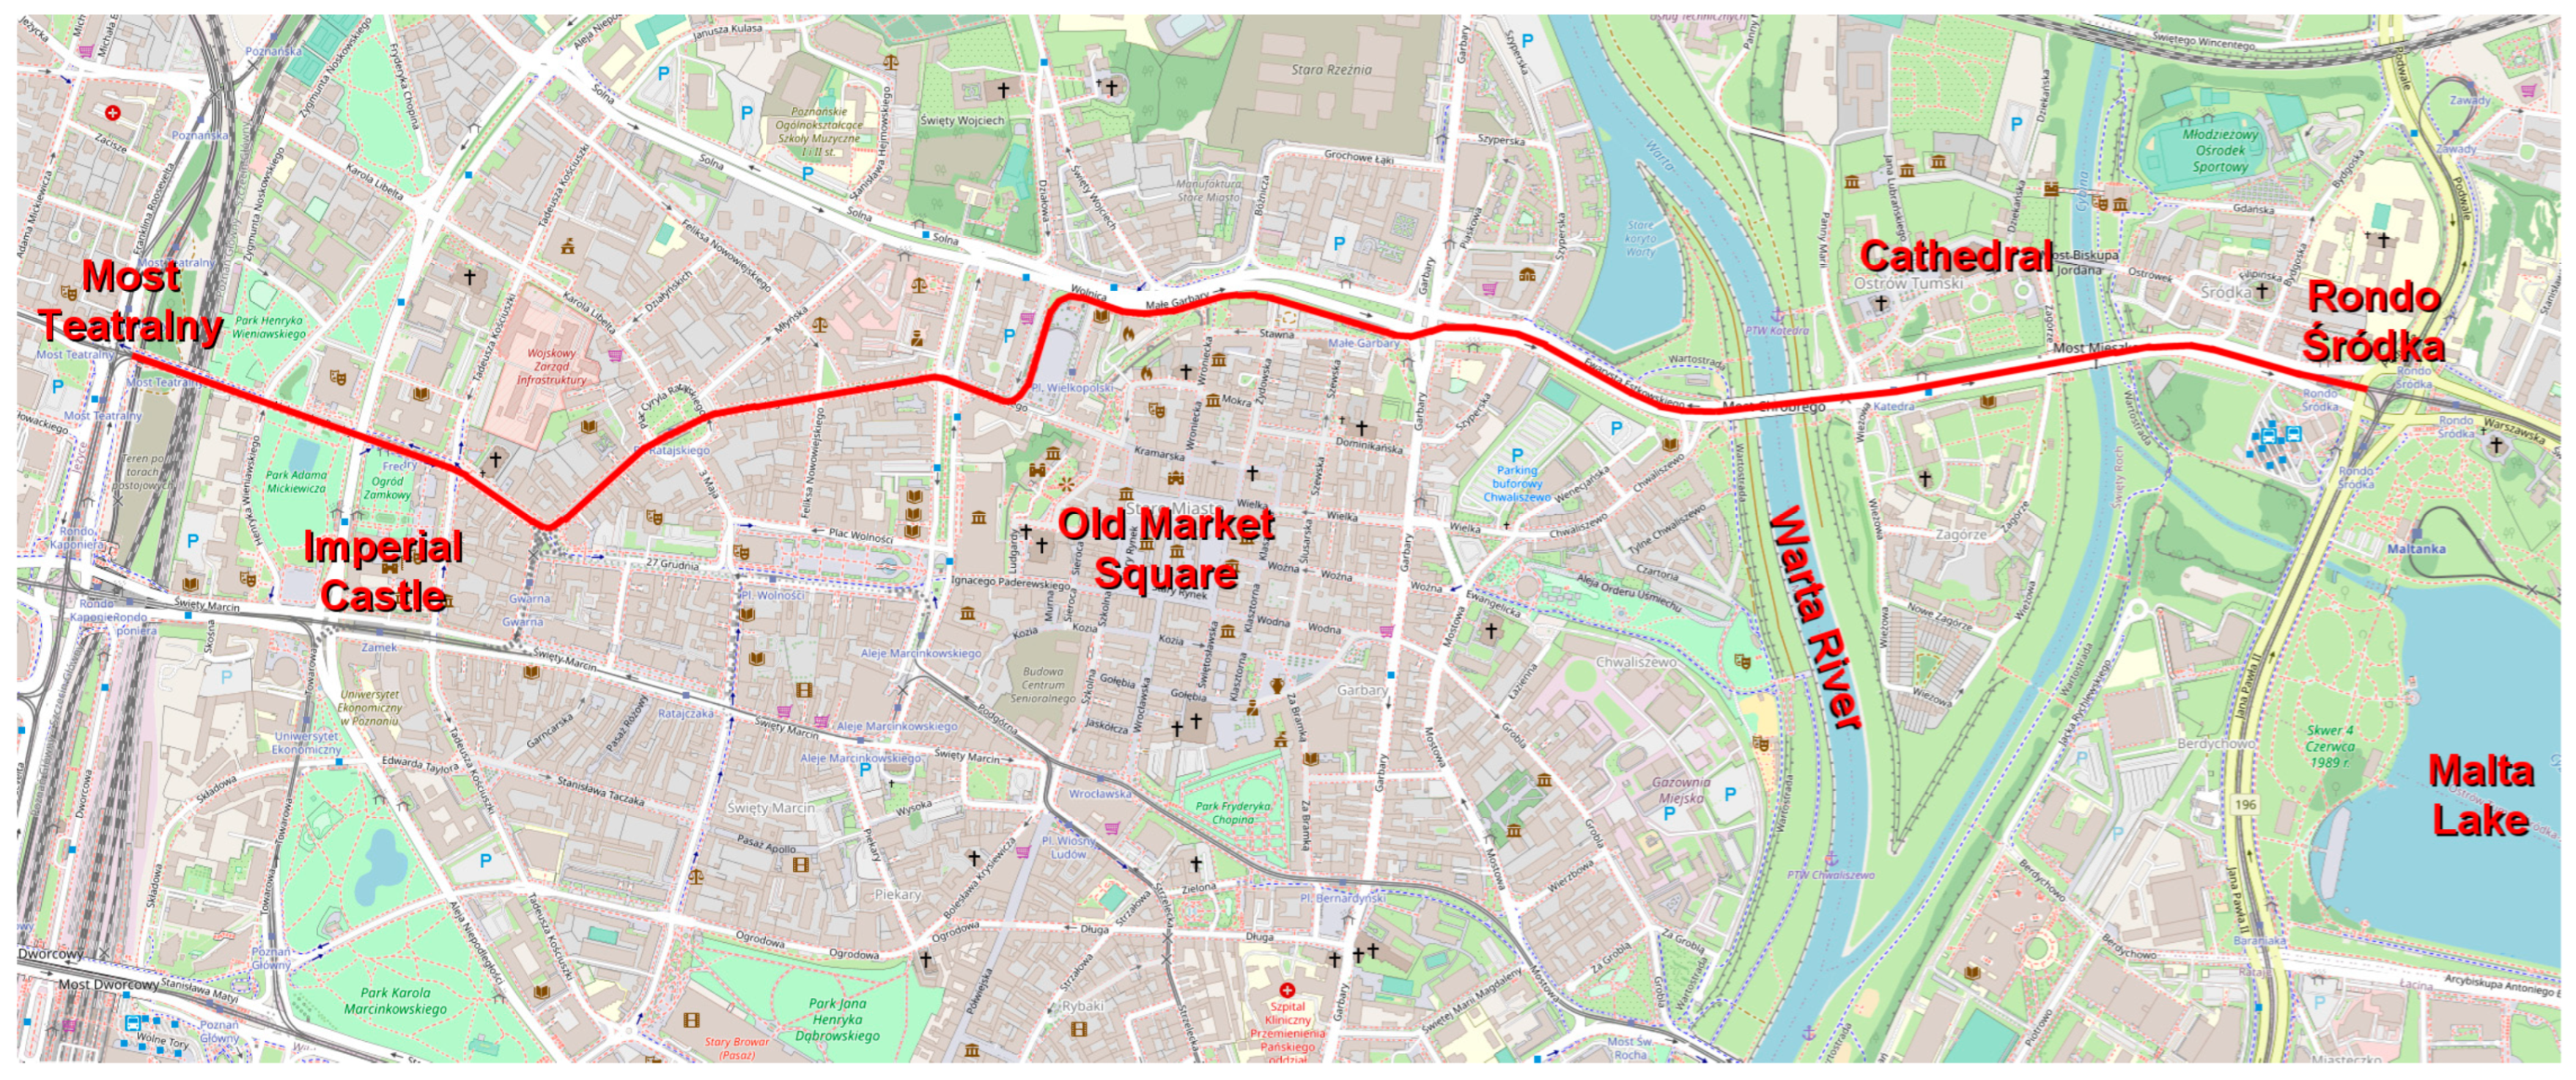
Route 16 was selected. The tracks on this route are in varying condition. The route runs partly along streets and in separate sections, where the speed limit was 60 km/h in some places. The measurements presented in this article were carried out on the section Most Teatralny—Rondo Śródka, which is approximately 3.1 km long.
Figure 6 shows this fragment of the Line 16 route marked on the map of the center of Poznań.
This section in the western part is characterized by a slope towards the east, and its course is almost independent of car traffic. In turn, the middle part runs through tight urban development, where the track was in poor technical condition (sinks) and was not separated from the roadway. Due to sharp curves and the road being cut by other vehicles, the driver was forced to brake harder. Here, the speed did not exceed 35 km/h. In turn, the eastern section was on a track separated from the roadway and was in good condition. Dynamic driving on the eastern part of the route allowed for more intensive braking for research purposes. The speed limit here was 50 km/h.
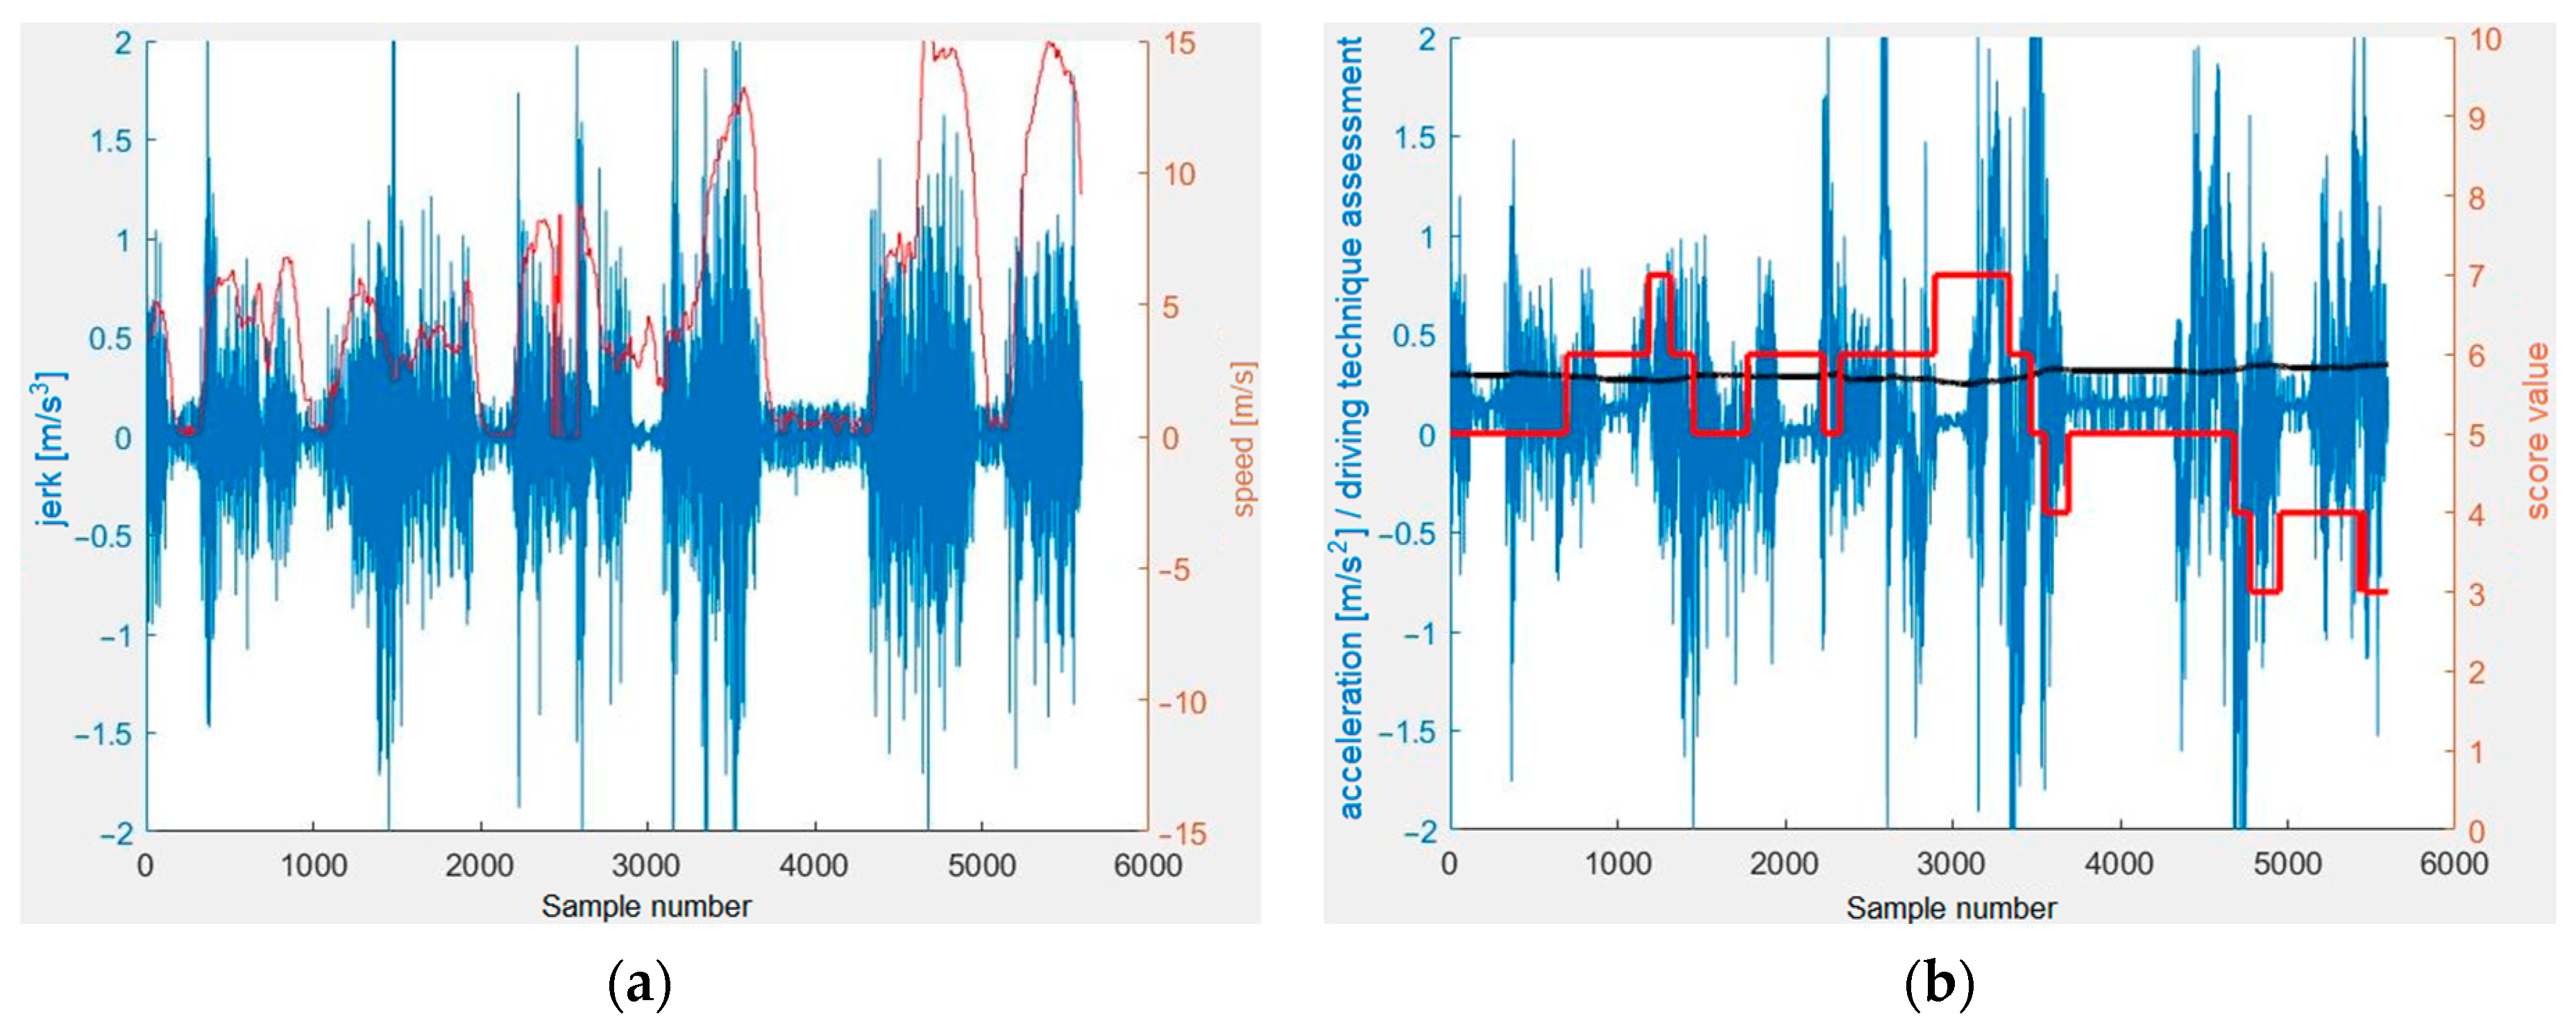
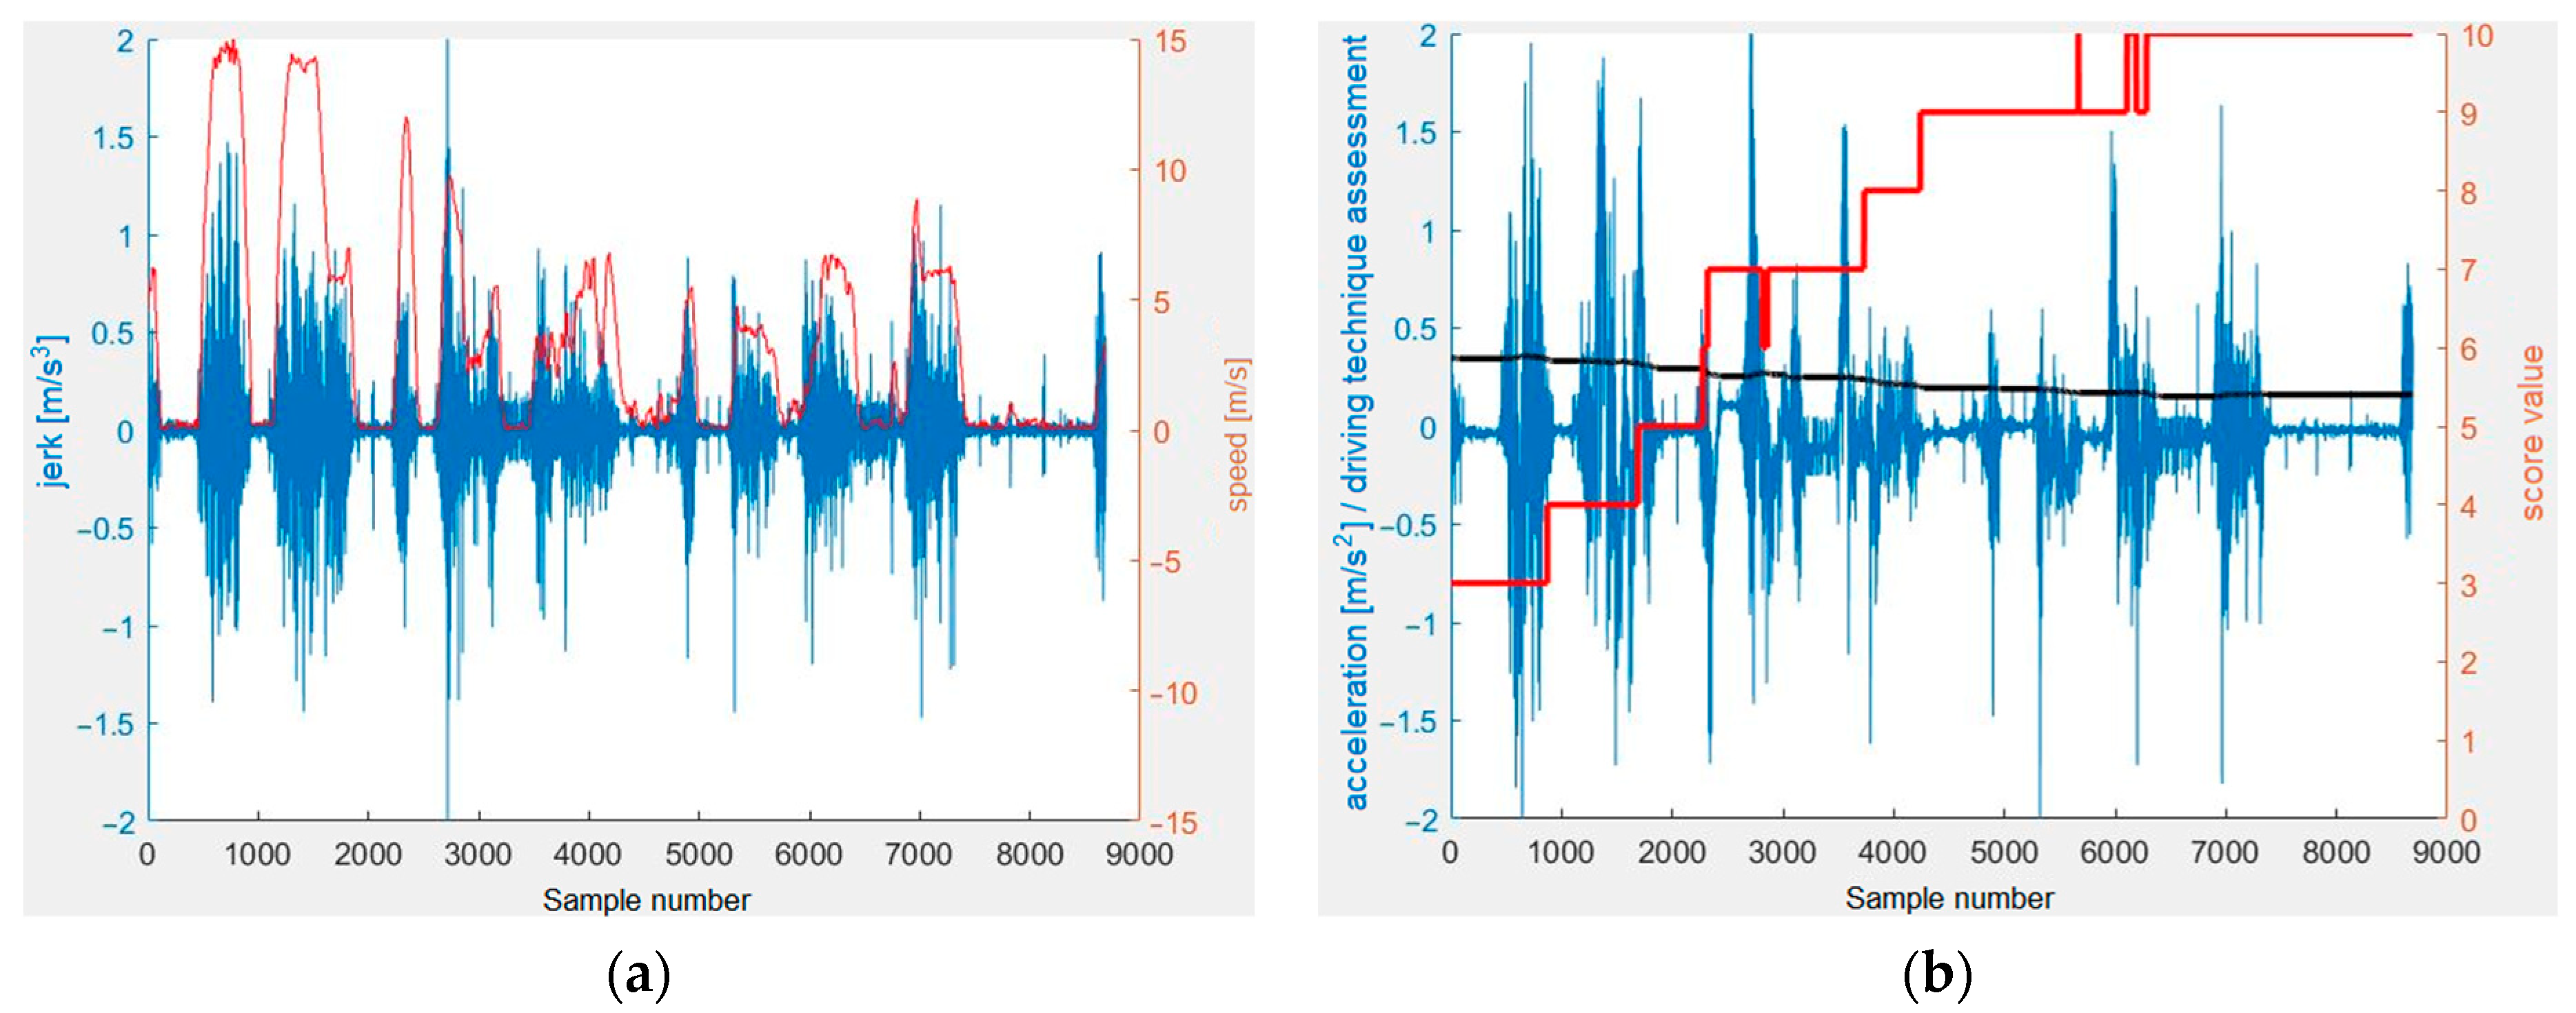
Figure 7 and
Figure 8 show the results of measurements and calculations obtained in this section, where the journey took place at different speeds. The high speed caused considerable lateral vibrations, which resulted from the five-section construction of the tram based on three rigid bogies. The results of the evaluation of the driving technique calculated by the algorithm were consistent with the feelings of the experimenters and the feelings of the tram driver.
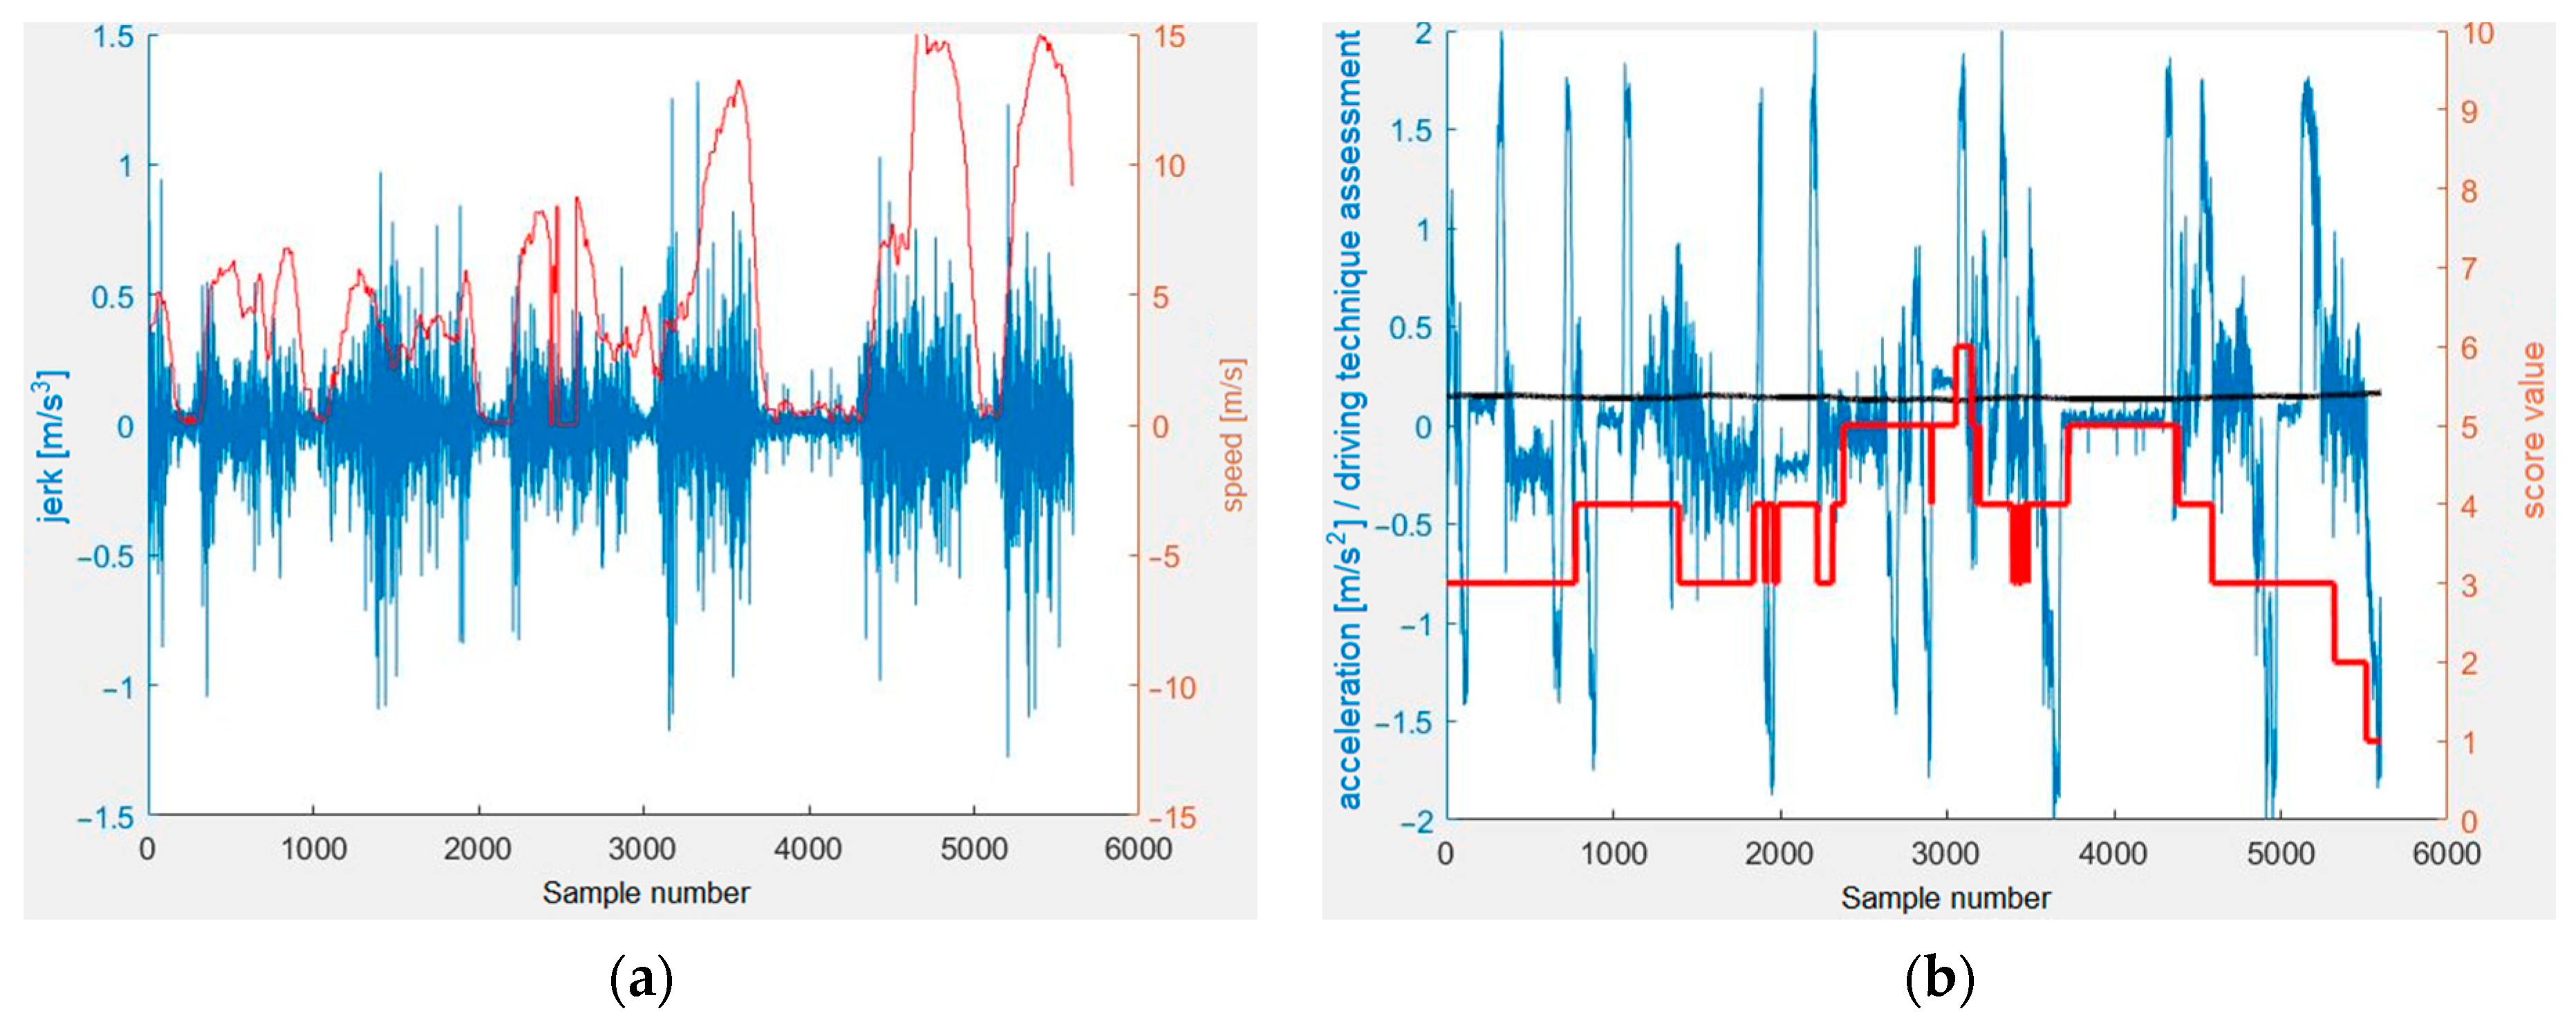
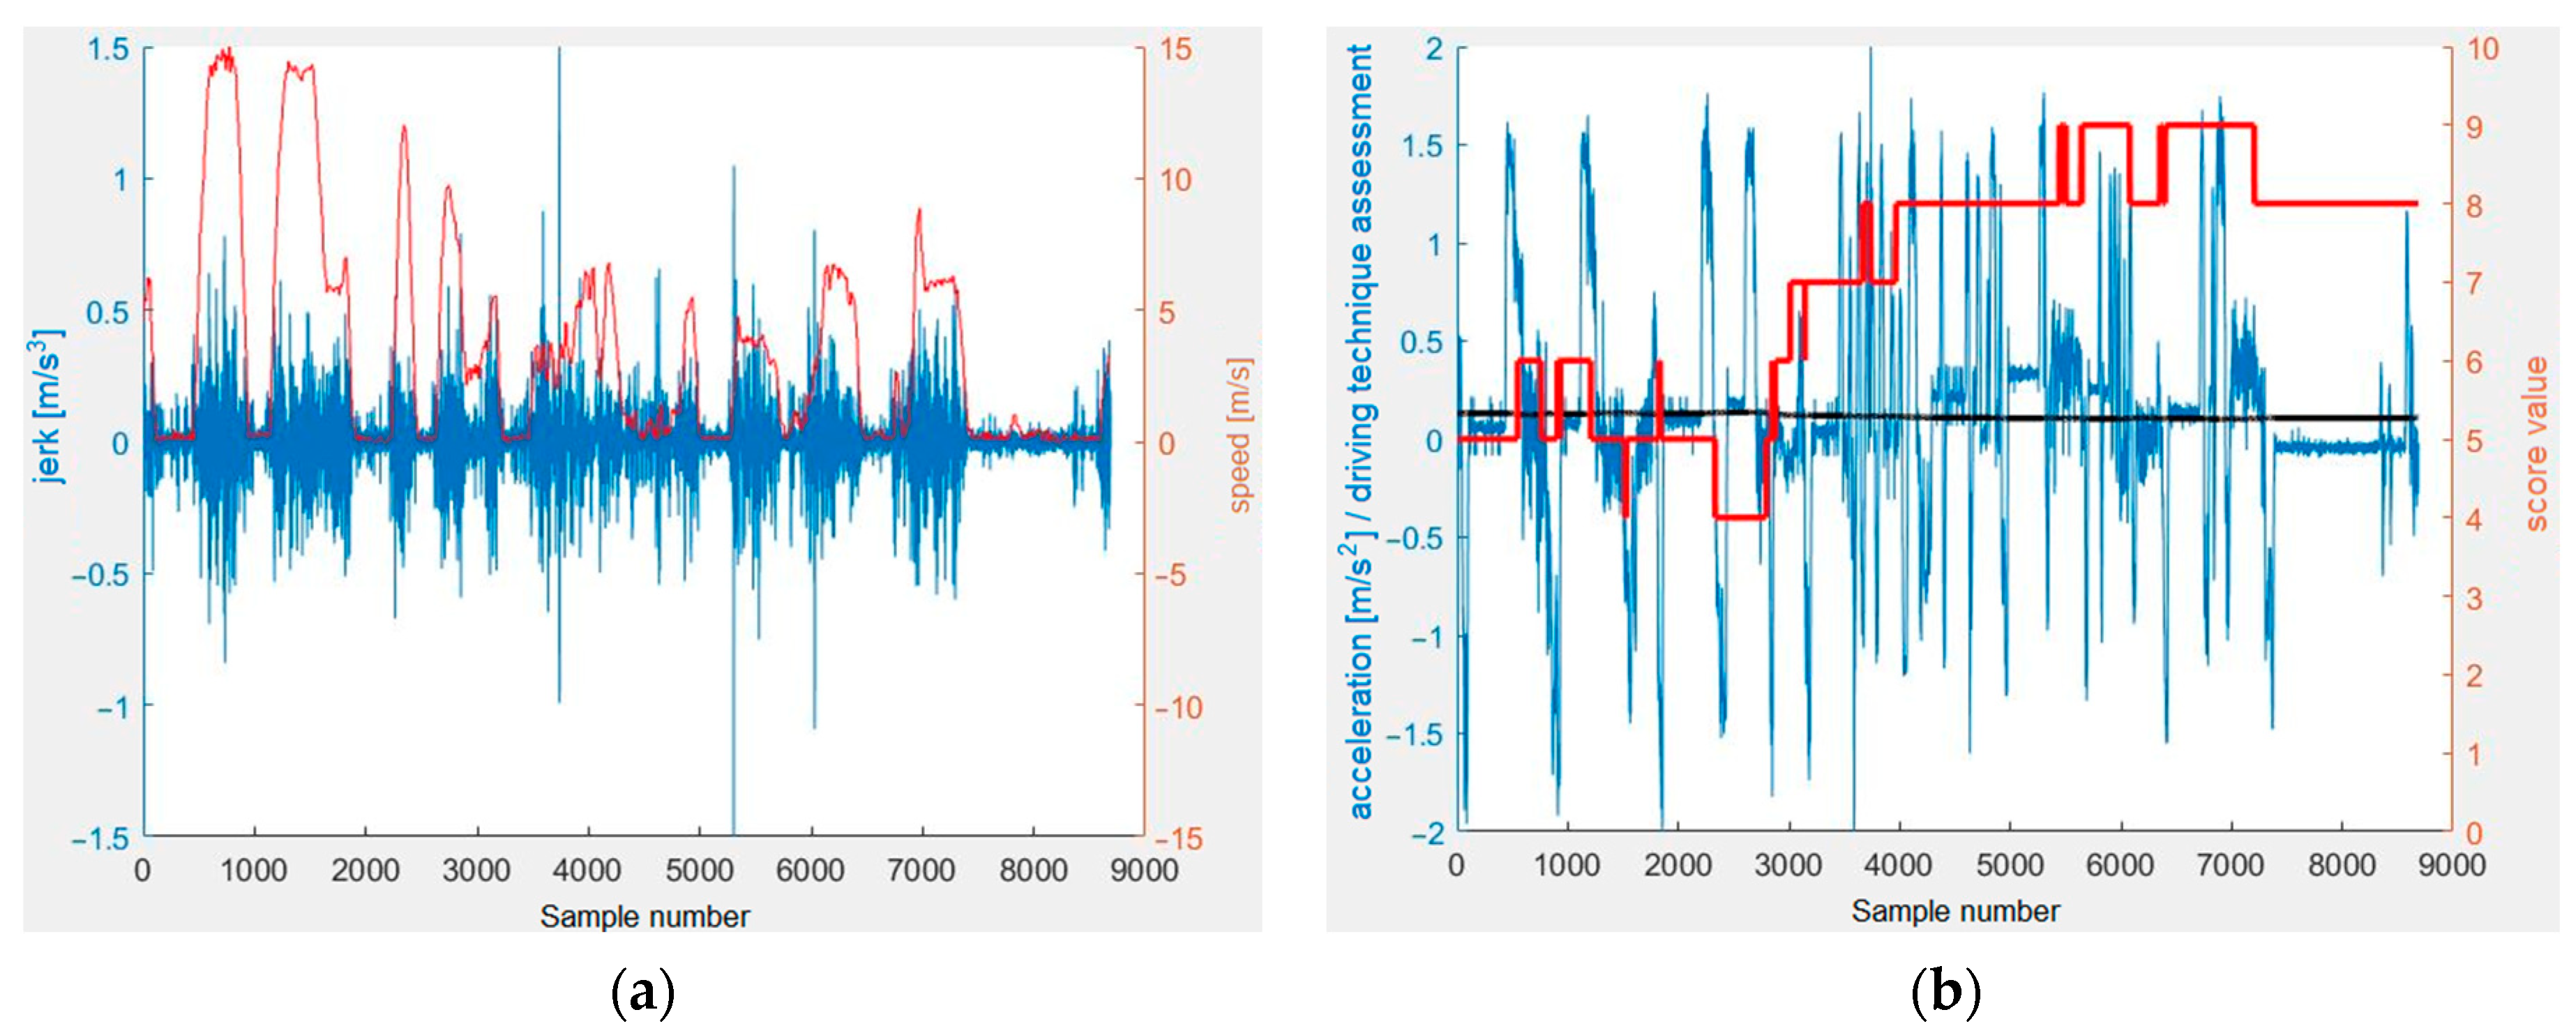
On the other hand,
Figure 9 and
Figure 10 show analogous results when traveling the same section in the opposite direction, when the tram driver was driving at an average speed for this track section, trying to carry out gentle starts and braking. In this case, the algorithm scores, consistent with the subjective assessments of the people who conducted the test and the driver, were much higher.
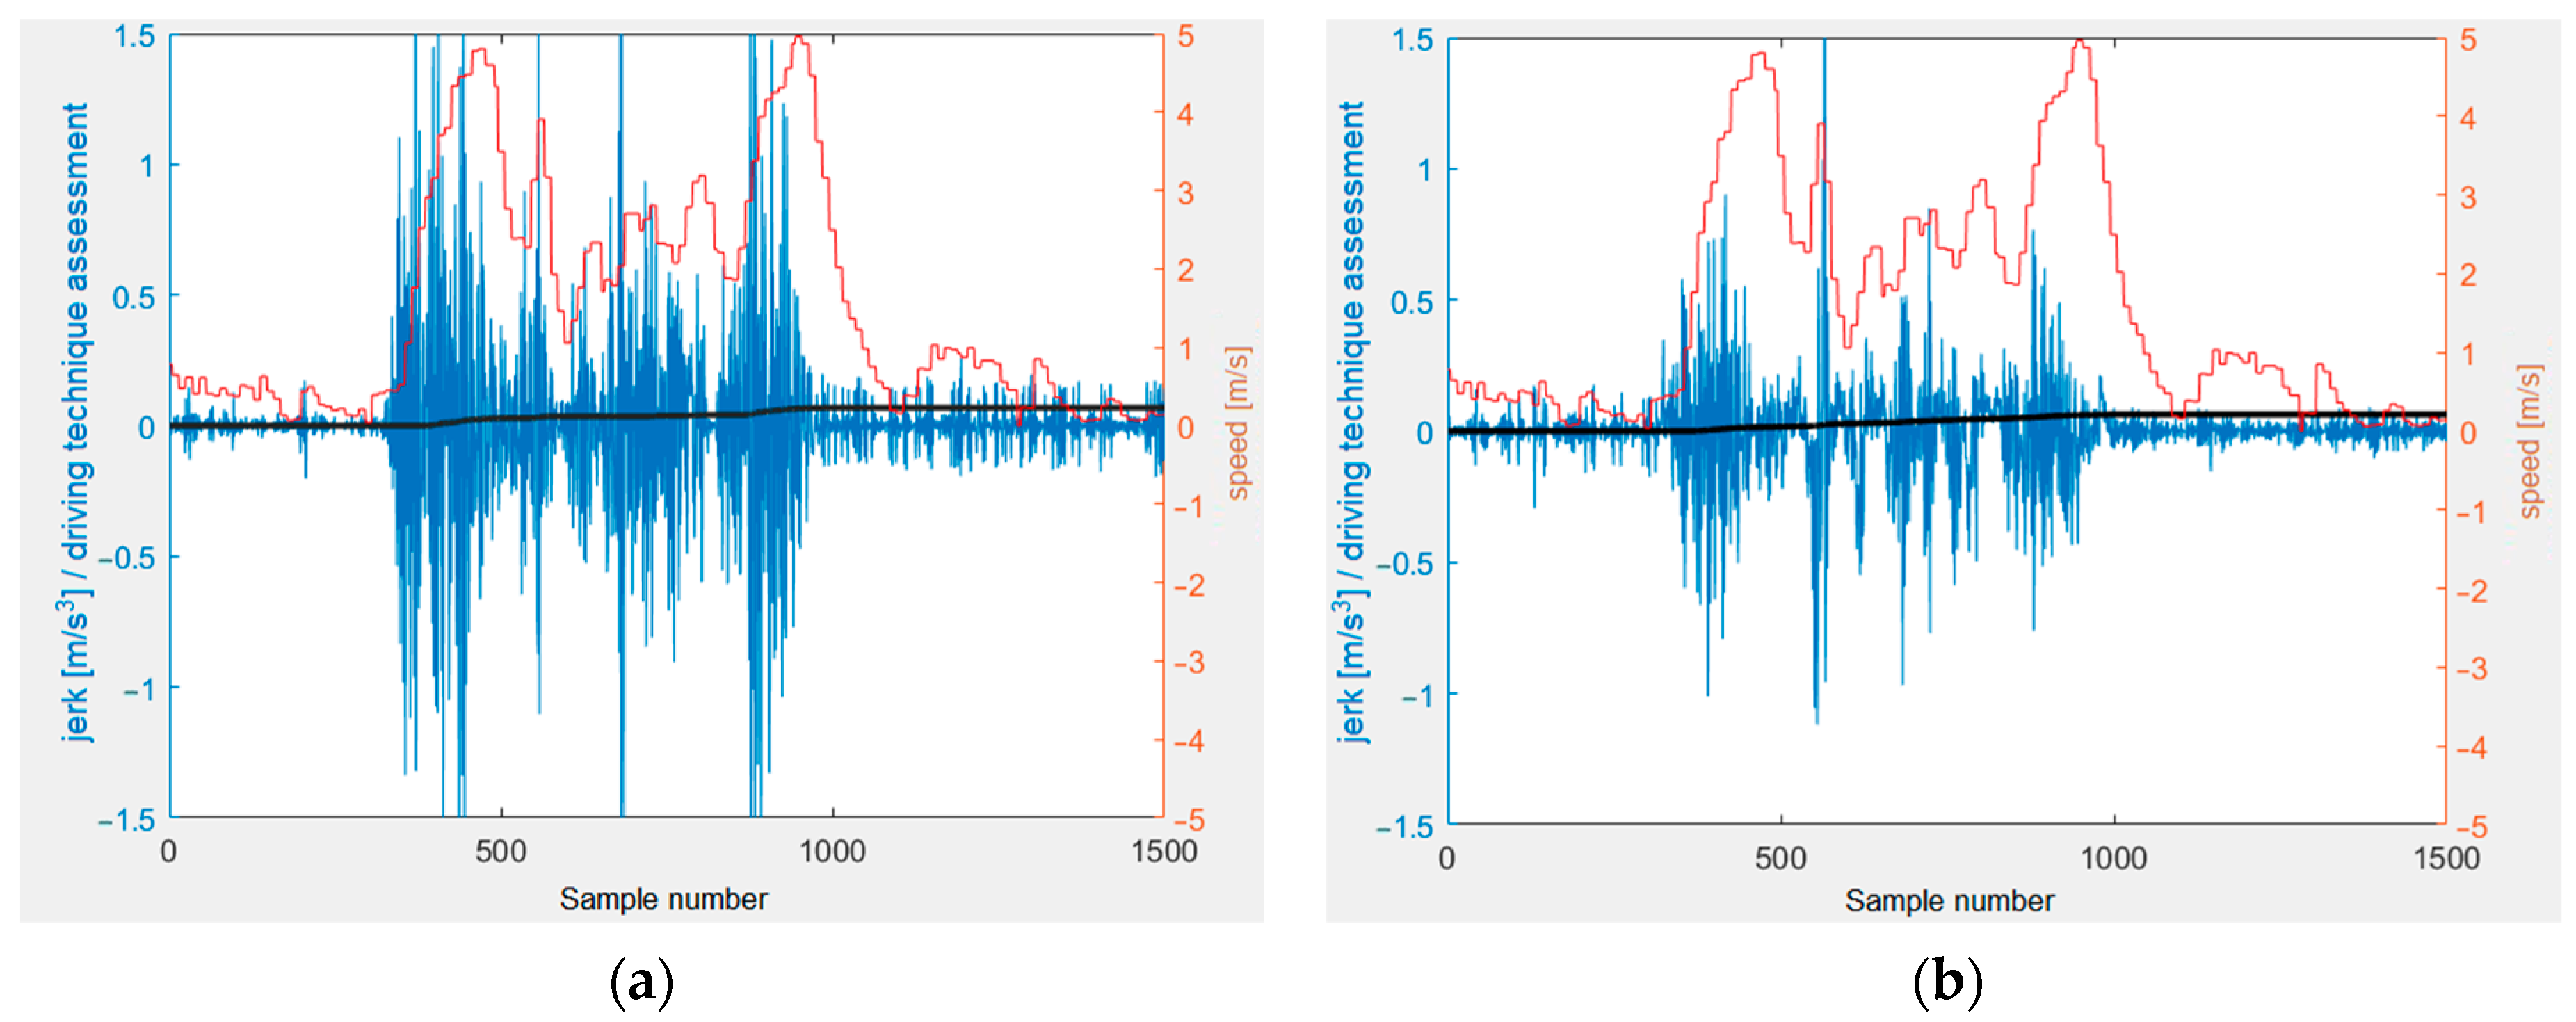
In addition, measurements were taken on the Sobieski tram loop, without passengers, during emergency braking from low speeds. Speeds were limited to a dozen km/h in order not to cause excessive wear of the tram braking system. The recorded jerks, velocities, and instantaneous values of the evaluation algorithm at that time are shown in
Figure 11. The values of the evaluations of driving techniques on a point scale are not shown, as the number of recorded samples from which this evaluation could be calculated was too small. Note that the displayed speeds are derived from GPS readings, which are delayed. Thus, due to sudden transitions from start to stop, actual maximum speeds were not recorded correctly. It is clearly visible that after successive speed changes, the values of the evaluation algorithm (in black) grow.
The results achieved indicate that the selected method to assess the accuracy of the driving technique is correct and can be further developed. It seems crucial to carry out further measurements with a larger group of test subjects. On the basis of their assessment of the driving technique, it will be possible to precisely calibrate the proposed algorithm. A high subjective agreement was obtained, and further tests of the proposed algorithm are necessary. It was found that for two Tramino S105p trams, in which measurements were carried out, there are differences in the indications of the device. This may be related to the different technical conditions of suspension of these trams.
6. Discussion
Driving a tram comfortably for the passenger is a difficult task. The tram driver must take care, first of all, of the safety of the passengers being transported. In traffic, there are situations where they are forced to brake abruptly by pedestrians or cars that are suddenly on the track. In addition to these cases, their driving style has a decisive impact on the comfort of the passengers they carry. Vibration standards are provided mainly for railroads, and there are no such standards for tramways, practically.
The accelerations in question can be caused by several factors. On the one hand, the tram driver must strive to meet the schedule on time, which is made more difficult by unforeseen situations occurring in traffic, waiting for reaching passengers, boarding and alighting of disabled people, etc. In an attempt to “make up” for lost time, the tram driver often drives more “aggressively”.
However, passing at higher speeds through tight curves and areas of track damage leads to greater lateral vibrations and uncomfortable (in extreme cases dangerous) accelerations for passengers. In addition, excessive accelerations cause greater wear and tear on the rolling stock, which must increase operating costs.
Furthermore, the ability to obtain acceleration data may be important to those who supervise tram drivers’ work and affect the quality of training and quality control of individual tram drivers. Analysis of lateral vibrations at known tram speeds in the long term may allow monitoring of the progressive wear and tear of the track. This is why, according to the authors, it is so important to monitor the acceleration in both directions, which has been done in this work.
In the case of the latest trams, it is possible to program the maximum values of jerks obtained during speed changes, making starts and breaks much smoother. In these trams, motor control is carried out by means of an electronic system, which the tram driver controls with a joystick. Practically all modern trams are equipped with the joystick, such as the Solaris Tramino S105p (
Figure 12). Nevertheless, sudden speed changes are still possible and uncomfortable for passengers, as is driving at excessive speeds in areas of track damage, where lateral jerks additionally occur.
Regardless of the type of tram, lateral jerks can also be caused by the poor condition of the tram suspension. The values of lateral jerks in the same locations at the same speeds are affected by the design of the trams. Typically, trams based on bogies rigidly connected to the body (e.g., Siemens Combino, Solaris S105p) show much higher jerks than cars based on torsion bogies (e.g., Tatra T3 and T4 or 105N generation trams). In the case of lateral jerks, improvements in passenger comfort can be achieved by providing proper training for tram drivers who drive different types of trams, maintaining the suspension of trams in proper condition, and regularly repairing track deformations.
Certainly, jerks resulting from improper driving techniques can be reduced by proper training for tram drivers. Furthermore, during the experiment, it was proven that gentle driving can lead to a significant reduction in tram energy consumption (up to approximately 30%) without any noticeable impact on punctuality. Therefore, encouraging drivers to adopt a gentle driving style will lead to significant financial savings for transport companies with many trams. The environmental benefits of the reduced energy demand are also significant. The prototype device presented in this work can be very helpful in this regard. The authors are convinced that it will encourage tram drivers to constantly improve their driving techniques. However, more research is needed in this area.
7. Conclusions
The article analyzes the issues related to the use of the tram in a correct and comfortable way for passengers, taking into account the energy-saving driving style. The focus was on lateral and longitudinal accelerations relative to the direction of travel. It was found that their automatic analysis can help the tram driver learn how to drive the tram smoothly in standard situations. And, just as importantly, by improving the driving technique, several dozen percent savings in energy consumption can be achieved.
It was assumed that when evaluating driving technique and driving comfort, the jerks on the X and Y axes should be taken into account. The values of jerks can be monitored and used to assess the driver’s driving technique.
For this purpose, a test device was proposed to analyze the driving technique of a tram driver. The device proposed in the article enables the measurement of jerks and based on them, the assessment of the driver’s driving technique. Due to its small size and low price, it can be installed on series of trams. A measuring scale was developed for it and the correlation of its indications with the feelings of people participating in the tests was confirmed. It has been shown that the use of IMU sensors to analyze the tram steering technique is possible. Cheap and widely available components can be used to build such a device. Preliminary tests have confirmed the effectiveness of this device.
The experiment described at the beginning conclusively proved that regardless of the driving conditions (variable number of passengers on the tram, variable number of stops on the route, different outside temperatures forcing the air conditioning to work or not), a significant amount of electricity can be saved. Furthermore, gentle driving does not have to cause delays in the schedule.
The authors plan to continue research on different types of trams and multiple trams of the same type operated by different tram drivers. More studies are planned to involve a larger group of people. Due to their assessment of the driving technique, it will be possible to better calibrate the device’s indications. Such research will be in line with the SmartCity development trend, ensuring the maximization of residents’ living comfort and that electricity consumption is reduced. Optimization of the driving technique will directly reduce the cost of running the transport company and will have a positive impact on the environment.


