Article

Evaluation of Building Mass Characterization for Energy Flexibility through Rule- and Schedule-Based Control: A Statistical Approach

Institute of Structural Mechanics and Design, Department of Civil and Environmental Engineering, Technical University of Darmstadt, 64287 Darmstadt, Germany
*
Author to whom correspondence should be addressed.
Energies 2023, 16(19), 6878; https://doi.org/10.3390/en16196878
Submission received: 28 August 2023 / Revised: 21 September 2023 / Accepted: 25 September 2023 / Published: 29 September 2023

Abstract

:
As renewables become more established in the electricity grid, the focus, and therefore adaptability, will need to shift from the generation side to the demand side. Since the building sector accounts for a large share of the energy demand, it will be strongly affected by this development. One possibility for adaptation is so-called demand side management (DSM). To assess the contribution of the building sector to energy flexibility, some key performance indicators (KPIs) have already been developed in previous work. In this study, we investigate and statistically compare two control strategies for temporarily raising the room temperature—one rule-based and one schedule-based—with regard to their influence on the characterization of the building mass as a type of thermal energy storage. In each case, we determine the thermal energy demand of a residential district based on a dynamic simulation that occurred for a period of one year. The rule-based control assigns in the median approximately 60% (mean: 41%) less capacity to the building mass than the schedule-based control for the same boundary conditions. The calculation of the time-independent heating load results in a median difference of 34% (mean: 36%). In addition, the establishment of energy-flexible control in the evening hours just before a night-time reduction in the room temperature has a negative impact on the efficiency of the thermal storage.

1. Introduction

As part of the energy transition, the German government has committed itself to achieving greenhouse gas neutrality by 2045 [1]. This also applies to the national electricity grid, which means that an accelerated expansion of renewable energies is being promoted. Weather-dependent and therefore fluctuating power sources such as wind and solar power require a trend reversal in energy systems [2,3]. Storage technologies can already be used to transfer energy surpluses in times of energy shortages and thus partially cover demand and stabilize the electrical grid [4]. However, the focus and adaptability will have to shift from electricity generation to the demand side to avoid grid overloads. It will be necessary to adjust the energy demand to compensate for surpluses and shortages in energy supply [5,6]. Given that the building sector accounts for 40% of total energy consumption worldwide [7], there is significant potential for future energy systems to achieve a higher share of renewability and energy flexibility on the demand-side [8]. The implementation of energy flexibility in buildings has also already found its way into EU directives. The 2018 revision of the energy performance of buildings directive (EPBD) highlights the importance of energy flexibility in buildings and introduces the Smart Readiness Indicator (SRI) to assess a building’s ability to adapt its operation to the needs of the occupants and the requirements of the grid, and goes beyond a mere energy label [9]. The International Energy Agency’s (IEA) Energy in Buildings and Communities Program (EBC) Annex 67 has focused more generally on defining energy flexibility in buildings [10]. This includes the effective management of both demand and generation to match local climate conditions, user preferences, and energy grid requirements.
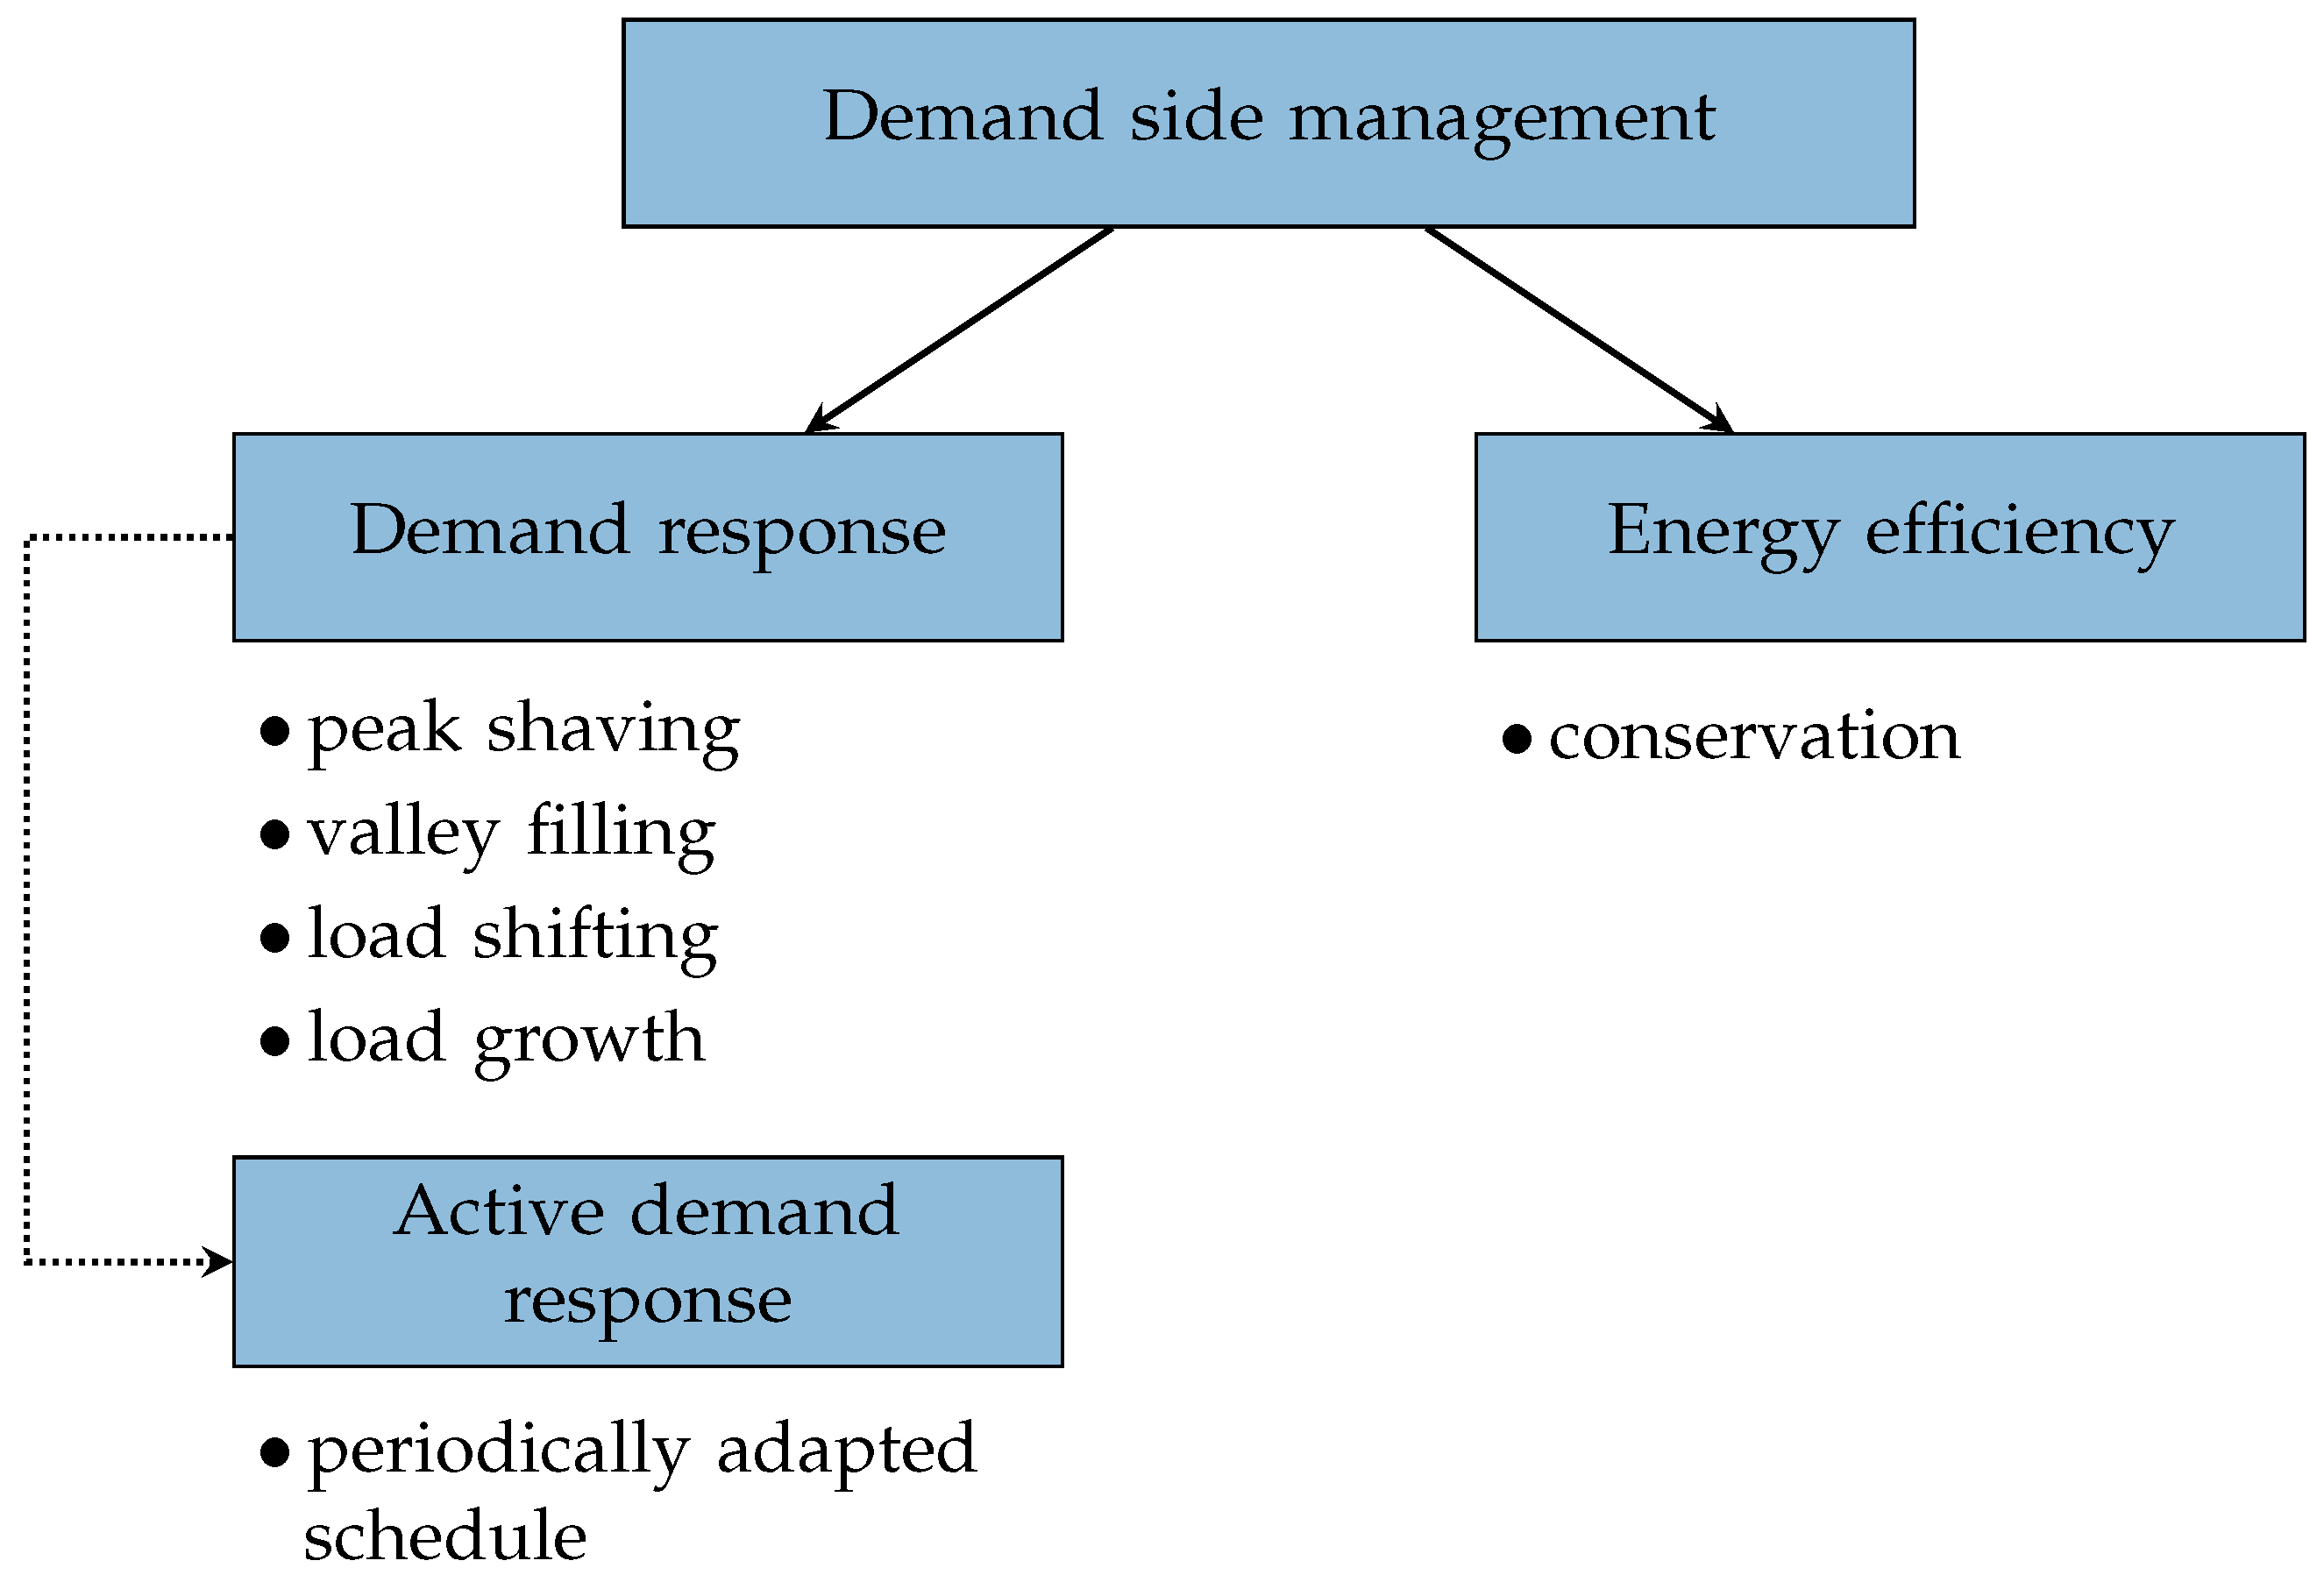
Within this domain, demand side management (DSM) offers a wide range of methods to influence electricity demand patterns. These methods include reduction (peak shaving, conservation), increases (valley filling, load growth), and rescheduling (load shifting) in electrical loads [11,12]. The term demand response (DR) includes all of the measures that are not categorized within energy efficiency [13], as shown in Figure 1. In practice, DR strategies can be implemented through active demand response (ADR), which employs short-term load management tactics [14]. The goal of ADR is to meet day-ahead load curve constraints by adjusting the daily schedule based on factors such as user behavior, weather conditions, and energy market prices.
To create a financial incentive for consumers to participate in ADR measures on DSM, a control signal can be implemented through a dynamic price tariff, which may be based on the electricity market price or locally generated energy as described by Lauro et al. [14], Arteconi et al. [15], Arteconi and Polonara [16], de Coninck and Helsen [17] and Luc et al. [18]. In Germany, the Act to Restart the Digitization of the Energy Transition came into force in May 2023, obliging electricity providers to include dynamic electricity prices in their portfolios by 2025, paving the way for energy-flexible applications [19]. Examples of common household electrical appliances suitable for ADR include time-controlled appliances such as washing machines and dishwashers, and thermostatically controlled appliances such as heat pumps or boilers [20], which are essential for space heating and domestic hot water production. In particular, the inherent thermal inertia of the building mass [21], which is often present anyway, and/or additional thermal energy storage (TES) [22] can contribute to load shifting in combination with heat pumps: the thermal storage systems allow short- to medium-term changes in the load pattern without compromising indoor comfort. The floor heating system used at low supply temperatures contributes to active thermal storage systems and thus represents a possibility for the implementation of thermally activated building structures (TABS) [15].
Developing a methodology to assess and quantify the energy flexibility of buildings is a crucial challenge when it comes to recognizing their active role in future energy networks [23]. Several approaches have already been introduced in the literature and presented in the form of key performance indicators (KPIs), considering different aspects. According to Li et al. [24] the top five popular energy flexibility metrics are Peak Power reduction [25], the Flexibility Factor [26], Self-Sufficiency and Self-Consumption [27], the Capacity and the Efficiency of ADR [28] and the Flexibility Index [29]. The method presented by Reynders et al. [28] does not directly consider monetary savings from an optimized DSM, but is dedicated to quantifying the building mass as a storage option during an ADR. For this purpose, the setpoint temperature in the heated spaces is increased for a certain time and the thermal energy stored in the activated building mass is evaluated [18,26,30]. The increase in the setpoint temperature can be controlled by a fixed schedule or according to certain rules via an external signal, such as the electricity market price [16,18,31,32]. The factors influencing thermal capacity and efficiency in terms of ADR have been studied several times, e.g., by Vivian et al. [33], comparing different building ages and insulation thicknesses. Foteinaki et al. [32] further developed different signal scenarios and investigated flexible peak load and cost reduction in residential buildings. However, we are not aware of any research that statistically quantifies the storage capacity and storage efficiency of building mass over the term of one year, comparing the different results for control strategies, namely rule-based and schedule-based strategies.
In this study, we determine the storage capacity and efficiency of ADR of a newly planned residential district in Darmstadt, Germany, by means of a dynamic building simulation including energy flexible control, according to Reynders et al. [28]. The novelty lies in the statistical comparison of two different energy flexible control signals, namely rule-based and schedule-based signals, and their effect on the characterization of the building mass in terms of its ability to provide an electrical grid serving behavior.
In Section 2, the method used to quantify the building mass, the control options, the statistical evaluation, and the building simulation model is presented. In Section 3 the duration, the additional heat demand and the additional heating load of the two control strategies, both rule-based and schedule-based, are calculated with the building simulation. First, an analysis without night-time reduction in the room temperature is carried out, followed by the more realistic case that includes night-time reduction. In Section 4, we discuss the results of the different control strategies and the main conclusions are drawn.

2. Materials and Methods

2.1. Energy Flexibility Event

In this study, the active demand response (ADR) strategy for the inherent thermal inertia of the building mass is achieved by temporarily raising the setpoint room temperature to the upper limit of a temperature comfort band. The permitted range is defined from  T low  = 20.5  C to  T up  = 22  C, in accordance with other publications such as Arteconi et al. [31]. This enables an additional heat input into the building mass, which is activated by the floor heating system. The resulting upward process of the room temperature compared to a reference control that maintains the lower limit  T low  of the comfort band is defined below as an up event and can usually be divided into three phases, as shown in Figure 2, and is used by several other authors [32,34]:
  • Charge: compared to the lower limit of the comfort temperature  T low , the increase in the setpoint temperature to  T up  leads to an increased heating load and, accordingly, the building mass is charged with thermal energy.
  • Steady state: the raised setpoint temperature  T up  is reached and only the increased transmission heat losses are additionally compensated compared to the reference state with the continuous lower setpoint temperature  T low .
  • Discharge: the reset of the setpoint temperature to  T low  leads to a decreased heating load compared to the reference state and, accordingly, the building mass is discharged
A temporary decrease in the setpoint temperature, referred to as a downward event, is also possible for energy flexibility purposes, but is not investigated further in this work. The properties of the respective phases, such as duration t, amount of added heat Q and heating load P, can be derived from the following equations, where “up” denotes the case with and “ref” the case without ADR:
t charge = t 1 t 0
t steady   state = t 2 t 1
t discharge = t 3 t 2
Q charge = t 0 t 1 ( P up P ref ) d t
Q steady   state = t 1 t 2 ( P up P ref ) d t
Q discharge = t 2 t 3 ( P up P ref ) d t
P charge = Q charge t charge
P steady   state = Q steady   state t steady   state
P discharge = Q discharge t discharge

2.2. Capacity and Efficiency of ADR through Up Events

According to Reynders et al. [28], the characteristics of the activated building mass can be derived from the three phases of an up event. The amount of additional heat required in the charge phase represents the storage capacity  C ADR  in an energy flexibility event enabled by ADR (Equation (10)). In addition to the actual building mass, the control-related setpoint temperatures ( T low  and  T up ) also have a significant influence. It is therefore important to ensure that the same boundary conditions are used in all studies. Furthermore, the charge phase must be clearly distinguished from the steady state phase to avoid incorrectly assigning the increased transmission heat losses to the storage capacity. Reynders et al. [28] did not make this distinction due to relatively short steady state phases.
C ADR = Q charge
η charge / discharge = | Q discharge | Q charge
η up = | Q discharge | Q charge + Q steady state
The efficiency of the up event or thermal storage in the energy-flexible control can also be determined from the three phases. This allows a comparison with conventional storage technologies and represents the basis for an economic evaluation; for example, with dynamic electricity prices. To identify the influence of the higher transmission heat losses when maintaining the increased setpoint temperature, the storage efficiency  η  is calculated in this study both with (Equation (11)) and without (Equation (12)) the steady state phase.

2.3. Implementation of Control Strategies

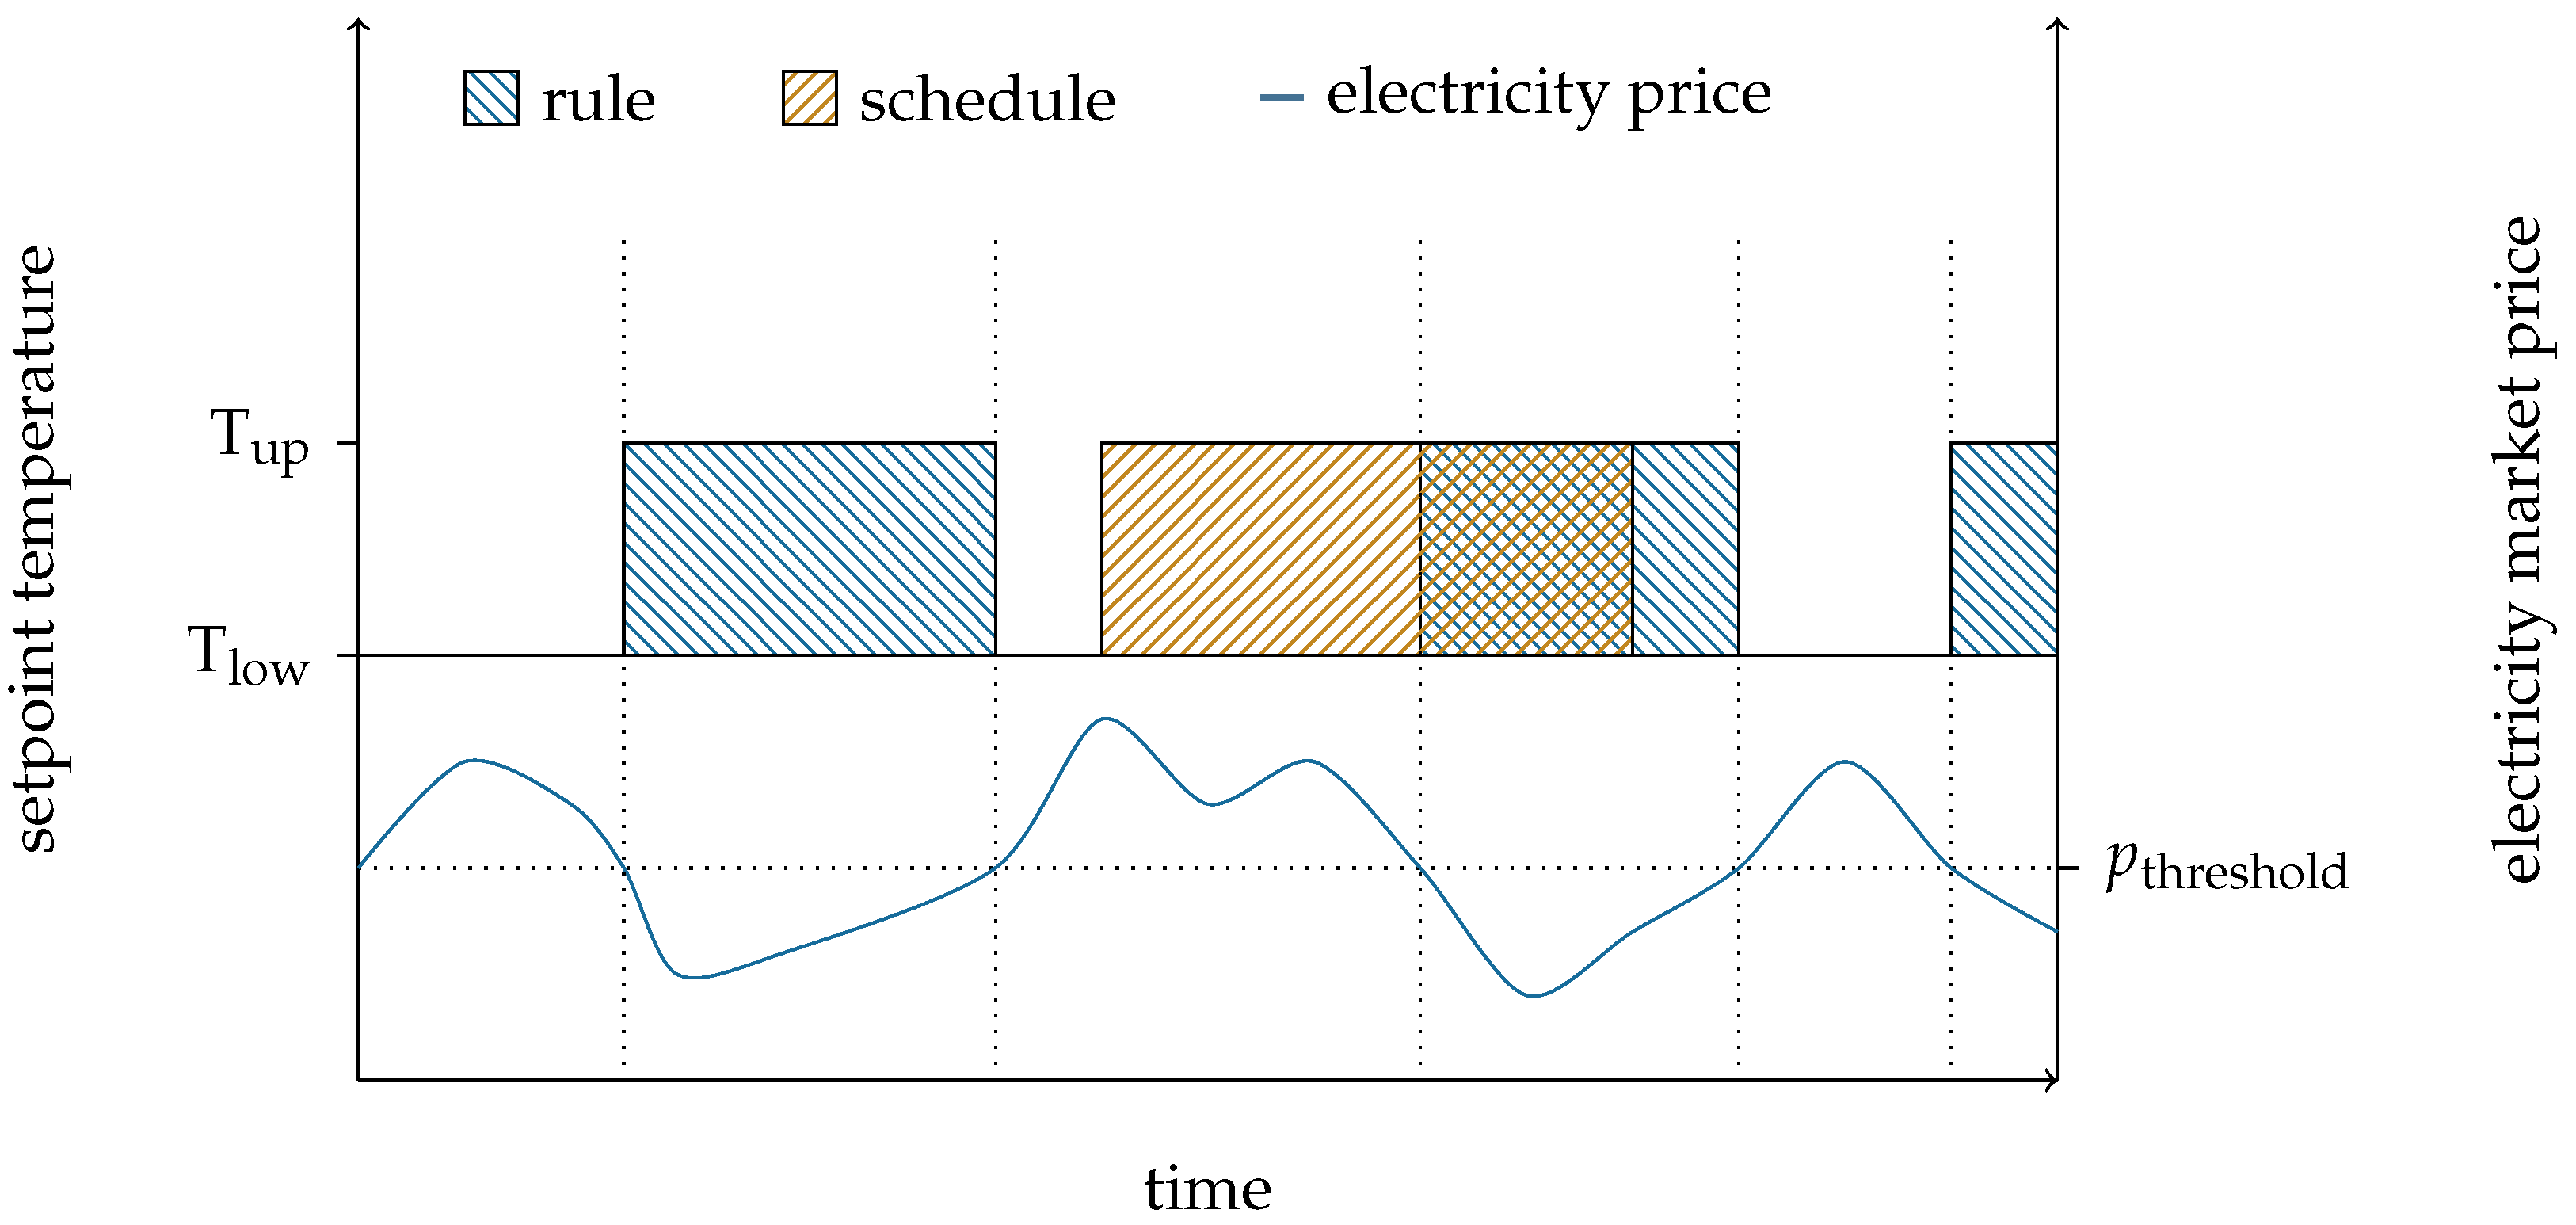
The energy flexible control is implemented in two ways: rule-based and schedule-based, as shown in Figure 3. The rule-based control uses a signal that increases the setpoint temperature from T low  = 20.5  C to T up  = 22  C when prices are favorable, depending on the electricity market. For this purpose, spot market electricity prices from 2021 in Germany are selected at an hourly resolution and the lower quantile is calculated monthly as described by Foteinaki et al. [32]. If the price falls below the quantile, the setpoint temperature is increased. Accordingly, there are shorter and longer energy flexibility events. The schedule-based variant is characterized by a fixed period per day in which the setpoint temperature is increased from 20.5  C to 22  C, as described in many publications [30,31]. In this study, the approximate mean duration of the rule-based control events of 2.5 h, taking into account a night-time reduction in the temperature, is used to set the duration of the schedule-based control and to ensure comparability. The afternoon from 2 pm to 4.30 pm is the time period chosen to precondition the building mass for the evening hours, as it means that tenants do not need to turn on the heating system when coming home from work.

2.4. Identification of Phases in Up Events

To separate the phases of all up events from one another, rules are required that identify each of them properly. However, fluctuations in room temperature due to external influences complicate this process and lead to misidentification of some energy flows. For example, a room temperature fluctuating around the increased setpoint temperature due to a hysteresis control should be assigned to a single steady state phase and not to many shorter charge and discharge phases. The rules for determining the current phase i in each time step are implemented as follows, where  T air  represents the simulated room temperature with and  T air , ref  without energy flexible control:
i charge ( T set , T air ) = 1 , if ( T set = T up T air < T up 0.25 ) 0 , otherwise
i steady   state ( T set , T air ) = 1 , if ( T set = T up T air T up 0.25 T air < T up + 0.1 ) 0 , otherwise
i discharge ( T set , T air , T air , ref ) = 1 , if ( T set T low T air < T up 0.25 T air > T air , ref + 0.055 ) ( T set = T low T air T low T air > T air , ref + 0.055 ) 0 , otherwise
The identification of the discharge phase  i discharge  refers to the temperature decrease to the lower comfort temperature  T low , as well as to the heating up in the morning after a night-time reduction. If the discharge phase occurs during the night-time reduction, no energy can be saved compared to the reference state, but a higher initial temperature can be assumed in the morning. The discharge phase can therefore also take place during active heating. To verify the correct identification of the individual phases using the method described above, the overall efficiency  η up , tot  of all up events (Equation (16)) is alternatively calculated by simply comparing the simulation with up events to the reference simulation without up events (Equation (17)).
η up , tot = | j = 1 n Q discharge , j | j = 1 m Q charge , j + j = 1 p Q steady state , j
η up , alt = | 0 t = 1 a ( P up P ref ) d t | 0 t = 1 a ( P up P ref ) + d t

2.5. Statistical Evaluation

Depending on the type of energy flexible control, e.g., rule-based or schedule-based, up events will always occur at the same time or be distributed throughout the day. External boundary conditions such as solar radiation, ambient temperature and internal heat gains ensure that every up event is unique. In order to obtain a representative capacity and efficiency for the characterization of the building mass by the rule-based and schedule-based control, we perform a simulation over a whole year and statistically evaluate the up events in the heating period. As the generated data are not necessarily normally distributed, the median is calculated in addition to the mean to compare the control strategies. However, since the size of the data sets (rule-based and schedule-based) is limited by the simulation duration and the time steps, it must also be determined whether they are statistically suitable for comparison at all.
The Brunner–Munzel test [35] can be used for non-normally distributed data sets to test whether there is a stochastic difference between two sets. The null hypothesis, which is the statement being tested, is that there is no significant difference (in terms of central tendency) between the two sets of data, rule-based and schedule-based. A probability of p ≤ 0.05 is considered significant and means that it is safe to assume that there is indeed a difference between the two sets and, therefore, a valid comparison of the means and medians is possible. However, a p-value greater than 0.05 does not mean that the two sets are stochastically equal. The data quality is simply not good enough to interpret the observed direction. In the box plots, the following annotation is selected to indicate a significant difference that allows comparability:
  • p > 0.05: ns (not significant)
  • p ≤ 0.05: * (significant)
  • p ≤ 0.01: ** (significant)
  • p ≤ 0.001: *** (significant)
  • p ≤ 0.0001: **** (significant)

2.6. Building Energy Simulation and Boundary Conditions

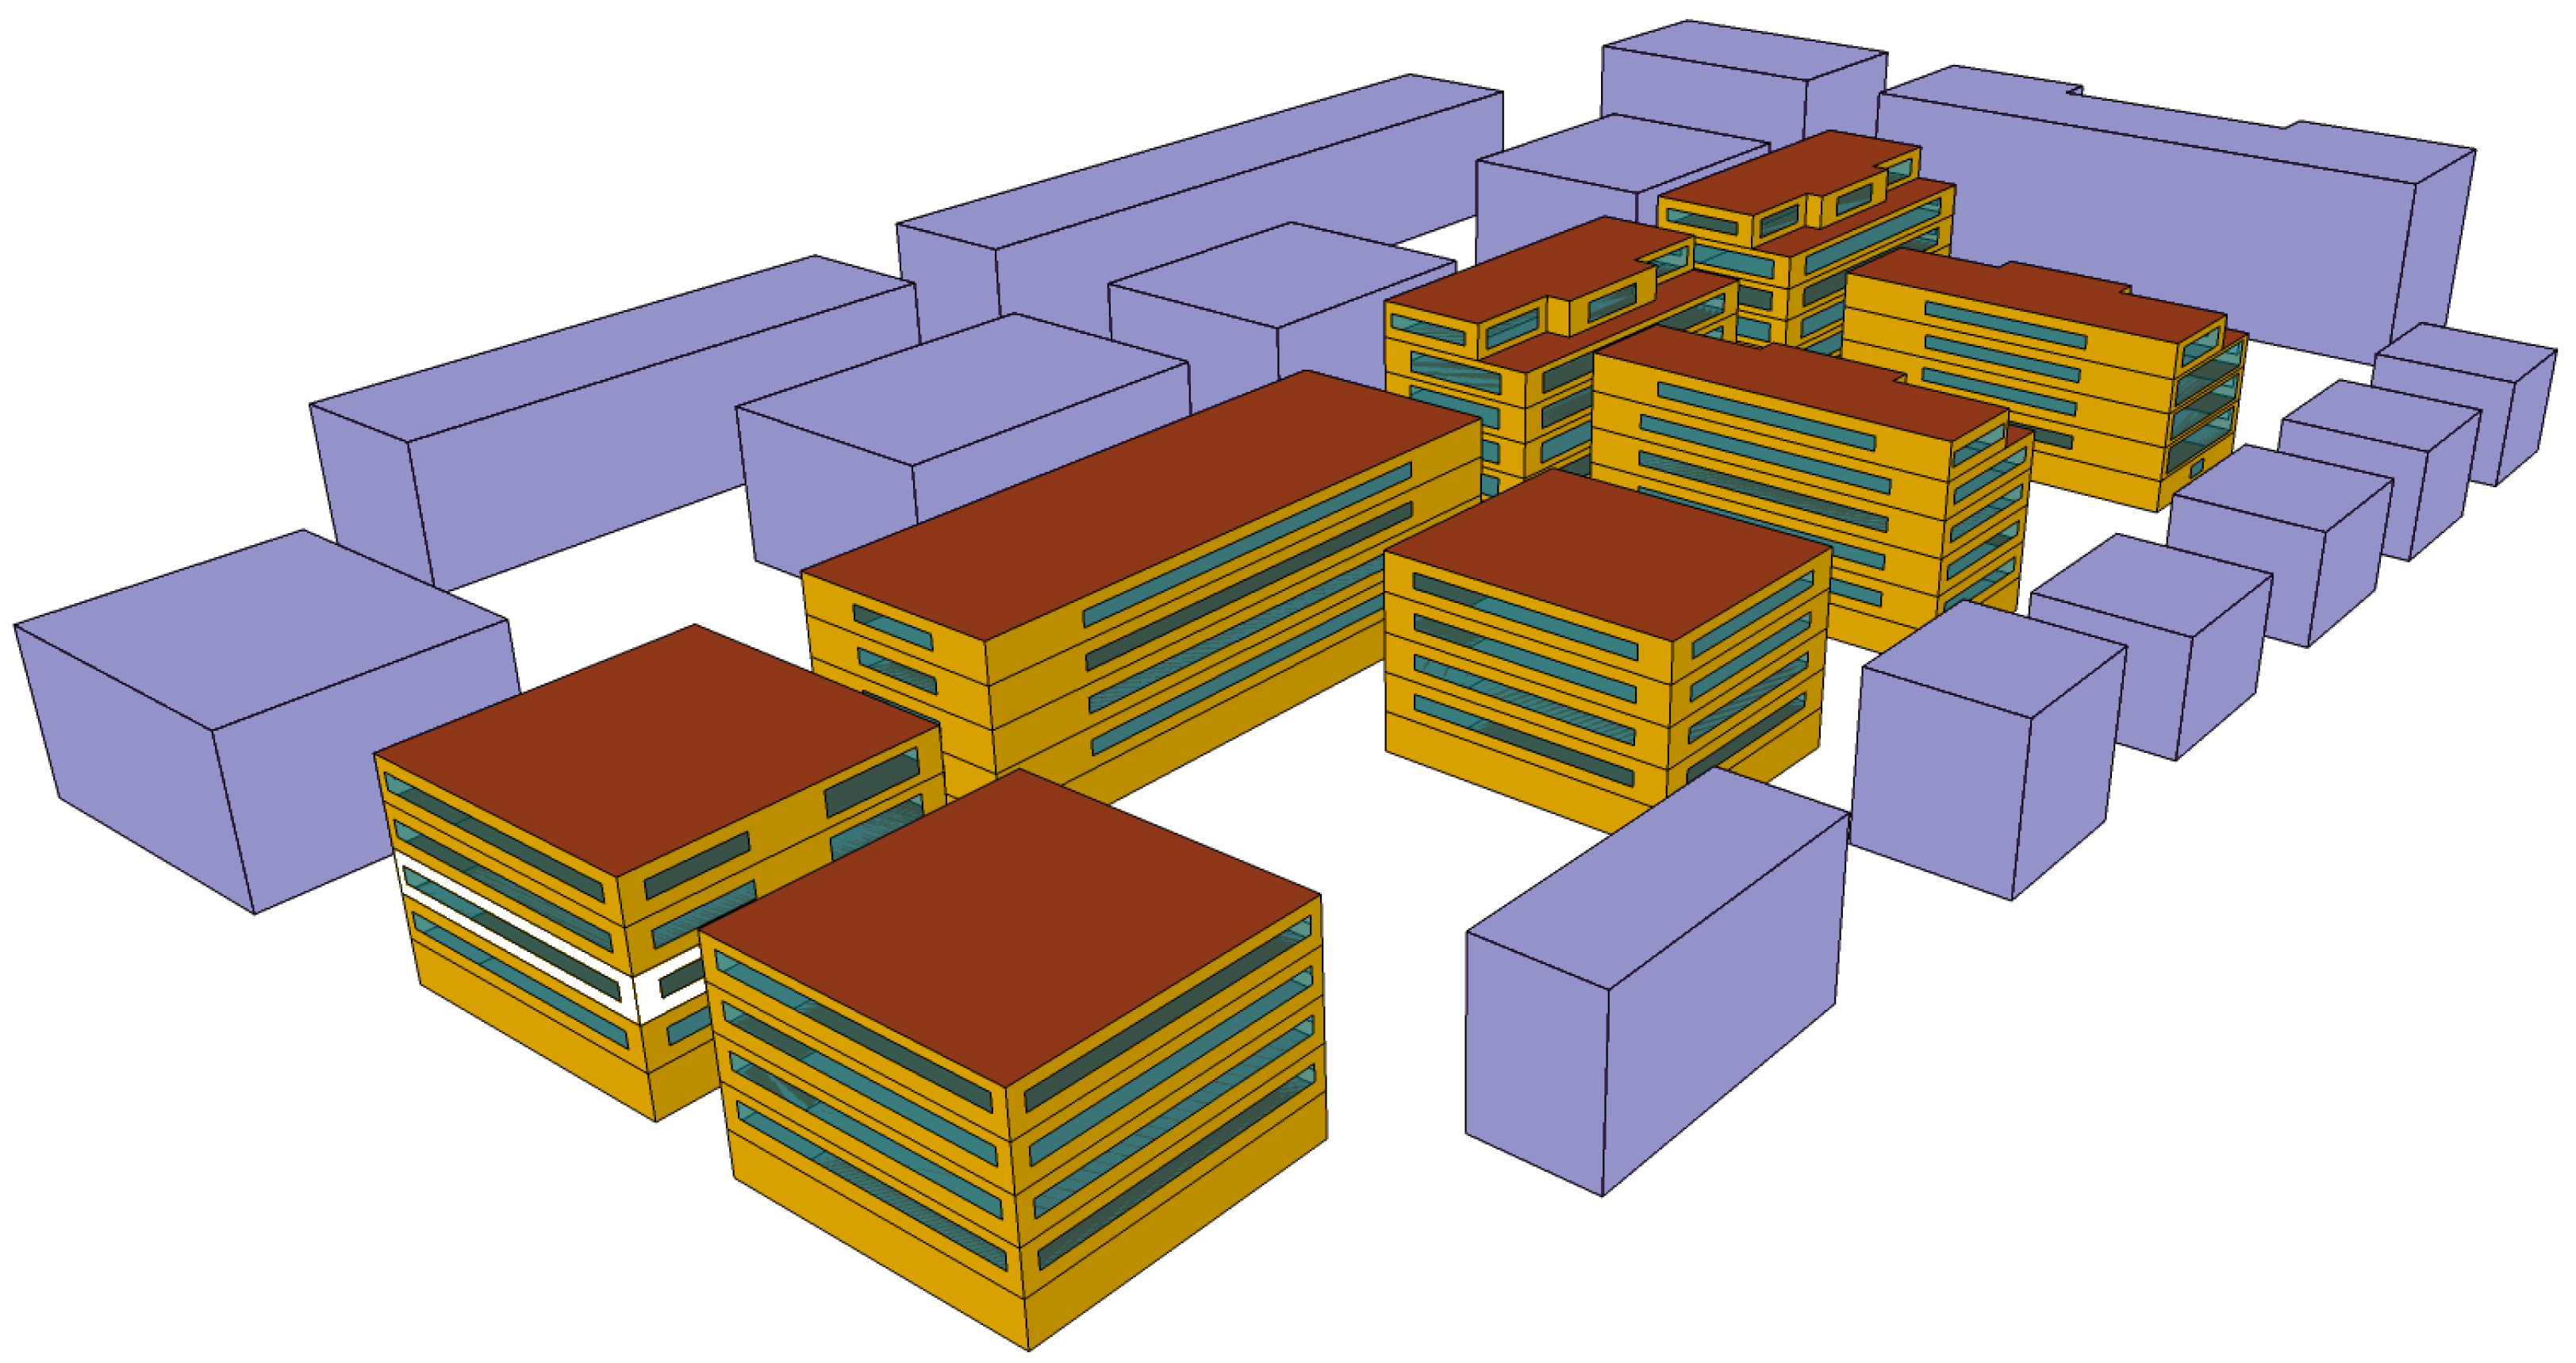
The subject of the study is a new high-energy-standard residential district planned in Darmstadt, Germany, consisting of eight multi-family buildings with a total of 140 residential units, to be completed in 2025. Three decentralized water-to-water heat pumps connected to a central borehole heat exchanger field provide the heat supply. We implemented a detailed model of the building energy system using the simulation software Trnsys18. Trnsys is a graphical software environment used to simulate the behaviour of transient systems [36], based on the Fortran programming language. There are other tools for dynamic building simulations available, such as EnergyPlus [37], IDA ICE [38] or Modelica [39]. Despite different levels of detail and focus, the simulation tools show good agreement in the results for the calculation of energy demand [40]. In this study, the energy supply system is not considered; instead, a constant supply temperature of the floor heating system of 40  C is assumed, as only the building mass is to be evaluated. To reduce complexity, the individual apartments were grouped floor by floor into one thermal zone each, which proved to be a good compromise between simulation speed and accuracy [41,42]. The statistical investigation of the individual phases as well as the storage capacity is carried out as an example on the second floor of the northeastern building, as shown in Figure 4, to limit the scope within this study, while the storage efficiency is calculated for all floors of all buildings due to the reasons mentioned in Section 2.4. The building simulation also contains the basements, which are not actively heated and are therefore not part of the energy-flexible control.
The boundary conditions of the simulation model are defined to correspond to the aforementioned district in Darmstadt, Germany. For the weather data, the test reference year 2015 of dwd is chosen, which also considers solar radiation. The internal heat sources and the minimum air exchange rate are selected according to the user boundary conditions of DIN V 18599 [43]. All boundary conditions are listed in Table 1. The annual space heating demand, determined using the dynamic simulation with time steps of one minute, is 23.22 kWh·m 2 · a 1  for the described district section.

3. Results

In this section, we evaluate and compare the properties of the up events, i.e., raising the setpoint temperature from 20.5  C to 22  C in schedule-based and rule-based control. The thermal simulation is carried out once with and once without night-time reduction in the room temperature. The focus is on the statistical distribution of the individual phases in the up events in terms of their duration and stored thermal energy over a whole year. Subsequently, we calculate the storage capacity and the storage efficiency for both control strategies according to Reynders et al. [34]. The methodology for the statistical study of the phases is performed for a selected zone to limit the scope within this study. The comparison of annual efficiencies includes all floors of all buildings.

3.1. Statistical Evaluation of Up Events with Schedule-Based and Rule-Based Control without Night-Time Reduction

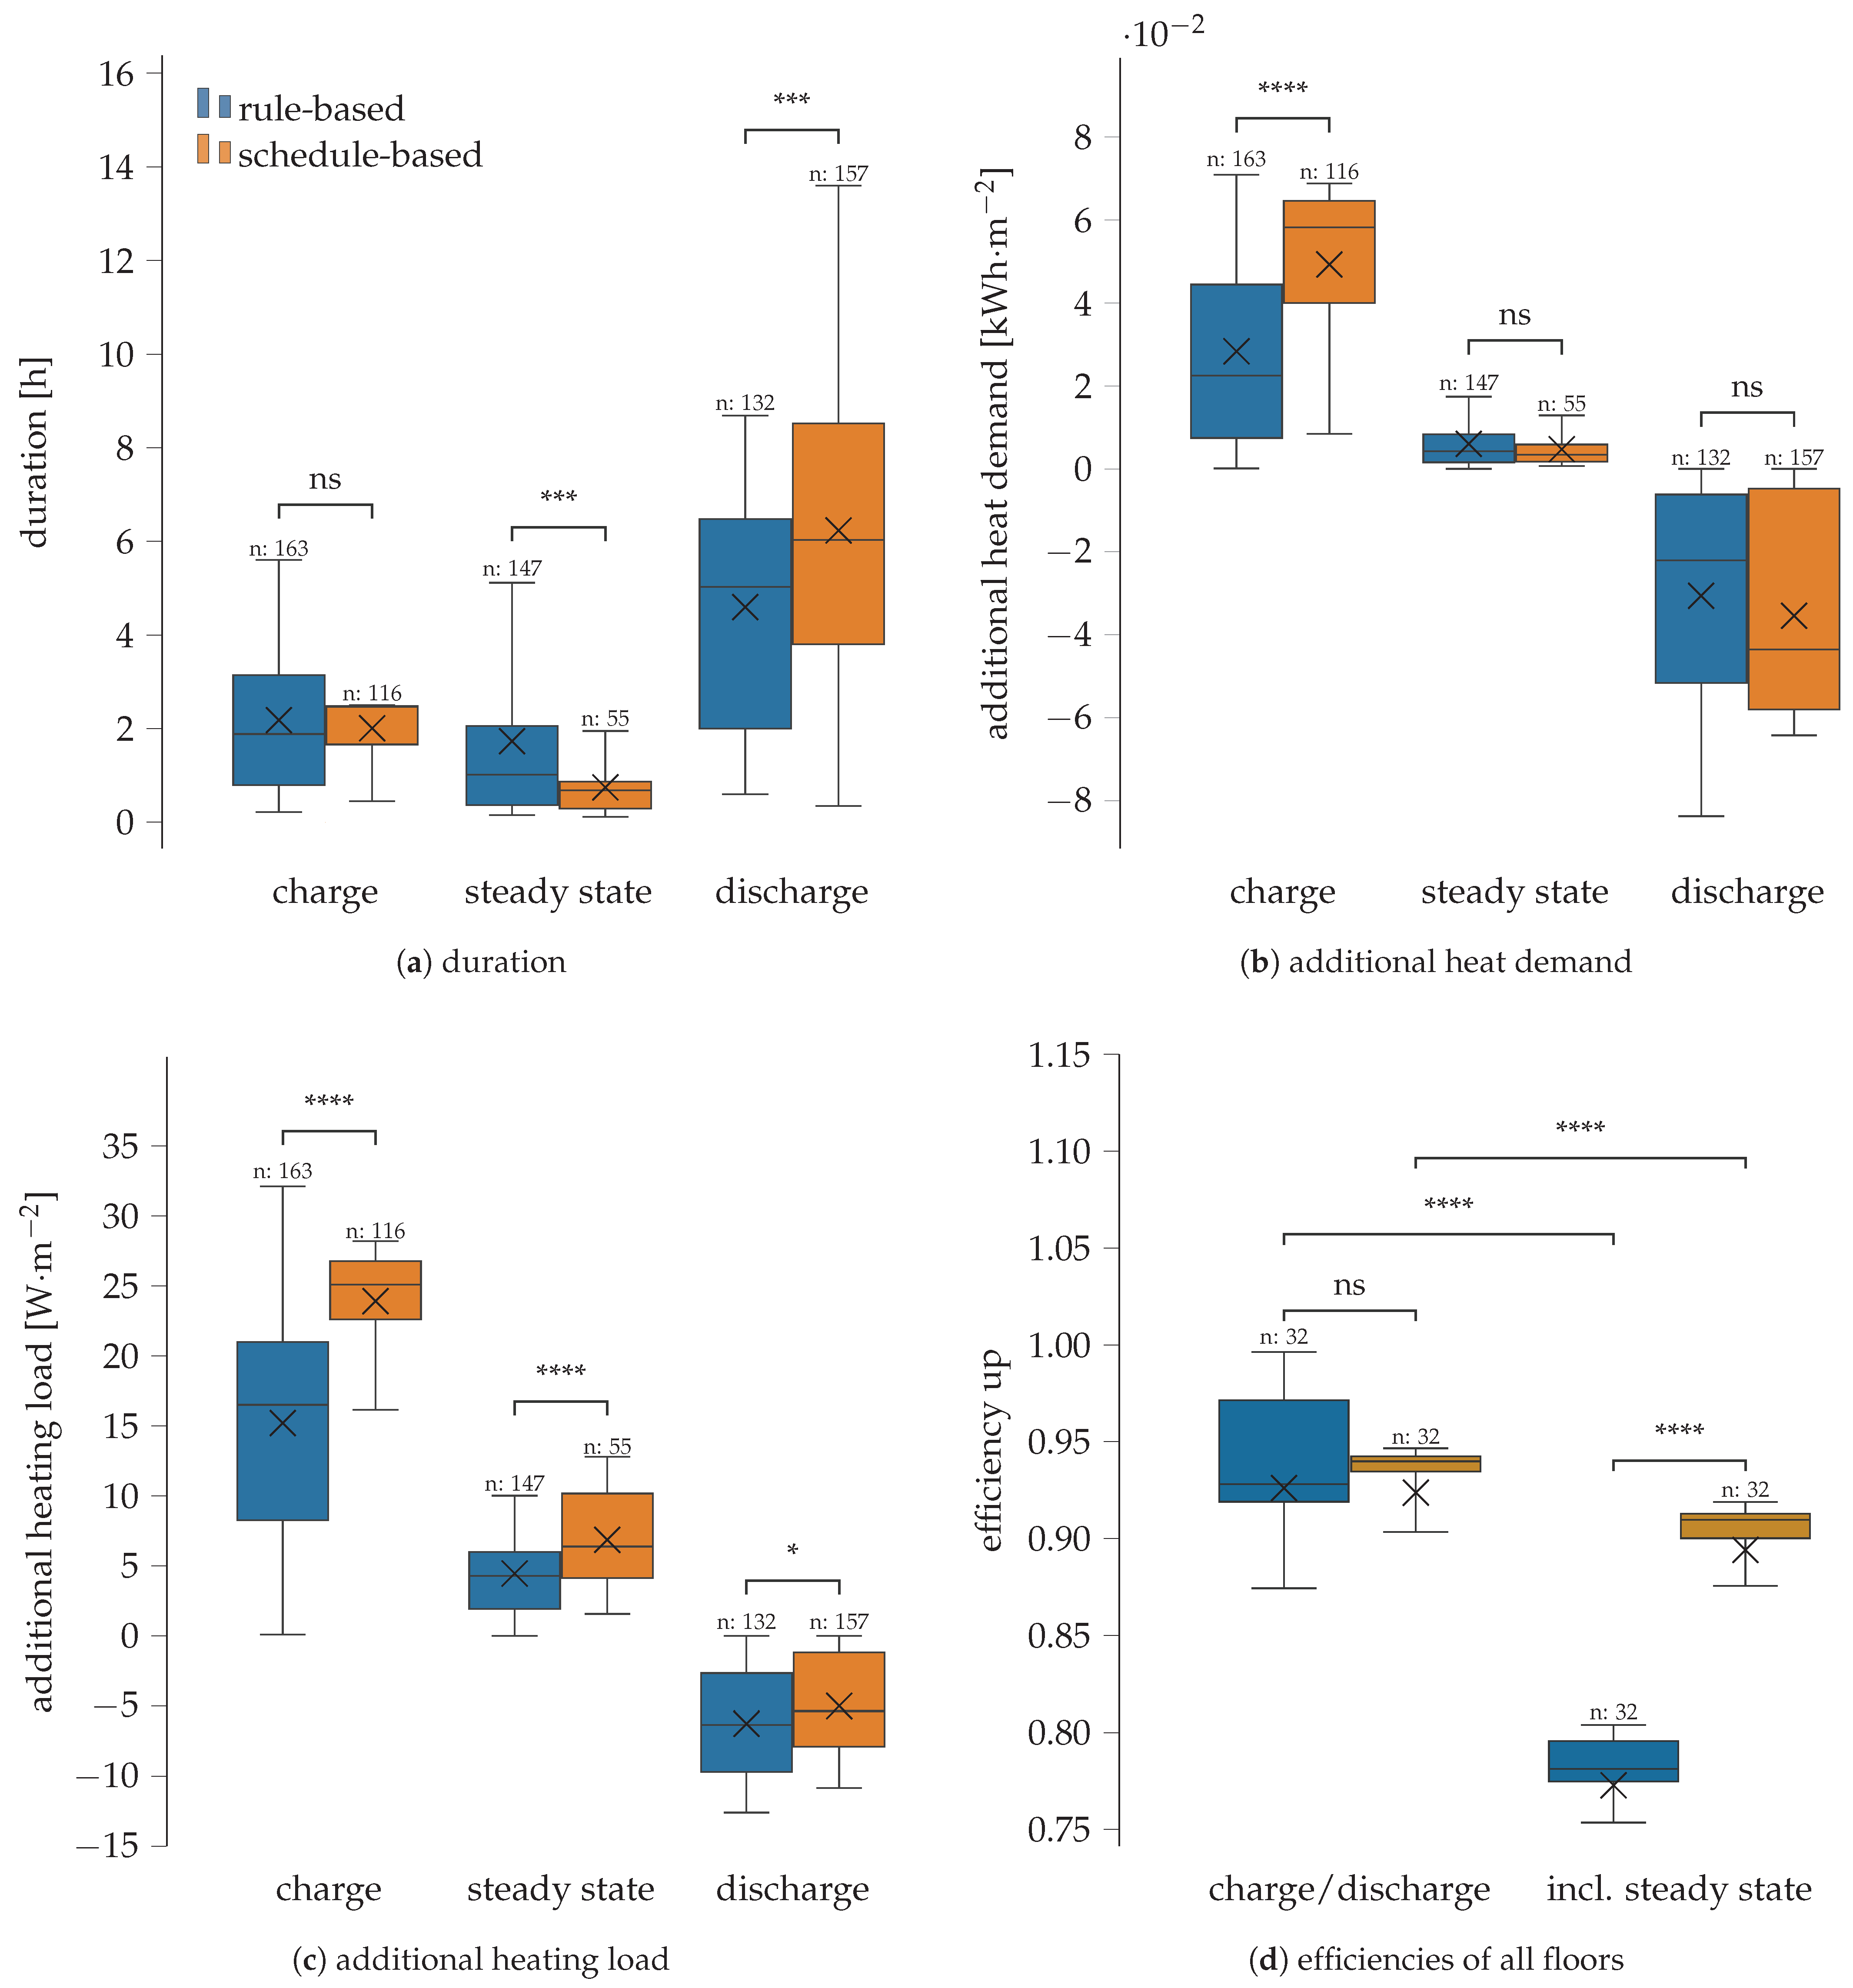
Over a simulation period of one year, a total of 163 triggered up events are identified in the heating season using the rule-based control and 116 up events are identified in the schedule-based control. However, a triggered up event does not necessarily lead to the occurrence of all phases: charge, steady state and discharge. These depend in particular on the duration and the prevailing room temperature. For example, if the room temperature is in the upper range of the comfort band due to solar gain or prior up events, the probability of the occurrence of steady state phases increases. In addition, the phase identification algorithm is designed so that there is a difference in the heating load compared to the reference control. This prevents phases from being incorrectly assigned based on solar gains.
The temporal distribution of the charge, steady state and discharge phases in the rule-based and schedule-based controls over one year is shown in Figure 5a. The notation ns stands for “not significant“ and therefore no statement about the stochastic differences between the two data sets is possible. If not specified otherwise, the value of the rule-based control is always given first when listing medians or means. The median of the duration of the charge events in the rule-based control is 1.88 h (mean: 2.20 h). The median of the duration in the schedule-based control is 2.47 h (mean: 2.01 h), which corresponds to 2.5 h due to the predefined increase in setpoint temperature. However, when using the Brunner–Munzel test, no significant difference is found between the two sets of data, so the difference in duration cannot be statistically confirmed. The discharge phases of the rule-based control (median: 5.04 h) are also shorter than those of the schedule-based control (median: 6.06 h), as charge phases are repeatedly inserted due to volatile electricity prices. In general, the discharge times are about 2.5 times longer than the charge times, which can be explained by the high insulation standard. This has a positive effect on the potential to avoid periods of high electricity prices. The steady state phase, i.e., reaching and maintaining the increased setpoint temperature, is only maintained for a short time in the rule-based and schedule-based control strategy (median: 1.02/0.69 h).
The statistical distribution of charged and discharged heat per event is shown in Figure 5b. The median of the additional heat transferred per charge phase is 0.023 kWh·m 2  (mean: 0.029 kWh·m 2 ) in the rule-based control and 0.058 kWh·m 2  (mean: 0.049 kWh·m 2 ) in the schedule-based control. In comparison, the medians of the heat saved in the discharge phases are −0.022 kWh·m 2  and −0.043 kWh·m 2  (not significant according to Brunner–Munzel).
The heating load per phase in the up events is derived from the duration of the events and the transferred heat, which is shown in Figure 5c. The rule-based control has lower additional heating loads in the charge phase than the schedule-based control (median: 16.53/25.11 W·m 2 ), but reduces the heating load more in the discharge phase (median:−6.34/−5.33 W·m 2 ). In the steady state phase, both control strategies require an additional heating load to compensate for the higher transmission heat losses (median: 4.29/6.39 W·m 2 ).
According to Reynders’ approach [28], the charged heat of an event corresponds to the flexible storage capacity of the building mass. This is largely dependent on the setpoint temperature or the temperature achieved per event. In contrast to Reynders, we considered the charge phase independently from the steady state phase. In the rule-based control, the median of the additional heat demand is only 39.7% of the median in the schedule-based variant. This implies that 0.023 kWh·m 2  (mean: 0.029 kWh·m 2 ) or 0.058 kWh·m 2  (mean: 0.049 kWh·m 2 ) of energy per flexibility event can be stored in the activated building mass.
Similarly, the efficiency of the building mass as a thermal storage site can also be calculated from the ratio of the respective heat transfer in the charge and discharge phases, as shown in Section 2.2. The storage efficiencies with and without consideration of the steady state phases in the rule-based and schedule-based control of all floors and houses are shown in Figure 5d. The storage efficiency without consideration of the steady state phases achieves similarly high values in both control strategies (median: 0.92/0.94, mean: 0.93/0.92). According to the Brunner–Munzel test, there is no statistically significant difference between the efficiency distributions. When the steady state phases and the associated higher transmission heat losses are included, it is noticeable that the overall storage efficiency decreases, especially for the rule-based control (median: 0.78/0.91, mean: 0.77/0.89). The steady state phase, as described above, does not contribute to the stored energy, and therefore cannot achieve higher savings in the discharge phase.

3.2. Statistical Evaluation of Up Events with Schedule-Based and Rule-Based Control with Night-Time Reduction

The following results for rule-based and schedule-based control refer to a simulation period of one year and, accordingly, one heating period as well, but now consider the more realistic night-time reduction in the setpoint temperature in the heating period to 18.5  C. In addition to the total annual energy demand, the night-time reduction has an influence on the previously listed characteristics of the up events. As stated previously, the schedule-based control includes a daily increase in the setpoint temperature for 2.5 h from 2 pm to 4.30 pm.
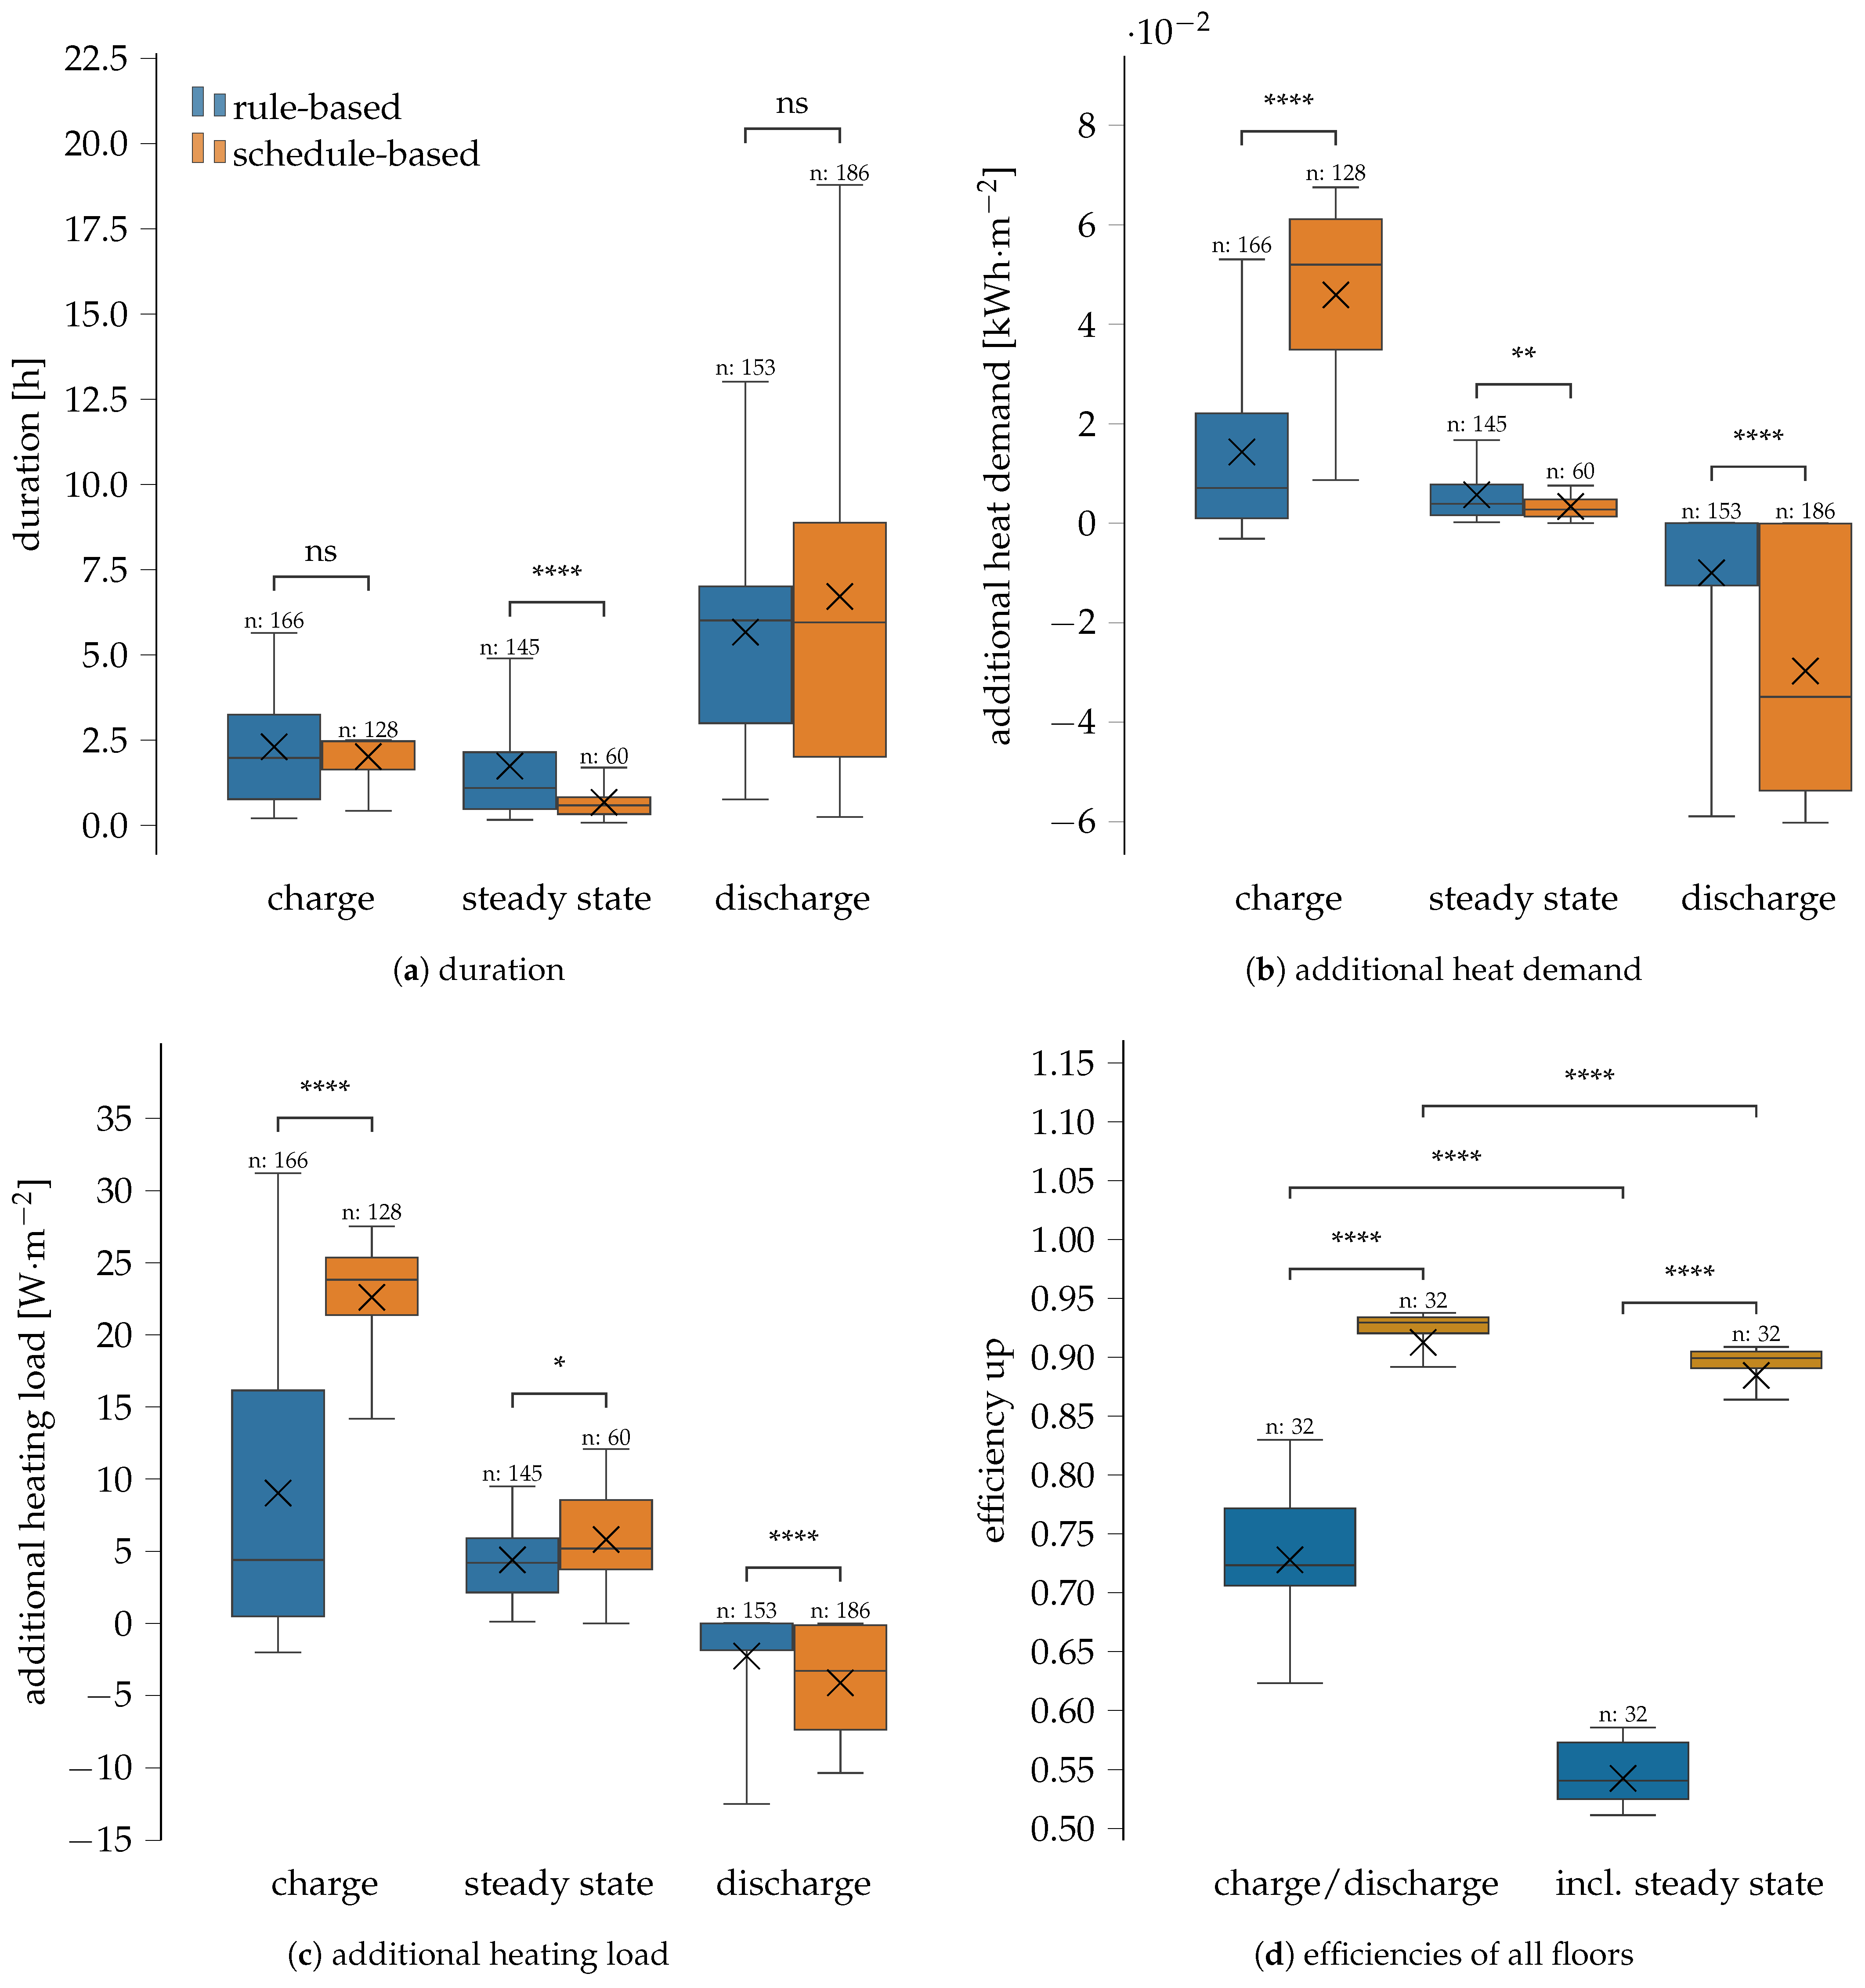
The duration of all charge, steady state and discharge phases in the rule-based and schedule-based control is shown in Figure 6a. Compared to the temperature control without night-time reduction (Figure 5a), the charge (median: 1.99/2.47 h, mean: 2.32/2.04 h—ns) and steady state phases (median: 1.10 / 0.60 h, mean: 1.75/0.69 h) with night-time reduction have similar values. The slight increase during the regulated charge phase can be explained by the lower average room temperatures due to the night-time reduction. In the discharge phase, the rule-based control results in higher values (median: 6.03 h), as the events just before the night-time reduction can be extended.
For the determination of the additional heat demand (Figure 6b), the rule-based control again shows differences compared to the investigation without night-time reduction, especially in the charge (median: 0.007 kWh·m 2 , mean: 0.014 kWh·m 2 ) and discharge phase (median: ≈0 kWh·m 2 , mean: −0.010 kWh·m 2 ). As the night-time reduction creates natural discharge phases in the reference control, there are several discharge phases in the rule-based control that show little or no energy savings compared to the reference. The schedule-based control has similar values in the charge phase (median: 0.052 kWh·m 2 , mean: 0.046 kWh·m 2 ) and discharge phase (median:−0.035 kWh·m 2 , mean:−0.029 kWh· m 2 ) to the control without night-time reduction due to the up events in the midday to afternoon period.
The differences to the control without night-time reduction can also be seen in the additional heating load (Figure 6c), especially in the rule-based control in the charge phase (median: 4.42 W·m 2 ) and the discharge phase (median: ≈0 W·m 2 , mean: −2.27 W·m 2 ). Schedule-based control is less affected and results in 23.83 W·m 2  in the charge phase and −3.28 W·m 2  in the discharge phase. As described above, the storage capacity of the building mass for flexibility events can be derived from the additional heat demand (Figure 6b) according to Reynders’ approach. For the rule-based control, the median capacity is given as 0.007 kWh·m 2  (mean: 0.014 kWh·m 2 ), while the schedule-based control, largely unaffected by the night-time reduction, has a capacity of 0.052 kWh·m 2  (mean: 0.046 kWh·m 2 ).
Figure 6d shows the storage efficiencies for all buildings and floors studied as a ratio of the sum of the discharged energy to the sum of the charged energy. The night-time reduction in the room temperature leads to lower efficiencies, especially in the rule-based control (median: 0.72/0.93, mean: 0.73/0.91), since discharge phases can partly not be used. By including the steady state phase, the median of the total efficiency decreases to 0.54 (mean: 0.54) in the rule-based control and to 0.90 (mean: 0.88) in the schedule-based control, since the steady state phase is associated with higher transmission heat losses and does not store any further energy in the building mass.

3.3. Verification of Phase Identification Via Efficiencies of Up Events

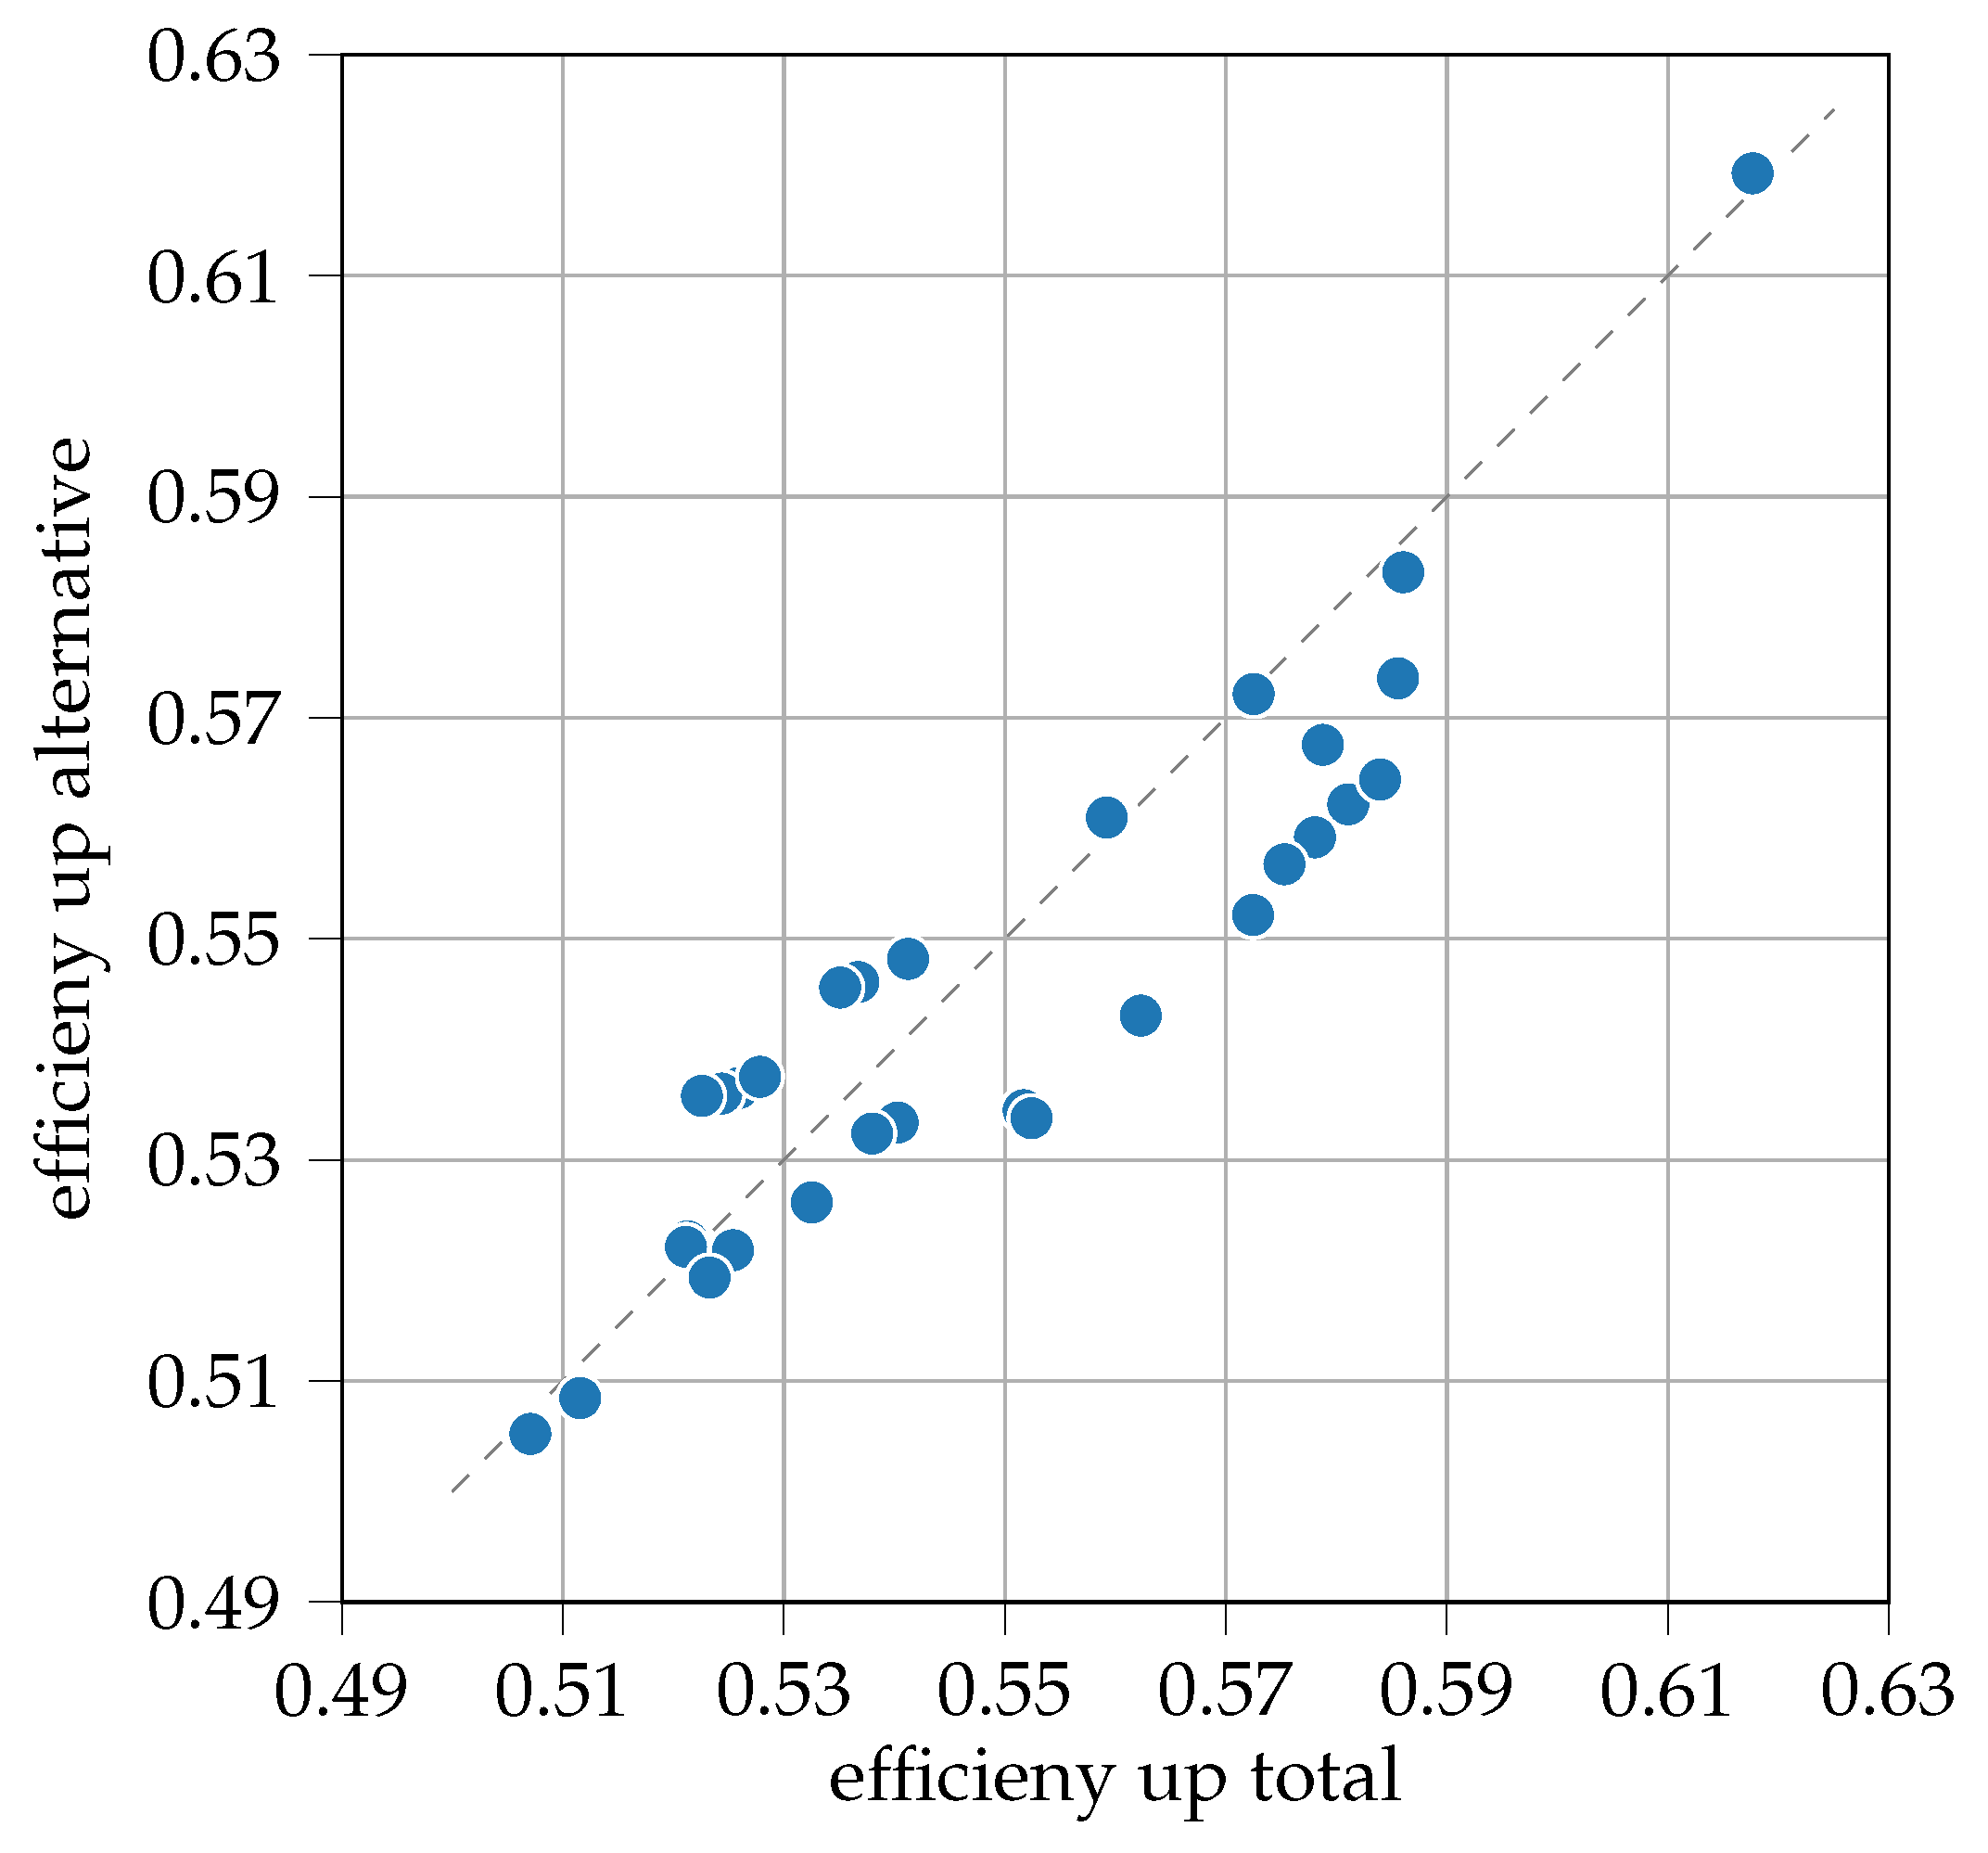
As described in Section 2.4 it is possible to verify the correct identification of the phases using the efficiencies of the up events. For this purpose, in addition to calculating the efficiencies  η up , tot  from the identified phases, we calculated the efficiency  η up , alt  alternatively simply by comparing the simulation with energy flexible control and the reference simulation, without assigning energy differences to a specific event. The two ways of calculating the rule-based control efficiencies for all simulated floors are shown in Figure 7. The high agreement of the efficiencies (maximum deviation less than 4%) indicates the mostly correct identification of the events.

4. Discussion

In this study, we focus on characterizing the storage capacity of the building mass for energy flexible control. For this purpose, we make a comparison between two control strategies: rule-based and schedule-based. It should be noted, however, that the strategies used represent only a subset of each category. The rule we use is based on the electricity price market, but could also be based on electricity greenhouse gas emissions, for example. Thus, further research is needed to quantify the impact of other rule-based controls. In addition, the building simulation has not yet been validated with real data, so absolute values in the comparison of the two control strategies should be treated with caution.

4.1. Comparability of the Data Sets

Some data sets in our study do not show statistical differences according to the Brunner–Munzel test, which is due to the distribution and quantity of the data. The observed differences, e.g., in charge duration for the different strategies, are quite possible, but should be interpreted with caution due to the limited data available. In some cases, larger data sets are needed to increase statistical confidence. To address this, future investigations could include additional heating periods in the simulations.

4.2. Differences in the Rule- and Schedule-Based Control without Night-Time Reduction

To minimize external influences, we run the first simulation without night-time reduction in the room temperature. Since the duration of the charge phase for up events in schedule-based control must be defined in advance, a duration of 2.5 h is chosen, which corresponds to the average duration of rule-based control with night-time reduction (≈2.3 h). As the distribution of events over a year in both control strategies cannot be described by a common probability distribution, a clear characterization is not possible. However, for the purpose of comparison, we utilize both the mean values and the more robust median, which is less affected by outliers. This results in a median value of 1.88 h for rule-based control and 2.47 h for schedule-based control (mean: 2.20/2.01 h). The differences in duration are also reflected in the additional heat transferred per charge phase in each control strategy, but cannot be explained by this alone (median: 0.023/0.058 kWh·m 2 , mean: 0.029/0.049 kWh·m 2 ). The time-independent representation using the additional heating load emphasizes the control-related discrepancy (median: 16.53/25.11 W·m 2 , mean: 15.30/23.91 W·m 2 ). Accordingly, the rule-based control for characterizing the storage mass in this study leads to a 60% smaller storage capacity in the median (mean: 41%) and a 34% (mean: 36%) smaller heating load (time-independent) than characterization by schedule-based control.

4.3. Challenges in the Phase Identification

To make a statement about the efficiency of the energy flexible control, it is necessary to determine the energy saved compared to the reference control in the discharge phase. As there is no fixed time between two up events in rule-based control, it is possible for a new charge phase to occur before the previous discharge phase is complete. As a result, there is no clear assignment of the discharge phases, and therefore no efficiency per single up event can be determined. In addition, due to the ambiguous assignment of energy to phases and temperature fluctuations caused by the heating control, energy is sometimes assigned to the wrong phases or not assigned at all, which leads to the discrepancy in the verification of efficiency. To evaluate the overall efficiency, we calculate the sum of all phase-related energies over one year individually, as described in Section 2.4. Hence, the characterization of storage capacity and storage efficiency using rule-based control requires a more detailed examination and verification of the assigned phases and is therefore more time-consuming than characterization using schedule-based control.

4.4. Difficulties in the Rule-Based Control with Night-Time Reduction

The introduction of the more realistic scenario with night-time reduction in the room temperature to 18.5 °C has an impact on the rule-based control and the resulting characterization of the storage capacity (median: 0.007/0.052 kWh·m 2 , mean: 0.014/0.046 kWh·m 2 ) and storage efficiency (median: 0.72/0.93, mean: 0.73/0.91) of the building mass. This is due to up events just before the night-time reduction. The discharge phase occurs during the temperature-reduced operation, which is also present in the reference variant, and therefore cannot compensate for the previously increased heating load. With rule-based control only according to the electricity market price without time restrictions, the median of the total storage efficiency drops from 0.78 to 0.54. The characterization of the building mass by means of rule-based control therefore requires further boundary conditions to ensure reasonable operation. This includes measures such as evening curfews and weather forecasting to take into account solar gains, which would allow the room temperature to be raised without additional heating.

5. Conclusions

In this study, we use dynamic simulations over one year, including flexible control, to calculate both the storage capacity and storage efficiency for the building mass. We show that the type of flexible control (rule-based versus schedule-based) has a significant impact on the characterization. Since rule-based control is likely to be implemented in the future, this result should be considered when characterizing the building mass. Based on this study, we can make the following statements about the implemented rule-based control:
  • The characterization of the building mass using the rule-based control without a night-time reduction leads to a 60% smaller median in the storage capacity (mean: 41%) than using schedule-based control under comparable boundary conditions. The calculation of the time-independent heating load results in a median difference of 34% (mean: 36%).
  • By establishing a night-time reduction in the setpoint temperature, the median of the storage efficiency using rule-based control drops from 0.92 to 0.72 (mean: 0.93/0.73).
  • The evaluation of the storage capacity and the storage efficiency with the help of the rule-based control requires a more detailed examination and verification of the assigned phases and is accordingly more time-consuming than the characterization by means of the schedule-based control.
  • The characterization of the building mass with the help of rule-based control requires, in addition to the simple use of electricity market prices, further boundary conditions that ensure reasonable operation. These include, for example, evening curfews and weather forecasting.
Further research will optimize the characterization of the building mass by the rule-based control and make the phase detection algorithm for up events more robust. Based on this, the up events will be complemented by down events in times of high electricity prices. In addition, the properties assigned to the building mass will be validated using real measured data.

Author Contributions

Conceptualization, J.R.; methodology, J.R.; software, J.R. and X.K.; validation, J.R. and X.K.; formal analysis, J.R.; investigation, J.R.; resources, N.B.; data curation, J.R.; writing—original draft preparation, J.R.; writing—review and editing, X.K., N.B. and J.R.; visualization, J.R.; supervision, N.B.; project administration, N.B.; funding acquisition, N.B. All authors have read and agreed to the published version of the manuscript.

Funding

The authors gratefully acknowledge the financial support of the project Living Lab: DELTA (grant agreement No. 03EWR002A) which is funded by the Federal Ministry for Economic Affairs and Climate Action (BMWK) and the NextGenerationEU and is managed by the management agency Project Management Jülich (PtJ).

Data Availability Statement

Not applicable.

Acknowledgments

The authors would like to thank Anja Schaffarczyk, Bernadette Lang-Eurisch and Yang Xue for their support.

Conflicts of Interest

The authors declare no conflict of interest. The funders had no role in the design of the study; in the collection, analyses, or interpretation of data; in the writing of the manuscript; or in the decision to publish the results.

Abbreviations

The following abbreviations are used in this manuscript:
DSMDemand side management.
DRDemand response.
ADRActive demand response.
KPIKey performance indicator.
TABSThermally activated building structures.
TESThermal energy storage.
nsNot significant.

References

  1. Die Bundesregierung Informiert. Startseite. Klimaschutzgesetz: Klimaneutralität bis 2045 | Bundesregierung. Available online: https://www.bundesregierung.de/breg-de/schwerpunkte/klimaschutz/klimaschutzgesetz-2021-1913672 (accessed on 10 July 2023).
  2. Denholm, P.; Hand, M. Grid flexibility and storage required to achieve very high penetration of variable renewable electricity. Energy Policy 2011, 39, 1817–1830. [Google Scholar] [CrossRef]
  3. Morales, J.M.; Conejo, A.J.; Madsen, H.; Pinson, P.; Zugno, M. Integrating Renewables in Electricity Markets; Springer: New York, NY, USA, 2014. [Google Scholar] [CrossRef]
  4. Hu, X.; Zou, C.; Zhang, C.; Li, Y. Technological Developments in Batteries: A Survey of Principal Roles, Types, and Management Needs. IEEE Power Energy Mag. 2017, 15, 20–31. [Google Scholar] [CrossRef]
  5. Lund, H.; Münster, E. Integrated energy systems and local energy markets. Energy Policy 2006, 34, 1152–1160. [Google Scholar] [CrossRef]
  6. O’Malley, M.; Kroposki, B.; Hannegan, B.; Madsen, H.; Andersson, M.; D’haeseleer, W.; McGranaghan, M.F.; Dent, C.; Strbac, G.; Baskaran, S.; et al. Energy Systems Integration. Defining and Describing the Value Proposition; Office of Scientific and Technical Information (OSTI): Oak Ridge, TN, USA, 2016.
  7. Nejat, P.; Jomehzadeh, F.; Taheri, M.M.; Gohari, M.; Abd Majid, M.Z. A global review of energy consumption, CO2 emissions and policy in the residential sector (with an overview of the top ten CO2 emitting countries). Renew. Sustain. Energy Rev. 2015, 43, 843–862. [Google Scholar] [CrossRef]
  8. Zafar, R.; Mahmood, A.; Razzaq, S.; Ali, W.; Naeem, U.; Shehzad, K. Prosumer based energy management and sharing in smart grid. Renew. Sustain. Energy Rev. 2018, 82, 1675–1684. [Google Scholar] [CrossRef]
  9. European Parliament. Directive (EU) 2018/844 of the European Parliament and of the Council of 30 May 2018 Amending Directive 2010/31/EU on the Energy Performance of Buildings and Directive 2012/27/EU on Energy Efficiency (Text with EEA Relevance); European Parliament: Brussels, Belgium, 2018. [Google Scholar]
  10. Jensen, S.Ø.; Marszal-Pomianowska, A.; Lollini, R.; Pasut, W.; Knotzer, A.; Engelmann, P.; Stafford, A.; Reynders, G. IEA EBC Annex 67 Energy Flexible Buildings. Energy Build. 2017, 155, 25–34. [Google Scholar] [CrossRef]
  11. Lund, P.D.; Lindgren, J.; Mikkola, J.; Salpakari, J. Review of energy system flexibility measures to enable high levels of variable renewable electricity. Renew. Sustain. Energy Rev. 2015, 45, 785–807. [Google Scholar] [CrossRef]
  12. Gellings, C.W.; Smith, W.M. Integrating demand-side management into utility planning. Proc. IEEE 1989, 77, 908–918. [Google Scholar] [CrossRef]
  13. Morales-España, G.; Martínez-Gordón, R.; Sijm, J. Classifying and modelling demand response in power systems. Energy 2022, 242, 122544. [Google Scholar] [CrossRef]
  14. Lauro, F.; Moretti, F.; Capozzoli, A.; Panzieri, S. Model Predictive Control for Building Active Demand Response Systems. In Proceedings of the 7th International Conference (Energy Procedia) SEB-15, Lisbon, Portugal, 1–3 July 2015; Volume 83, pp. 494–503. [Google Scholar] [CrossRef]
  15. Arteconi, A.; Costola, D.; Hoes, P.; Hensen, J. Analysis of control strategies for thermally activated building systems under demand side management mechanisms. Energy Build. 2014, 80, 384–393. [Google Scholar] [CrossRef]
  16. Arteconi, A.; Polonara, F. Assessing the Demand Side Management Potential and the Energy Flexibility of Heat Pumps in Buildings. Energies 2018, 11, 1846. [Google Scholar] [CrossRef]
  17. de Coninck, R.; Helsen, L. Quantification of flexibility in buildings by cost curves— Methodology and application. Appl. Energy 2016, 162, 653–665. [Google Scholar] [CrossRef]
  18. Luc, K.M.; Li, R.; Xu, L.; Nielsen, T.R.; Hensen, J.L. Energy flexibility potential of a small district connected to a district heating system. Energy Build. 2020, 225, 110074. [Google Scholar] [CrossRef]
  19. Bundesministerium der Justiz. Gesetz zum Neustart der Digitalisierung der Energiewende Bundesgesetzblatt. 2023, Teil I Nr. 133. Bonn, Germany, 2023. Available online: https://www.recht.bund.de/bgbl/1/2023/133/VO.html (accessed on 28 August 2023).
  20. Callaway, D.S.; Hiskens, I.A. Achieving Controllability of Electric Loads. Proc. IEEE 2011, 99, 184–199. [Google Scholar] [CrossRef]
  21. Reynders, G.; Nuytten, T.; Saelens, D. Potential of structural thermal mass for demand-side management in dwellings. Build. Environ. 2013, 64, 187–199. [Google Scholar] [CrossRef]
  22. Arteconi, A.; Hewitt, N.J.; Polonara, F. State of the art of thermal storage for demand-side management. Appl. Energy 2012, 93, 371–389. [Google Scholar] [CrossRef]
  23. Airò Farulla, G.; Tumminia, G.; Sergi, F.; Aloisio, D.; Cellura, M.; Antonucci, V.; Ferraro, M. A Review of Key Performance Indicators for Building Flexibility Quantification to Support the Clean Energy Transition. Energies 2021, 14, 5676. [Google Scholar] [CrossRef]
  24. Li, H.; Wang, Z.; Hong, T.; Piette, M.A. Energy flexibility of residential buildings: A systematic review of characterization and quantification methods and applications. Adv. Appl. Energy 2021, 3, 100054. [Google Scholar] [CrossRef]
  25. Cetin, K.S. Characterizing large residential appliance peak load reduction potential utilizing a probabilistic approach. Sci. Technol. Built Environ. 2016, 22, 720–732. [Google Scholar] [CrossRef]
  26. Le Dréau, J.; Heiselberg, P. Energy flexibility of residential buildings using short term heat storage in the thermal mass. Energy 2016, 111, 991–1002. [Google Scholar] [CrossRef]
  27. Vanhoudt, D.; Geysen, D.; Claessens, B.; Leemans, F.; Jespers, L.; van Bael, J. An actively controlled residential heat pump: Potential on peak shaving and maximization of self-consumption of renewable energy. Renew. Energy 2014, 63, 531–543. [Google Scholar] [CrossRef]
  28. Reynders, G.; Saelens, D.; Diriken, J. A generic quantification method for the active demand response potential of structural storage in buildings. In Proceedings of the 14th Conference of International Building Performance Simulation Association, Hyderbad, India, 7–9 December 2015; pp. 1986–1993. [Google Scholar] [CrossRef]
  29. Vigna, I.; de Jaeger, I.; Saelens, D.; Lovati, M.; Lollini, R.; Pernetti, R. Evaluating Energy and Flexibility Performance of Building Clusters. In Proceedings of the 16th IBPSA International Conference and Exhibition, Rome, Italy, 2–4 September 2019; pp. 3326–3333. [Google Scholar] [CrossRef]
  30. Foteinaki, K.; Li, R.; Heller, A.; Rode, C. Heating system energy flexibility of low-energy residential buildings. Energy Build. 2018, 180, 95–108. [Google Scholar] [CrossRef]
  31. Arteconi, A.; Mugnini, A.; Polonara, F. Energy flexible buildings: A methodology for rating the flexibility performance of buildings with electric heating and cooling systems. Appl. Energy 2019, 251, 113387. [Google Scholar] [CrossRef]
  32. Foteinaki, K.; Li, R.; Péan, T.; Rode, C.; Salom, J. Evaluation of energy flexibility of low-energy residential buildings connected to district heating. Energy Build. 2020, 213, 109804. [Google Scholar] [CrossRef]
  33. Vivian, J.; Chiodarelli, U.; Emmi, G.; Zarrella, A. A sensitivity analysis on the heating and cooling energy flexibility of residential buildings. Sustain. Cities Soc. 2020, 52, 101815. [Google Scholar] [CrossRef]
  34. Reynders, G.; Diriken, J.; Saelens, D. Generic characterization method for energy flexibility: Applied to structural thermal storage in residential buildings. Appl. Energy 2017, 198, 192–202. [Google Scholar] [CrossRef]
  35. Brunner, E.; Munzel, U. The Nonparametric Behrens-Fisher Problem: Asymptotic Theory and a Small-Sample Approximation. Biom. J. 2000, 42, 17–25. [Google Scholar] [CrossRef]
  36. Welcome. TRNSYS: Transient System Simulation Tool. Available online: https://www.trnsys.com/ (accessed on 28 July 2023).
  37. EnergyPlus. Available online: https://energyplus.net/ (accessed on 26 July 2023).
  38. IDA ICE—Simulation Software. EQUA. Available online: https://www.equa.se/de/ida-ice (accessed on 28 July 2023).
  39. Dymola—Dassault Systèmes®. Available online: https://www.3ds.com/de/produkte-und-services/catia/produkte/dymola/ (accessed on 26 July 2023).
  40. Magni, M.; Ochs, F.; de Vries, S.; Maccarini, A.; Sigg, F. Detailed cross comparison of building energy simulation tools results using a reference office building as a case study. Energy Build. 2021, 250, 111260. [Google Scholar] [CrossRef]
  41. David Bewersdorff. HYGGiency: Room Hygiene and Comfort through Energetic Refurbishment in District; Volume 61, Mechanik, Werkstoffe und Konstruktion im Bauwesen; Springer: Wiesbaden, Germany, 2021. [Google Scholar]
  42. Kirschstein, X.; Reber, J.; Zeus, R.; Schuster, M.; Bishara, N. Modelling of Floor Heating and Cooling in Residential Districts. Energies 2023, 16, 5850. [Google Scholar] [CrossRef]
  43. DIN V 18599-10; Energetische Bewertung von Gebäuden – Berechnung des Nutz-, End- und Primärenergiebedarfs für Heizung, Kühlung, Lüftung, Trinkwarmwasser und Beleuchtung – Teil 10: Nutzungsrandbedingungen. Deutsches Institut für Normung e. V: Berlin Germany, 2018. Available online: https://dx.doi.org/10.31030/2874436 (accessed on 20 July 2023).
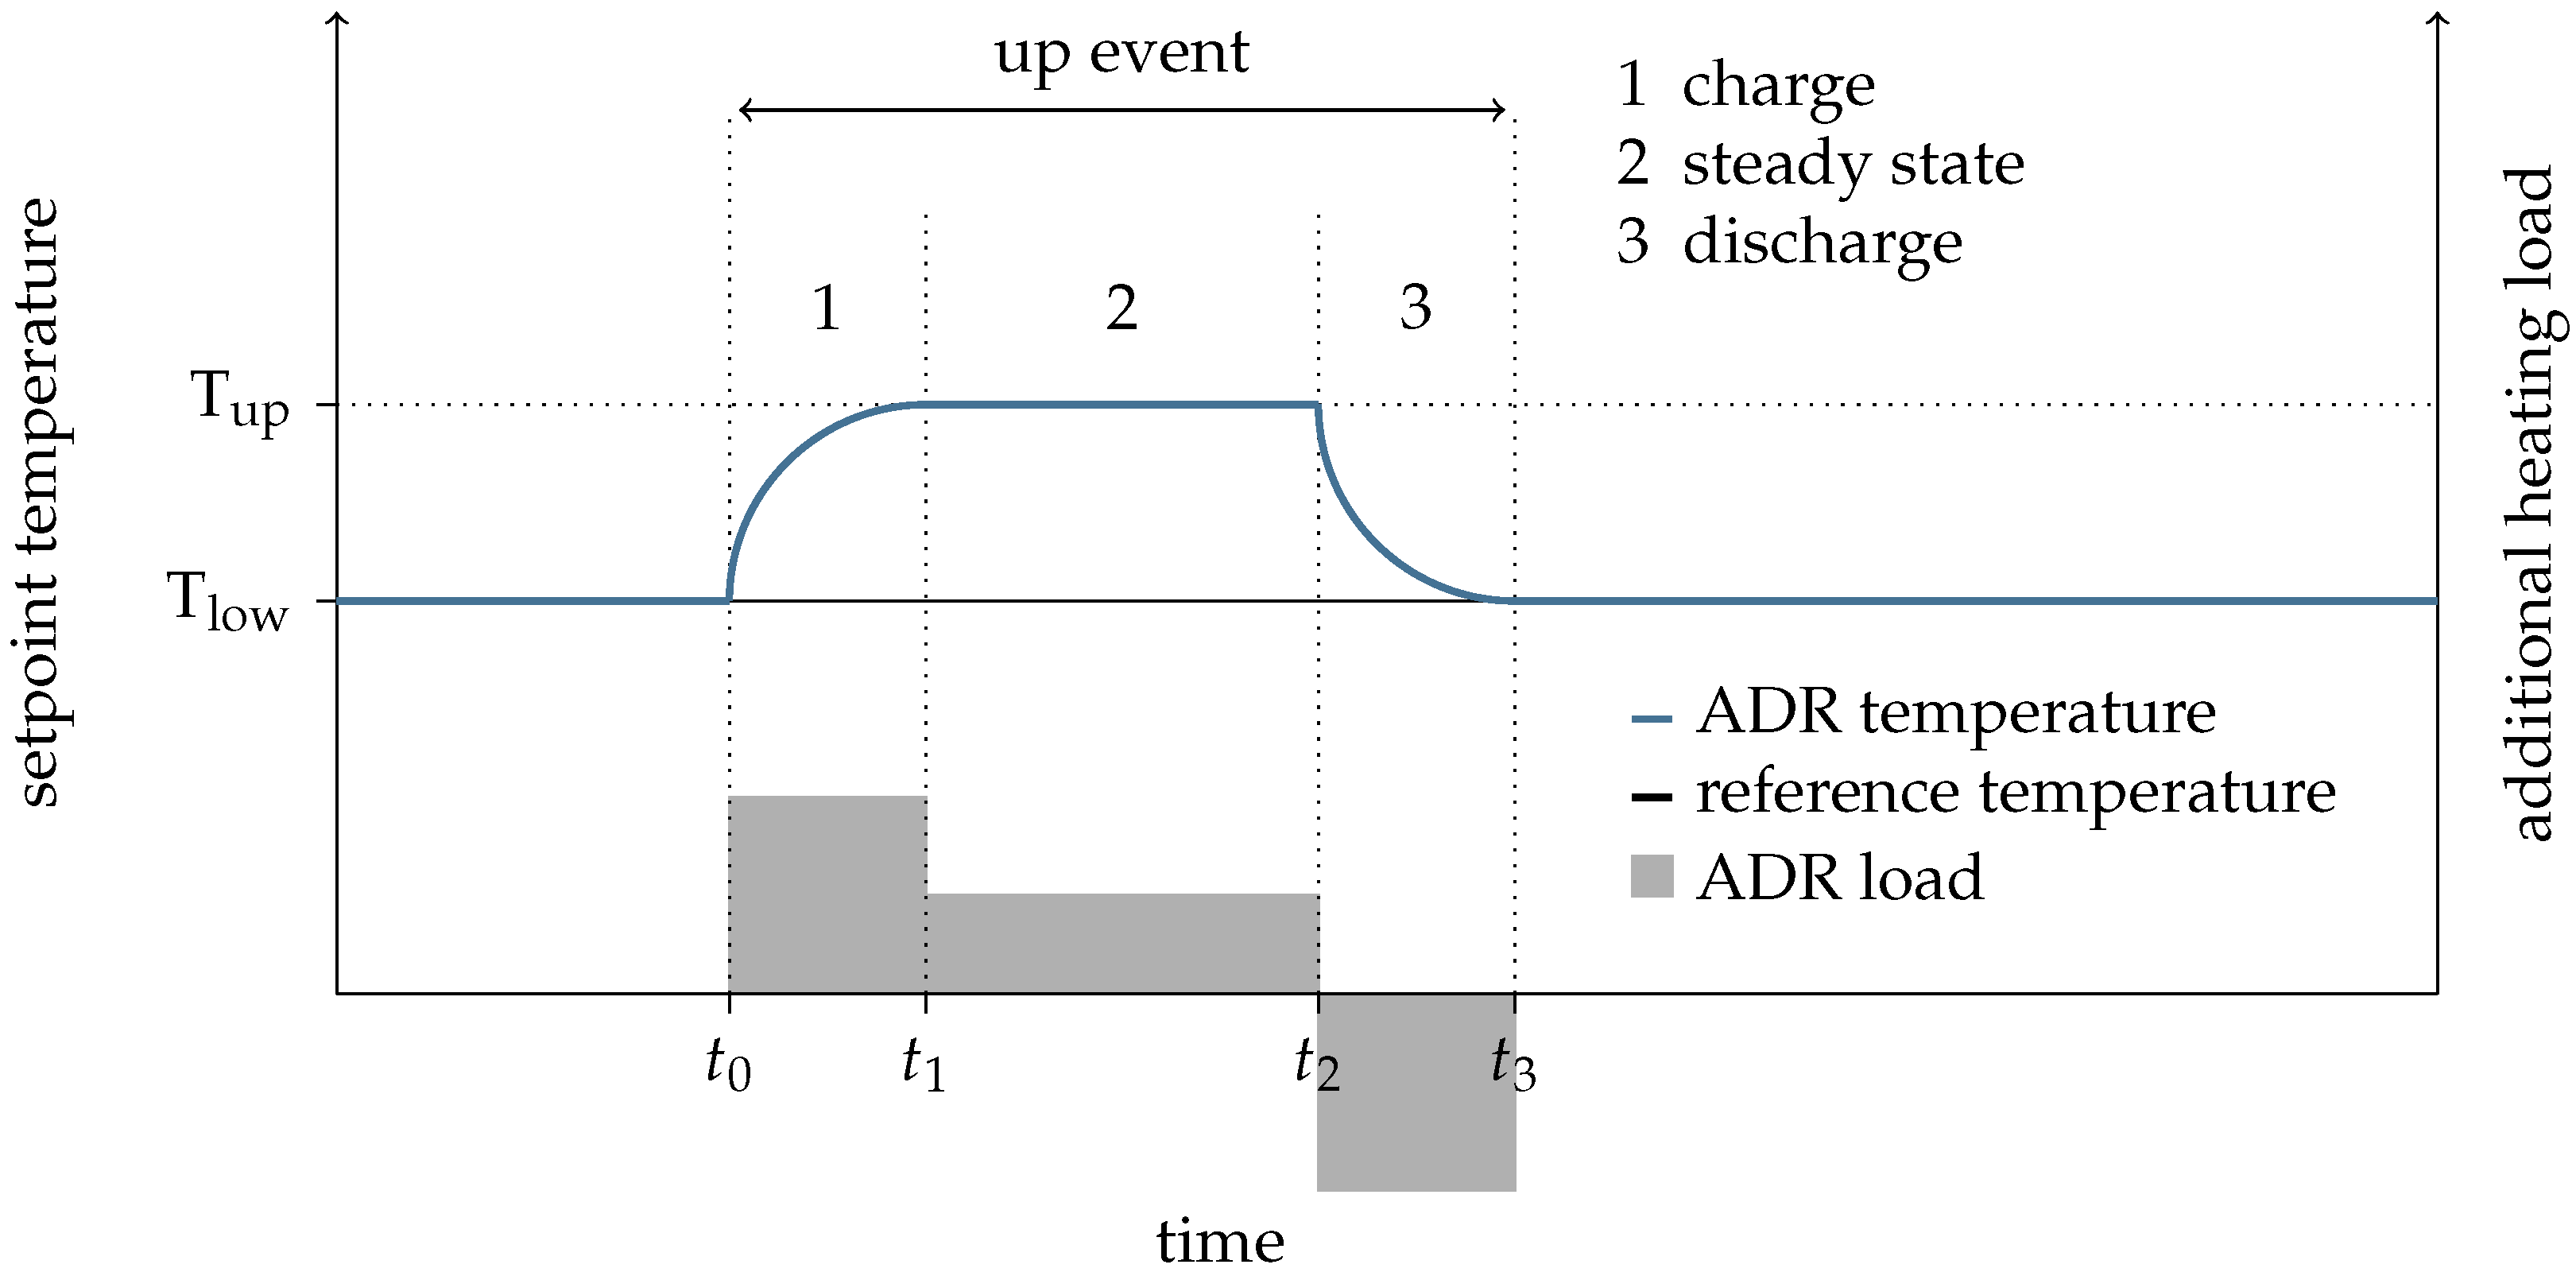
Figure 1. Classification of demand side management, adapted from [11,13,14].
Energies 16 06878 g001
Figure 2. Concept of an up event as an active demand response strategy, including the three defining phases (charge, steady state, discharge).
Energies 16 06878 g002
Figure 3. Concept of rule- and schedule-based control for the implementation of up events.
Energies 16 06878 g003
Figure 4. Building model of the district. The white marked floor is used for a detailed investigation of the storage capacity (NW view).
Energies 16 06878 g004
Figure 5. Statistical evaluation of charge, steady state and discharge phases over one year. Brunner-Munzel test p-values indicate statistical significance (* p ≤ 0.05, *** p ≤ 0.001, **** p ≤ 0.0001), ns: no significance.
Energies 16 06878 g005
Figure 6. Statistical evaluation of charge, steady state and discharge phases over one year with night-time reduction. Brunner-Munzel test p-values indicate statistical significance (* p ≤ 0.05, ** p ≤ 0.01, **** p ≤ 0.0001), ns: no significance.
Energies 16 06878 g006
Figure 7. Verification of the phase identification by comparing the efficiencies calculated according to Section 2.4 of all floors.
Energies 16 06878 g007
Table 1. Boundary conditions and properties for the building simulation.
CategoryPropertyAttribute
BuildingLocation64285 Darmstadt, Germany
Number of buildings8
Floor area9827 m 2
U-value wall0.118–0.151 W·m 2 · K 1
U-value roof0.078–0.104 W·m 2 · K 1
U-value ground floor0.157–0.193 W·m 2 · K 1
U-value window0.78 W·m 2 · K 1
Thermal bridges0.03 W·m 2 · K 1
Screed thickness0.065 m
Relative heated floor area≈75%
SimulationSimulation time8760 h
Time step1 min
Heating set temperature20.5  C
Night-time reduction11 pm–6 am
Night-time18.5  C
Weather dataTRY 2015 for Darmstadt
Heating season30 September–30 April
Air exchange rate0.44 h 1
Internal gains90 Wh·m 2 · d 1
Supply temperature40  C
Heat demand23.22 kWh·m 2 · a 1
Energy flexibilityUp event set temperature22  C
Electricity price dataSpot market Germany 2021
Schedule-based control2 pm–4.30 pm
Rule-based controlExternal price signal
Disclaimer/Publisher’s Note: The statements, opinions and data contained in all publications are solely those of the individual author(s) and contributor(s) and not of MDPI and/or the editor(s). MDPI and/or the editor(s) disclaim responsibility for any injury to people or property resulting from any ideas, methods, instructions or products referred to in the content.