
Development of the Wind Generation Sector and Its Effect on the Grid Operation—The Case of Poland

Abstract
:1. Introduction
1.1. Background
1.2. Motivation
1.3. Review of Related Works
1.4. Contributions and Paper Organization
2. Stages of Development of Wind Power in Poland
2.1. Development of Onshore Wind Power—Prior to Poland Joining the EU
2.2. Development of Onshore Wind Power—After Poland Joining the EU
2.3. Development of Offshore Wind Power
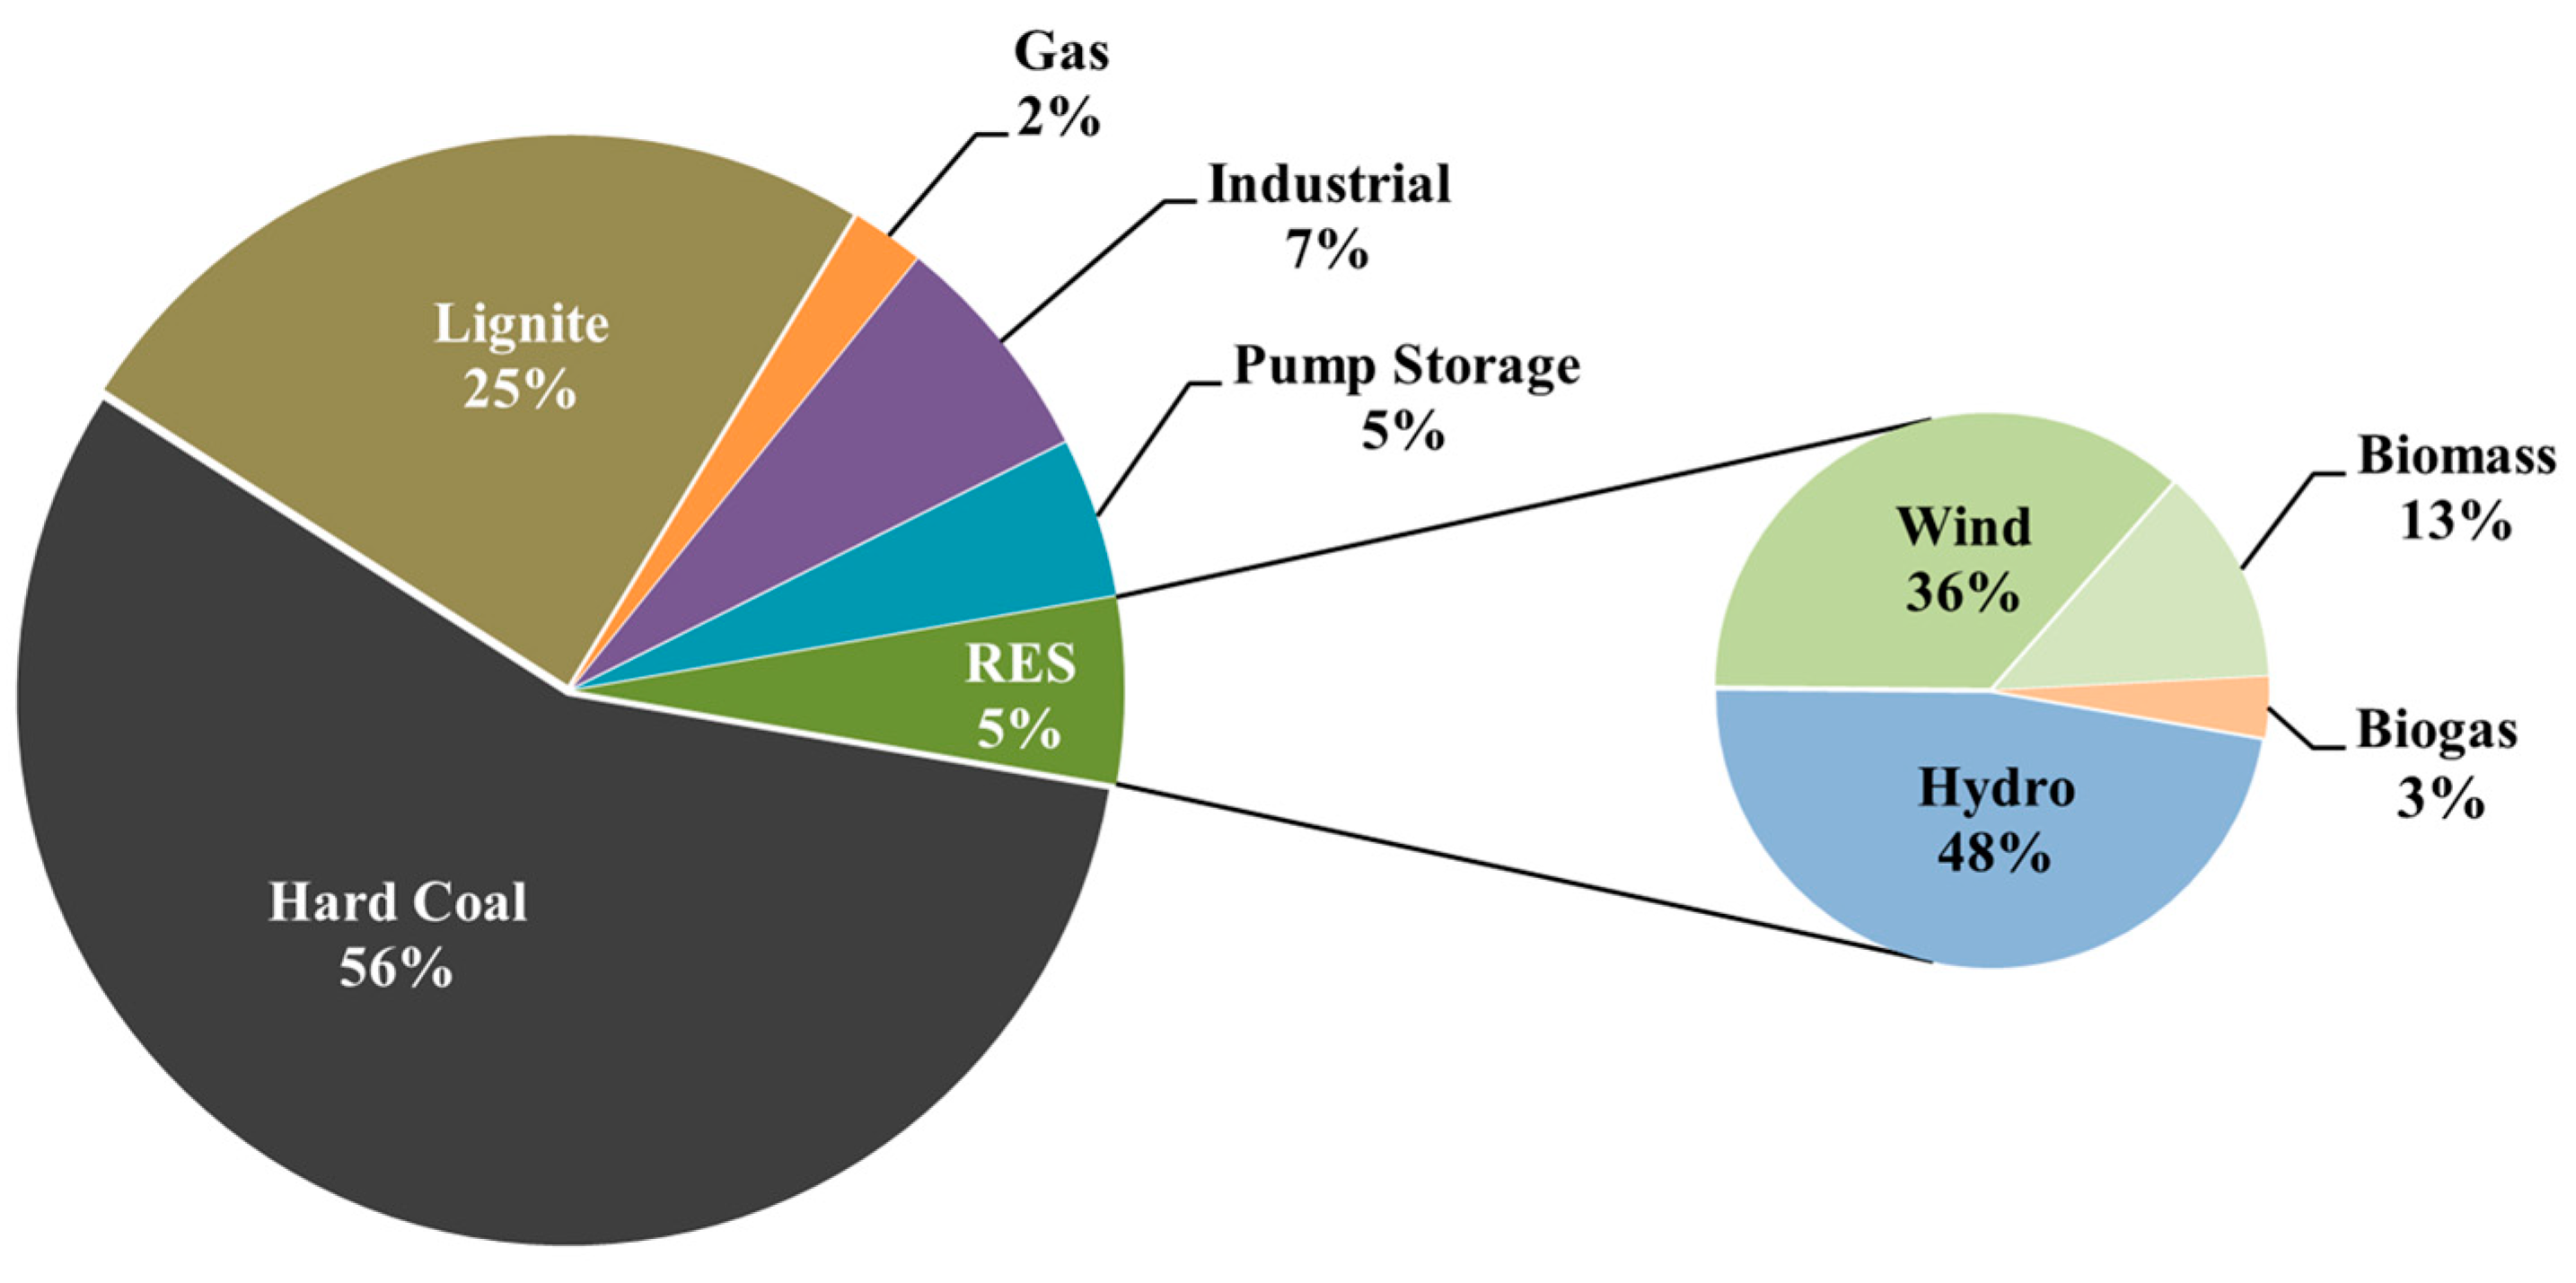
3. Poland’s Energy Mix
Change of Mix Structure
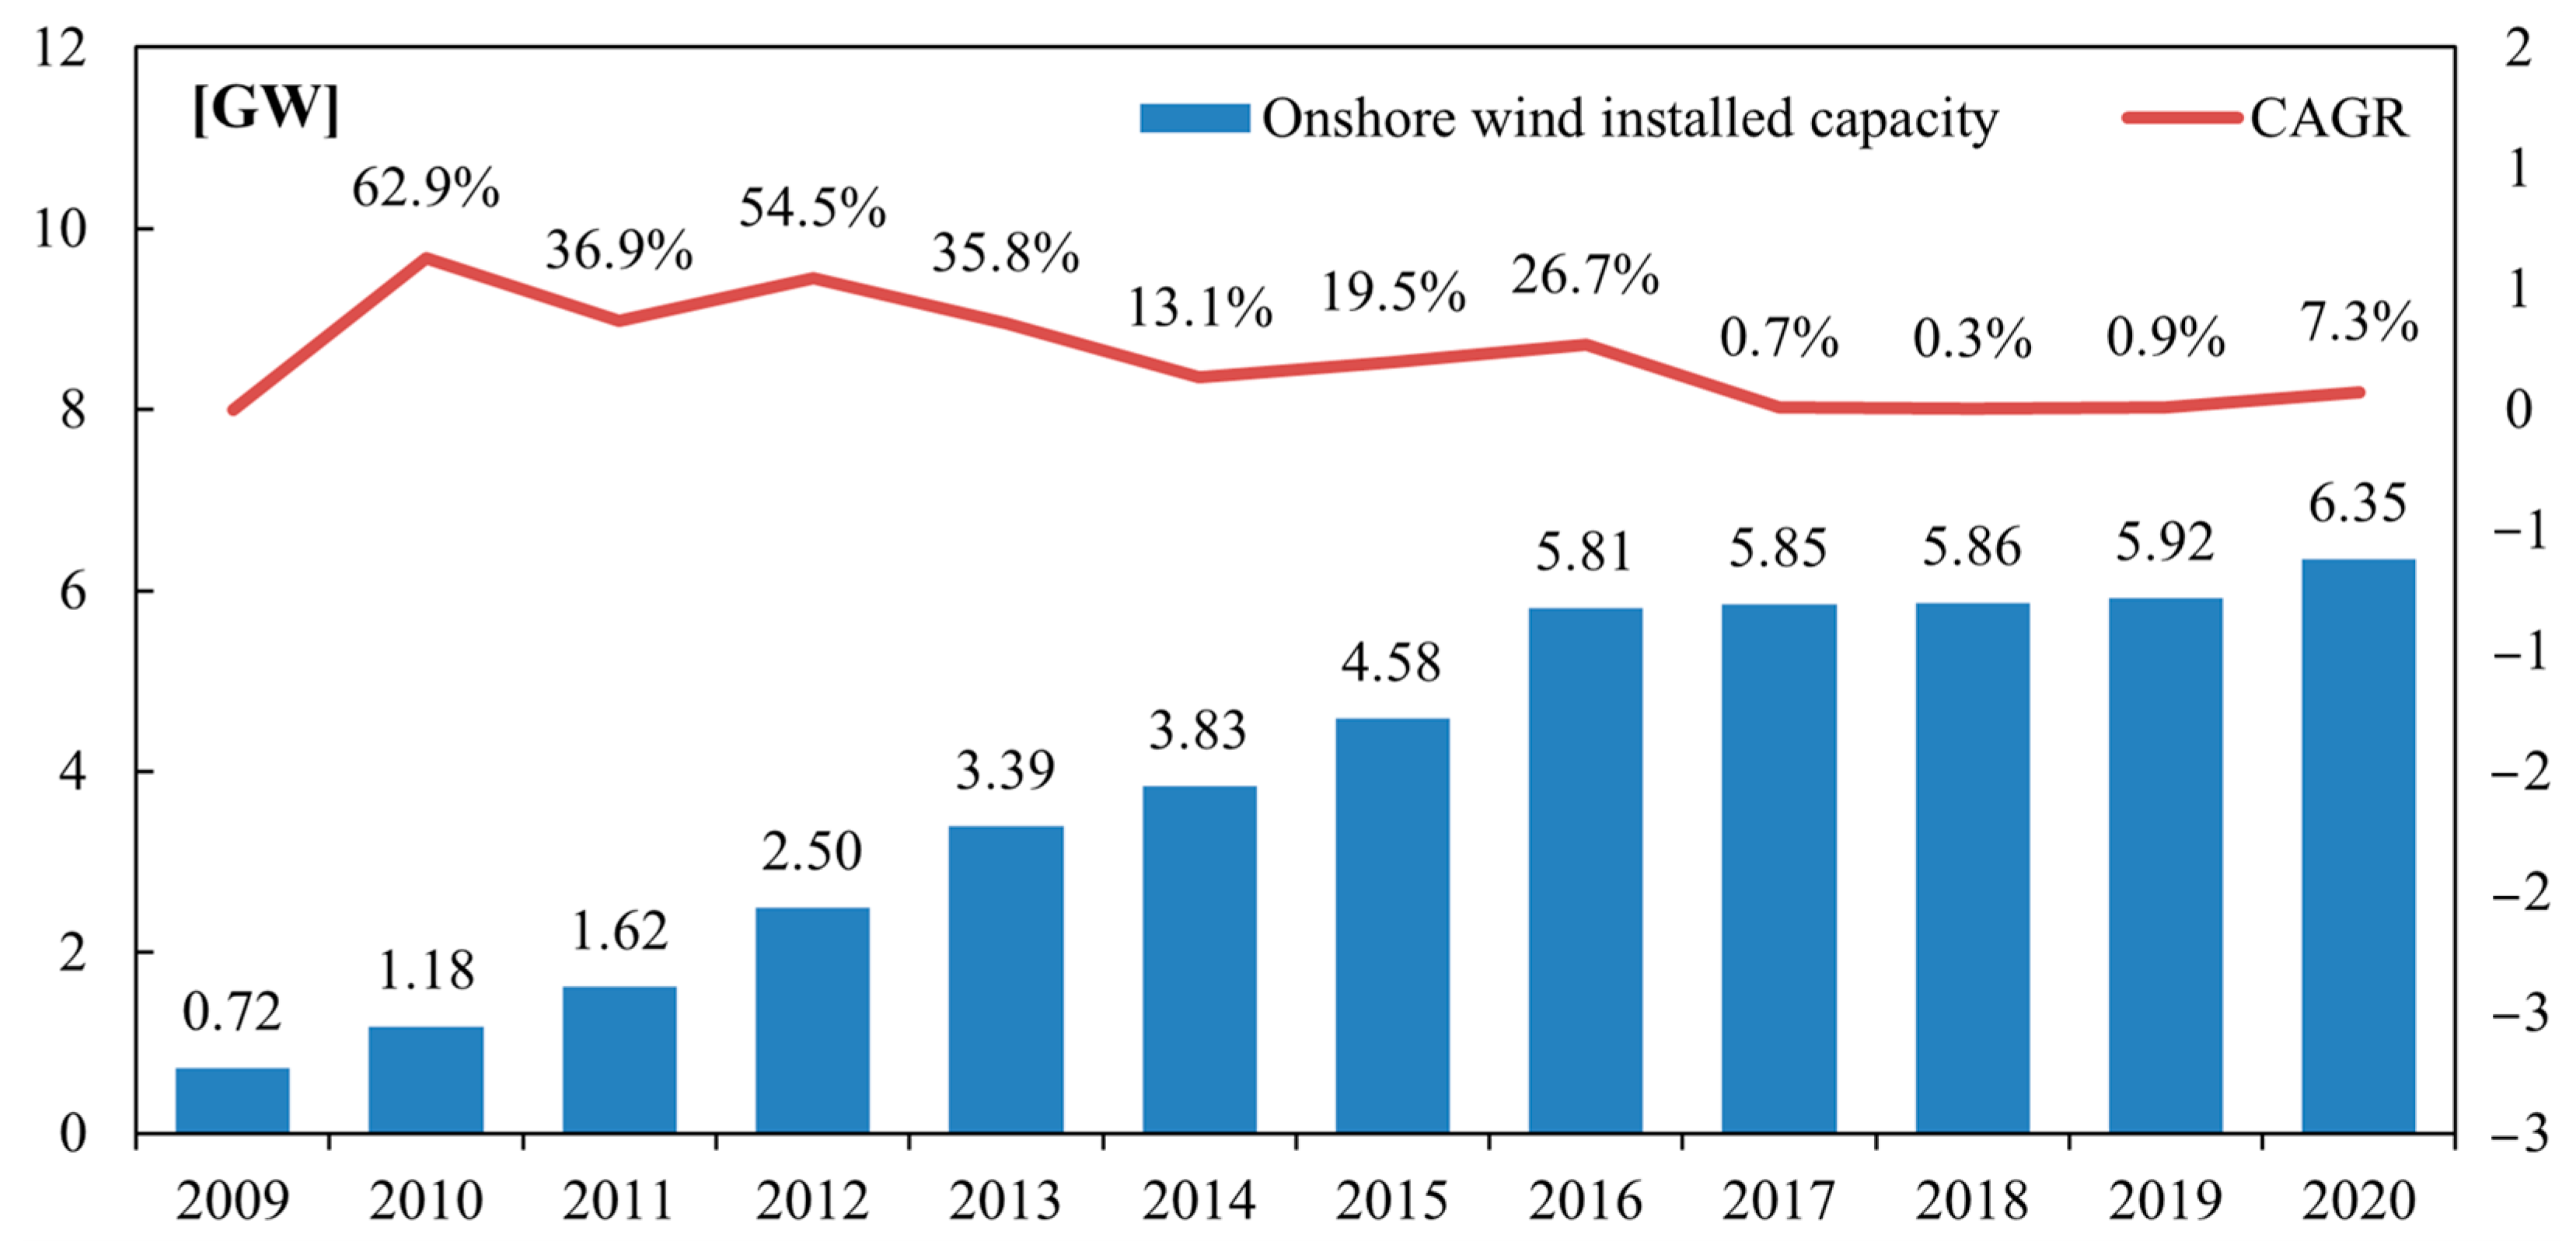
4. Installed Capacity of Wind Generation
5. Analysis of Power Generation from Wind Sources and How It Affects the Operation of the Power System
5.1. General Statistical Analysis
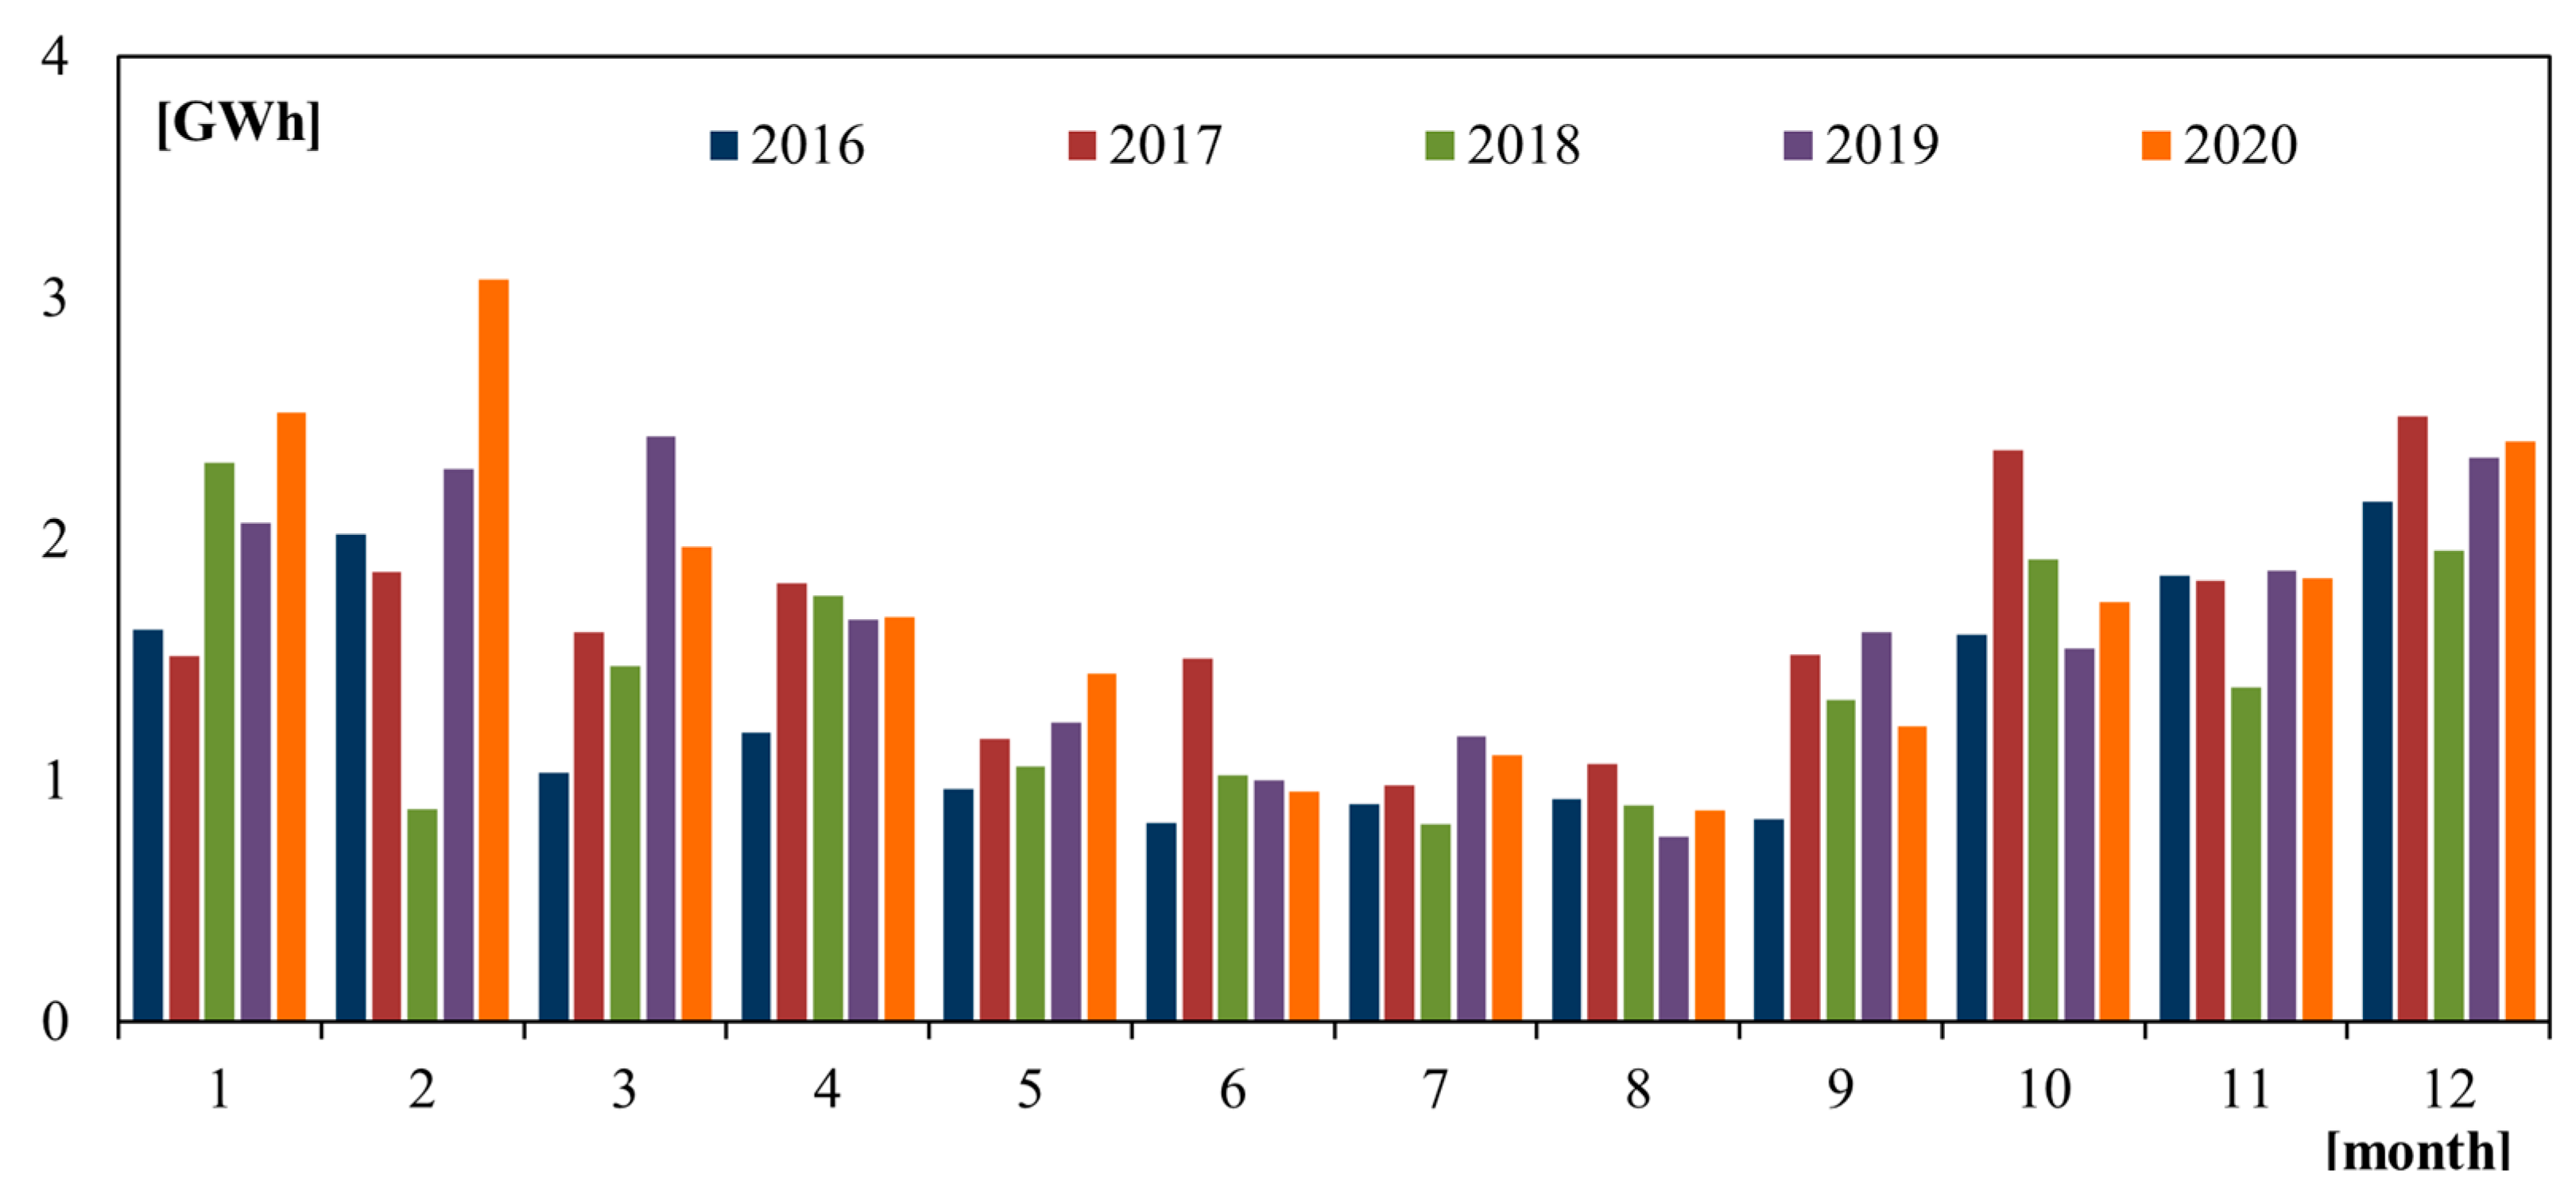
5.2. Average Monthly Generation
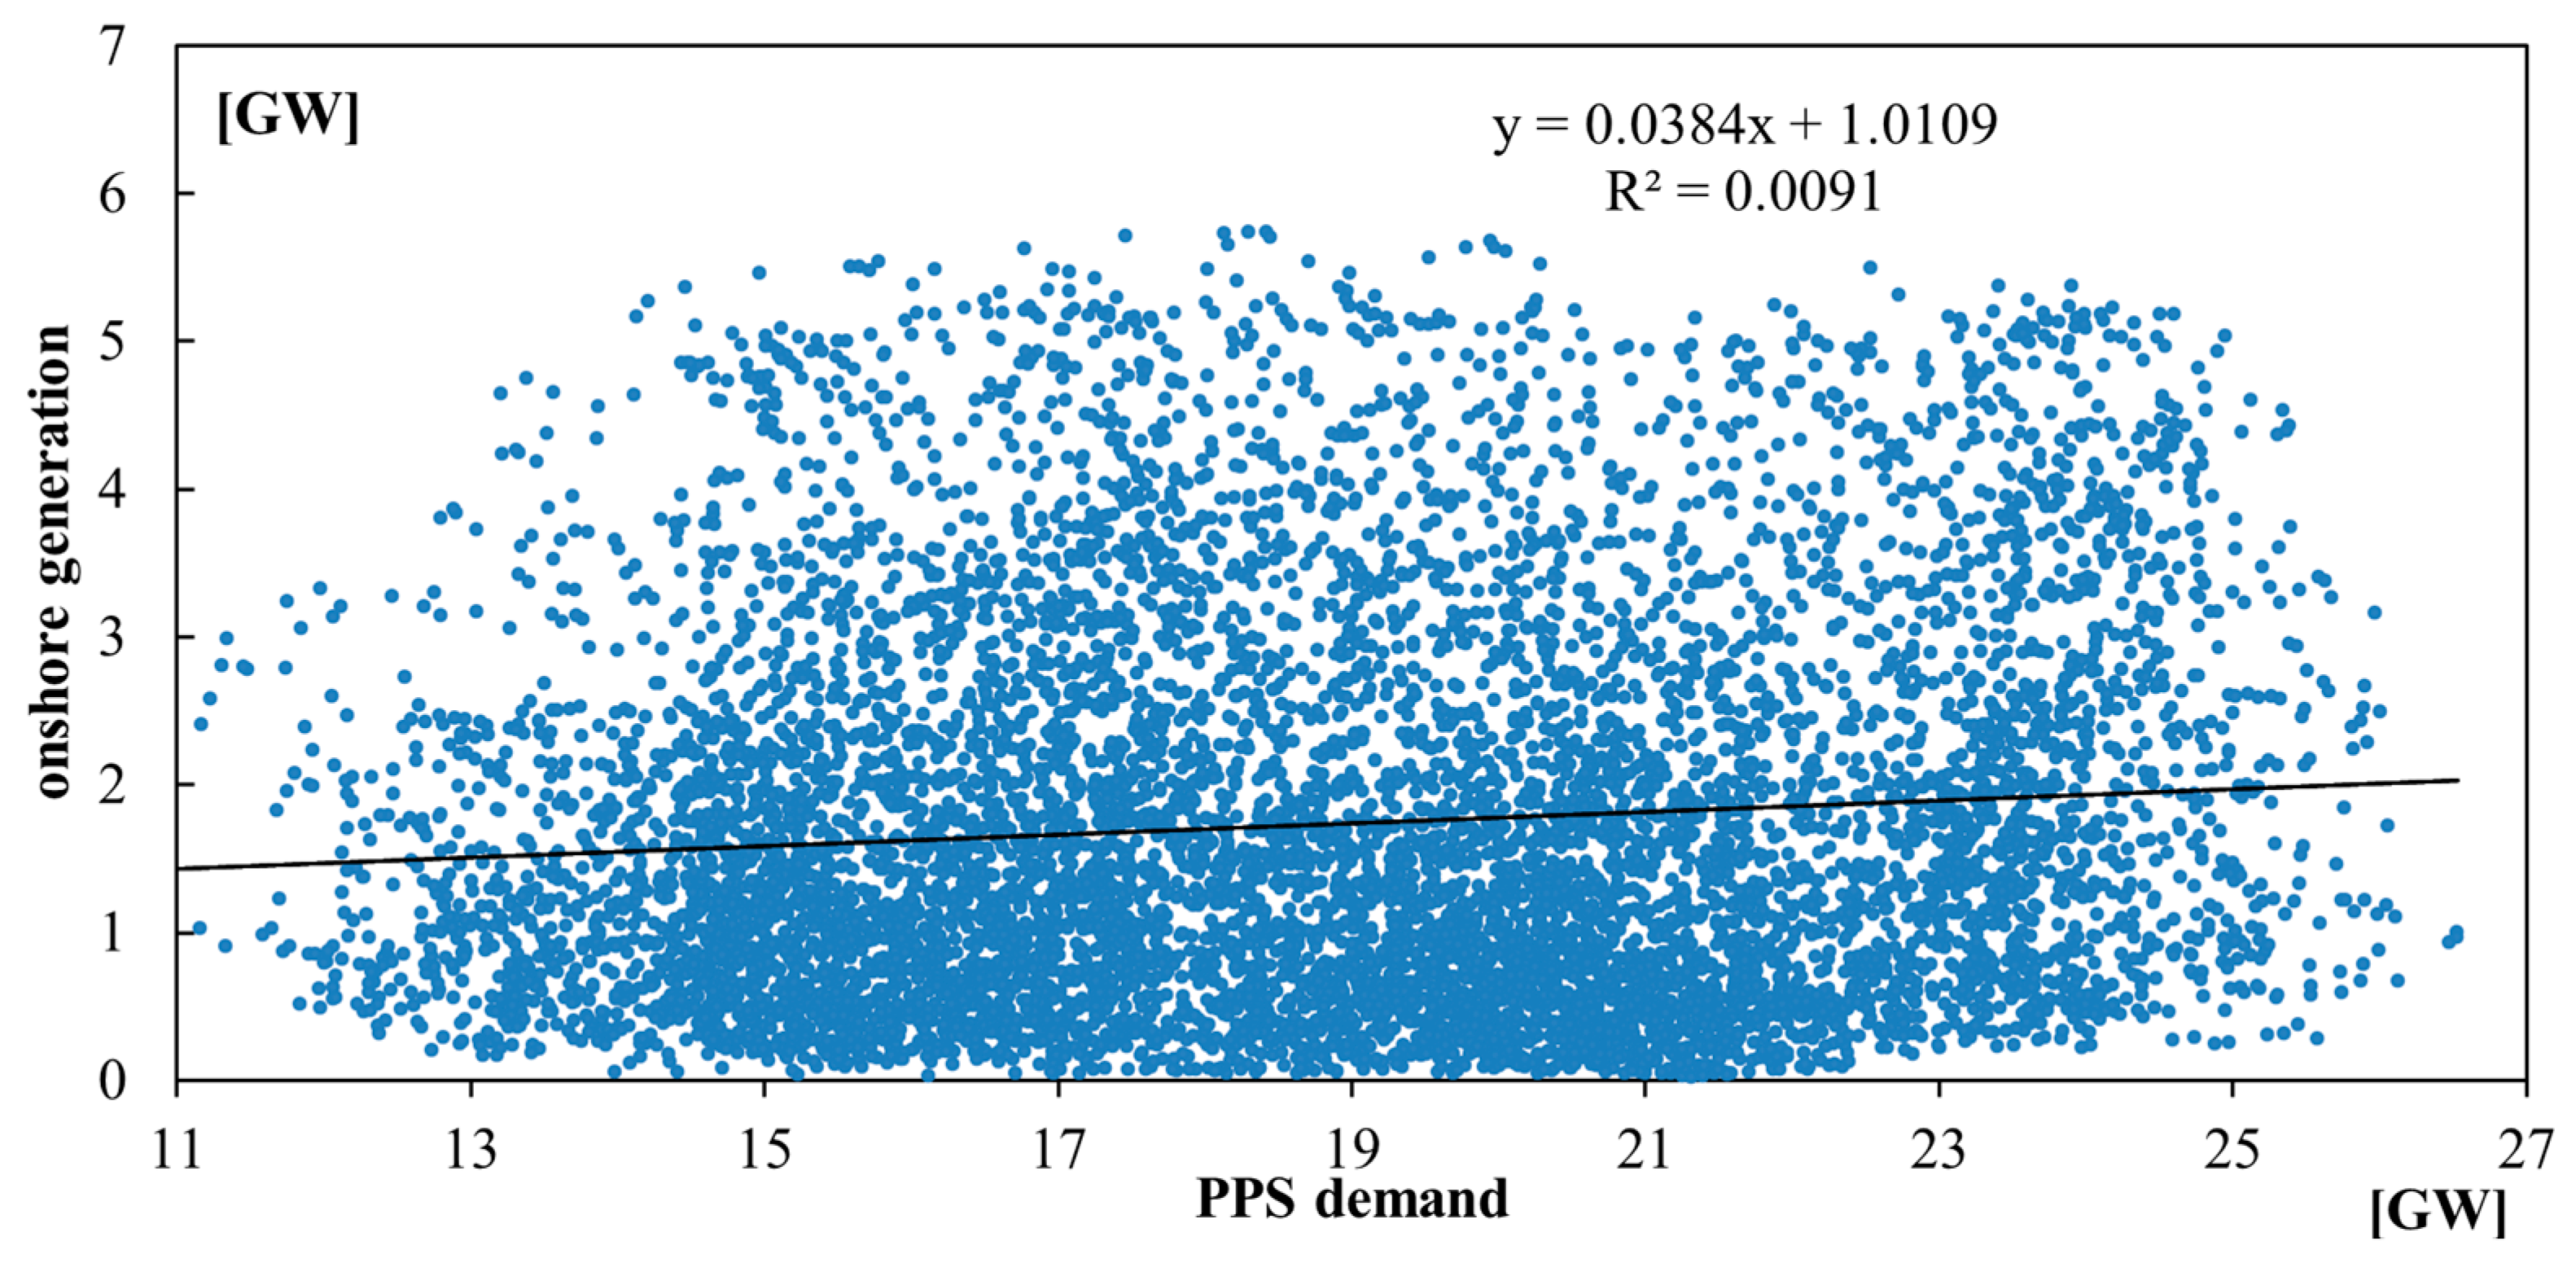
5.3. Relationship between Onshore WF Generation and Power Demand
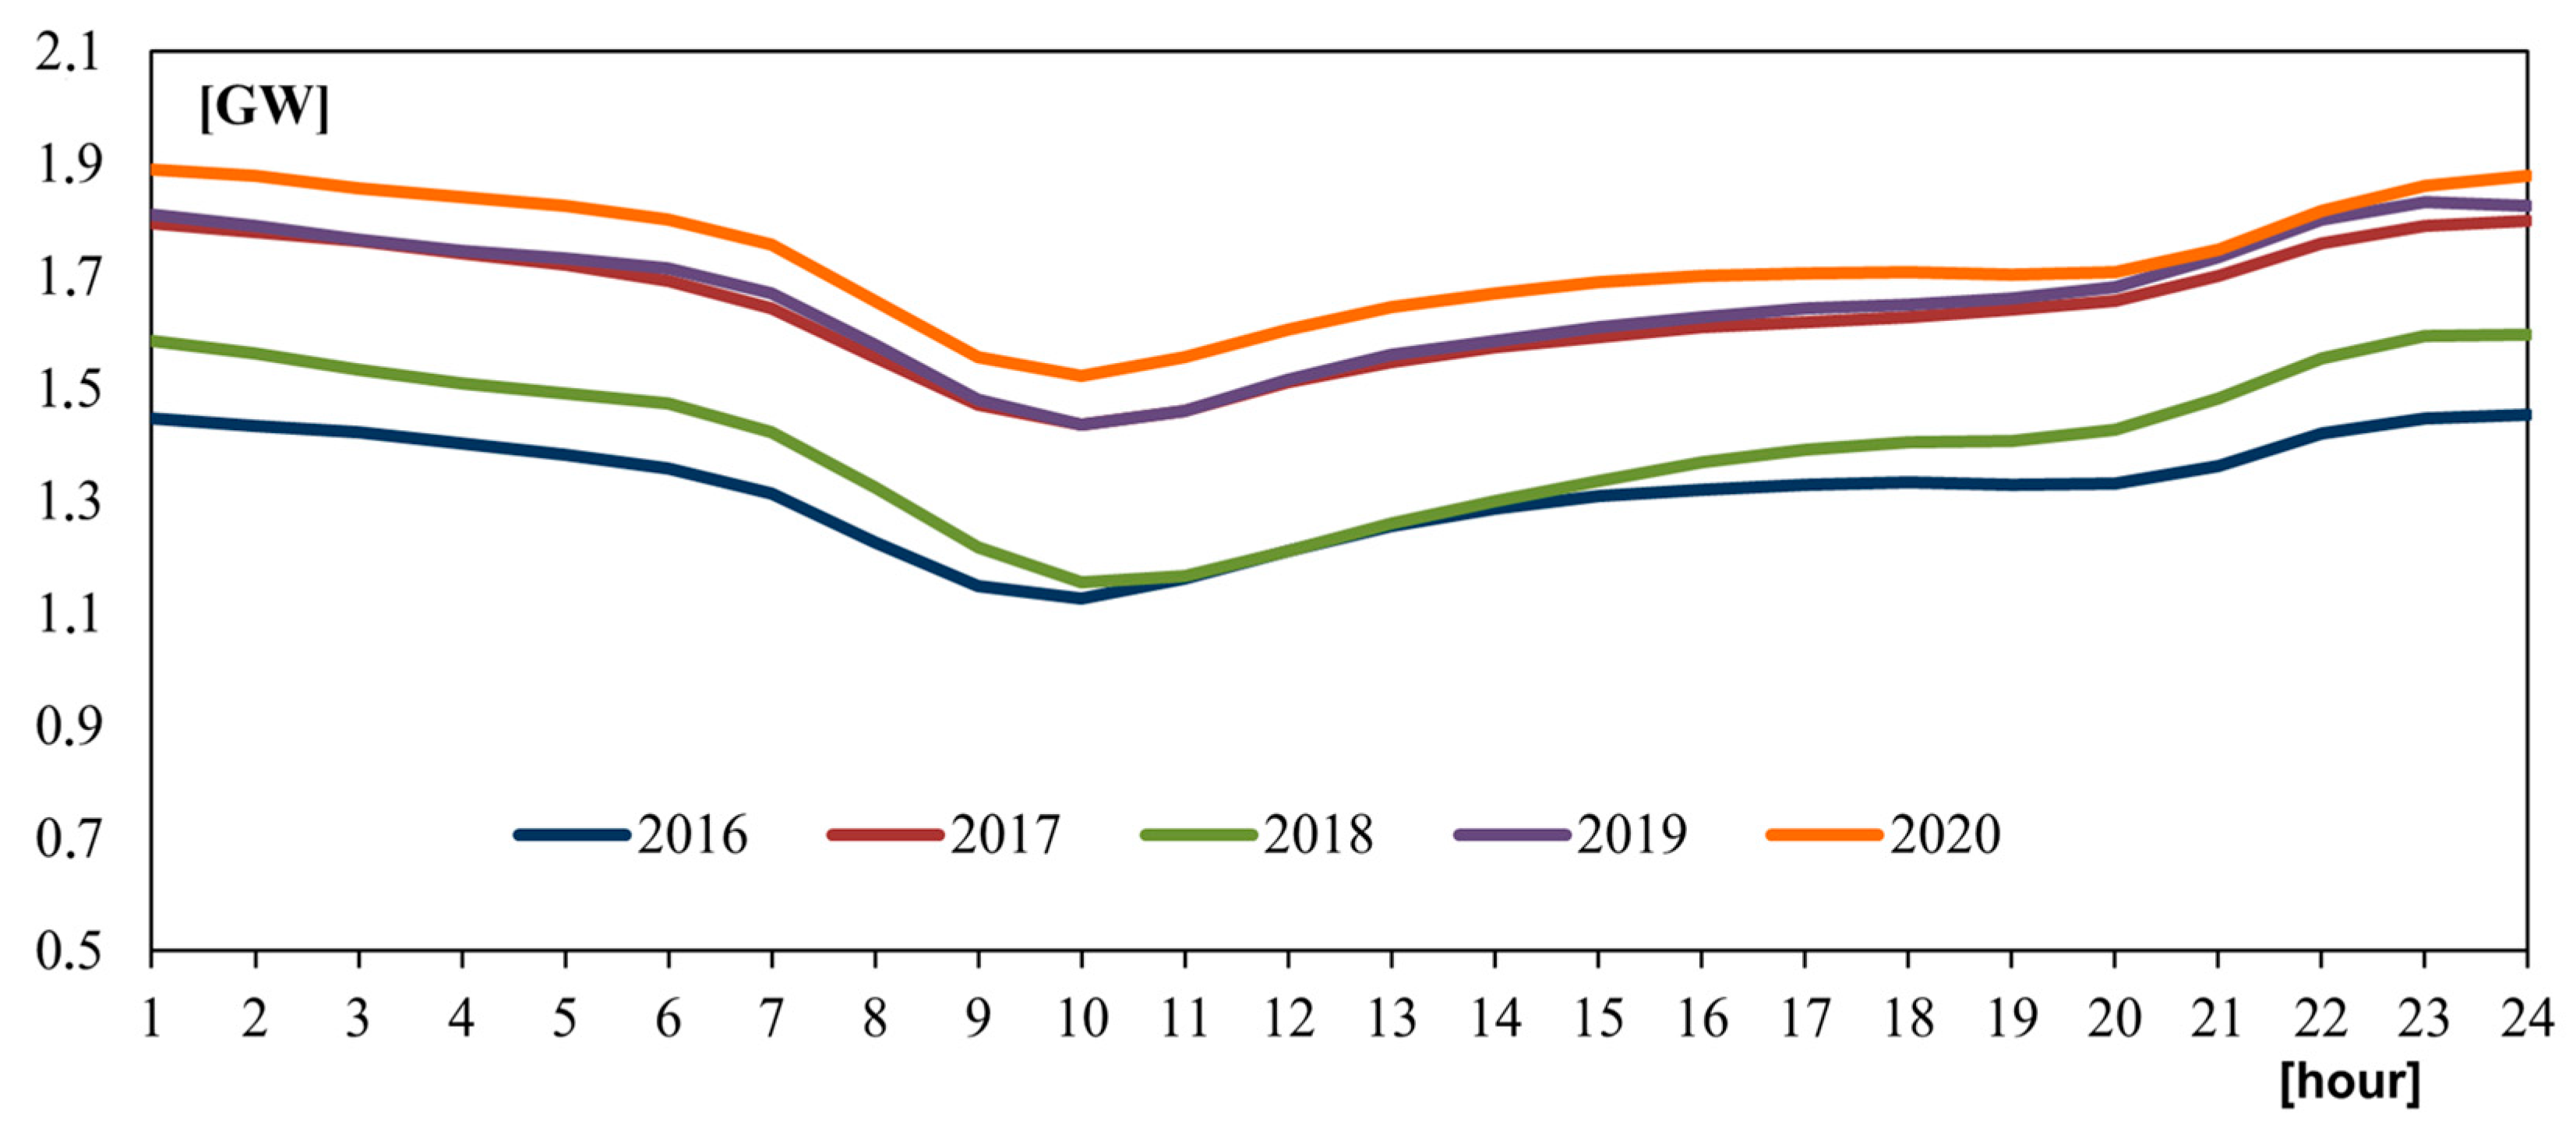
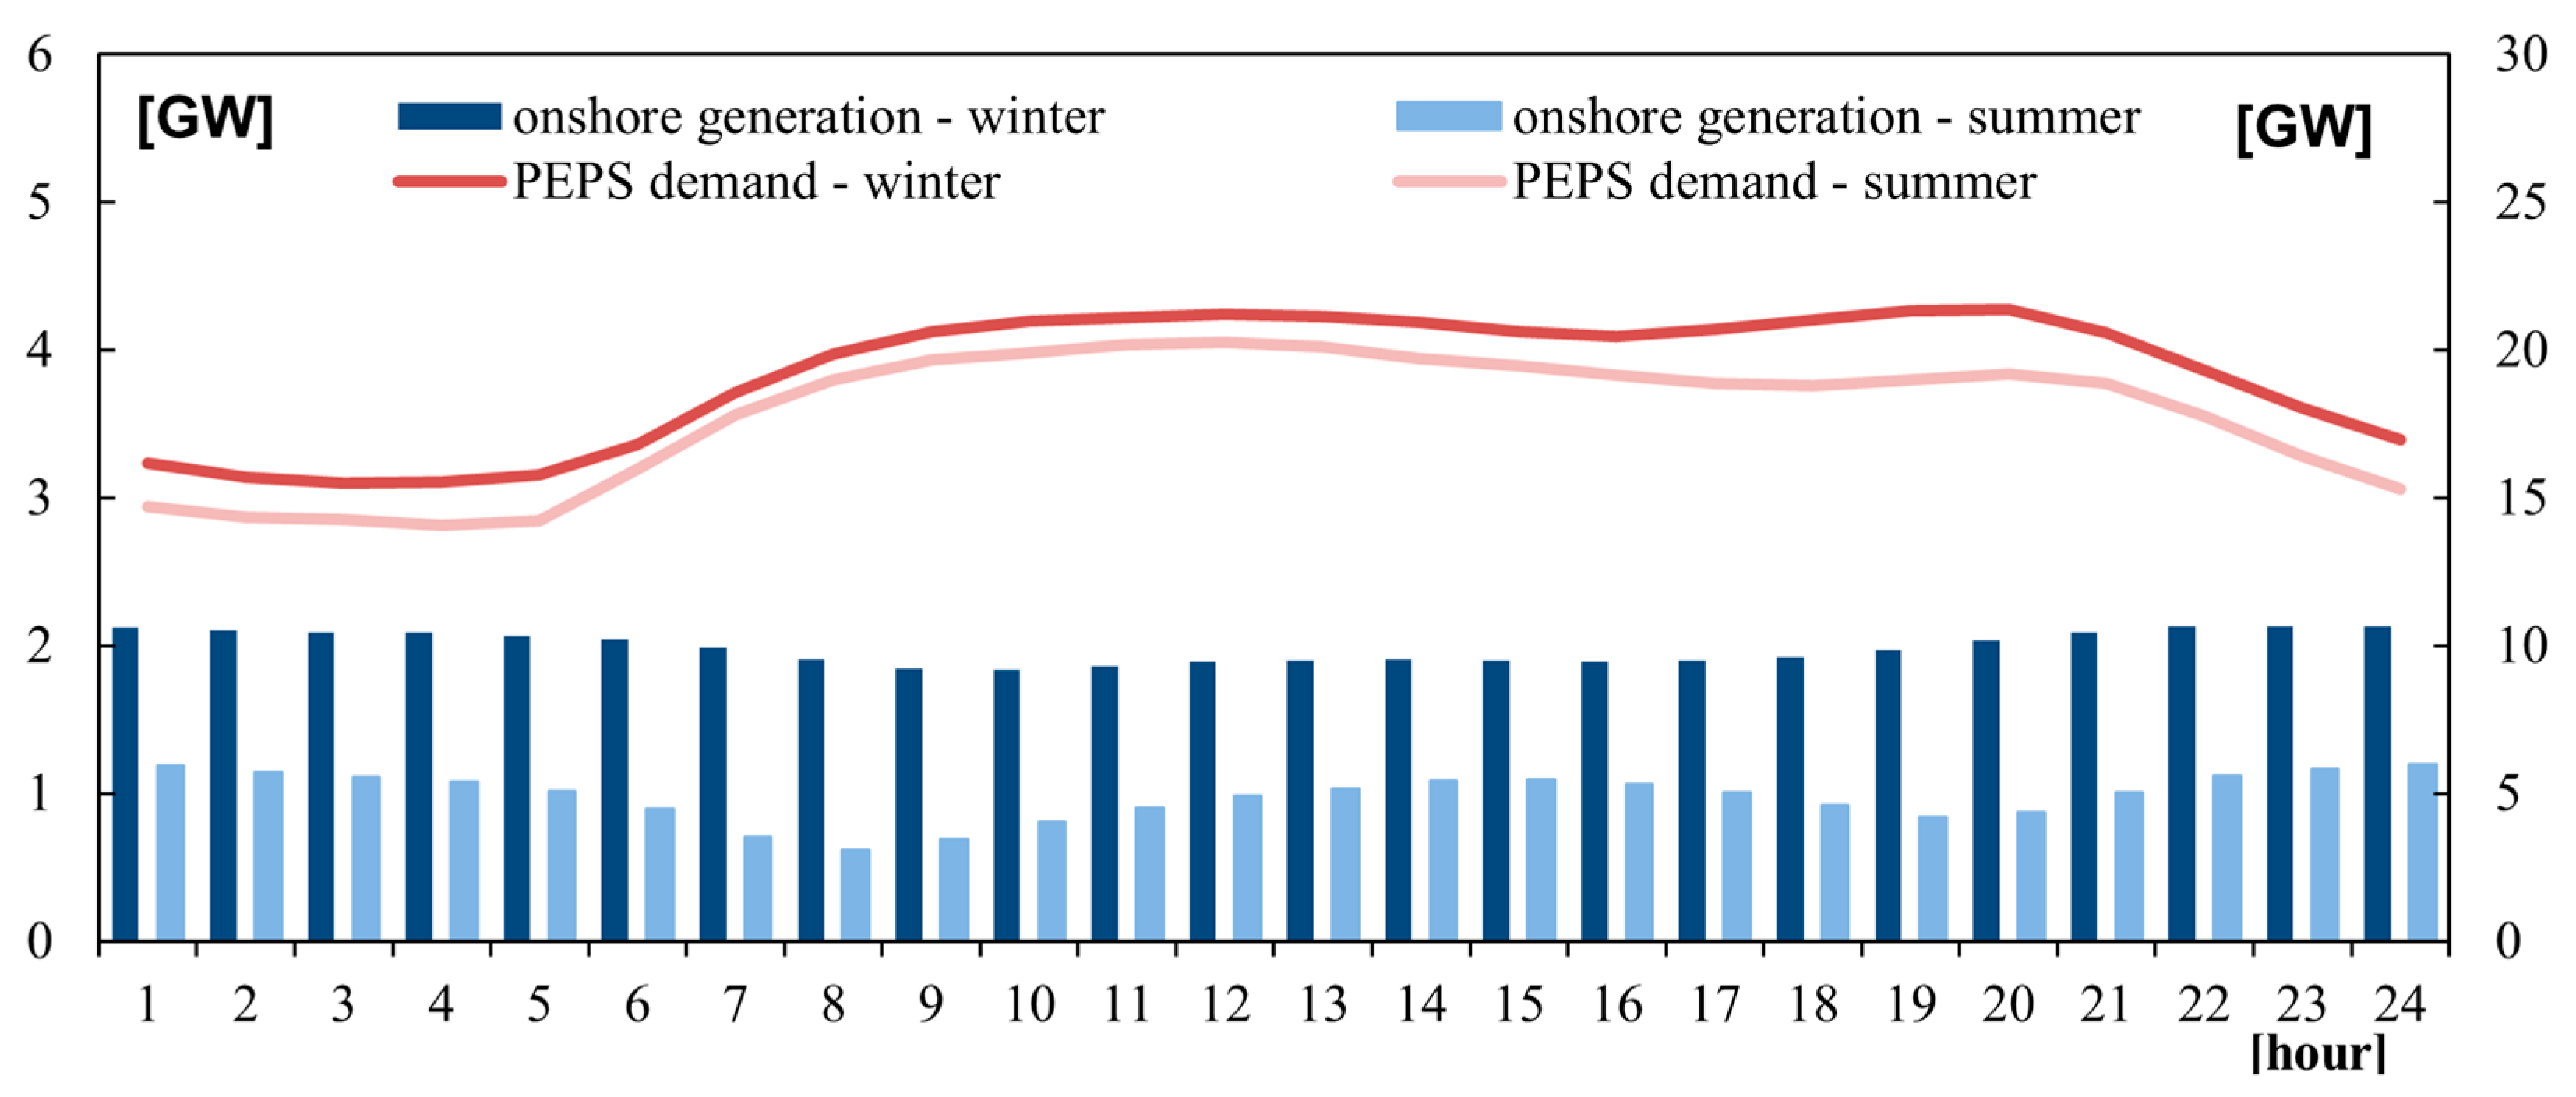
5.4. Daily Profile of Wind Generation
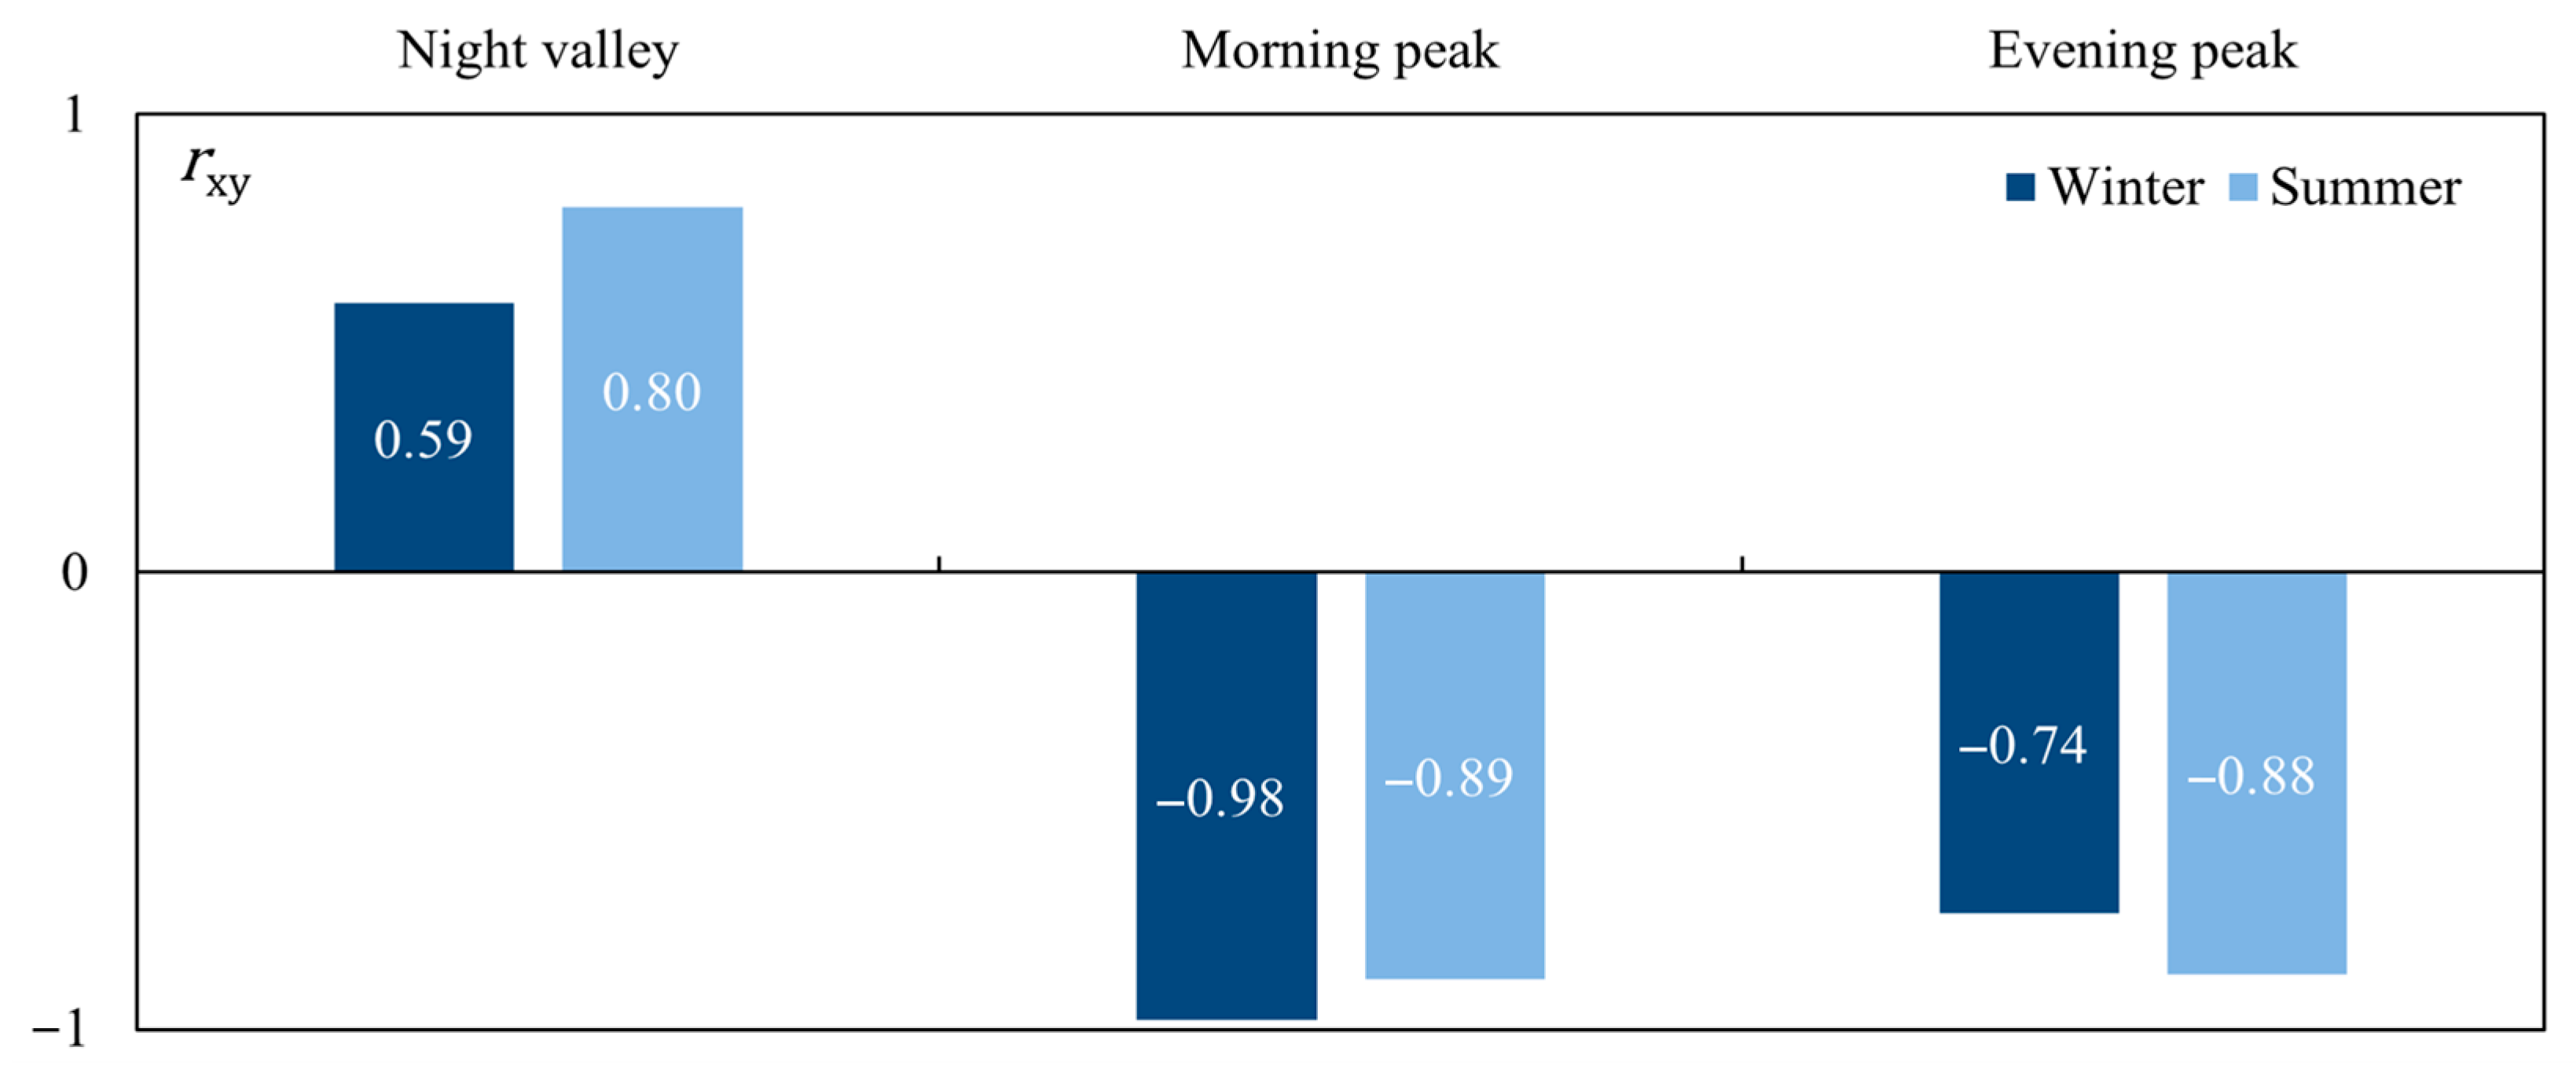
5.5. Correlation between Wind Generation and Demand
6. Conclusions
Author Contributions
Funding
Data Availability Statement
Conflicts of Interest
References
- Chris, R. The Paris Agreement-Implications for Greenhouse Gas Removal and Zero Emissions Energy Production. In Managing Global Warming: An Interface of Technology and Human Issues; Academic Press: Cambridge, MA, USA, 2018; pp. 17–66. [Google Scholar] [CrossRef]
- Montanarella, L.; Panagos, P. The Relevance of Sustainable Soil Management within the European Green Deal. Land Use Policy 2021, 100, 104950. [Google Scholar] [CrossRef]
- Mikołajuk, H.; Brasse, J.; Żarek, E.; Zaborska, D.; Wrońska, I.; Zatorska, M.; Bojanowska, H.; Stępniak, E. Statystyka Elektroenergetyki Polskiej; Agencja Rynku Energii S.A.: Warsaw, Poland, 2019. [Google Scholar]
- Brauers, H.; Oei, P.Y. The Political Economy of Coal in Poland: Drivers and Barriers for a Shift Away from Fossil Fuels. Energy Policy 2020, 144, 111621. [Google Scholar] [CrossRef]
- Widera, M.; Kasztelewicz, Z.; Ptak, M. Lignite Mining and Electricity Generation in Poland: The Current State and Future Prospects. Energy Policy 2016, 92, 151–157. [Google Scholar] [CrossRef]
- Gawlik, L.; Mokrzycki, E. Paliwa Kopalne w Krajowej Energetyce-Problemy i Wyzwania. Polityka Energetyczna-Energy Policy J. 2017, 20, 6–24. [Google Scholar]
- Luboińska, U.; Emisja Gazów Cieplarnianych. Wybrane Zagadnienia Dotyczące Emisji CO2 w Polsce. Opracowanie Tematyczne OT-683. Kancel. Senat. 2020. Available online: https://www.senat.gov.pl/gfx/senat/pl/senatopracowania/192/plik/ot-683.pdf (accessed on 1 September 2022).
- Rabiega, W.; Sikora, P.; Warsaw, J.G. CO2 Emissions Reduction Potential in Transport Sector in Poland and the EU Until 2050; Centre for Climate and Energy Analyses: Warszawa, Poland, 2019. [Google Scholar]
- Przybylak, R. The Change in the Polish Climate in Recent Centuries. Pap. Glob. Change 2007, 14, 7–23. [Google Scholar]
- Koć, P.; Osiak, J. Przemysłowy Instytut Automatyki i Pomiarów PIAP. Odnawialne Źródła Energii w Polsce: Wybrane Wyzwania w Obszarze Technologii i Finansów: Praca Zbiorowa; Przemysłowy Instytut Automatyki i Pomiarów PIAP: Warszawa, Poland, 2016; ISBN 9788361278276. [Google Scholar]
- Minister Kurtyka on RES in the Polish Energy Mix—Ministry of Climate and Environment—Gov.Pl Website. Available online: https://www.gov.pl/web/climate/minister-kurtyka-on-res-in-the-polish-energy-mix (accessed on 26 August 2021).
- Leung, D.Y.C.; Caramanna, G.; Maroto-Valer, M.M. An Overview of Current Status of Carbon Dioxide Capture and Storage Technologies. Renew. Sustain. Energy Rev. 2014, 39, 426–443. [Google Scholar] [CrossRef]
- Wagner, A.; Grobelski, T.; Harembski, M. Is Energy Policy a Public Issue? Nuclear Power in Poland and Implications for Energy Transitions in Central and East Europe. Energy Res. Soc. Sci. 2016, 13, 158–169. [Google Scholar] [CrossRef]
- Olejnik, T.P.; Sobiecka, E. Utilitarian Technological Solutions to Reduce CO2 Emission in the Aspect of Sustainable Development. (Utylitarne Rozwiązania Technologiczne Ograniczające Emisję CO2 w Aspekcie Zrównoważonego Rozwoju). Probl. Ekorozwoju 2017, 12, 173–179. [Google Scholar]
- Ściazko, M.; Chmielniak, T.; Kwaśniewski, K.; Stȩpień, L. Investment Dilemmas in the Implementation of Gasification Technology in Poland. Polityka Energetyczna 2018, 21, 105–123. [Google Scholar] [CrossRef]
- Robak, S.; Raczkowski, R.M. Substations for Offshore Wind Farms: A Review from the Perspective of the Needs of the Polish Wind Energy Sector. Bull. Pol. Acad. Sci. Tech. Sci. 2018, 66, 517–528. [Google Scholar] [CrossRef]
- The Path to Sustainability in the Electricity and Heating Sector. Available online: https://thedocs.worldbank.org/en/doc/724621544648141194-0080022018/original/PolandPETallv042web.pdf (accessed on 18 September 2023).
- Polityka Energetyczna Polski Do 2040 r. Available online: https://www.gov.pl/attachment/3209a8bb-d621-4d41-9140-53c4692e9ed8 (accessed on 27 August 2021).
- Sağlam, Ü. Assessment of the Productive Efficiency of Large Wind Farms in the United States: An Application of Two-Stage Data Envelopment Analysis. Energy Convers. Manag. 2017, 153, 188–214. [Google Scholar] [CrossRef]
- Hasterok, D.; Castro, R.; Landrat, M.; Pikoń, K.; Doepfert, M.; Morais, H. Polish Energy Transition 2040: Energy Mix Optimization Using Grey Wolf Optimizer. Energies 2021, 14, 501. [Google Scholar] [CrossRef]
- Wierzbowski, M.; Filipiak, I.; Lyzwa, W. Polish Energy Policy 2050—An Instrument to Develop a Diversified and Sustainable Electricity Generation Mix in Coal-Based Energy System. Renew. Sustain. Energy Rev. 2017, 74, 51–70. [Google Scholar] [CrossRef]
- Gawlik, L.; Szurlej, A.; Wyrwa, A. The Impact of the Long-Term EU Target for Renewables on the Structure of Electricity Production in Poland. Energy 2015, 92, 172–178. [Google Scholar] [CrossRef]
- Wyrwa, A.; Szurlej, A.; Gawlik, L.; Suwała, W. Energy Scenarios for Poland-a Comparison of PRIMES and TIMES-PL Modeling Results. J. Power Technol. 2015, 95, 100–106. [Google Scholar]
- Pietrzak, M.B.; Igliński, B.; Kujawski, W.; Iwański, P. Energy Transition in Poland—Assessment of the Renewable Energy Sector. Energies 2021, 14, 2046. [Google Scholar] [CrossRef]
- Marks-Bielska, R.; Bielski, S.; Pik, K.; Kurowska, K. The Importance of Renewable Energy Sources in Poland’s Energy Mix. Energies 2020, 13, 4624. [Google Scholar] [CrossRef]
- Igliński, B.; Iglińska, A.; Koziński, G.; Skrzatek, M.; Buczkowski, R. Wind Energy in Poland—History, Current State, Surveys, Renewable Energy Sources Act, SWOT Analysis. Renew. Sustain. Energy Rev. 2016, 64, 19–33. [Google Scholar] [CrossRef]
- Kacejko, P.; Wydra, M. Wind Energy in Poland-Analysis of Potential Power System Balance Limitations and Influence on Conventional Power Units Operational Conditions. Rynek Energii 2011, 2, 25–30. [Google Scholar]
- Brzezińska-Rawa, A.; Goździewicz-Biechońska, J. Recent Developments in the Wind Energy Sector in Poland. Renew. Sustain. Energy Rev. 2014, 38, 79–87. [Google Scholar] [CrossRef]
- Gnatowska, R.; Moryń-Kucharczyk, E. Current Status of Wind Energy Policy in Poland. Renew. Energy 2019, 135, 232–237. [Google Scholar] [CrossRef]
- Sobotka, A.; Rowicki, M.; Badyda, K.; Sobotka, P. Regulatory Aspects and Electricity Production Analysis of an Offshore Wind Farm in the Baltic Sea. Renew. Energy 2021, 170, 315–326. [Google Scholar] [CrossRef]
- Simla, T.; Stanek, W. Influence of the Wind Energy Sector on Thermal Power Plants in the Polish Energy System. Renew. Energy 2020, 161, 928–938. [Google Scholar] [CrossRef]
- Sokołowski, M.M. Discovering the New Renewable Legal Order in Poland: With or without Wind? Energy Policy 2017, 106, 68–74. [Google Scholar] [CrossRef]
- Sliz-Szkliniarz, B.; Eberbach, J.; Hoffmann, B.; Fortin, M. Assessing the Cost of Onshore Wind Development Scenarios: Modelling of Spatial and Temporal Distribution of Wind Power for the Case of Poland. Renew. Sustain. Energy Rev. 2019, 109, 514–531. [Google Scholar] [CrossRef]
- Gnatowska, R.; Wąs, A. Wind Energy in Poland—Economic Analysis of Wind Farm. E3S Web Conf. 2017, 14, 01013. [Google Scholar] [CrossRef]
- Szpor, A.; Ziółkowska, K. The Transformation of the Polish Coal Sector—GSI REPORT; International Institute for Sustainable Development: Winnipeg, MB, Canada, 2018. [Google Scholar]
- Smogorzewski, K.M. Polish Economy under Soviet Control. Slavon. East Eur. Rev. 1954, 32, 385–405. [Google Scholar]
- Gomułka, S. Poland’s Economic and Social Transformation 1989–2014 and Contemporary Challenges. Cent. Bank Rev. 2016, 16, 19–23. [Google Scholar] [CrossRef]
- Poland in the EU—Gov.Pl Website. Available online: https://www.gov.pl/web/eu/poland-in-the-eu (accessed on 27 August 2021).
- Korys, P. Poland from Partitions to EU Accession: A Modern Economic History, 1772–2004; Palgrave Macmillan: Cham, Switzerland, 2018; ISBN 9783319971261. [Google Scholar]
- Ustawa z Dnia 10 Kwietnia 1997 r.—Prawo Energetyczne. Available online: http://isap.sejm.gov.pl/isap.nsf/DocDetails.xsp?id=wdu19970540348 (accessed on 27 August 2021).
- Ministerstwo Środowiska. Strategia Rozwoju Energetyki Odnawialnej; Ministerstwo Środowiska: Warsaw, Poland, 2000.
- Rozporządzenie Ministra Gospodarki, Pracy i Polityki Społecznej z Dnia 30 Maja 2003 r. w Sprawie Szczegółowego Zakresu Obowiązku Zakupu Energii Elektrycznej i Ciepła z Odnawialnych Źródeł Energii Oraz Energii Elektrycznej Wytwarzanej w Skojarzeniu z Wytwarzaniem Ciepła. Available online: http://isap.sejm.gov.pl/isap.nsf/DocDetails.xsp?id=WDU20031040971 (accessed on 27 August 2021).
- Michalak, P.; Zimny, J. Wind Energy Development in the World, Europe and Poland from 1995 to 2009; Current Status and Future Perspectives. Renew. Sustain. Energy Rev. 2011, 15, 2330–2341. [Google Scholar] [CrossRef]
- Urząd Regulacji Energetyki. Available online: https://www.ure.gov.pl/ (accessed on 27 August 2021).
- European Union. Directive 2009/28/EC of the European Parliament and of the Council on the Promotion of the Use of Energy From Renewable Sources and Amending and Subsequently Repealing Directives 2001/77/EC and 2003/30/EC. Off. J. Eur. Union 2009. Available online: https://eur-lex.europa.eu/LexUriServ/LexUriServ.do?uri=OJ:L:2009:140:0016:0062:en:PDF (accessed on 28 August 2021).
- European Union. Directive 2001/77/EC of the European Parliament and of the Council of 27 September 2001 on the Promotion of Electricity Produced from Renewable Energy Sources in the Internal Electricity Market. Off. J. Eur. Union 2001. Available online: https://eur-lex.europa.eu/LexUriServ/LexUriServ.do?uri=CONSLEG:2001L0077:20100401:EN:PDF (accessed on 28 August 2021).
- European Union. Directive 2003/30/EC of the European Parliament and of the Council of 8 May 2003 on the Promotion of the Use Of Biofuels or Other Renewable Fuels For Transport. Off. J. Eur. Union 2003. Available online: https://eur-lex.europa.eu/LexUriServ/LexUriServ.do?uri=OJ:L:2003:123:0042:0046:en:PDF (accessed on 28 August 2021).
- Act of the Parliament of the Republic of Poland, Ustawa z Dnia 25 Sierpnia 2006 r. o Biokomponentach i Biopaliwach Ciekłych. 2006. Available online: http://isap.sejm.gov.pl/isap.nsf/download.xsp/WDU20061691199/O/D20061199.pdf (accessed on 28 August 2021).
- Act of the Parliament of the Republic of Poland, Ustawa z Dnia 4 Marca 2005 r. o Zmianie Ustawy—Prawo Energetyczne Oraz Ustawy—Prawo Ochrony Środowiska. 2005. Available online: http://isap.sejm.gov.pl/isap.nsf/download.xsp/WDU20050620552/O/D20050552.pdf (accessed on 28 August 2021).
- Act of the Parliament of the Republic of Poland, Ustawa z Dnia 20 Lutego 2015 r. o Odnawialnych Źródłach Energii 2015. Available online: https://isap.sejm.gov.pl/isap.nsf/download.xsp/WDU20150000478/T/D20150478L.pdf (accessed on 28 August 2021).
- Ministerstwo Rozwoju Strategia Na Rzecz Odpowiedzialnego Rozwoju. 2017. Available online: https://www.gov.pl/documents/33377/436740/SOR.pdf (accessed on 28 August 2023).
- Ministerstwo Gospodarki Polityka Energetyczna Polski Do 2030 Roku. 2009. Available online: https://wfosigw.wroclaw.pl/files/download_pl/773_polityka-energetyczna-polski-do-2030.pdf (accessed on 28 August 2023).
- Minister Gospodarki, Krajowy Plan Działania w Zakresie Energii Ze Źródeł Odnawialnych. 2010. Available online: https://wfosigw.wroclaw.pl/files/download_pl/769_krajowy-plan-dzialania-w-zakresie-energii-ze-zrodel-odnawialnych.pdf (accessed on 28 August 2023).
- Auction Rules and the Auction in Support of Renewable Energy Sources. Available online: https://www.roedl.net/pl/en/hot_news/renewable_energy/auction_rules_and_the_auction_in_support_of_renewable_energy_sources.html (accessed on 28 August 2021).
- System Aukcyjny Dla Odnawialnych Źródeł Energii Ma 5 Lat—Aktualności—Urząd Regulacji Energetyki. Available online: https://www.ure.gov.pl/pl/urzad/informacje-ogolne/aktualnosci/8739,System-aukcyjny-dla-odnawialnych-zrodel-energii-ma-5-lat.html (accessed on 28 August 2021).
- Przyszłość Morskiej Energetyki Wiatrowej w Polsce Raport PSEW. 2019. Available online: http://psew.pl/wp-content/uploads/2019/06/Przysz%C5%82o%C5%9B%C4%87-morskiej-energetyki-wiatrowej-w-Polsce-raport.pdf (accessed on 28 August 2023).
- Moc Zainstalowana (MW)—Potencjał Krajowy OZE w Liczbach—Urząd Regulacji Energetyki. Available online: https://www.ure.gov.pl/pl/oze/potencjal-krajowy-oze/5753,Moc-zainstalowana-MW.html (accessed on 28 August 2021).
- Ustawa z Dnia 20 Maja 2016 r. o Inwestycjach w Zakresie Elektrowni Wiatrowych. 2016. Available online: https://isap.sejm.gov.pl/isap.nsf/download.xsp/WDU20160000961/T/D20160961L.pdf (accessed on 28 August 2023).
- Jest Projekt Ustawy Liberalizującej Zasady Budowy Farm Wiatrowych | GRAMwZIELONE.Pl. Available online: https://www.gramwzielone.pl/energia-wiatrowa/105356/jest-projekt-ustawy-liberalizujacej-zasady-budowy-farm-wiatrowych (accessed on 28 August 2021).
- Nowy Rozdział w Polskim Onshore. Available online: https://www.teraz-srodowisko.pl/aktualnosci/energetyka-wiatrowa-na-ladzie-onshore-farmy-wiatrowe-10436.html (accessed on 28 August 2021).
- Szefler, K.; Gajewski, J. Areas of Optimal Wind Farm Locations in Polish Maritime Areas. Available online: http://psew.pl/files/microsoft%20powerpoint%20szefler%20obszary.pdf (accessed on 1 April 2018).
- Kullenberg, G.; Jacobsen, T.S. The Baltic Sea: An Outline of Its Physical Oceanography. Mar. Pollut. Bull. 1981, 12, 183–186. [Google Scholar] [CrossRef]
- Voipio, A. The Baltic Sea, 1st ed.; Elsevier: Amsterdam, The Netherlands, 1981; ISBN 9780080870687. [Google Scholar]
- Zachowicz, J.; Kramarska, R.; Uścinowicz, S. The Southern Baltic Sea-Test Field for International Co-Operation. Przegląd Geol. 2004, 52, 738–743. [Google Scholar]
- Boniecka, H.; Brzeska, P.; Czermańska, R.; Faściszewski, J.; Gajda, A.; Gajewski, J.; Gorczyca, M.; Hac, B.; Kalinowski, M.; Kałas, M.; et al. Study of Conditions of Spatial Development of Polish Sea Areas; Instytut Morski w Gdańsku: Gdańsk, Poland, 2016. [Google Scholar]
- Potencjał Offshore to Nawet 30 GW. Polska Jest Jednak Spóźniona—WysokieNapiecie.Pl. Available online: https://wysokienapiecie.pl/22991-farmy-na-morzu-baltyckim-nie-powstana-szybko/ (accessed on 22 July 2021).
- Polska Grupa Energetyczna PGE in Transition. 2020. Available online: https://www.gkpge.pl/investor-relations/content/download/5473/file/PGE%20in%20transition_January_II%202020.pdf (accessed on 28 August 2021).
- Global Offshore Renewable Map | 4C Offshore. Available online: https://www.4coffshore.com/offshorewind/ (accessed on 28 August 2021).
- Polskie Stowarzyszenie Energetyki Wiatrowej. Przewodnik Po Systemie Wsparcia Dla Morskich Elektrowni Wiatrowych Na Bałtyku. 2020. Available online: http://psew.pl/wp-content/uploads/2020/09/Przewodnik-po-systemie-wsparcia-dla-morskich-elektrowni-wiatrowych-na-Ba%C5%82tyku.pdf (accessed on 28 August 2023).
- Shukla, P.R.; Dhar, S.; Victor, D.G.; Jackson, M. Assessment of Demand for Natural Gas from the Electricity Sector in India. Energy Policy 2009, 37, 3520–3534. [Google Scholar] [CrossRef]
- Dong, W.; Sun, H.; Tan, J.; Li, Z.; Zhang, J.; Yang, H. Multi-Degree-of-Freedom High-Efficiency Wind Power Generation System and Its Optimal Regulation Based on Short-Term Wind Forecasting. Energy Convers. Manag. 2021, 249, 114829. [Google Scholar] [CrossRef]
- Dane Systemowe—PSE. Available online: https://www.pse.pl/dane-systemowe (accessed on 5 October 2021).
- Sinden, G. Characteristics of the UK Wind Resource: Long-Term Patterns and Relationship to Electricity Demand. Energy Policy 2007, 35, 112–127. [Google Scholar] [CrossRef]
- Summer Outlook & Winter Review 2015/2016; ENTSO-E: Brussels, Belgium, 2016.
- Miary Zależności Między Cechami. Available online: http://home.agh.edu.pl/~dabek/Dydaktyka/Studia_dzienne/Materia3y/Inne/Miary_zale_nooeci_miedzy_cechami.pdf (accessed on 5 October 2021).


| Farm | Capacity | No. of Turbines/Turbine Power/Type | Year Built | Farm |
|---|---|---|---|---|
| Potęgowo | 219 MW | 81/(2.5 MW and 2.75 MW) | 2020 | Potęgowo |
| Margonin | 120 MW | 60/2 MW/Gamesa G90 | 2009 | Margonin |
| Banie | 106 MW | 53/2 MW/Vestas V100 | 2016 | Banie |
| Marszewo | 100 MW | 50/2 MW/Vestas V80 and V90 | 2013 | Marszewo |
| Lotnisko | 94.50 MW | 30/3.15 MW/Alstom ECO 110 | 2015 | Lotnisko |
| Karścino | 90 MW | 60/1.5 MW/Fuhrländer FL MD77 | 2009 | Karścino |
| Name | Capacity [MW] | Average Wind Speed [m/s] | Depth Range [m] | Distance from Shore [km] | Name |
|---|---|---|---|---|---|
| Bałtyk I | 1560 | 8.88 | 32–48 | 80 | Bałtyk I |
| Bałtyk II | 720 | 8.97 | 23–34 | 37 | Bałtyk II |
| Bałtyk III | 720 | 8.99 | 25–34 | 22 | Bałtyk III |
| Baltica 2 | 1498 | 8.97 | 22–52 | 39 | Baltica 2 |
| Baltica 3 | 1045.5 | 9.02 | 33–39 | 33 | Baltica 3 |
| Baltic Power | 1200 | 8.50 | 20–30 | 25 | Baltic Power |
| Parameter | Unit | 2016 | 2017 | 2018 | 2019 | 2020 |
|---|---|---|---|---|---|---|
| Installed capacity | [MW] | 5807.42 | 5848.67 | 5864.44 | 5917.24 | 6347.11 |
| Power generated | [TWh] | 11,642.04 | 14,411.82 | 12,326.01 | 14,565.75 | 15,213.59 |
| Capacity factor | % | 22.82 | 28.13 | 23.99 | 28.10 | 27.29 |
| Average hourly generation | [MWh] | 1325.37 | 1645.19 | 1407.08 | 1662.76 | 1731.97 |
| Maximum generation within hour | [MWh] | 4891.73 | 5234.34 | 5195.93 | 5222.08 | 5729.17 |
| Standard deviation of generation | [MWh] | 804.23 | 946.83 | 838.06 | 945.85 | 903.83 |
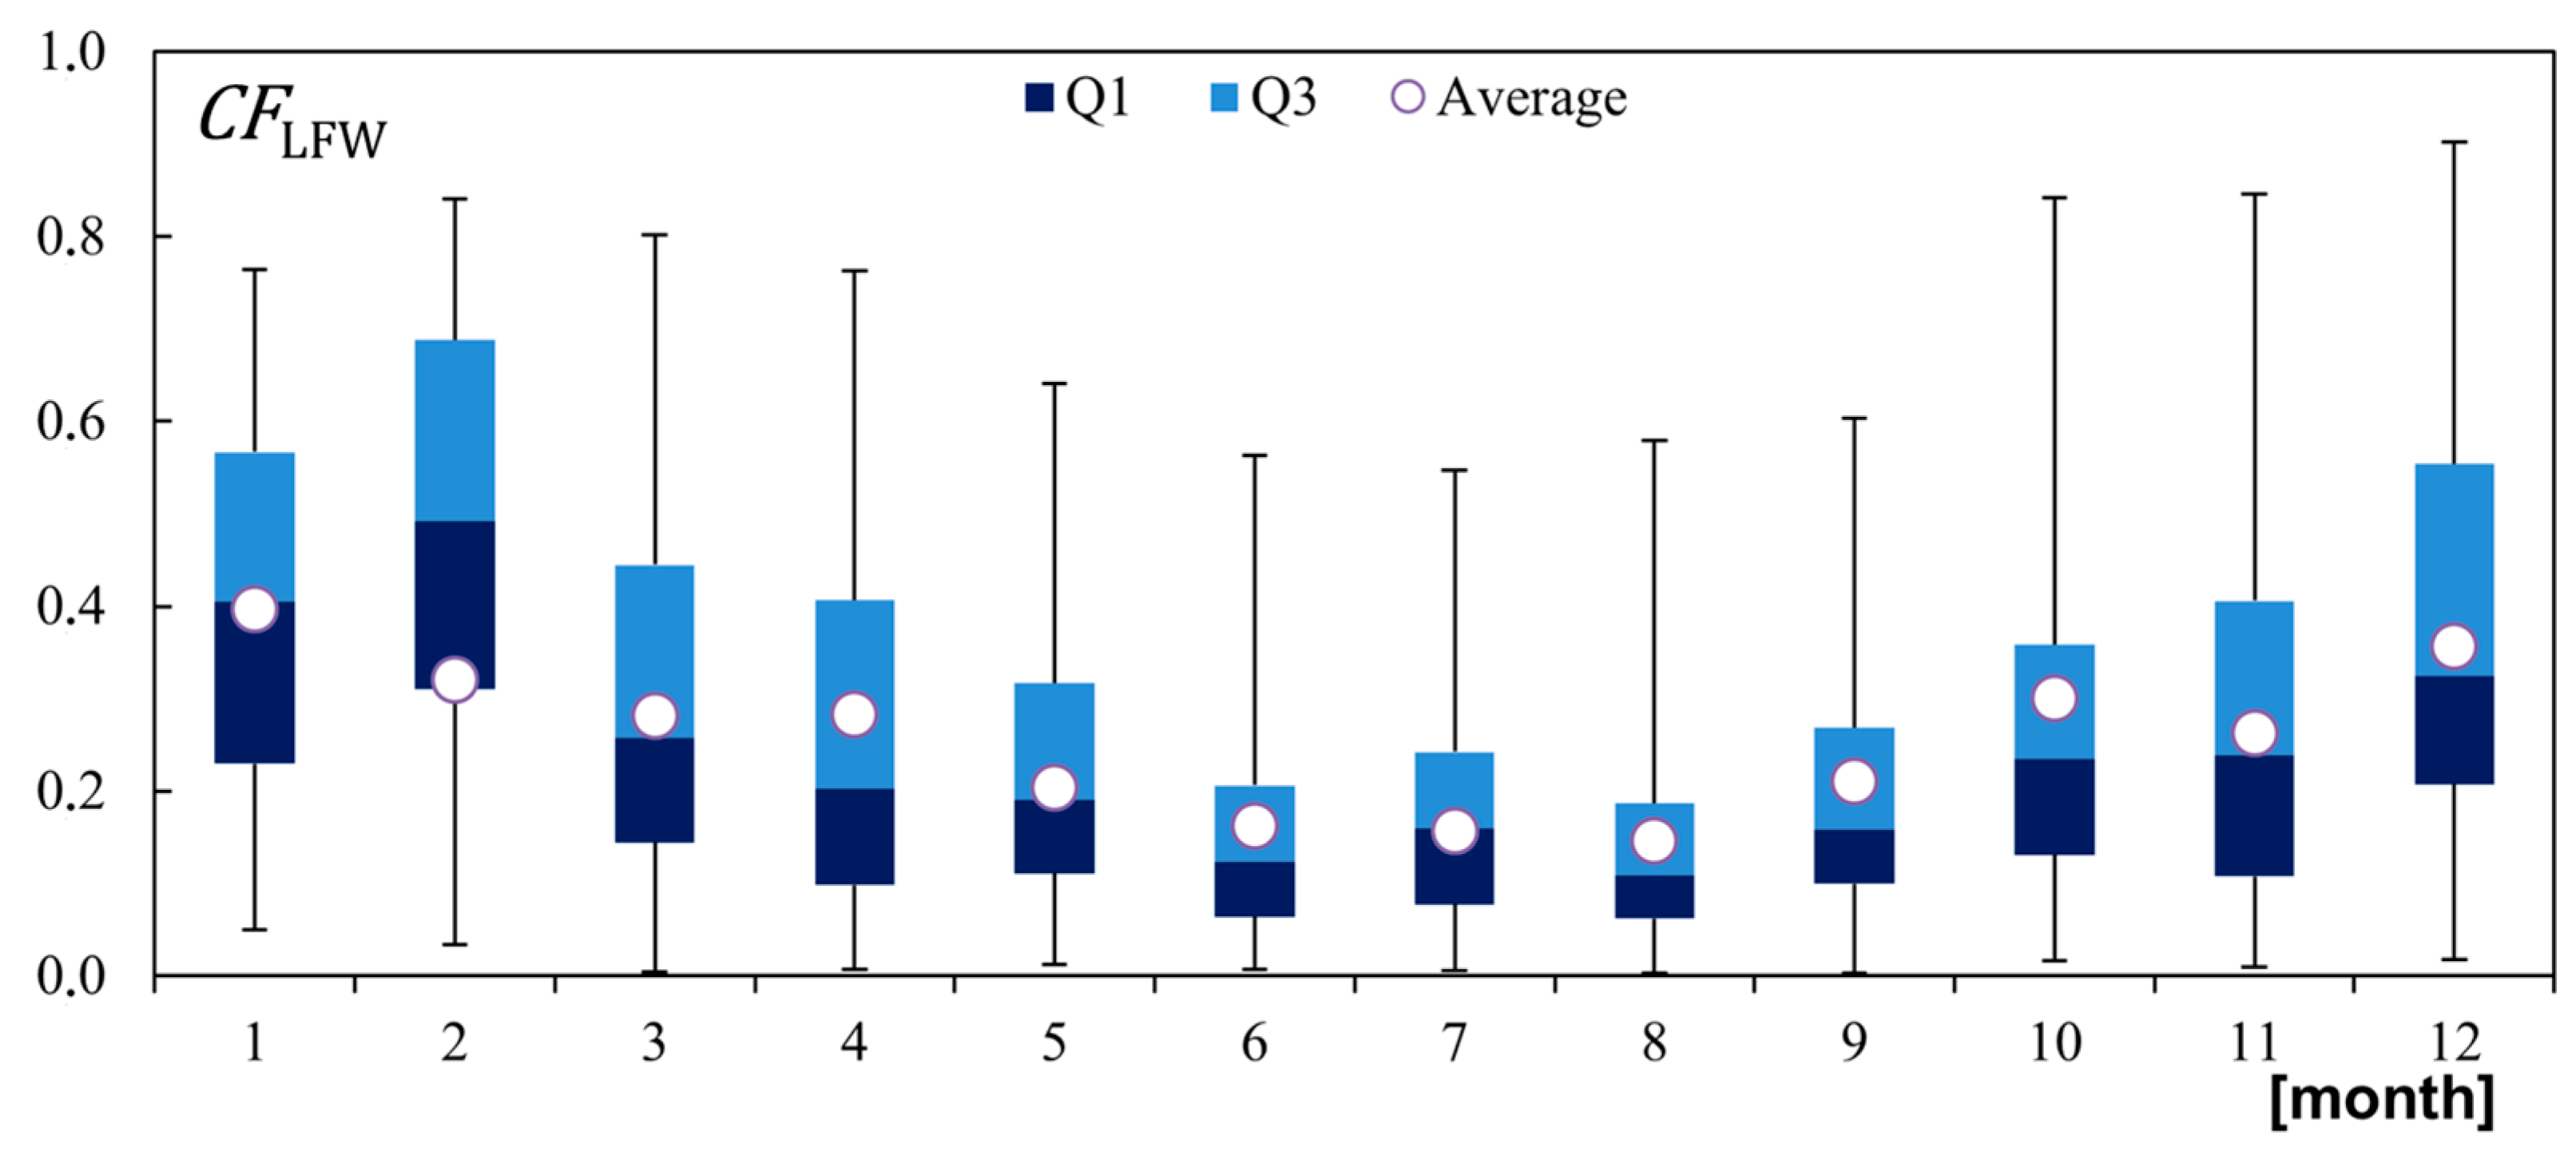
| Month | ||||||
|---|---|---|---|---|---|---|
| 1 | 0.40 | 0.76 | 0.049 | 0.20 | 574.32 | −761.42 |
| 2 | 0.48 | 0.84 | 0.034 | 0.23 | 601.02 | −723.58 |
| 3 | 0.31 | 0.80 | 0.004 | 0.20 | 596.07 | −754.02 |
| 4 | 0.26 | 0.76 | 0.007 | 0.20 | 1293.28 | −694.50 |
| 5 | 0.23 | 0.64 | 0.012 | 0.15 | 612.38 | −581.38 |
| 6 | 0.15 | 0.56 | 0.007 | 0.11 | 746.57 | −661.10 |
| 7 | 0.17 | 0.55 | 0.005 | 0.11 | 604.58 | −635.46 |
| 8 | 0.14 | 0.58 | 0.003 | 0.11 | 584.74 | −814.75 |
| 9 | 0.19 | 0.60 | 0.003 | 0.13 | 685.79 | −753.46 |
| 10 | 0.27 | 0.84 | 0.016 | 0.18 | 488.05 | −615.62 |
| 11 | 0.29 | 0.85 | 0.010 | 0.22 | 642.54 | −659.67 |
| 12 | 0.38 | 0.90 | 0.018 | 0.23 | 526.37 | −529.25 |
| Year | Linear Regression Equation | |
|---|---|---|
| 2016 | y = 0.01x + 1.1384 | 0.00070 |
| 2017 | y = −0.002x + 1.6838 | 0.00003 |
| 2018 | y = −0.007x + 1.5464 | 0.00040 |
| 2019 | y = −0.004x + 1.4789 | 0.00090 |
| 2020 | y = 0.038x + 1.0109 | 0.00091 |
| Profile | [GW] | [GW] | [o] | [o] |
|---|---|---|---|---|
| Onshore WF generation—winter | 1.99 | 0.10 | −2.95 | 2.04 |
| Onshore WF generation—summer | 0.98 | 0.16 | −1.34 | −2.78 |
| Demand—winter | 19.17 | 2.17 | 46.09 | 12.53 |
| Demand—summer | 17.78 | 2.17 | 44.25 | 0.37 |
Disclaimer/Publisher’s Note: The statements, opinions and data contained in all publications are solely those of the individual author(s) and contributor(s) and not of MDPI and/or the editor(s). MDPI and/or the editor(s) disclaim responsibility for any injury to people or property resulting from any ideas, methods, instructions or products referred to in the content. |
© 2023 by the authors. Licensee MDPI, Basel, Switzerland. This article is an open access article distributed under the terms and conditions of the Creative Commons Attribution (CC BY) license (https://creativecommons.org/licenses/by/4.0/).
Share and Cite
Robak, S.; Raczkowski, R.; Piekarz, M. Development of the Wind Generation Sector and Its Effect on the Grid Operation—The Case of Poland. Energies 2023, 16, 6805. https://doi.org/10.3390/en16196805
Robak S, Raczkowski R, Piekarz M. Development of the Wind Generation Sector and Its Effect on the Grid Operation—The Case of Poland. Energies. 2023; 16(19):6805. https://doi.org/10.3390/en16196805
Chicago/Turabian StyleRobak, Sylwester, Robert Raczkowski, and Michał Piekarz. 2023. "Development of the Wind Generation Sector and Its Effect on the Grid Operation—The Case of Poland" Energies 16, no. 19: 6805. https://doi.org/10.3390/en16196805
APA StyleRobak, S., Raczkowski, R., & Piekarz, M. (2023). Development of the Wind Generation Sector and Its Effect on the Grid Operation—The Case of Poland. Energies, 16(19), 6805. https://doi.org/10.3390/en16196805