Abstract
Virtual power plants (VPPs) offer a feasible solution for integrating various types of distributed energy resources (DERs) into the power grid in the electricity market. This paper proposes a multi-time-scale rolling optimal scheduling for VPPs, enabling optimal self-scheduling plans across intra-week rolling scheduling, intra-day rolling dispatch, and real-time dispatch. The proposed method facilitates participation in energy and flexible ramping product (FRP) markets while considering the specific characteristics with complementary advantages for the aggregated renewable resources, gas turbines, energy storages, and flexible demands of each time scale. The flexible ramping products within the VPP framework are established, while the energy storage systems address fluctuations during dispatch periods. Case studies are conducted to verify the efficiency of the proposed method. The results show that the proposed method can obtain optimal self-scheduling plans within the multi-time framework and has better performance in economy and security operation in comparisons among cases.
1. Introduction
1.1. Motivation and Incitement
As an emerging entity, the use of virtual power plants (VPPs) to realize the integration of diverse DERs and thus improve its controllability and reliability has grown rapidly in recent years. Specifically, VPPs can aggerate various types of DERs, such as gas turbines (GTs), wind power, photovoltaic (PV) power, energy storage systems (ESSs), and flexible demands, as an integrated entity that can participate in power markets, and through which VPP can promote the effective utilization of renewable resources and achieve environmental and economic benefits [1]. However, the fluctuations in DERs have brought lots of challenges to the power system and enhanced the difficulties in maintaining security operations. The fluctuations in renewable resources output encompass both short-term and long-term fluctuations with different characteristics. Therefore, to better cope with the fluctuations in renewable resources, this paper proposes multi-time-scale rolling optimal scheduling for VPP’s optimal self-scheduling plans with the cooperation of two types of energy storage system. Meanwhile, with the purpose of improving profits, a VPP was set up in this study to participate in both energy and FRP markets.
1.2. Literature Review
Currently, VPP’s optimal dispatch strategy and bidding/offering strategy have received much attention from researchers. In [2], the day-ahead bidding strategy of a commercial virtual power plant (VPP) is addressed by considering various DERs. An imperialist competitive algorithm to determine the optimal bidding strategy of a VPP is proposed in [3], aiming to minimize its total operation cost. Based on the three stages of the power market, [4] integrated and analyzed various types of electric vehicle (EV) in the VPP and then proposed an Improved Artificial Bee Colony algorithm to determine the optimal bidding strategy for VPPs. In [5], an auction-based energy management solution was developed with the aim of surplus profit sharing among consumers and producers within the VPP through a nodal marginal pricing mechanism. These studies mainly focus on situations in which the VPP participates in the energy market under a specific time scale.
According to the characteristics of the aggregated DERs, VPP can participate in different markets to gain more profit [6]. Flexible ramping products (FRPs), as an emerging product, have been introduced to the California market (CAISO) and Midcontinent market (MISO) [7,8]. In [9], a deterministic real-time unit commitment with ramping capacity constraints is compared with an ideal stochastic unit commitment. Ref. [10] presents a detailed review of the modeling and implementation of FRPs. Ref. [11] proposes an optimization model for a battery energy storage aggregator to provide FRPs in the day-ahead market. Due to the flexibility in charging and discharging within a short time, ESSs have great potential in providing FRPs, and the potential of demand-side resources should not be ignored [12]. For VPPs that aggerate DERs with fast adjustment characteristics, like ESSs or flexible demands, participating in the FRP market can improve both the efficiency and revenue of VPP.
Meanwhile, lots of efforts have been made to alleviate the impact of the fluctuation, intermittency, and randomness of the increasing DERs [13]. Attaching energy storage devices proportionally to renewable resources has become an effective method, although the current cost of energy storage devices cannot be ignored [13]. Common ESSs, like battery energy storage systems (BESSs), have been utilized as short-term energy storage facilities, which means they can only reduce the impact of short-term fluctuations according to their storage characteristics [14]. At the same time, the fluctuation in renewable resources output is not only reflected in the deviation from the predicted value in a short time but also in the output profile in a more extended period. For example, the PV output on sunny days should be much more than on rainy days, while the load’s profile does not have trends like that. Due to this, a long-term energy storage system called the hydrogen energy storage system (HESS) has aroused a lot of interest. Ref. [15] concentrates on the optimal scheduling for a HESS integrated with a photovoltaic system and a BESS, aiming to minimize the hydrogen production cost. Based on the time-sequence production simulation method, a two-stage optimal proportion model for an integrated system of wind–solar–hydrogen storage is formulated in [16]. With these concerns, considering both the short-term and long-term ESS in VPPs can better address the impacts of the fluctuation, intermittency, and randomness of renewable resources.
1.3. Contribution and Paper Organization
VPP offers a feasible solution for integrating diverse DERs, while the fluctuations in DERs bring critical challenges to VPPs. Nowadays, studies of VPPs mainly focus on addressing the short-time fluctuation under a specific short-term time scale, ignoring the fact that some fluctuations in the renewable resources caused by natural conditions have a more extended period and need to be considered under a longer time scale, e.g., a weekly time scale. Meanwhile, the development of FRPs and the market offers more opportunities for VPPs to increase their revenue.
Based on the concerns mentioned above, we constructed a VPP that aggregates renewable resources, gas turbines, energy storage systems, and flexible demands. To deal with both the short-term and long-term fluctuations in renewable resources, a multi-time-scale rolling optimal dispatch framework is proposed, including intra-week rolling scheduling, intra-day rolling dispatch, and real-time dispatch. At the same time, we consider the power flow constraints of the VPP for security operations. Moreover, the VPP we considered participates in both the energy market and FRP market with the objective of maximizing its net profit.
The major contributions of the paper are summarized below:
- Aggregating the capacities of ESS and flexible demands, the VPP’s FRP models are established in this paper while considering the FRP regulation signal from the ISO and the corresponding effects on the operation of the VPP.
- Intra-week rolling scheduling is introduced in this paper as a substitute for Day-ahead scheduling to cope with the longer-term fluctuation of the photovoltaic power generation caused by the temporal imbalance of sunlight resources. A HESS model is introduced for this procedure as a form of long-term energy storage.
- The framework for multi-time-scale rolling optimal dispatch, including intra-week rolling scheduling, intra-day rolling dispatch, and real-time dispatch, is proposed in this paper to cope with the long-term and short-term fluctuation in photovoltaic power generation and demands. At the same time, HESS and BESS are introduced in the framework to match these time scales’ different operation and trade requirements.
The rest of this paper is organized as follows. Section 2 introduces the framework for the multi-time-scale rolling optimization method. In Section 3, the models of FRPs are established. Section 4 presents the multi-time-scale rolling optimization model of VPP, across intra-week rolling scheduling, intra-day rolling dispatch, and real-time dispatch. Section 5 presents the solution of the method. Case studies are presented in Section 6. Section 7 summarizes the conclusions and discusses future work.
2. Framework for Multi-Time-Scale Rolling Optimization Method
The framework of the proposed multi-time rolling optimization method is shown in Figure 1. In order to reduce the effects of prediction errors and maintain the long-term operation stability of the virtual power plant, this paper constructs a rolling optimization involving three time scales:
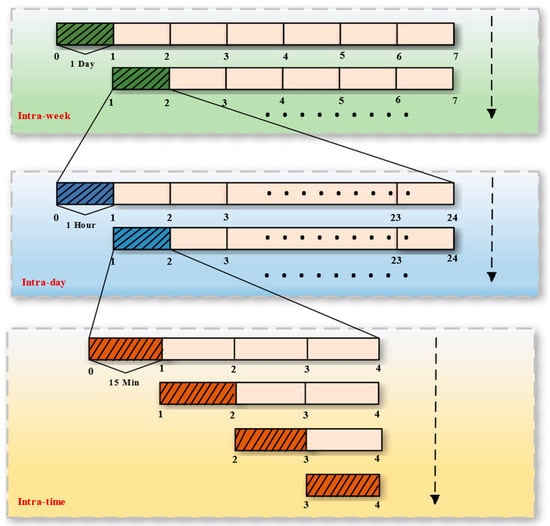
Figure 1.
Framework for multi-time-scale rolling optimization method.
- Intra-week rolling scheduling: In the intra-week scheduling, performed every day within a week, the other days of the week are all considered for the stable operation of the VPP and the SOC balance of the long-term energy storage (HESS). The time slot here is one hour. In each scheduling, the day-ahead forecast data of the PV generations are updated on the first day, while the week-ahead data are utilized for the remaining times. The optimal results of the first day (24 h) for each optimization are the referral plans of the intra-day dispatch. Furthermore, the trade volume per hour in the DA energy market is determined on this time scale.
- Intra-day rolling dispatch: In each intra-day dispatch optimization, performed every hour within a day, the remaining hours of the day are considered for the SOC balance of short-term energy storage (BESS). The time slot here is 15 min. The intra-day forecast data of the PV generations are updated in the first hour, while the day-ahead data are utilized for the rest time of each intra-day dispatch optimization. The optimal results of the first hour (four 15 min) for each optimization provide basic operating points for the real-time dispatch. Additionally, the trade volumes per 15 min in the FRP market are decided on this time scale.
- Real-time dispatch: The real-time optimization is performed every 15 min sequentially within an hour to correct the real-time dispatch plans based on the basic operating points. The time slot here is 15 min. We use the real-time forecast data in the first 15 min while the intra-day forecast data are used in the rest time of each optimization. The optimal results of the real-time dispatch provide the dispatch instruction.
3. Model of Flexible Ramping Products
FRPs are capacities reserved in advance to cope with the rapid net load changes in the power system, and whether the reserved capacities would be actually regulated depends on the signals of the ISO. In this paper, the VPP aggerates some DERs with fast adjustment characteristics. Therefore, the specific FRP providers inside the VPP are the BESS and two kinds of flexible demands, based on their flexibilities in ramping performance within a short time. We consider the effects of the regulated capacities on the continuous operation of the VPP while deriving the corresponding FRP models. Additionally, the whole volume of FRP trading with the market by the VPP is the sum of these providers’ capabilities inside.
As for the regulation signals, it is assumed that the upward and downward regulation signals are related to the upward/downward FRP prices in (1) and (2):
where / is the upward/downward signals, and / is the upward/downward FRP prices.
3.1. Battery Energy Storage Systems
Inside the VPP, BESSs, as the short-term ESSs, play their role mainly in intra-day and real-time periods with great flexibility in charging and discharging, which fits the FRP’s needs. The constraints of the FRPs provided by the BESSs can be divided primarily into charging constraints, discharging constraints, and state-of-charge constraints, respectively.
As shown in (3) and (4), both the power charging and discharging can provide FRPs, and the total upward/downward FRP / of the i-th BESS at time slot t should include both. Specifically, / is the upward FRP provided by power charging/discharging in (3), while / is the downward FRP provided by power charging/discharging in (4). Constraints (5)–(7) set bounds for all the FRPs mentioned in (3) and (4), according to the BESS’s fast response capability limits.
In (8) and (9), and are, respectively, the discharging and charging power that is not involved in providing FRPs, whether regulated by the ISO or not, while and represent the actual discharging and charging power with the regulated capacities of FRPs considered. Constraints (10) and (11) are the actual charging and discharging power limits, respectively, while the state-of-charge level is defined in (12).
Due to the characteristics of the ramping products, FRPs span the time period [t, t + 1]. Additionally, the reserved FRPs at time slot t would actually influence the charging and discharging power, whether regulated or not. We derive the charging and discharging power limits with the corresponding consideration in (13)–(16). Constraints (17) and (18) are the indication of the FRP’s influence on the state-of-charge level considering the limits. When / equals 0, the reserved FRPs are not regulated by the ISO, and / is considered in (17) and (18). When / equals 1, the reserved FRPs are regulated by the ISO, and the FRP terms disappear in (17) and (18) since they are already considered in (8), (9), and (12).
3.2. Flexible Demands
As for flexible demands, we consider the interruptible loads and transferable loads as FRP providers specifically. Constraints (19) and (20) are for interruptible loads, while (21)–(24) are for transferable loads.
Distinguished from BESS, the flexible demands considered in this paper are not continuously dispatchable in a temporal sense. Instead, they are dispatchable a limited number of times, usually in a discrete way. Therefore, it is not feasible to reserve FRPs in the previous time period. We can regard the dispatchable power consumption of flexible demands as the potentially available FRPs during each time slot t. Additionally, we only consider the regulated FRPs here as , , .
is the upward FRP provided by the interruptible load i at time slot t, which means that interrupting demands within a short time is equivalent to providing upward FRPs. Constraint (19) sets bounds for considering the regulated signals. Constraint (20) means that ’s volume should not be more than the actual interrupted demands at time slot t.
/ is the upward/downward FRP provided by transferable load i at time slot t. Transferable loads can transfer part of their demands at some time to the other time slots if needed. Similar to the situation of the interruptible load, transferring the demands out within a short time is equivalent to providing upward FRPs, while transferring the demands in means providing downward FRPs. Constraints (21) and (22) set bounds for and , considering the regulated signals. Constraints (23) and (24) restricts / to the transferring-out/transferring-in demands, /, respectively.
4. Model of Multi-Time-Scale Rolling Optimization Method
This paper proposes a multi-time-scale rolling optimization method for VPP across intra-week rolling scheduling, intra-day rolling dispatch, and real-time dispatch.
4.1. Intra-Week Rolling Scheduling
With the day-ahead and the week-ahead forecast data of the loads and photovoltaic power generation, we make the referral operation plans for the VPP and determine trade volumes per hour in the DA energy market in this time scale. The time interval here is 1 h, and the maximum period has 168 time slots.
The objective of the intra-week scheduling is to maximize the net profit of the VPP. In this time scale, represents the time interval. Moreover, is the set containing all the time slots in each intra-week rolling scheduling, of which is the length, where represents the iteration number of the rolling scheduling. Every time index t in this subsection belongs to set .
The net profit of the VPP in (25) is mainly composed of three terms as follows:
represents the VPP’s revenue when participating in the DA energy market in (26). When is positive, the VPP sells electricity to the market, while when is negative, the VPP purchases electricity from the market. is the DA market clearing price at time slot t.
is the income for selling electricity to loads inside the VPP in (27), while is the power consumption of load i and is the selling price at time slot t. Furthermore, the VPP’s electricity sales strategy will prioritize power sales to the internal loads since we set properly greater than . It is noteworthy that flexible demands are not considered in this time scale.
is the total operation cost of the VPP in (28), including the gas turbine cost , the BESS cost , and the HESS cost . It is assumed that photovoltaic power generation is cost-free.
Constraints (32)–(42) are related to the distribution power flow. We address them using the second-order cone programming (SOCP) relaxation as follows. We introduce , , , and as the new SOCP relaxation variables.
represents the bus set, while represents the set of buses connected to the main grid. In this paper, it is assumed there is only one connected bus. denotes the set of the neighbor nodes of bus i, while denotes the set of transmission lines. Since the power factor of photovoltaic power generation is very close to one, we ignore the reactive power generation of PV.
The power exchanges between the VPP and the main grid are limited in (43)–(45). // is the binary vector indicating the status of gas turbine/BESS charging/BESS discharging. The operation constraints of gas turbine i are shown in (46)–(48), where is the spinning reserve and / is the ramping up/down limits. Additionally, (49)–(55) models the operation of BESS, while (53) indicates the state-of-charge balance of each day in the I-th rolling scheduling.
Constraints (56)–(62) model the operation of HESS. is the converted factor between hydrogen and electricity. indicates the efficiency of the electrolyzers, while indicates the efficiency of the hydrogen fuel cell. denotes the volume of hydrogen storage capacity. Since HESS performs as a form of long-term energy storage, should complete the cycle within a week. Constraint (60) determines the initial status of the hydrogen storage capacity in the I-th rolling scheduling, while (61) determines the final status of the whole week.
In this time scale, the final status of hydrogen storage capacity on the first day, which is also the initial status on the second day, denoted as , is determined in each rolling scheduling. Meanwhile, the trade volume in the DA energy market is determined per hour. The rest of the optimal results of the first 24 work as the referral plans for the dispatch in the next time scale.
Notice that the connections between each rolling scheduling should be captured, e.g., in (60) comes from (63), which is equal to the final status of the hydrogen storage capacity determined in the previous intra-day rolling scheduling.
4.2. Intra-Day Rolling Dispatch
Similar to the previous procedure, with the intra-day and day-ahead forecast data of the loads and photovoltaic power generation, the basic operation plans for the VPP are determined in this time scale. Moreover, participation in the FRP market is determined in this time scale. The time interval here is 15 min, and the maximum period has 96 time slots.
The objective of the intra-week scheduling in (64) is to maximize the net profit of the VPP considering the profit participating in the FRP market compared to intra-week rolling scheduling. In this time scale, represents the time interval, while the set includes time slots in the J-th intra-day rolling scheduling each day. Every index t in this subsection belongs to set .
and here are the same as in (26) and (27), except is replaced by . Additionally, changes to (66). shows the total profit of the VPP providing FRPs, while the total upward/downward FRPs of the VPP are denoted in (67)/(68). indicates the cost of flexible demands calculated in (69).
The distribution power flow constraints here are just the same as in (32)–(42). Moreover, the power exchange constraints and the VPP’s operation constraints are just as in (44)–(52) and (55), where the state-of-charge status constraints in (53) and (54) are replaced by (70) and (71), while (43) changes to (72) since FRPs are considered in this time scale.
is denoted as the initial SOC status of BESS in the J-th intra-day rolling dispatch, which is defined in constraint (74). Constraint (71) means that the BESS’s final status of the day is equal to the initial status of the day rather than the initial status in this rolling dispatch. It is noteworthy that, except for the first intra-day rolling dispatch each day, the considered time slots are less than a whole day, but the authors still have to satisfy the SOC balance of BESSs, considering their continuous operation status.
The constraints of HESS are the same as in (56)–(59) and (62), where (60) is replaced by (73). Constraint (73) means that the final status of the hydrogen storage capacity of the first hour in (J-1)-th intra-day dispatch is equal to the initial status in the J-th.
The flexible demands work in the intra-day rolling scheduling. Constraints (75)–(77) are for the operation of interruptible loads, while (78)–(83) are for the transferable loads. Constraint (75) sets bounds for the volume of interruptible loads and is the maximum interruptible volume of IL i. The volume of transferable load is limited in (78) and (79) while is the maximum transferable volume of TL i. The total transferring-in volume of transferable load i should equal the transferred-out throughout the day as shown in (80), where / is the total transferring-in/transferring-out loads determined in previous scheduling. The flexible demands’ number of daily actions are limited in (76)–(77) and (81)–(83). Notably, except for the first intra-day rolling scheduling each day, the time slots we considered in single scheduling are less than a whole day, but we still have to satisfy the daily constraints of the flexible demands.
In each intra-day rolling dispatch, the trade volume of FRPs VPP provided per , denoted as and , are determined in the first hour (4). The other optimal results work as the basic operation points for the next stage.
The connections between each rolling dispatch should also be addressed, as shown in (73), (74), (76), and (80)–(82).
4.3. Real-Time Rolling Dispatch
In this stage, we aim to adjust the output of gas turbines and BESSs based on the basic operation points to meet the operation and trade requirements utilizing the real-time and intra-day forecast data of the photovoltaic power generation. Considering the ramping and the adjustment limits of the gas turbines and the SOC balance of BESS during the day following the time sequence, we adopt the rolling optimal mode with multi-intervals shown in Figure 1. The real-time dispatch is performed four times within an hour sequentially. The time interval here is 15 min, and the maximum period has four time slots.
The objective in (84) is to minimize the adjustment costs, including the adjustment costs of gas turbines and BESS in (85). represents the time interval in this time scale, and K is denoted as the rolling number of the real-time dispatch within an hour. The set includes time slots in the K-th real-time dispatch in each hour of the day.
Constraints (86) and (87) are utilized for calculating the adjustment costs of gas turbines and BESS , respectively. It is worth noting that BESS is not an absolute power generator, although it is tied to the PV units. Considering the limited PV output throughout the day and the SOC balance constraint throughout the day, each adjustment action is essentially a diversion from other time periods and may disrupt the subsequent dispatch plans. Therefore, the authors set the value of much bigger than , as a penalty cost for the whole proper operation of VPP.
The operation constraints of gas turbines is formulated in (88)–(90), while the ESS constraints are in (91)–(93) and (52); notice that , , , , , and are all constant here, as the basic operation plans determined in the previous intra-day stage.
It is noteworthy that we still have to consider the SOC balance of BESS at the last hour of the day as follows:
At the same time, the connections between each real-time dispatch should be modeled. The BESS’s SOC status of the first 15 min in (K-1)-th should be passed to the initial status in K-th, as (95) shows.
5. Solution Methodology
The multi-time-scale rolling optimal dispatch proposed in this paper consists of intra-week rolling scheduling, intra-day rolling dispatch, and real-time dispatch. The intra-week rolling scheduling and intra-day rolling dispatch models include binary variables, with the SOCP relaxations to power flow constraints. Therefore, they are mixed-integer second-order cone programming (MISOCP) problems, which can be solved using commercial solvers, such as GUROBI and CPLEX. The real-time dispatch is a SOCP problem, since all the binary variables are constant in this stage, which can be easily solved by commercial solvers.
The solving procedure for the complete problem is as follows:
- Step 0: Initialization; input data, such as the network, gas turbines, BESSs, HESS, PV units, prices, and the predicted data of the PV generation and loads. Set the iteration counts I = 1, J = 1, K = 1.
- While I < Imax do:
- Step 1.I: Update the PV generation and load predicted data with day-ahead data on the I-th day of the week, then solve the I-th intra-week scheduling problem. Feed the optimal results and of the I-th day to the next step.
- While J < Jmax do:
- Step 2.I.J: Update the PV generation and load predicted data with Intra-day data in the J-th hour of the I-th day, then solve the intra-day dispatch problem. The optimal results of the J-th hour of the I-th day are the basic operation points for the real-time dispatch. Feed them all to the next step.
- While K < Kmax do:
- Step 3.I.J.K: Update the PV generation and load predicted data with real-time data in the K-th of J-th hour of the I-th day. Solve the real-time problem and get the results.
- End
- End
- End
6. Case Studies
The case studies were implemented on Julia 1.8.5 on a 64-bit PC with an Intel i7-7700 CPU, 3.60-GHz, and 16-GB RAM, using GUROBI 9.1.2 as the solver.
6.1. Setup
The proposed approach was tested on a VPP model based on the modified IEEE33 test case, shown in Figure 2. The VPP we considered consists of a HESS, three photovoltaic battery energy storage systems (PV-BESSs), three gas turbines (GTs), interruptible loads (ILs), transferable loads (TLs), and conventional loads.
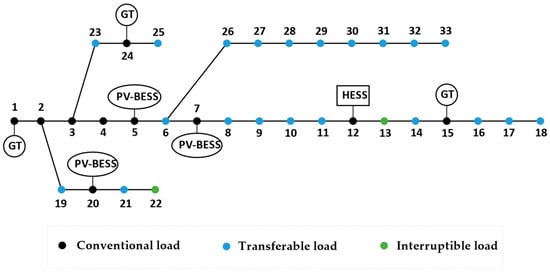
Figure 2.
Diagram of the modified IEEE33-bus system.
The capacity of the HESS was 1.5 MW/9 MW·h, while the maximum value of the charging/discharging power is 0.6 MW. The other parameters of HESS are shown in Table 1. The capacity of the PV unit is 3 MW, which is applied with a 0.6 MW/1.2 MW·h ESS. The minimum and maximum SOC levels of the ESS were 10% and 90%, and its conversion factor was 93.81%. The capacity of the GT was 1.2 MW, and its minimum output was 75 kW, while the ramping limit was 0.3 MW/h. The available ILs and TLs were 20% of the total demands on the buses. The voltage level was set in the range of 0.95 pu and 1.05 pu. Other parameters of security and power exchange constraints are shown in Table 2.

Table 1.
Hydrogen storage system parameters.

Table 2.
Parameters of security and power exchange constraints.
The DA market prices and the upward/downward FRP prices used here are from California ISO (CAISO) from 17–23 May 2022 [17]. These prices are shown in Figure 3 and Figure 4. The PV predicted data is from Elia [18], shown in Figure 5, Figure 6 and Figure 7.
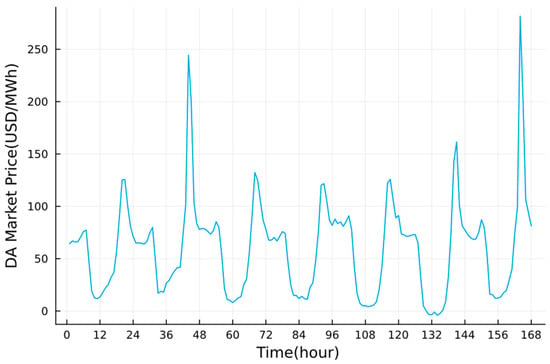
Figure 3.
DA energy market prices in a week.
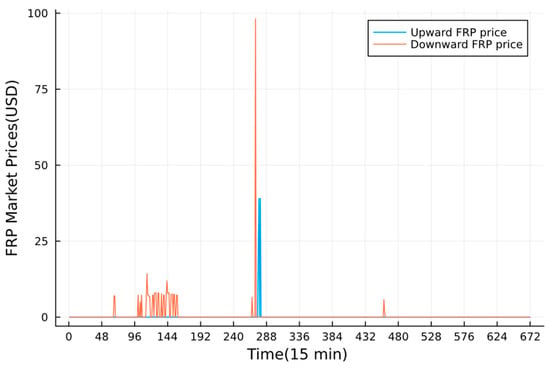
Figure 4.
The upward and downward FRP prices in a week.
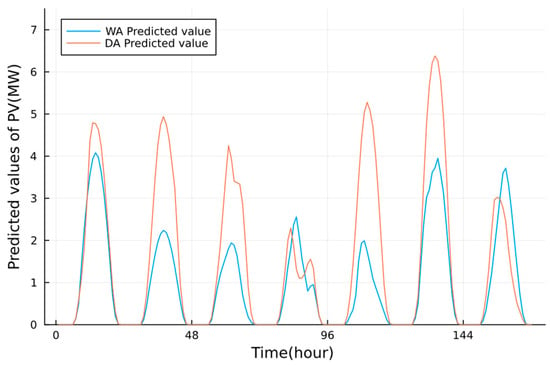
Figure 5.
The predicted values of PV utilized in the intra-week time scale.
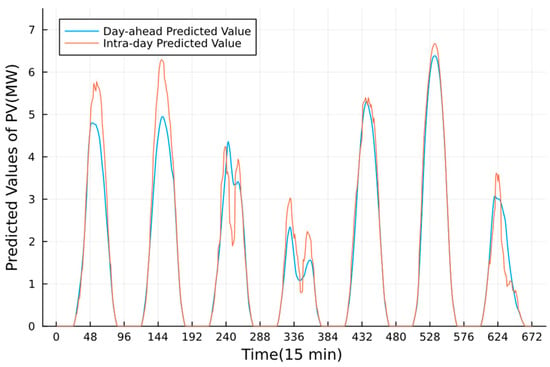
Figure 6.
The predicted values of PV utilized in the intra-day time scale.
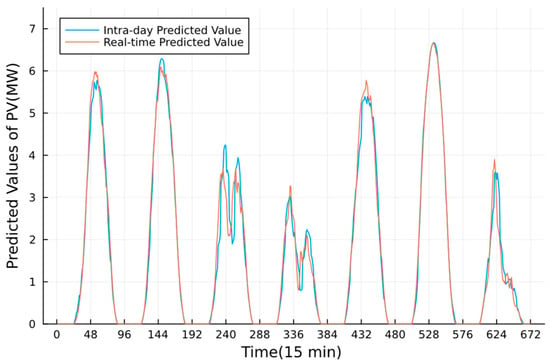
Figure 7.
The predicted values of PV used in the real-time time scale.
6.2. Results Analysis
6.2.1. Intra-Week Rolling Scheduling
The participation of VPP in the DA energy market is made in the intra-week rolling scheduling, as shown in Figure 8. Depending on whether it is positive/negative, participation in DA markets means the volume of electricity sold to/purchased from the market. One can find that VPP both sells and purchases electricity from the market within a day, and the participation volume fluctuates regularly throughout the week. Compared with the DA prices shown in Figure 4, we see that when the market price is at the highest level (e.g., t = 21, 44, 68, 93, 117, 141, 164), VPP tends to sell the most at the time slot, compared with the rest time of a day.
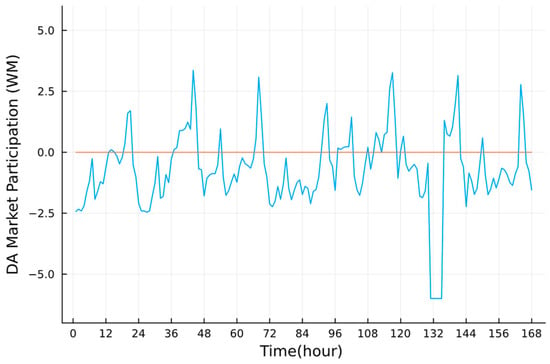
Figure 8.
Participation of VPP in the DA market.
The optimal initial SOC status of HESS in each day determined in this stage is shown in Figure 9, while the week-ahead and day-ahead predicted values of PV are shown in Figure 5. The HESS completes the charging–discharging circles within a week, which enables the VPP to consider the PV generation fluctuation in a longer time scale. Moreover, because we only update the first day’s data with DA predicted values in each rolling, the HESS’s rough trend is more related to the week-ahead values. For example, we can see that the week-ahead PV generation is at a low level from day 2 to day 5. At the same time, the SOC status of HESS has a decreasing trend, which means that HESS has a trend of discharging to cope with the problem in this period. Furthermore, when the week-ahead PV generation is at a high level, like on day 1 and day 6, the HESS has a complementary trend of charging. Therefore, the long-term fluctuation in PV can be addressed within a week.
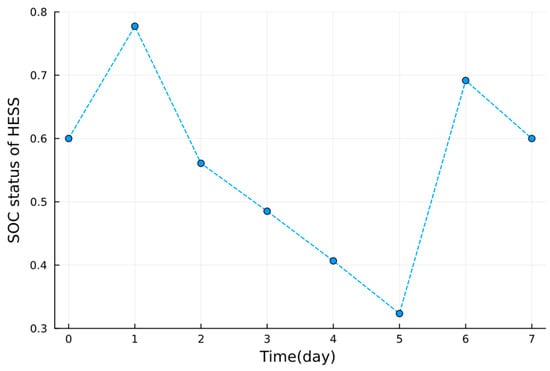
Figure 9.
The initial SOC status of HESS during work.
6.2.2. Intra-Day Rolling Dispatch
The power participation in the FRP market is made in this stage, as shown in Figure 10. The predicted values of PV used in the intra-day time scale are shown in Figure 6. The revenue in the FRP market is shown in Table 3. Compared with Figure 4, we can find that the VPP does not trade in the FRP market most of the time unless the bulk grid gives the price signal. It is observed that the VPP provided more downward FRPs rather than upward FRP, according to the ISO’s signals. Take day 2 as an example. The participation proportion of different downward FRP providers inside the VPP is shown in Figure 11. One can find that most FRPs are provided by BESSs according to their fast adjustment characteristics and greater capacity, compared with TLs for their limited capacity and dispatch numbers.
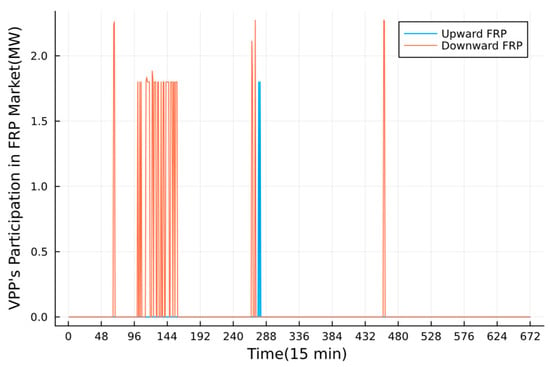
Figure 10.
VPP’s participation in the FRP market.

Table 3.
The revenues in the FRP market in a week.
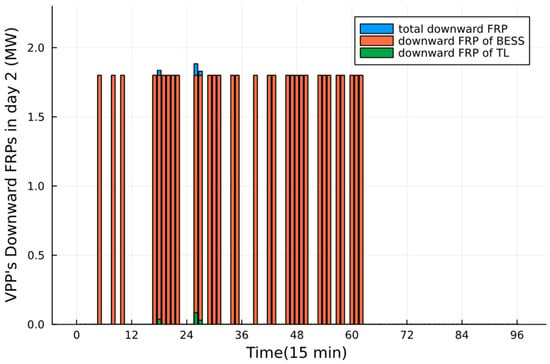
Figure 11.
VPP’s downward FRPs in day 2.
6.2.3. Real-Time Rolling Dispatch
In this stage, the VPP adjusts the output of GTs and BESSs based on the basic operating points determined in the intra-day stage to cope with the predicted errors of PV while containing the security operation. Figure 12, Figure 13 and Figure 14 shows the adjustment of GTs and BESS, respectively. The predicted values of PV used in the real-time time scale are shown in Figure 7. One can find that the VPP tends to adjust the output of GTs rather than BESS, because of the penalty cost of BESS, due to it not being a real generator. Compared with Figure 7, we can tell that BESSs tend to follow the intra-day plans unless the short-term predicted deviation of PV fluctuates obviously and cannot be handled only by the GTs, like on day 3.
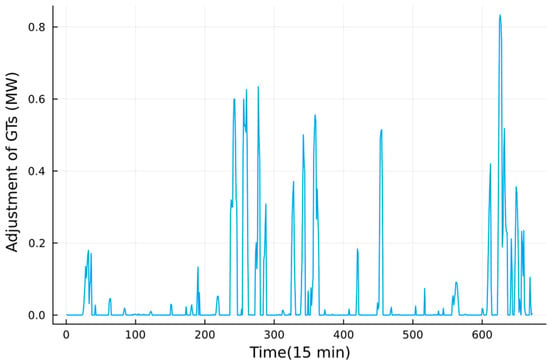
Figure 12.
The output adjustment of GTs in a week.
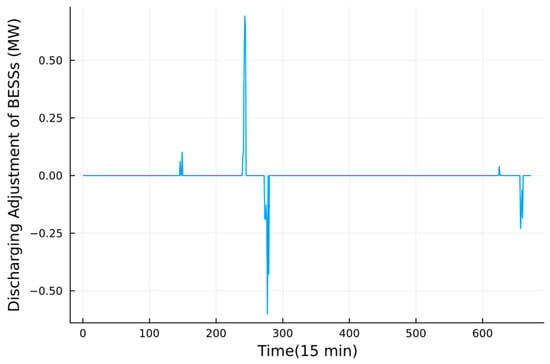
Figure 13.
The discharging adjustment of BESS in a week.
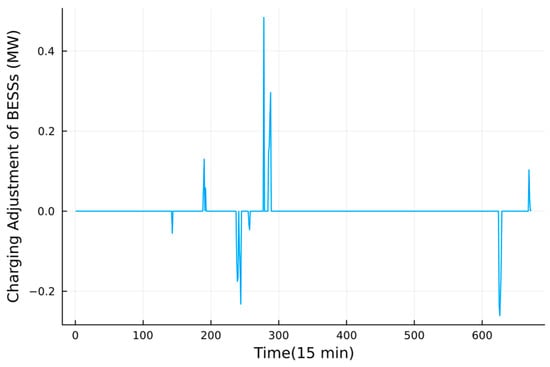
Figure 14.
The charging adjustment of BESS in a week.
Take day 3 as an example. The adjustment of GTs is shown in Figure 15, while the SOC levels of BESSs are shown in Figure 16. In Figure 7, we can see that there are 2 peaks of PV output on day 3 where the noticeable short-term predicted deviation could not be ignored. When time slot t is at periods 45–54, the first peak comes where the real-time PV output mainly decreases compared with the intra-day one. Figure 15 and Figure 16 show that the VPP decides to increase the output of GTs and tends to make BESSs discharge more or charge less in the first peak to cope with the output vacancy while maintaining the security operation. Similarly, when the second PV deviation peak comes (t at periods 63–70), the VPP makes the GTs increase output, while BESSs basically follow the intra-day dispatch plans since the second deviation peak is less severe and could be handled by GTs themselves. When t is at periods 80-96, the PV output deviation is little, but the SOC levels in Figure 16 are way off the intended plans to maintain the SOC balance, since some storage capabilities were previously used in the first PV peak. In that case, VPP adjusts the GTs’ output to cope with the vacancy of BESSs while maintaining security operations. Therefore, the VPP can handle the predicted PV deviation by adjusting GTs and BESSs in the real-time stage of the multi-time-scale rolling framework while ensuring the cyclic regulatory ability of BESS and the security operation.
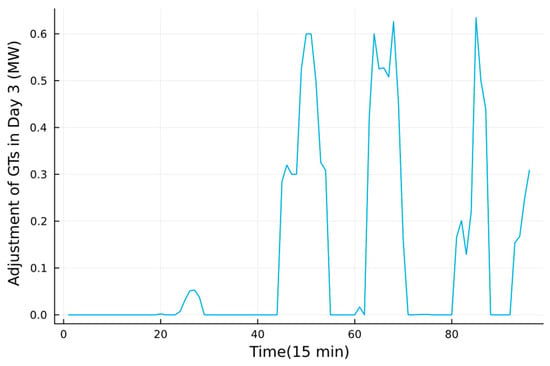
Figure 15.
The output adjustment of GTs in day 3.
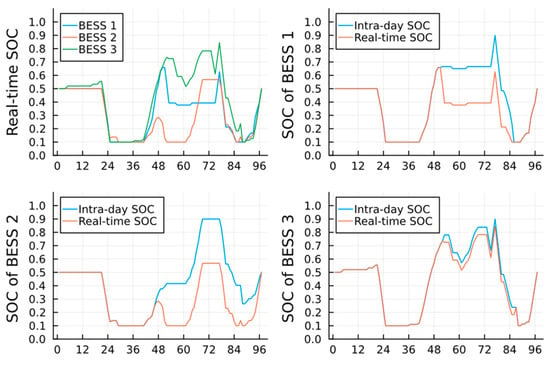
Figure 16.
The SOC status of BESSs in day3.
6.3. VPP‘s Economic Analysis
In this subsection, we further analyze the VPP’s economic benefits in the proposed method, which is regarded as Case 0, by comparing it with other cases. Case 1 is the same as Case 0, except that it replaces the intra-week rolling scheduling in Case 0 with regular day-ahead scheduling. Based on Case 0, Case 2 only participates in the DA energy market. The revenues and costs of VPP in three cases are listed in Table 4. We can see that Case 0 performs the best among the three cases, with a net profit of USD 17,186.426.

Table 4.
The revenues and costs of VPP in three cases.
One can find that not participating in the FRP market deprives VPP of the FRP revenue and further reduces its net profit in Case 1, compared with Case 0.
At the same time, since the intra-week rolling scheduling is the substitute for regular day-ahead scheduling in the proposed method (Case 0), we compare the revenues of VPP in the DA energy market under Case 0 and Case 1. The total DA market revenue for the whole week in Case 0 is −480.044 USD, while that for Case 1 is −500.501 USD, and the negative signal means that the VPP buys electricity from the market. The specific participation in the market differs, as shown in Figure 17. Additionally, one can find that each revenue of the VPP is higher in Case 0 than in Case 1, while each cost is lower. Case 0 considers the long-term PV fluctuation in a week in the intra-week rolling scheduling. In that case, the VPP not only performs better with the revenue in the DA energy market determined in the intra-week rolling scheduling but also in the rest time scales because of the better utilization of PV generation in a week with the HESS, the long-term energy storage system.
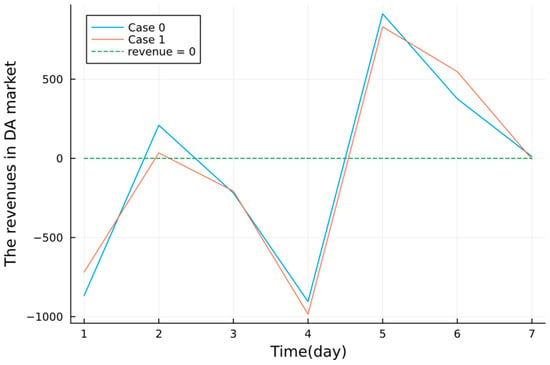
Figure 17.
The revenues in the DA energy market under Case 0 and Case 1.
6.4. Effects on the Consideration of Power Flow
In order to analyze the effects on the consideration of power flow, we first replaced the power flow constraints (32)–(42) in Case 0 with the power balance equation below, regarded as Case 3.
However, the results show that Case 3 has no feasible solutions in both intra-day rolling scheduling and real-time rolling dispatch stages.
Therefore, based on Case 3, Case 4 further considers the PV curtailment while considering the cost of PV curtailment. We modify the power balance Equations (95) to (97). Additionally, is the curtailed PV power of the PV unit i at time slot t.
It turns out that Case 4 has optimal solutions in a whole week within the multi-time-scale framework considering the PV curtailment.
Based on these, we compare Case 0, Case 3, and Case 4. Case 0 considers the power flow constraints in which network loss is implicit. When Case 3 replaced the power flow constraints with the power balance equation, the network loss term disappeared in (96)–(97), which led to the power imbalance and the infeasible solutions. Meanwhile, since the PV curtailment is considered in Case 4, the PV curtailment term can help offset the disappeared network loss term in (98). Therefore, Case 4 has optimal solutions.
The revenues and costs of Case 4 are listed in Table 5, where is the total cost of PV curtailment of VPP. Additionally, the PV curtailment cost is five times the price of the DA energy market.

Table 5.
The revenues and costs of VPP in Case 4.
One can find that not considering power flow did bring VPP more profit in the DA energy market and reduce the operation cost, compared with the revenues of Case 0 in Table 4. However, the net profit in Case 4 is still less than Case 0, considering the costs of PV curtailment and the increased adjustment costs.
7. Conclusions and Future Work
7.1. Conclusions
This paper introduced a multi-time-scale rolling optimal dispatch framework for the VPP’s optimal self-scheduling plans across intra-week rolling scheduling, intra-day rolling dispatch, and real-time dispatch. Within the multi-time framework, the fluctuations in PV are repeatedly processed with the cooperation of HESS and BESS, which help reduce the uncontrollability of VPP and the risk of violation of security constraints, as well as the burden of real-time adjustments. Meanwhile, the proposed method facilitates participation in both energy and FRP markets, which improves both the revenue of VPP and the efficiency of DERs with fast adjustment characteristics.
The proposed method was tested on a VPP model based on the modified IEEE33 test case. The VPP’s dispatch results and market participation in three time scales were analyzed. The results show that both the long-term and short-term fluctuations could be addressed within the multi-time framework. Moreover, the economics of the VPP were analyzed under different cases, where the proposed method performed the best. It was also found that the flexible redistribution of PV output through HESS on a weekly scale can also help reduce the operation costs of the VPP. Furthermore, the effects of the consideration of power flow were discussed. The results show that considering power flow not only maintained the security operation for the grid, but also reduced the PV curtailment cost of VPP.
7.2. Future Work
There are still some considerations that should be further studied in the future.
- The uncertainties of renewable energy resources and market prices should be considered in future work among the multi-time-scale framework.
- The benefit sharing among members inside the VPP needs to be discussed while considering the optimal bidding strategy of the VPP in the future.
Author Contributions
Conceptualization, X.B. and X.S.; methodology, X.S. and X.B.; software, X.S.; validation, X.S.; formal analysis, X.S.; investigation, Q.S.; resources, Q.S.; data curation, X.S.; writing—original draft preparation, X.S.; writing—review and editing, P.W. and Q.S.; visualization, X.S.; supervision, X.B.; project administration, X.S.; funding acquisition, X.B and P.W. All authors have read and agreed to the published version of the manuscript.
Funding
This research was funded by the National Natural Science Foundation of China (No. 51967001) and the Innovation Project of Guangxi Graduate Education grant number (No. YCSW2023063).
Data Availability Statement
The PV forecasted data used in this study is taken from Elia Open Data Portal (http://oasis.caiso.com/mrioasis/logon.do, accessed on 15 July 2023), and the price data is from California ISO OASIS (https://opendata.elia.be/explore/dataset/ods032/information/, accessed on 15 July 2023).
Conflicts of Interest
The authors declare no conflict of interest.
References
- Nosratabadi, S.M.; Hooshmand, R.A.; Gholipour, E. A comprehensive review on microgrid and virtual power plant concepts employed for distributed energy resources scheduling in power systems. Renew. Sustain. Energy Rev. 2017, 67, 341–363. [Google Scholar] [CrossRef]
- Kardakos, E.; Simoglou, C.; Bakirtzis, A. Optimal offering strategy of a virtual power plant: A stochastic bi-level approach. IEEE Trans. Smart Grid 2017, 7, 794–806. [Google Scholar] [CrossRef]
- Kasaei, M.J.; Gandomkar, M.; Nikoukar, J. Optimal management of renewable energy sources by virtual power plant. Renew. Energy 2017, 114, 1180–1188. [Google Scholar] [CrossRef]
- Yang, D.; He, S.; Wang, M.; Pandžić, H. Bidding Strategy for Virtual Power Plant Considering the Large-Scale Integrations of Electric Vehicles. IEEE Trans. Ind. Appl. 2020, 56, 5890–5900. [Google Scholar] [CrossRef]
- Heydarian-Forushani, E.; Ben Elghali, S.; Zerrougui, M.; La Scala, M.; Mestre, P. An Auction-Based Local Market Clearing for Energy Management in a Virtual Power Plant. IEEE Trans. Ind. Appl. 2022, 58, 5724–5733. [Google Scholar] [CrossRef]
- Wang, H.; Riaz, S.; Mancarella, P. Integrated techno-economic modeling, flexibility analysis, and business case assessment of an urban virtual power plant with multi-market co-optimization. Appl. Energy 2020, 259, 114142.1–114142.17. [Google Scholar] [CrossRef]
- California ISO (CAISO). Available online: https://www.caiso.com/Pages/default.aspx (accessed on 15 July 2023).
- Midcontinent ISO (MISO). Available online: https://www.misoenergy.org (accessed on 15 July 2023).
- Wang, B.; Hobbs, B.F. Real-time markets for flexiramp: A stochastic unit commitment-based analysis. IEEE Trans. Power Syst. 2016, 31, 846–860. [Google Scholar] [CrossRef]
- Wang, Q.; Hodge, B.-M. Enhancing power system operational flexibility with flexible ramping products: A Review. IEEE Trans. Ind. Inform. 2017, 13, 1652–1664. [Google Scholar] [CrossRef]
- Hu, J.; Sarker, M.R.; Wang, J.; Wen, F.; Liu, W. Provision of flexible ramping product by battery energy storage in day-ahead energy and reserve markets. IET Gener. Transm. Distrib. 2018, 12, 2256–2264. [Google Scholar] [CrossRef]
- Zhao, Y. Real-Time Dispatch of Flexible Ramping Products for Energy Storage and Demand Response. In Proceedings of the 2019 IEEE Innovative Smart Grid Technologies—Asia (ISGT Asia), Chengdu, China, 21–24 May 2019. [Google Scholar]
- Li, X.; Wang, L.; Yan, N.; Ma, R. Cooperative Dispatch of Distributed Energy Storage in Distribution Network With PV Generation Systems. IEEE Trans. Appl. Supercond. 2021, 31, 0604304. [Google Scholar] [CrossRef]
- Whittingham, M.S. History, Evolution, and Future Status of Energy Storage. Proc. IEEE Inst. Electr. Electron. Eng. 2012, 100, 1518–1534. [Google Scholar] [CrossRef]
- Abomazid, A.M.; El-Taweel, N.A.; Farag, E.Z. Optimal Energy Management of Hydrogen Energy Facility Using Integrated Battery Energy Storage and Solar Photovoltaic Systems. IEEE Trans. Sustain. Energy 2022, 13, 1457–1468. [Google Scholar] [CrossRef]
- Pan, J.; Lei, J.; Chen, A.; Cao, Y.; Zhao, Z.; Zhang, H. Optimal Proportion of Wind, PV, Hydrogen and Storage Capacity Based on Time Sequence Simulation. In Proceedings of the 2022 5th International Conference on Power and Energy Applications (ICPEA), Guangzhou, China, 18–20 November 2022. [Google Scholar]
- California ISO OASIS. Available online: http://oasis.caiso.com/mrioasis/logon.do (accessed on 15 September 2023).
- Elia Open Data Portal. Available online: https://opendata.elia.be/explore/dataset/ods032/information/ (accessed on 15 September 2023).
Disclaimer/Publisher’s Note: The statements, opinions and data contained in all publications are solely those of the individual author(s) and contributor(s) and not of MDPI and/or the editor(s). MDPI and/or the editor(s) disclaim responsibility for any injury to people or property resulting from any ideas, methods, instructions or products referred to in the content. |
© 2023 by the authors. Licensee MDPI, Basel, Switzerland. This article is an open access article distributed under the terms and conditions of the Creative Commons Attribution (CC BY) license (https://creativecommons.org/licenses/by/4.0/).