Article

Pilot-Scale Anaerobic Co-Digestion of Wastewater Sludge with Lignocellulosic Waste: A Study of Performance and Limits

Direction d’Innovation, Service Public de L’assainissement Francilien (SIAAP), 82 Avenue Kléber, 92700 Colombes, France
*
Author to whom correspondence should be addressed.
These authors contributed equally to this work.
Energies 2023, 16(18), 6595; https://doi.org/10.3390/en16186595
Submission received: 21 July 2023 / Revised: 7 September 2023 / Accepted: 8 September 2023 / Published: 13 September 2023
(This article belongs to the Section L: Energy Sources)

Abstract

:
The effects of co-digesting sewage sludge (SS) and horse waste (HW), the composition of HW, and the ratio of HW:SS were studied using two semi-continuous digesters of 9.5 L of working volume. These digesters were operated in parallel with the mono-digestion of SS in digester 1 (D1) and the co-digestion of SS and HW in digester 2 (D2). In digester 2, there were two phases of digestion (durations of 40 and 43 weeks, respectively). The composition of HW in the first phase was 85% wheat straw (WS), 14% wood chips (WC), and 1% horse manure (HM), with 99% wheat straw (WS) and 1% horse manure (HM) in the second phase. Variable ratios of HW:SS were studied in the digesters. The co-digestion of sewage sludge (SS) and horse waste (HW) produced more biogas than the mono-digestion of SS alone, with a maximum of 15.8 L·d−1, compared to 9 L·d−1 at the end of the experiment. When comparing the results obtained in both phases, the production of methane in phase 2 was 18 NmL·gVS−1 higher than in phase 1. This slight increase in methane yield could be linked to the absence of wood chips (WC), which is considered to have a diluting effect on methane production. Therefore, this study shows that an organic loading rate (OLR) of 4.8 kgVS·m−3·d−1, a ratio of HW:SS of 3, and a composition of HW (99% WS, 1% HM) should be respected in the actual experimental conditions for a well-functioning anaerobic digestion.

1. Introduction

The utilization of conventional energy sources raises concerns due to a worldwide growing demand, coupled with scarcity issues, and detrimental environmental impacts [1]. Consequently, many countries have set national renewable energy targets, aiming to reduce their dependency on fossil fuels and nuclear power [2]. In August 2015, the French Energy Transition Law was established with the objective of a 50% decrease in electricity production from nuclear power by 2025. Furthermore, by 2030, greenhouse gas emissions and consumption of fossil fuels should be reduced by 40% and 30%, respectively, alongside an increase in renewable energy use of at least 32%. Eventually, renewable energy needs to contribute to 40% of electricity production, 38% of final heat consumption, 15% of final fuel consumption, and 10% of gas consumption. Methane production through the anaerobic digestion (AD) of biomass is considered to be one of the main pathways to help reduce dependence on conventional energy sources. In 2015, biogas production, through this means, in the European Union represented half of the global biogas production, with 18 billion cubic meters of methane [3]. AD is a widely applied process where organic wastes decompose to produce energy while enabling the recovery of fibers and nutrients for soil amendments. AD occurs when communities of competent microorganisms hydrolyze organic material into sugars, amino acids, and fatty acids under oxygen-free conditions. The various hydrolytic products undergo fermentation and methanogenesis. The final product of anaerobic digestion is biogas, mainly consisting of methane (60%) and carbon dioxide (40%) [4]. Several organic residues can be suitable for biogas production, such as agricultural waste and sludge from sewage treatment plants. However, the methane potential performance of these materials relies on their biophysical and chemical properties, structure (particle size, heterogeneity, and water retention capacity), presence of inert materials, and anaerobic biodegradability [5]. For example, agricultural waste is mainly composed of lignocellulosic materials (i.e., cellulose, hemicellulose, and lignin), which cannot be digested by themselves, owing to their crystalline structure and high lignin content. This inherent property reduces their overall biodegradability by causing hydrolysis to become the rate-limiting step [5]. Thus, the AD of wastewater treatment sludge remains prominent in Europe. This is due to its local energy production role alongside waste treatment solutions. In addition, the residual material in the digestion can be used as a biofertilizer [6]. However, in the 2030 horizon in the top five EU countries, key feedstocks projected for biogas production are manure (33%), agricultural residues (25%), and sequential cropping (21%), with the highest potential to produce methane from AD (France, Germany, Italy, Poland, and Spain-Biomethane production potential in the EU by Guidehouse, 2022). Indeed, an innovative way to enhance agricultural waste energy recovery is to integrate it into the AD of sludge. Then, the lignocellulosic substrate can be digested alongside sludge in two different configurations: a liquid state AD operated at a total solids content of 15% or less, or a solid state AD, generally operated at 15% or higher [7]. Industrial wastewater will contribute to over 10% of the biomethane potential in the EU by both 2030 and 2050 (Biomethane Production Potential in the EU by Guidehouse, 2022). Consequently, there is an increasing interest in the addition of agricultural waste as a digestion co-substrate in Wastewater Treatment Plants (WWTP). Co-digestion offers the advantage of processing multiple streams within a single facility, and combining wastes with high microbial content, such as sludge, with a lignocellulosic substrate, to provide a continuous supply of inoculum. This infusion of inoculum can boost the diversity and abundance of useful microorganisms [8]. Enhanced management of agricultural waste and the adoption of integrated solutions have the potential to reduce environmental impacts through the implementation of methods that facilitate the recovery of both energy and nutrients. As a result of these approaches, horse manure has naturally been considered a viable substrate for AD due to its qualities. However, related studies remain scarce because they are usually recovered when mixed with wood chips and/or straw, owing to their use as bedding materials, which exhibit poor digestion performance. The present work is part of a three-year study conducted to assess the possibility of combining agricultural waste produced from a horse stable in the commune of Maisons-Laffitte (France) with sewage sludge sourced from the WWTP of the neighboring municipality of Achères. This WWTP is managed by the SIAAP, the syndicate responsible for the sanitation of wastewater in the Greater Paris area. Maisons-Laffitte and SIAAP signed a partnership in 2017, supported by the “Valoéquiboue” project, belonging to the MOCOPEE (French acronym for Modeling, Control, and Optimization of Water Treatment Processes) research program created by the research and development department of SIAAP. Valoéquiboue provides the scientific and technical background to achieve the objective of the joint initiative between SIAAP and a city renowned for its racehorse training centers. This study yielded three deliverables. The first pertains to agricultural waste characterization at a laboratory scale, which includes evaluating the biological and physicochemical properties, structure, and presence of the inert materials, and the anaerobic biodegradability of the agricultural waste in horse stables. The second deliverable focuses on the feasibility of studying a liquid state AD of urban WWTP sludge combined with agricultural waste in a continuous mixed flow pilot scale, which constitutes the present study. The last deliverable is a feasibility study of solid-state AD in agricultural waste using digested urban WWTP sludge as the inoculum. Of note, the first deliverable has already been published [9].

2. Materials and Methods
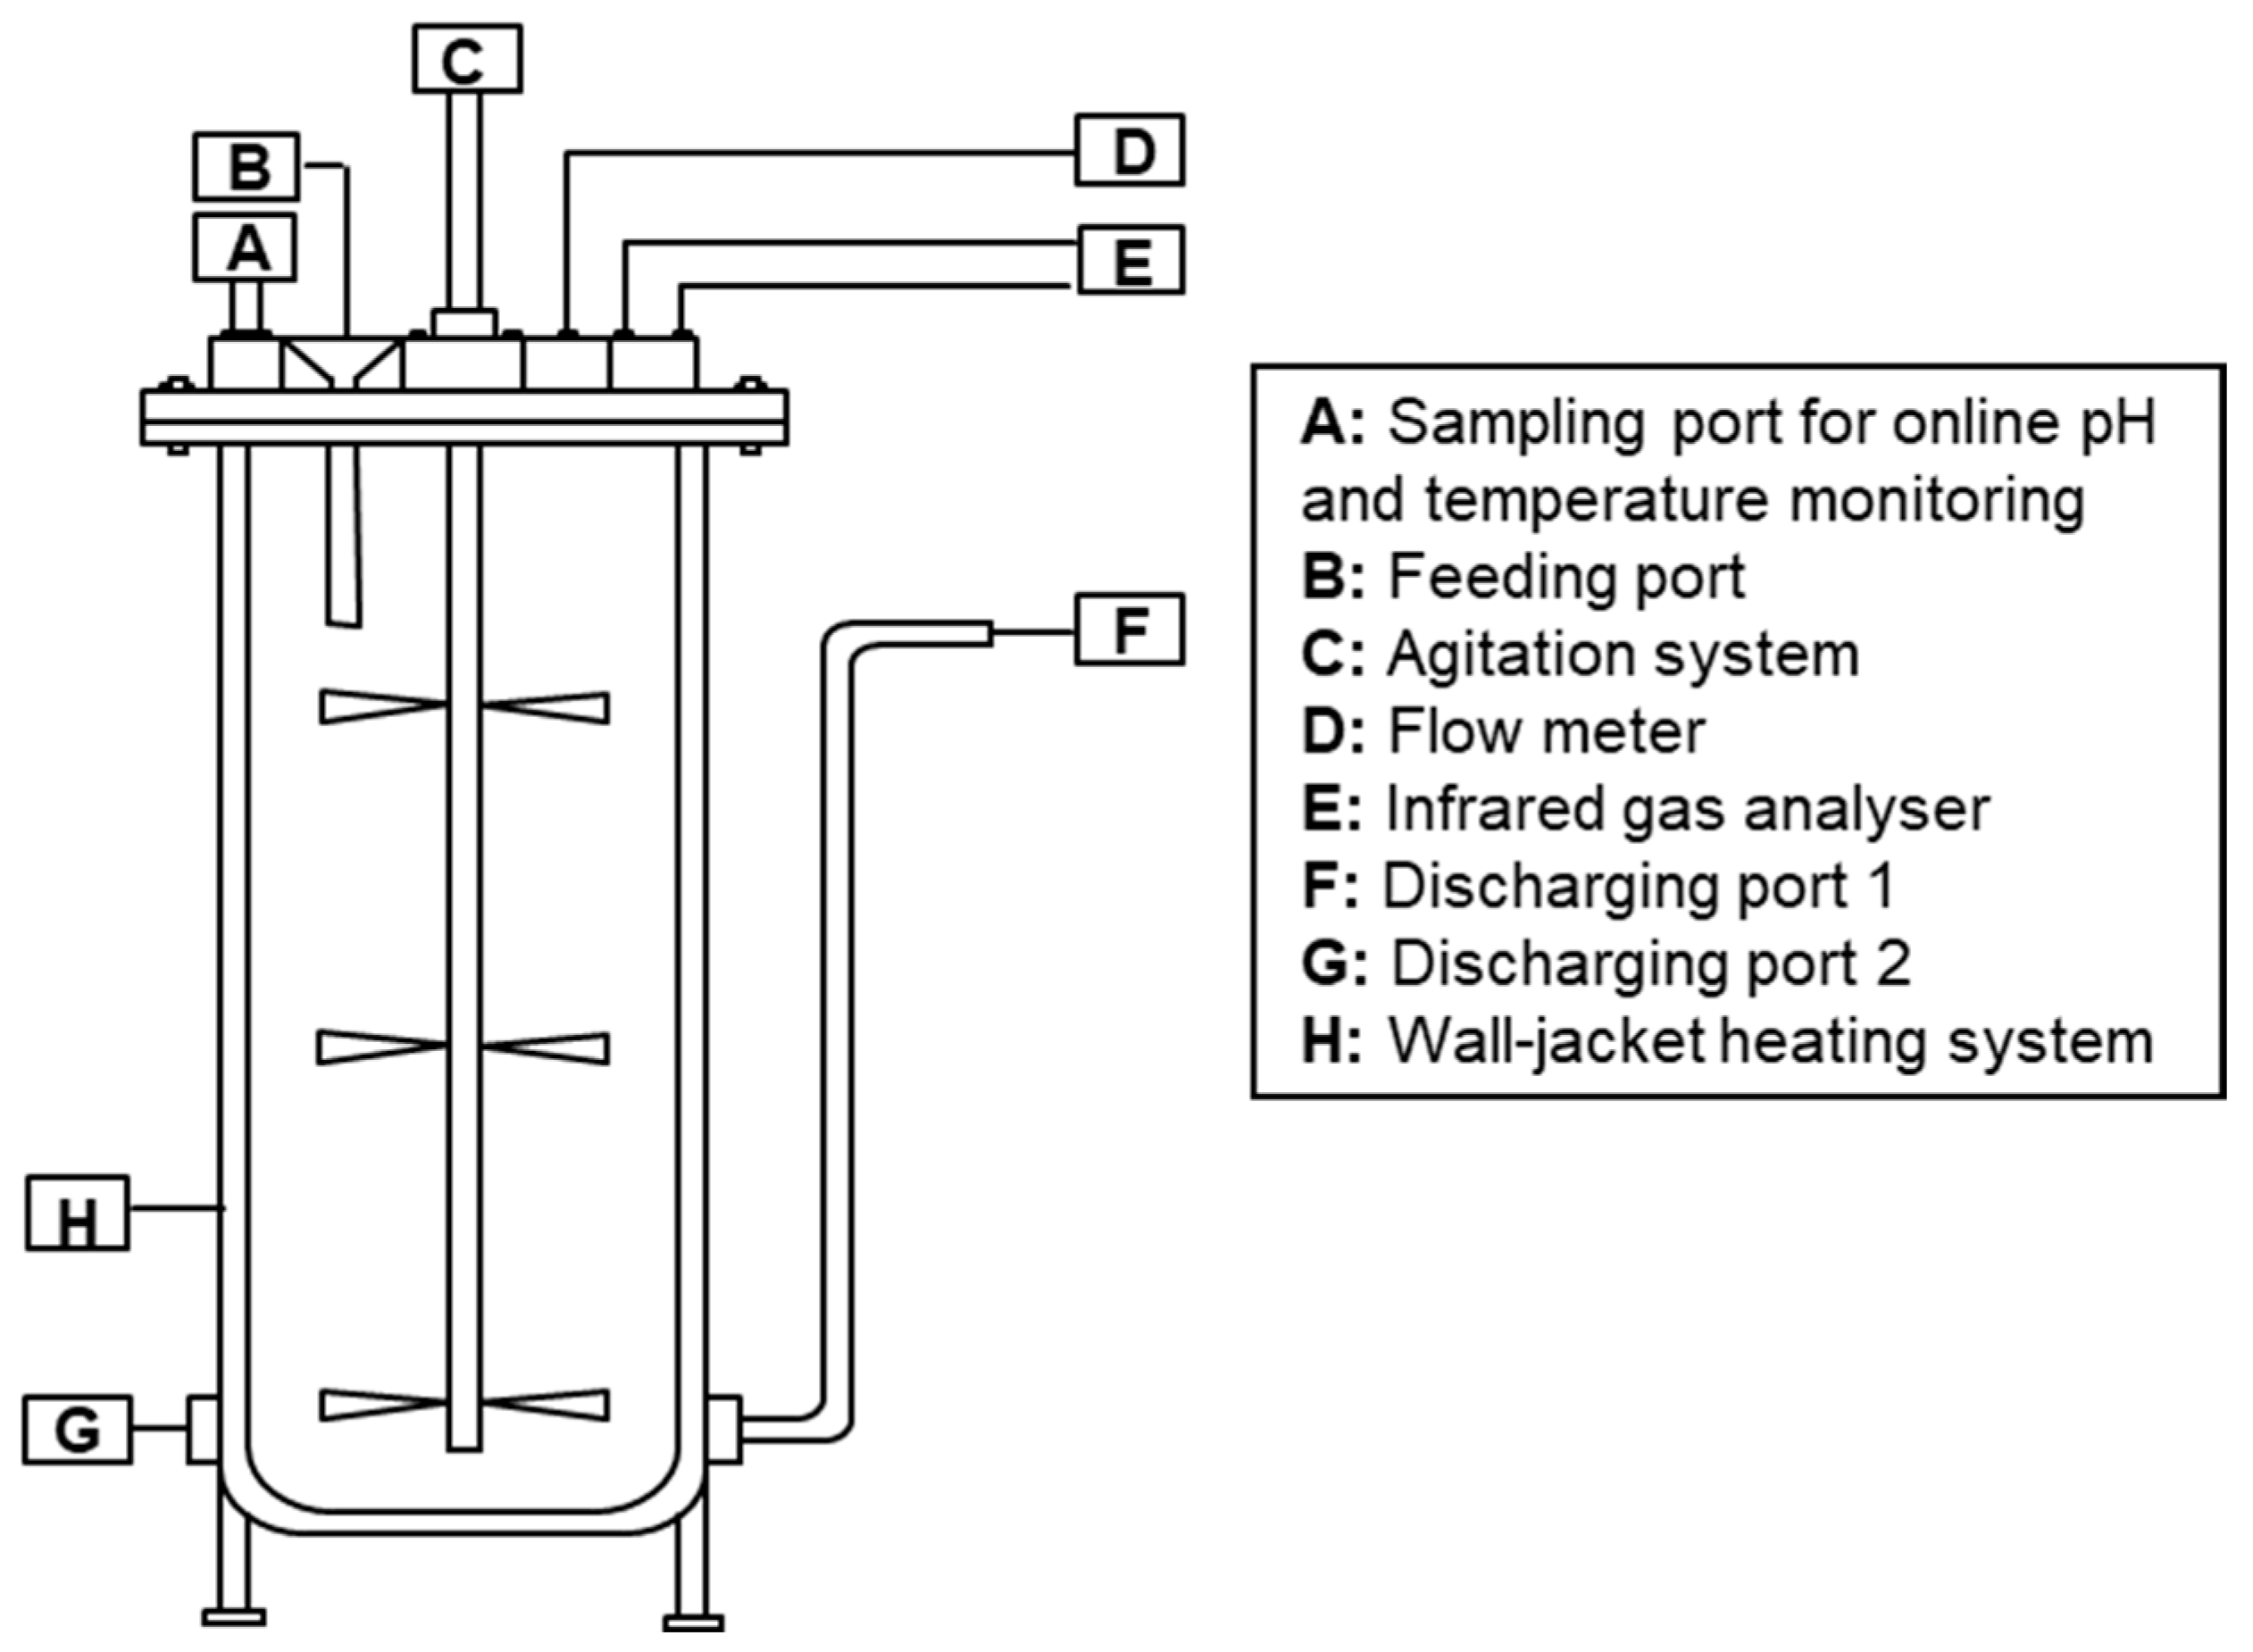
2.1. Digesters

Two stainless steel double-walled 10 L digesters (CSTR-10S, Bioprocess Control, Lund, Sweden), referred to as digesters 1 and 2 (D1 and D2, respectively), were operated under stable mesophilic conditions (37 °C ± 1). The digesters were heated using thermostatically regulated water circulation and mechanically stirred using internal propellers. Biogas flow was measured every 30 min using a flow meter (BPC® µFlow: standalone gas flow meter, Bioprocess Control, Lund, Sweden). The quality of the biogas was measured every 2 h from a dedicated port opening using a dual-wavelength infrared analyzer (SWG 100 Biogas Compact Analyzer, Gruter & Marchand, Nanterre, France). Temperature and pH were monitored continuously using built-in probes connected to the system. The digester is presented in Figure 1.
D1 and D2 were initially seeded with an inoculum taken from a full-scale mesophilic anaerobic digester used to process municipal sludge at 37 °C. Both digesters were initiated under similar conditions of constant organic loading rate (OLR) of sewage sludge (SS) of 1.2 kgVS·m−3·d−1 until week 10 of the experimental campaigns, after which, co-digestion was initiated in D2 only. The digestate in each unit was removed twice per week and subsequently replaced with an equal amount of feed to maintain a constant working volume.

2.2. Analytical Testing

The digesters were sampled twice weekly, analyzing total solids (TS) content, volatile solids (VS) content, volatile fatty acids (VFA), and total alkalinity (TA). TS was obtained by heating the samples at 105 °C for two days following the NFISO 11465 standard [10]. VS of the sample was obtained by calcining the samples at 550 °C for 2 h following the NF U44-160 standard [11]. The TA was measured following the NF EN ISO 9963-1 standards [12]. VFAs associated with AD, such as acetate, propionate, and butyrate, were analyzed by ion exclusion chromatography coupled with conductivity detection.
This method involves segmenting a mixture of VFAs into fractions of individual acids based on their electric charges. Therefore, it separates the fully and weakly ionized ions. Following the separation process, the quantification of each acid was determined by its specific conductivity signals, enabling the determination of its concentration within the sample [13,14].
It is important to highlight that the monitoring of VFA, TA, and pH serves as an indirect method for identifying indicators of microbial dysfunction, which are influenced by these specific factors.

2.3. Substrates

Liquid state AD operates at 15% TS or lower [7]. As feedstock, mixes of solid horse manure and bedding were combined with liquid sewage sludge, displaying a TS value of 3.5%, i.e., the lower end of the ranges described in the literature [15]. The agriculture biomass used in this study was obtained from a horse stable in France (Eq’invest, Maisons-Laffitte, France). Two types of bedding were selected: (1) a mixture of wheat straw (WS) and wood chips (WC) containing horse manure (HM), which had a volumetric composition of 85%, 14%, and 1%, respectively; (2) a mixture of WS and HM with a volumetric composition of 99%, and 1%, respectively. The horse stall bed was cleaned daily, and the mixture of waste was stored in a container for a week. Samples were collected on the surface to acquire fresh material and prepared using a quartering method to ensure sampling homogeneity. This technique involves dividing the samples into four equal mounds, of which, two diagonally opposite are discarded, while the remaining two are recombined to constitute a smaller sample. These steps were repeated until the desired sample size was obtained. The samples were collected over the course of a year to compensate for internal and seasonal changes. Prior to testing, each sample was homogenized and dried at 60 °C for 48 h, to achieve proper workability. All the material was passed through a 4 mm sieve shredder as a pre-step to break down the fibrous content of the material. This also increases the specific surface area and enhances the accessibility for the bacteria responsible for degradation [16,17]. Finally, the SS was obtained weekly from a municipal WWTP (SIAAP, Achère, France), treating 1,560,000 m3·d−1 of wastewater. Samples were collected from the mixed SS batch of the WWTP, yielding a mixture of various sludges coming from the primary sedimentation tank, coagulation and flocculation chambers, and biological reactors.

2.4. Experimental Procedure

The configuration and operating conditions of AD were closely linked to the substrate characteristics (VS, TS, and lignin content) and operating factors, such as organic loading rate (OLR), and hydraulic retention time (HRT). OLR was expressed as the amount of VS (kg) loaded into the digester per day, although not all added VS was bioavailable in the AD process [5]. HRT was the average time that the microorganisms had to degrade the substrate in the AD reactor expressed per day [18]. Digestion efficiency is defined by the balance between OLR and HRT, depending on the reactor volume [19]. Digester1 (D1) was loaded with the SS mono-substrate and used as a control. As such, D1 was operated at a constant loading rate of 1.2 kgVS·m−3·d−1 throughout the entire experiment. Variable OLRs were implemented in digester 2 (D2), which was continuously fed with a mixture of SS, horse manure, and bedding. While SS OLR was kept constant with 1.2 kgVS·m−3·d−1, the horse waste co-substrate loading was increased gradually until reaching the limit of the liquid state AD (15% TS). The experiment was divided into two phases, with each phase including a different type of horse bedding.

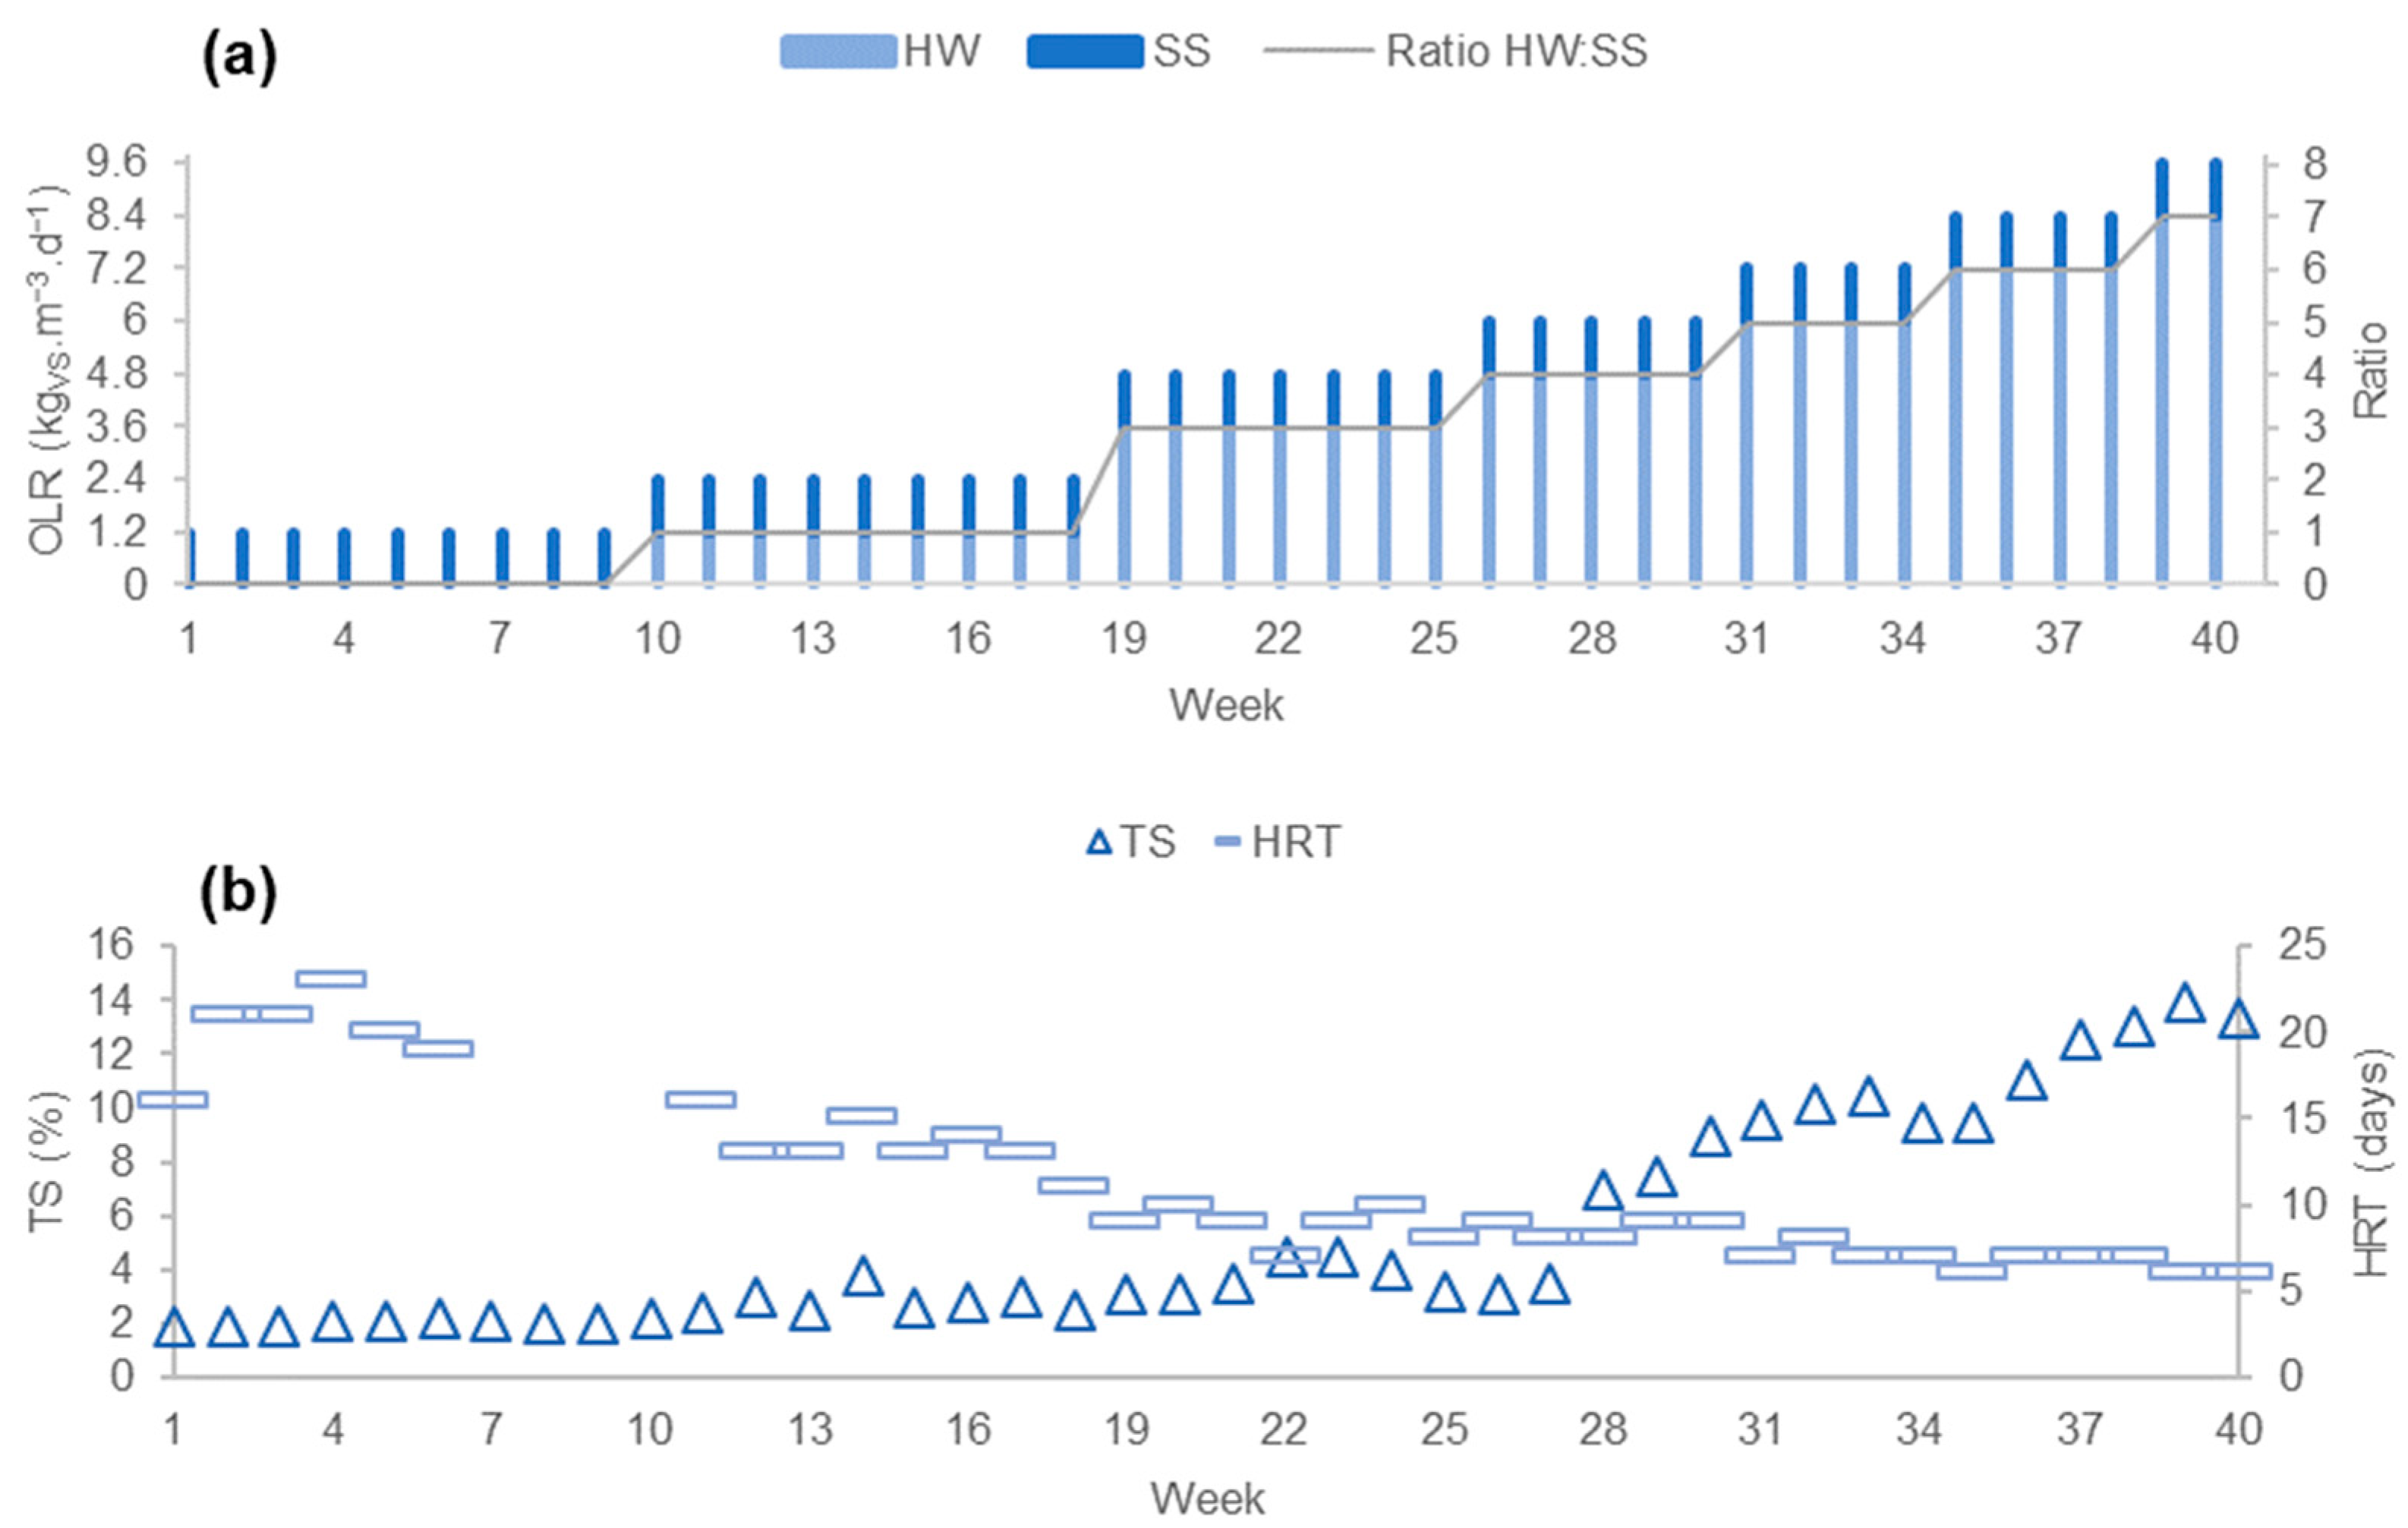
2.4.1. Phase 1: Bedding Mixture with WS and WC

Phase 1 of the experiment was carried out as a long-term study of over 40 weeks. The horse waste used contained straw and wood in the aforementioned volumetric proportions of 85% WS, 14% WC, and 1% HM.
The operational scheme of the test digester D2 is plotted in Figure 2a. While initially both D1 and D2 were subjected to the same OLR, by week 10, the co-digestion started in D2. The OLR of D2 gradually increased until the limit of the liquid state AD was reached (15% TS Figure 2b). The mix ratio of horse waste and sewage sludge (HW:SS) increased from 1:1 to 3:1, 4:1, 5:1, 6:1, and finally, 7:1 based on VS. Each ratio was sustained for 3 HRT (corresponding HRT values are shown in Figure 2b) to ensure stabilization after each intermittent increase in loading. Evidently, higher OLRs result in shorter HRTs [18].

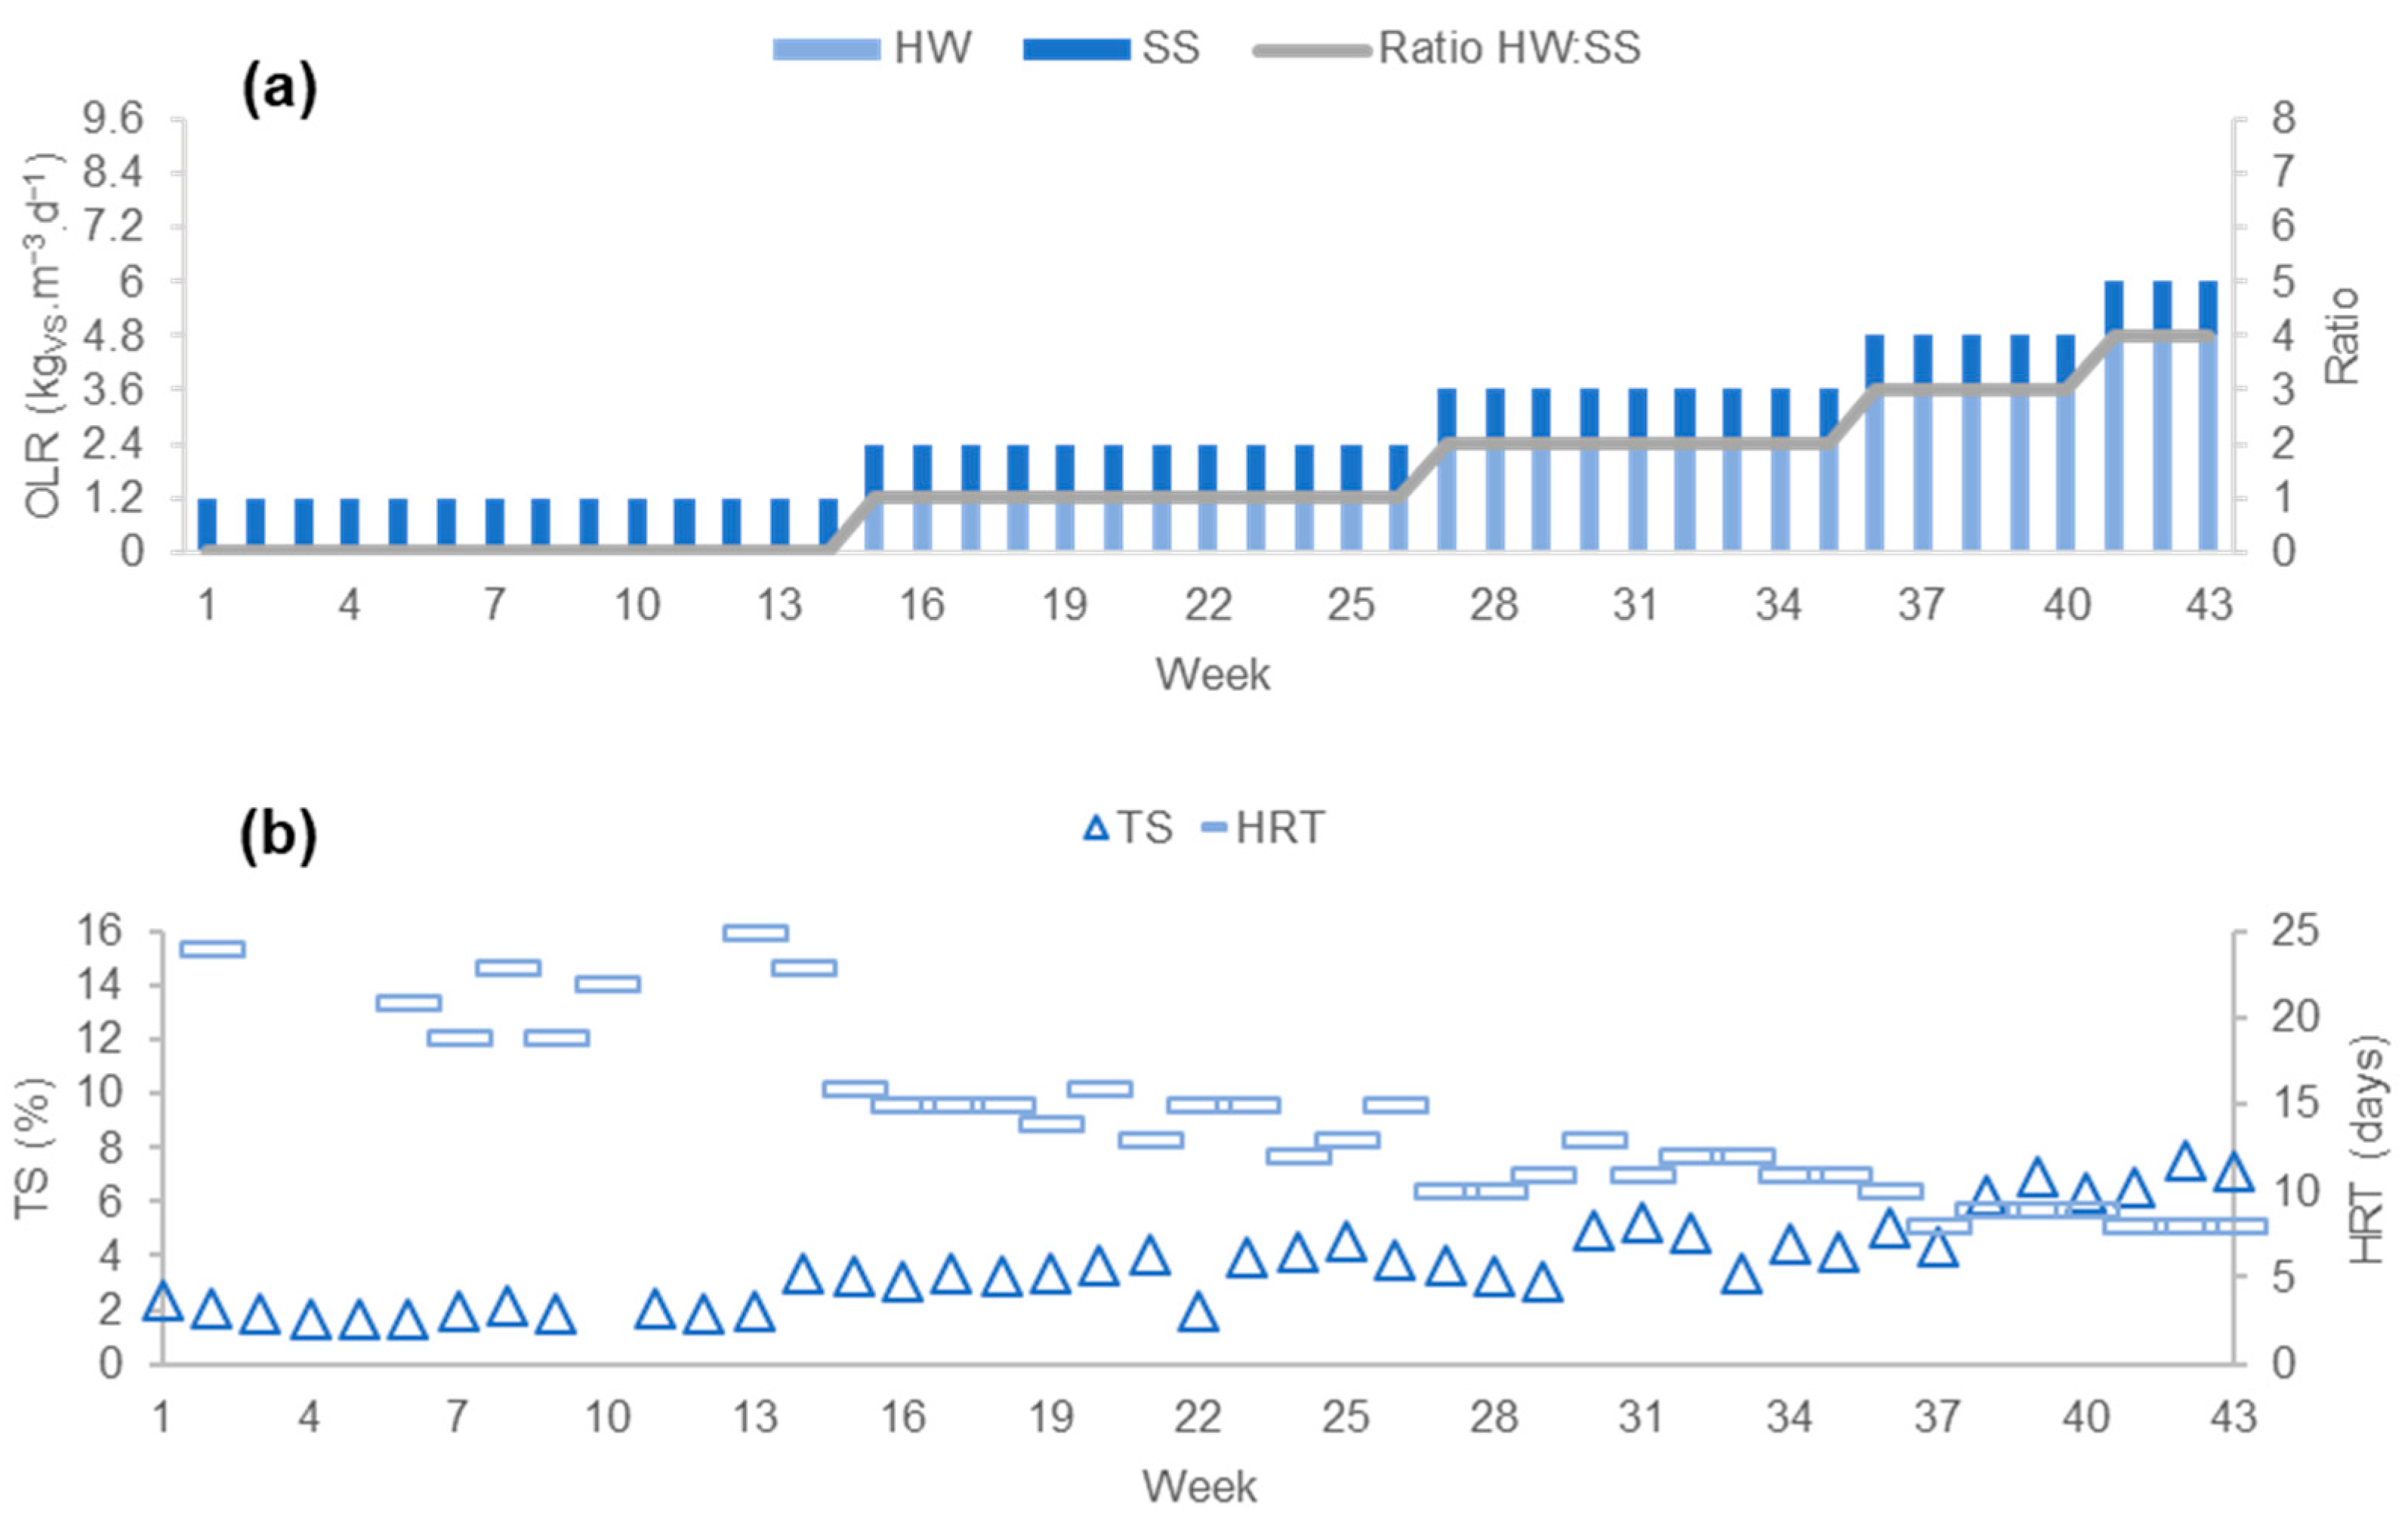
2.4.2. Phase 2: Bedding Mixture with WS

Phase 2 of the experiment lasted for 43 weeks. During this phase, the bedding material used with horse manure was composed of wheat straw only for a final volumetric composition of 99% WS and 1% HM. Again, D1 was kept as the control with a constant loading of 1.2 kgVS of SS·m−3·d−1, while D2 operated at variable co-digestion ratios and OLRs after week 10. The operational scheme for the whole experiment is plotted in Figure 3a. Similar to the previous campaign, the OLR of D2 was increased gradually, the mix ratio of horse waste and SS (HW:SS) increasing from 1:1 to 2:1, 3:1, 4:1, and eventually, 5:1 based on the VS. Importantly, this experiment did not enable reaching the limit of the liquid state AD, for reasons that will be addressed in the next section. As previously, each change was prolonged for three HRTs, with the corresponding values plotted in Figure 3b.

3. Results and Discussion

3.1. Results of Phase 1

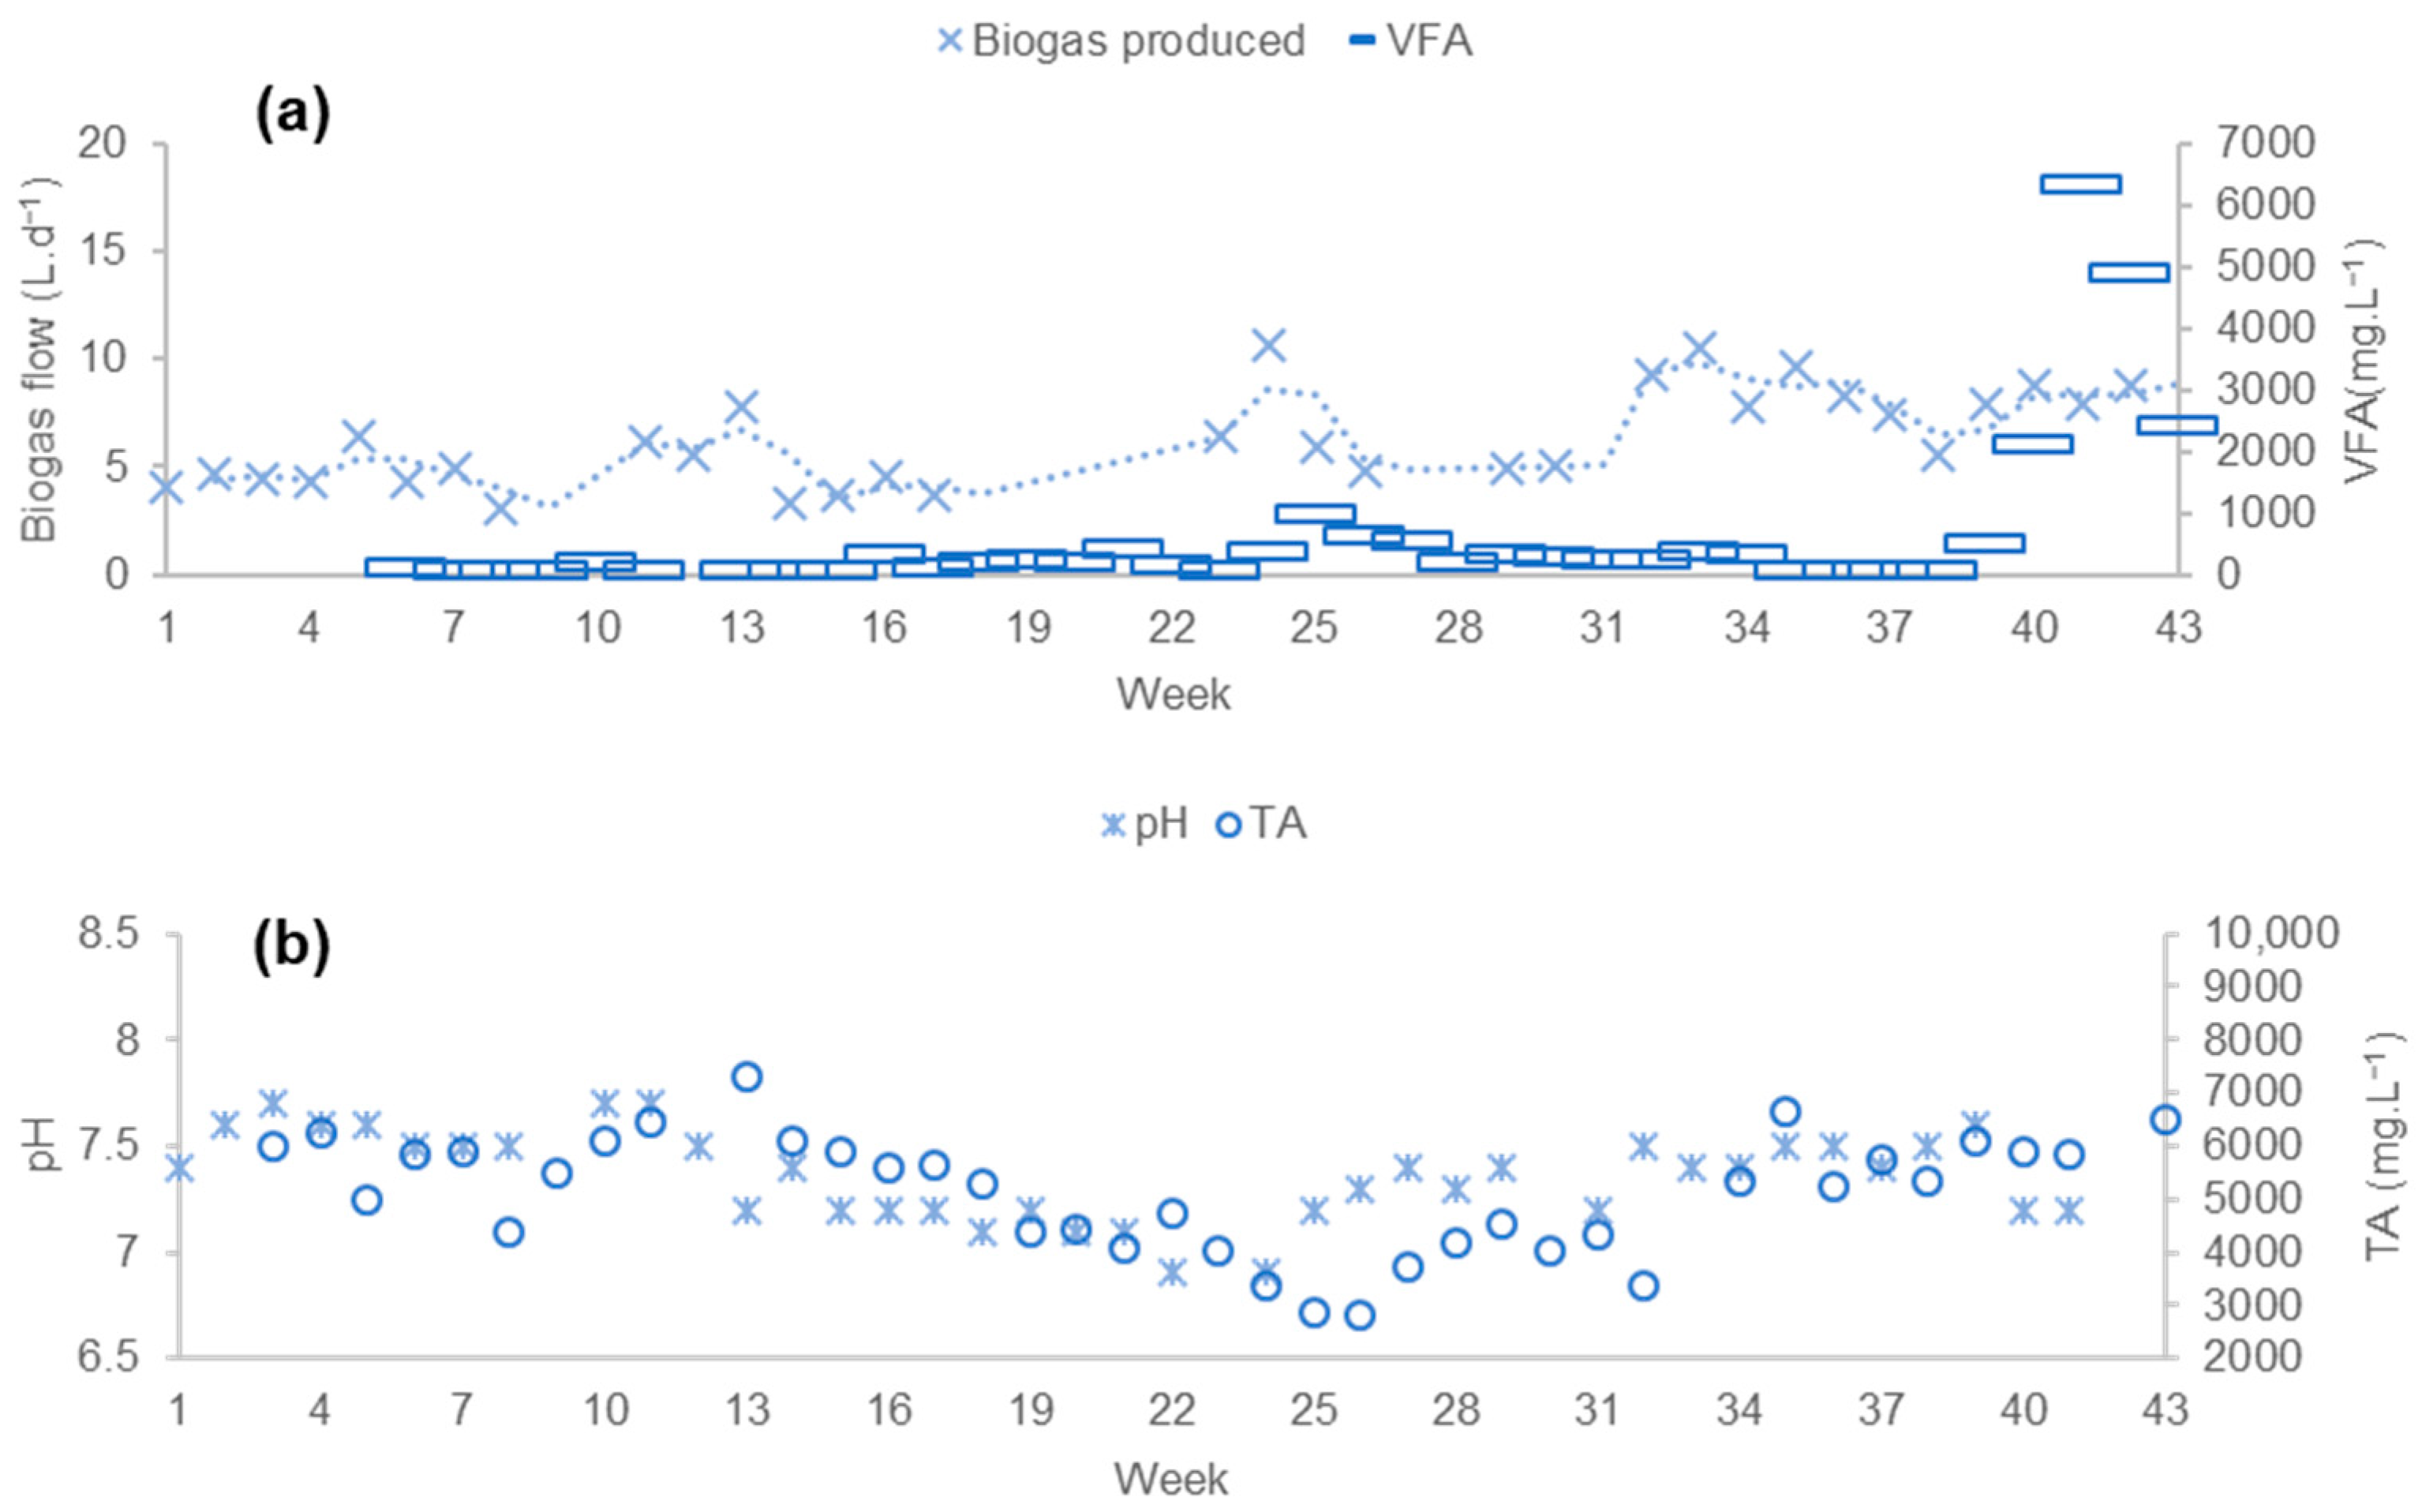
3.1.1. Process Stability

The VFA, pH, and alkalinity profiles provided information on the stability of the digestion process. In week 10, the digesters were no longer operating at the same OLR. As illustrated in Figure 4b, the TA concentrations slightly increased, reflecting the increase in the loading rate. The pH remained stable at around 7.5 ± 0.2 over the whole of phase 1, with a slight increase during the last two weeks linked to small differences in VFA accumulation shown in Figure 4a. Process stability was also evidenced in Figure 4a,c, with a gradual increase in the biogas production linked to the VS increase throughout the process. These findings align with existing research, which demonstrates that combining sewage sludge with organic solid waste in the digestion process can enhance nutrient levels in the digester. This combination also helps prevent the accumulation of VFAs and dilutes harmful agents. Therefore, this leads to greater process stability and higher biogas production [20].
Despite the steady rise in OLR and the drop in HRT, continued stability was achieved throughout the 40 weeks, with the HW composition likely explaining this stability. Indeed, literature shows that HM and bedding materials have a favorable C/N ratio and the ability to stabilize the AD process [21]. The C/N ratio is a key parameter for a well-functioning anaerobic digestion process. Research findings have shown that the ideal C/N ratio varies depending on the substrates used. To achieve an efficient biogas process, a ratio between 15 and 50 is recommended for the optimal methanogens activity. This is due to the fact that microorganisms use carbon 25 to 30 times faster than nitrogen [22]. It has been proven that a high C/N ratio signifies a low amount of nitrogen, which will be rapidly consumed by methanogens, resulting in inadequate nutrition of these microorganisms and a subsequent reduction in biogas production. Oppositely, a low C/N ratio indicates a significant nitrogen quantity, causing ammonia accumulation and a rise in pH levels, both of which are inhibitory to methanogens [23]. Therefore, achieving an equilibrium between carbon and nitrogen is crucial to establishing an optimal environment for methanogen activity, ensuring process stability, and promoting microbial growth, to enhance the overall process performance [24,25]. The optimal C/N ratio is dependent on both substrate and inoculum. Substrates with high C/N ratios, exemplified with HM and bedding materials, such as wheat straw and wood chips, and with C/N ratios of 32, 46, and 34, respectively [9] (Naji et al., 2023), might yield significant amounts of VFA. On the other hand, substrates with low C/N ratios, as demonstrated by our SS with a C/N ranging from 7 to 8 [26], exhibit a buffering capacity [23]. This highlights the significance of co-digesting sewage sludge with carbon-rich substrates to establish an optimal C/N ratio and nutritional adjustments for microorganisms, thereby promoting a well-functioning AD process [27].
Additionally, WC, present here, contains a large amount of lignin (almost 20% of its organic matter), with the latter known to be recalcitrant to anaerobic biodegradation [28]. Hence, the calculated OLRs were overestimated compared with the actual OLRs. This stability is also explained by the presence of water in the liquid state anaerobic digestion process, which contributes to the effective homogenization of the substrate mixture. It also enhances the interaction between microorganisms and the substrates and reduces the concentration of the inhibitors through dilution [29,30].

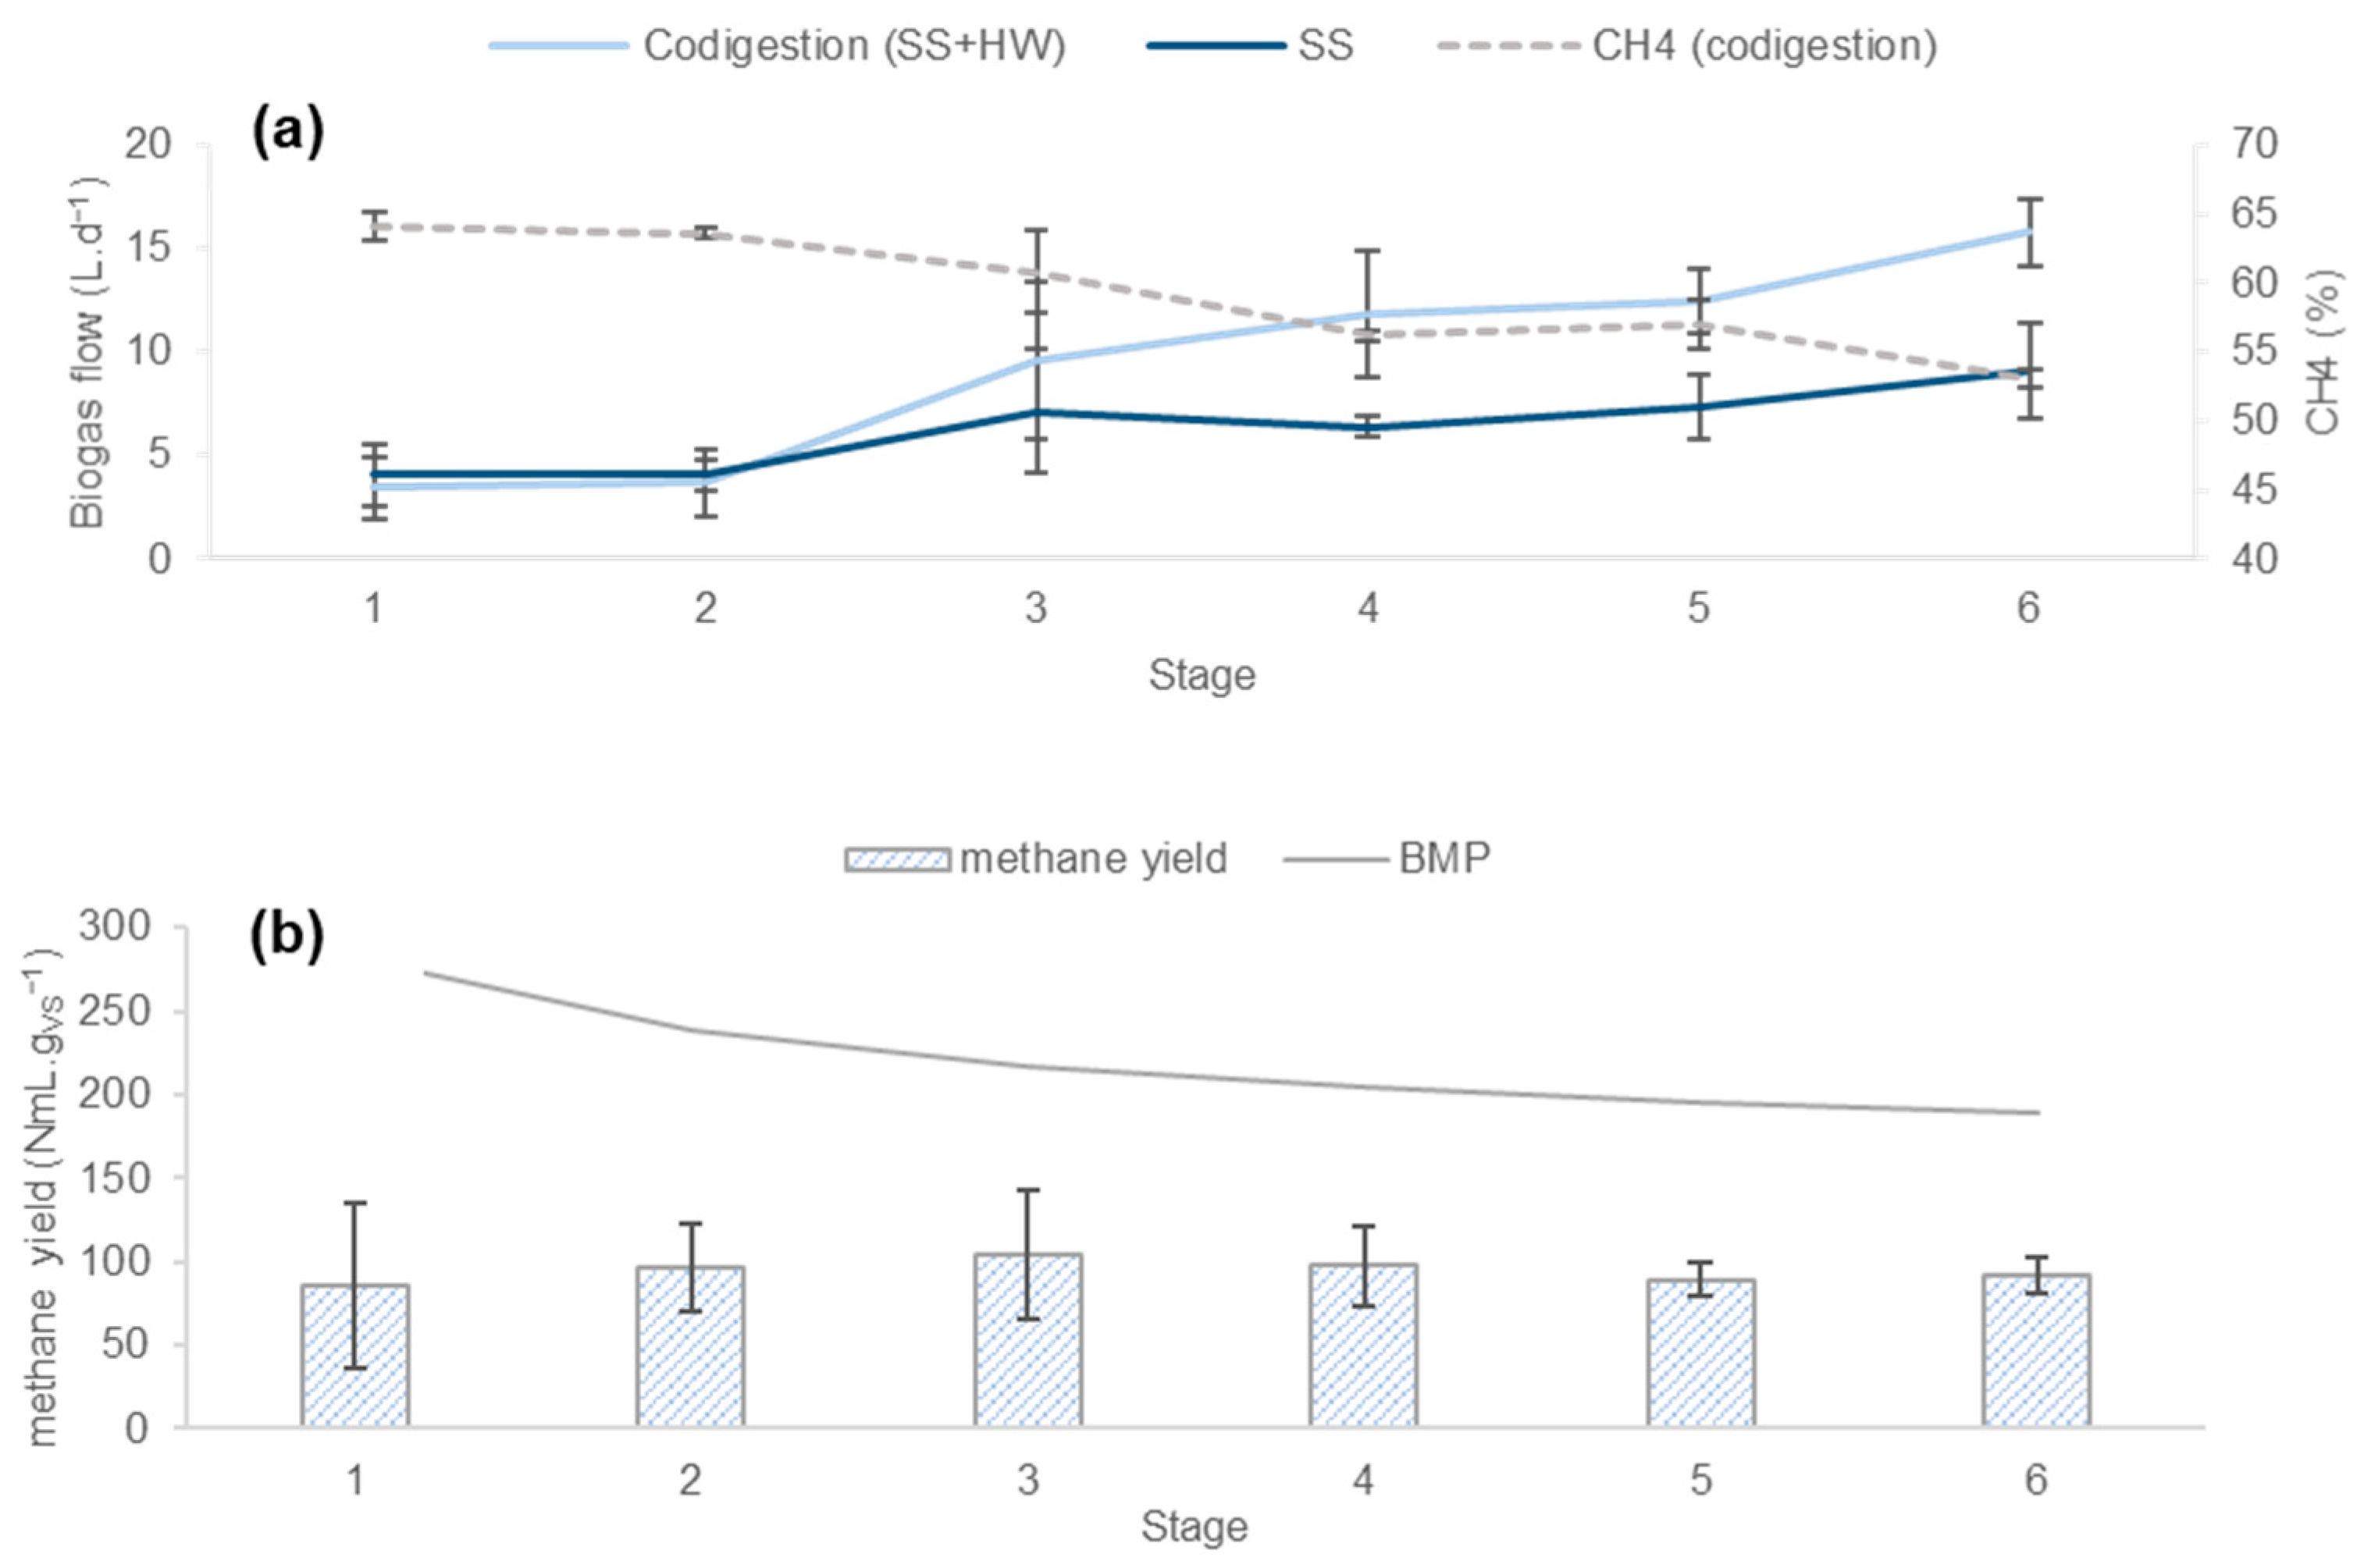
3.1.2. Productivity of the Process

The BMP value used in this study was 411 NmLCH4·gVS−1 for SS [31], while 195.5 NmLCH4·gVS−1 was measured for HW. The BMP of the mixture was calculated as the relative sum of the BMP for both co-substrates.
Table 1 presents the OLR, HRT, and the corresponding ratios for each stage. The data illustrate that higher OLR values lead to a decrease in HRT. This pattern has also been observed in previous studies [32,33]. In addition, due to HW and the nature of the co-substrate (mainly density), an increase in the HW:SS ratio will further promote faster HRTs.
As evoked previously, the biogas curve (Figure 5a) showed an increased production with increases in OLRs. The biogas production increased from 3.5 L·d−1 to 15.8 L·d−1, with an increase in OLR from 2.4 kgVS·m−3·d−1 to 8.4 kgV·m−3·d−1 and ratios of 1:1 to 6:1, respectively. However, the D1 control digester curve also shows a rise in production. These changes in the SS substrate itself are a confounding factor in attempting to link the results obtained with the sole increase in VS of HW. Examining the CH4 curve for the different stages, it is evident that the properties of substrates have a high impact on the quality of the biogas and that the increase in lignocellulosic biomass likely decreases the quality of the biogas being generated. The biogas composition was at 64% CH4 for a ratio of 1:1, dropping to 53% CH4 for a ratio of 6:1. This could be explained by hydrogenotrophic activity; based on the literature, a higher proportion of hydrogenotrophic methanogens operate within lignocellulosic matter, yielding biogas with lower methane potential [34].
Overall, methane yield production was stable at around 94 NmL·gVS−1 ± 2 throughout all stages (Figure 5b). Compared with the BMP calculated and the decrease in HRT, this stability could be linked to the increased strength of the SS introduced from stage 3 onwards. Stages 1 and 2, characterized by stable sewage sludge biogas production, clearly show that co-digestion with an OLR of 2.4 and 4.8 kgVS·m−3·d−1 and feedstock ratios of 1:1 and 1:3, respectively, will generate an actual methane yield three times lower than the calculated BMP. This disparity can be directly attributed to the combination of a low HRT, elevated OLR, and the biodegradability rate of the lignocellulosic biomass. Based on the literature, higher VS load led to longer lag phases [35], while biodegradation of cellulose required several weeks [21], and hydrolysis in complex polysaccharides was longer than in more soluble substrates [36]. Furthermore, an elevated OLR could result in an excess of materials for microorganisms to degrade, creating challenges in their complete degradation. As a consequence, this situation can contribute to a reduction in BMP [37].

3.2. Results of Phase 2

3.2.1. Process Stability

The profiles of VFA, TA, and pH provided information on the stability of the AD process. Co-digestion was implemented in D2 in week 13. VFA, pH, and TA values remained constant, showing stability in the digester, as illustrated in Figure 6. Interestingly, around week 25, a slight uptick in VFA was observed, lasting for about 10 days before the system regained its stability. The increase in VS concentration (Figure 4c) might have led to an increase in the substrate availability for microbial metabolism. As seen in Figure 6a, biogas production was linked to VFA production and process stability. However, the increase in biogas remained limited, which could be related to the accumulation of poorly hydrolyzable compounds in the reactors [38].
At week 41, D2, operating at OLR 7.2 kgVS·m−3·d−1, showed a substantial VFA spike. The increase in VS may have presented an inhibitory effect on some of the stages involved in anaerobic digestion. Notably, several studies showed that hydrolysis of lignocellulosic material could be a rate-limiting step in the AD [5] and acid accumulation could cause the process to overload [39]. Another explanation could be the short HRTs, where the methanogens were briefly washed out of the process [40].

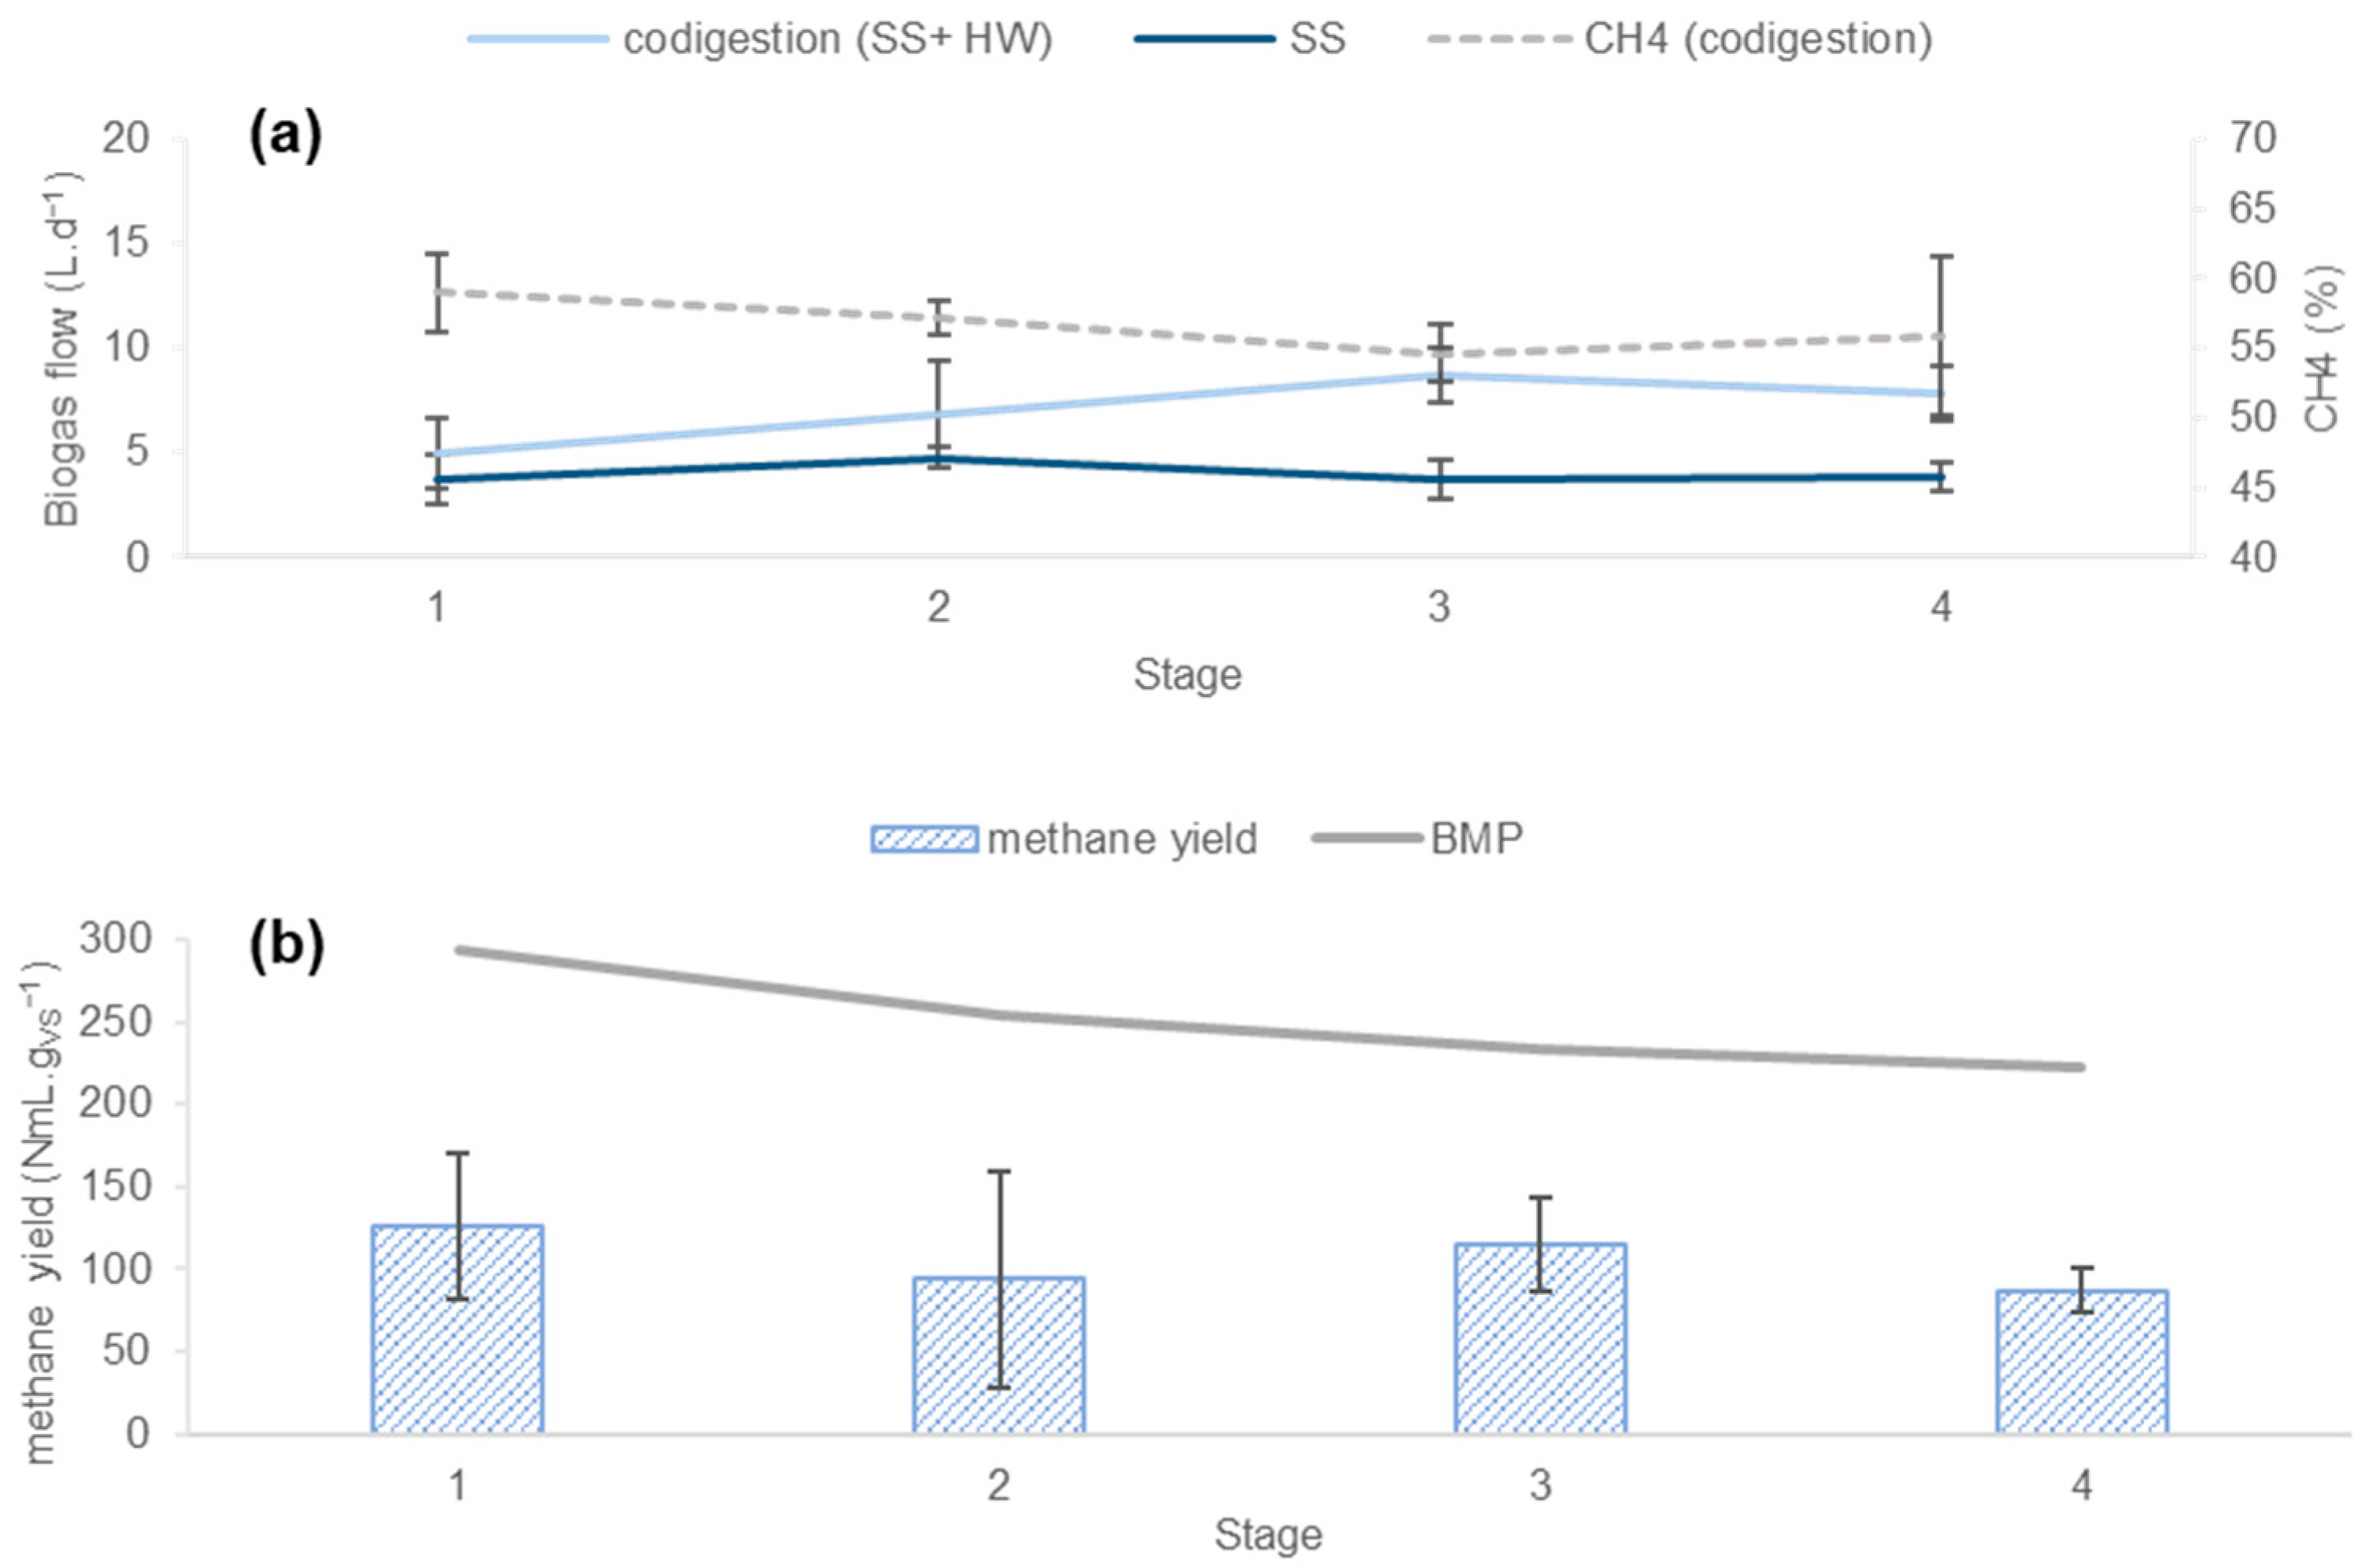
3.2.2. Productivity of the Process

The OLR, HRT, and ratio of each stage are shown in Table 2.
The D1 control digester curve (SS) showed constant production, likely owing to the stability of the SS feed parameters (Figure 7a). In contrast, the biogas production in co-digestion increased from stages 1 to 3, with biogas of 5 L·d−1, 6.8 L·d−1, and 7.8 L·d−1, respectively (Figure 7a). This increase can be attributed to the direct increase in VS, brought about by each subsequent HW loading. At stage 4 (OLR of 6 kgVS·m−3·d−1 and ratio 4:1), however, the biogas production dropped, seemingly due to the inhibitory effects on AD. This suggests that in similar conditions it might be best not to exceed an OLR of 4.8 kgVS·m−3·d−1 and a ratio of 3:1 (i.e., the setup for stage 3 here, before the drop in production) for a well-functioning AD. As shown in Figure 7a, the percentages of CH4 were approximately 60%, 57%, and 55% in stages 1, 2, and 3, respectively. As discussed previously for phase 1, the drop in the quality of the biogas can be attributed to co-substrate modifications (lignocellulosic biomass proportion increases). Methane yield production was relatively stable at around 112 NmL·gVS−1 ± 2 throughout stages 1 to 3 (Figure 7b), with barely half the calculated BMP. These results suggest that a continuously mixed flow reactor with a high OLR may directly affect the HRT, thereby promoting significant washing out of the methane producers in the process. This phenomenon has been similarly demonstrated in the existing literature, where a combination of high OLR and short HRT may lead to VFA accumulation and bacterial washout, eventually leading to process failure [33,41]. In contrast, the stage 4 drop in methane yield is attributable to VFA accumulation. Comparing the results obtained in both phases, the production in phase 2 was 18 NmL·gVS−1 higher than the output in phase 1. This slight increase in methane yield may be attributed mainly to the absence of WC, after having accounted for the change in the nature of SS. Indeed, previous literature shows that WS bedding tends to increase methane production, whereas WC bedding has a diluting effect on the potential methane production. In particular, ref. [42] shows comparable results to similar horse waste substrates. Several studies highlight horse waste as problematic to digest in the liquid state of AD, as a higher content of lignocellulosic and fibrous materials, such as straw and wood, have a negative aspect of the process. Fibrous material in general also created problems by floating in the top layer of the reactor, producing a non-homogeneous mixture [21]. Finally, solid impurities, such as sand, disturbed the conventional liquid AD, causing sedimentation in the digester [21]. It should be noted, however, that a higher biogas yield of co-digestion of horse waste was observed with food waste, where the fibrous substrate present contributed to the optimization of the C/N ratio [43].

4. Conclusions

In conclusion, this study focused on the continuous liquid state anaerobic digestion of sewage sludge in combination with horse waste to enhance biogas production. The research was divided into two phases, each involving co-digestion with different bedding mixtures with sewage sludge. Phase 1, utilizing the bedding mixture of wheat straw, wood chips, and horse manure, demonstrated stable conditions over 40 weeks. The addition of bedding materials positively affected nutrient levels and process stability, leading to increased biogas production. Some limitations were observed at higher OLRs due to the incomplete degradation of lignocellulosic materials, mainly present in wood chips. Phase 2, which employed wheat straw bedding alone with horse manure, exhibited similar stability and slightly higher methane production. Notably, the absence of wood chips in phase 2 contributed to an enhanced methane yield, highlighting the importance of the bedding mixture composition in the co-digestion process. Additionally, this study aimed to define the optimal combination of OLR and loading ratios. It has been demonstrated that the most favorable biogas production outcomes were attained using a HW blend of 99% WS and 1% HM. Optimal biogas generation was observed when employing an OLR of 4.8 kgVS·m−3·d−1 alongside a ratio of HW:SS of three. It is important to emphasize that the optimal HW:SS ratio identified in this research paper corresponds to the ideal homogenization and substrate preparation conditions at a laboratory scale. On an industrial scale, a lower ratio may be encountered depending on several critical points in the digestion process, such as the mixing and pretreatment of substrates. Overall, this study contributes to the growing understanding of sustainable waste-to-energy strategies and offers guidance for optimizing the core parameters suggested for a well-functioning anaerobic digestion.

Author Contributions

A.N., methodology (anaerobic digestion), writing—review and edit; C.L., investigation (anaerobic digestion); E.J., supervision, formal analysis, writing; S.G.R., conceptualization, methodology (anaerobic digestion), supervision; S.A., project administration; V.R., conceptualization, supervision, project administration. All authors have read and agreed to the published version of the manuscript.

Funding

This research received no external funding and the APC was funded by SIAAP.

Institutional Review Board Statement

Not applicable.

Informed Consent Statement

Not applicable.

Data Availability Statement

Available upon request.

Conflicts of Interest

The authors declare that they have no known competing financial interests or personal relationships that could have appeared to influence the work reported in this paper.

References

  1. Haberl, H.; Sprinz, D.; Bonazountas, M.; Cocco, P.; Desaubies, Y.; Henze, M.; Hertel, O.; Johnson, R.K.; Kastrup, U.; Laconte, P.; et al. Correcting a Fundamental Error in Greenhouse Gas Accounting Related to Bioenergy. Energy Policy 2012, 45, 18–23. [Google Scholar] [CrossRef] [PubMed]
  2. Holm-Nielsen, J.B.; Al Seadi, T.; Oleskowicz-Popiel, P. The Future of Anaerobic Digestion and Biogas Utilization. Bioresour. Technol. 2009, 100, 5478–5484. [Google Scholar] [CrossRef] [PubMed]
  3. Scarlat, N.; Dallemand, J.-F.; Fahl, F. Biogas: Developments and Perspectives in Europe. Renew. Energy 2018, 129, 457–472. [Google Scholar] [CrossRef]
  4. Abdeen, F.R.H.; Mel, M.; Jami, M.S.; Ihsan, S.I.; Ismail, A.F. A Review of Chemical Absorption of Carbon Dioxide for Biogas Upgrading. Chin. J. Chem. Eng. 2016, 24, 693–702. [Google Scholar] [CrossRef]
  5. Sayara, T.; Sánchez, A. A Review on Anaerobic Digestion of Lignocellulosic Wastes: Pretreatments and Operational Conditions. Appl. Sci. 2019, 9, 4655. [Google Scholar] [CrossRef]
  6. Benyahya, Y.; Fail, A.; Alali, A.; Sadik, M. Recovery of Household Waste by Generation of Biogas as Energy and Compost as Bio-Fertilizer—A Review. Processes 2021, 10, 81. [Google Scholar] [CrossRef]
  7. Brown, D.; Shi, J.; Li, Y. Comparison of Solid-State to Liquid Anaerobic Digestion of Lignocellulosic Feedstocks for Biogas Production. Bioresour. Technol. 2012, 124, 379–386. [Google Scholar] [CrossRef]
  8. Massanetnicolau, J.; Dinsdale, R.; Guwy, A. Hydrogen Production from Sewage Sludge Using Mixed Microflora Inoculum: Effect of PH and Enzymatic Pretreatment. Bioresour. Technol. 2008, 99, 6325–6331. [Google Scholar] [CrossRef]
  9. Naji, A.; Rechdaoui, S.G.; Jabagi, E.; Lacroix, C.; Azimi, S.; Rocher, V. Horse Manure and Lignocellulosic Biomass Characterization as Methane Production Substrates. Fermentation 2023, 9, 580. [Google Scholar]
  10. NF ISO 11465; Soil Quality—Determination of Dry Matter and Water Content on a Mass Basis—Gravimetric Method. ISO: Geneva, Switzerland, 1993.
  11. NF U44-160; Organic Soil Conditioners and Organic Material for Soil Improvement—Determination of total organic matter—Calcination method. AFNOR: Paris, France, 1985.
  12. NF EN ISO 9963-1; Water Quality—Determination of Alkalinity—Part 1: Determination of Total and Composite Alkalinity. ISO: Geneva, Switzerland, 1994.
  13. Prusisz, B.; Mulica, K.; Pohl, P. Ion Exchange and Ion Exclusion Chromatographic Characterization of Wines Using Conductivity Detection. J. Food Drug Anal. 2020, 16, 13. [Google Scholar] [CrossRef]
  14. Shelor, C.P.; Dasgupta, P.K.; Liao, H. Conductometric Gradient Ion Exclusion Chromatography for Volatile Fatty Acids. Anal. Chem. 2016, 88, 12323–12329. [Google Scholar] [CrossRef] [PubMed]
  15. Luostarinen, S.; Luste, S.; Sillanpää, M. Increased Biogas Production at Wastewater Treatment Plants through Co-Digestion of Sewage Sludge with Grease Trap Sludge from a Meat Processing Plant. Bioresour. Technol. 2009, 100, 79–85. [Google Scholar] [CrossRef] [PubMed]
  16. Hendriks, A.T.W.M.; Zeeman, G. Pretreatments to Enhance the Digestibility of Lignocellulosic Biomass. Bioresour. Technol. 2009, 100, 10–18. [Google Scholar] [CrossRef] [PubMed]
  17. Sambusiti, C.; Ficara, E.; Malpei, F.; Steyer, J.P.; Carrère, H. Benefit of Sodium Hydroxide Pretreatment of Ensiled Sorghum Forage on the Anaerobic Reactor Stability and Methane Production. Bioresour. Technol. 2013, 144, 149–155. [Google Scholar] [CrossRef]
  18. Aslanzadeh, S.; Rajendran, K.; Taherzadeh, M.J. A Comparative Study between Single- and Two-Stage Anaerobic Digestion Processes: Effects of Organic Loading Rate and Hydraulic Retention Time. Int. Biodeterior. Biodegrad. 2014, 95, 181–188. [Google Scholar] [CrossRef]
  19. Demirer, G.N.; Chen, S. Two-Phase Anaerobic Digestion of Unscreened Dairy Manure. Process Biochem. 2005, 40, 3542–3549. [Google Scholar] [CrossRef]
  20. Meng, Q.; Liu, H.; Zhang, H.; Xu, S.; Lichtfouse, E.; Yun, Y. Anaerobic Digestion and Recycling of Kitchen Waste: A Review. Environ. Chem. Lett. 2022, 20, 1745–1762. [Google Scholar] [CrossRef]
  21. Hadin, Å.; Eriksson, O. Horse Manure as Feedstock for Anaerobic Digestion. Waste Manag. 2016, 56, 506–518. [Google Scholar] [CrossRef]
  22. Yadvika; Santosh; Sreekrishnan, T.R.; Kohli, S.; Rana, V. Enhancement of Biogas Production from Solid Substrates Using Different Techniques––A Review. Bioresour. Technol. 2004, 95, 1–10. [Google Scholar] [CrossRef]
  23. Rabii, A.; Aldin, S.; Dahman, Y.; Elbeshbishy, E. A Review on Anaerobic Co-Digestion with a Focus on the Microbial Populations and the Effect of Multi-Stage Digester Configuration. Energies 2019, 12, 1106. [Google Scholar] [CrossRef]
  24. Hagos, K.; Zong, J.; Li, D.; Liu, C.; Lu, X. Anaerobic Co-Digestion Process for Biogas Production: Progress, Challenges and Perspectives. Renew. Sustain. Energy Rev. 2017, 76, 1485–1496. [Google Scholar] [CrossRef]
  25. Karthikeyan, O.P.; Visvanathan, C. Bio-Energy Recovery from High-Solid Organic Substrates by Dry Anaerobic Bio-Conversion Processes: A Review. Rev. Environ. Sci. Bio/Technol. 2013, 12, 257–284. [Google Scholar] [CrossRef]
  26. Kabbashi, N. Sewage Sludge Composting Simulation as Carbon/Nitrogen Concentration Change. J. Environ. Sci. 2011, 23, 1925–1928. [Google Scholar] [CrossRef]
  27. Liu, X.; Li, R.; Ji, M.; Han, L. Hydrogen and Methane Production by Co-Digestion of Waste Activated Sludge and Food Waste in the Two-Stage Fermentation Process: Substrate Conversion and Energy Yield. Bioresour. Technol. 2013, 146, 317–323. [Google Scholar] [CrossRef] [PubMed]
  28. Li, H.; Jin, Y.; Mahar, R.; Wang, Z.; Nie, Y. Effects and Model of Alkaline Waste Activated Sludge Treatment. Bioresour. Technol. 2008, 99, 5140–5144. [Google Scholar] [CrossRef]
  29. Abbassi-Guendouz, A.; Brockmann, D.; Trably, E.; Dumas, C.; Delgenès, J.-P.; Steyer, J.-P.; Escudié, R. Total Solids Content Drives High Solid Anaerobic Digestion via Mass Transfer Limitation. Bioresour. Technol. 2012, 111, 55–61. [Google Scholar] [CrossRef] [PubMed]
  30. Rocamora, I.; Wagland, S.T.; Villa, R.; Simpson, E.W.; Fernández, O.; Bajón-Fernández, Y. Dry Anaerobic Digestion of Organic Waste: A Review of Operational Parameters and Their Impact on Process Performance. Bioresour. Technol. 2020, 299, 122681. [Google Scholar] [CrossRef] [PubMed]
  31. Guérin-Rechdaoui, S.; Azimi, S.; Bernier, J.; Rocher, V.; Mottelet, S.; Pauss, A.; Ribeiro, T. Cartographie des boues de STEP et réduction du temps de mesure par un couplage «expérimentation en réacteur/modélisation». L’EAU L’INDUSTRIE LES NUISANCES 2016, 9. Available online: www.revue-ein.com (accessed on 7 September 2023).
  32. Deepanraj, B.; Sivasubramanian, V.; Jayaraj, S. Jayaraj Enhancement of Biogas Production by Pretreatment: A Review. In Proceedings of the IV th International Conference on Advances in Energy Research, Mumbai, India, 10–12 December 2013. [Google Scholar] [CrossRef]
  33. Sarker, S.; Lamb, J.J.; Hjelme, D.R.; Lien, K.M. A Review of the Role of Critical Parameters in the Design and Operation of Biogas Production Plants. Appl. Sci. 2019, 9, 1915. [Google Scholar] [CrossRef]
  34. Paul, S.; Dutta, A. Challenges and Opportunities of Lignocellulosic Biomass for Anaerobic Digestion. Resour. Conserv. Recycl. 2018, 130, 164–174. [Google Scholar] [CrossRef]
  35. Filer, J.; Ding, H.H.; Chang, S. Biochemical Methane Potential (BMP) Assay Method for Anaerobic Digestion Research. Water 2019, 11, 921. [Google Scholar] [CrossRef]
  36. Mao, C.; Feng, Y.; Wang, X.; Ren, G. Review on Research Achievements of Biogas from Anaerobic Digestion. Renew. Sustain. Energy Rev. 2015, 45, 540–555. [Google Scholar] [CrossRef]
  37. Pellera, F.-M.; Gidarakos, E. Anaerobic Digestion of Solid Agroindustrial Waste in Semi-Continuous Mode: Evaluation of Mono-Digestion and Co-Digestion Systems. Waste Manag. 2017, 68, 103–119. [Google Scholar] [CrossRef] [PubMed]
  38. Schievano, A.; D’Imporzano, G.; Malagutti, L.; Fragali, E.; Ruboni, G.; Adani, F. Evaluating Inhibition Conditions in High-Solids Anaerobic Digestion of Organic Fraction of Municipal Solid Waste. Bioresour. Technol. 2010, 101, 5728–5732. [Google Scholar] [CrossRef] [PubMed]
  39. Ahring, B.K.; Sandberg, M.; Angelidaki, I. Volatile Fatty Acids as Indicators of Process Imbalance in Anaerobic Digestors. Appl. Microbiol. Biotechnol. 1995, 43, 559–565. [Google Scholar] [CrossRef]
  40. Bi, S.; Hong, X.; Yang, H.; Yu, X.; Fang, S.; Bai, Y.; Liu, J.; Gao, Y.; Yan, L.; Wang, W.; et al. Effect of Hydraulic Retention Time on Anaerobic Co-Digestion of Cattle Manure and Food Waste. Renew. Energy 2020, 150, 213–220. [Google Scholar] [CrossRef]
  41. Zhang, T.; Yang, Y.; Xie, D. Insights into the Production Potential and Trends of China’s Rural Biogas: A Review of China’s Rural Biogas. Int. J. Energy Res. 2015, 39, 1068–1082. [Google Scholar] [CrossRef]
  42. Wartell, B.A.; Krumins, V.; Alt, J.; Kang, K.; Schwab, B.J.; Fennell, D.E. Methane Production from Horse Manure and Stall Waste with Softwood Bedding. Bioresour. Technol. 2012, 112, 42–50. [Google Scholar] [CrossRef]
  43. Ajeej, A.; Thanikal, J.V.; Narayanan, C.M.; Yazidi, H. Study on the Influence of the Characteristics of Substrates in Biogas Production. Int. J. Curr. Res. 2016, 8, 39795–39799. [Google Scholar]
Figure 1. Experimental setup of the continuous stirred-tank reactor (CSTR-10S, Bioprocess Control, Lund, Sweden).
Energies 16 06595 g001
Figure 2. Operational scheme of phase 1 in D2: (a) OLR and ratio changes; (b) changes in TS and HRT.
Energies 16 06595 g002
Figure 3. Operational scheme of phase 2 in D2 including (a) OLR and ratio changes; (b) changes in TS and HRT.
Energies 16 06595 g003
Figure 4. Operational parameters of phase 1 in D2 including (a) volumetric biogas production and VFA; (b) TA and pH; (c) VS in and VS out.
Energies 16 06595 g004
Figure 5. Productivity of the process in phase 1 including (a) average biogas quantity and quality of D2 (SS + HW) as well as average biogas quantity of D1 (SS only); (b) average methane yield of D2 and BMP.
Energies 16 06595 g005
Figure 6. Operational parameters of phase 2 including (a) volumetric biogas production and VFA; (b) TA and pH.
Energies 16 06595 g006
Figure 7. Productivity of the phase 2 process including (a) the average biogas quantity and quality of D2 and average biogas quantity of D1; (b) average methane yield of D2 and BMP.
Energies 16 06595 g007
Table 1. Parameters of each stage of the phase 1.
StageRatio (HW:SS)OLR (kgvs·m−3·d−1)HRT (Days)
11:12.413
23:14.89
34:169
45:17.27
56:18.47
67:19.66
Table 2. Parameters of each stage in phase 2.
StageRatio (HW:SS)OLR (kgvs·m−3·d−1)HRT (Days)
11:12.415
22:13.611
33:14.89
44:168
Disclaimer/Publisher’s Note: The statements, opinions and data contained in all publications are solely those of the individual author(s) and contributor(s) and not of MDPI and/or the editor(s). MDPI and/or the editor(s) disclaim responsibility for any injury to people or property resulting from any ideas, methods, instructions or products referred to in the content.

