Article

Process Integration Approach to the Methanol (MeOH) Production Variability from Syngas and Industrial Waste Gases

1
Department of Chemical Engineering & Polymer Science, Shahjalal University of Science and Technology, Sylhet 3114, Bangladesh
2
Department of Aerospace and Mechanical Engineering, University of Oklahoma, Norman, OK 73019, USA
3
Department of Chemical Engineering, State University of New York College of Environmental Science and Forestry, Syracuse, NY 13210, USA
4
Department of Chemical, Materials and Production Engineering, University of Naples Federico II, 80125 Naples, Italy
*
Authors to whom correspondence should be addressed.
Energies 2023, 16(18), 6557; https://doi.org/10.3390/en16186557
Submission received: 19 July 2023 / Revised: 5 September 2023 / Accepted: 7 September 2023 / Published: 12 September 2023
(This article belongs to the Section B: Energy and Environment)

Abstract

:
Methanol is expected to be a possible solution for reducing global greenhouse gas emissions and minimizing the dependency on fossil fuels. This paper presents a systematic approach of methanol (MeOH) production from industrial waste gases including flue gas (FG) and coke oven gas (COG) that are considered an important threat to the environment. The impact of process parameters, including dimensional parameters (length, diameter, and number of tubes) and operational parameters (reactor temperature, pressure, and thermal fluid temperature) over the MeOH synthesis, are investigated by Aspen Plus. Firstly, the synthesis process is designed and optimized using syngas (SG) as a feed material. Secondly, by replacing the feed material with FG and COG, methanol production variability is investigated and demonstrated for the same optimized process. Afterward, an efficient heat exchange network system is developed for all three different processes using Aspen Energy Analyzer. The optimized dimensional parameters of the MeOH synthesis reactor are determined to be a length of 12 m, a diameter of 0.06 m, and 5000 tubes for achieving a conversion rate of 75%. Meanwhile, the optimized operational parameters are identified as a reactor temperature of 209   ° C , reactor pressure of 70 bar, and thermal fluid temperature of 196   ° C . Furthermore, the influence of the stoichiometric number (SN) on the process was observed with higher SN values resulting in increased hydrogen (H2) concentration and an improved forward reaction of MeOH synthesis, leading to higher conversion rates. The findings and insights gained from this study can serve further improvements and advancements in MeOH synthesis processes.

1. Introduction

Fossil fuels accelerated a prodigious era of prosperity and advancement for human civilization in the past two centuries. Still, today, the entire world heavily relies on fossil fuels to fulfill about 80% of its energy demands and to generate vast quantities of adopted fuels and vital commodities [1]. However, the amount of fossil fuel accessible to us is limited and can be diminished in coming decades. This is because developed and developing nations deliberately expanded the use of fossil fuel in various sectors over the last few decades; consequently, the price of fuel rose unreasonably at the same time. Simultaneously, an excessive use of fossil fuels has led to a devastating increase in greenhouse gas emissions, which leads to global warming.
Carbon dioxide (CO2), carbon monoxide (CO), and methane (CH4) gases are considered the key contributors to greenhouse gases [2,3]. Flue gases (FG) emitted from coal or natural gas-based thermal power plants is one of the major sources of CO2, which is approximately 40% of total CO2 emissions [4]. On the other hand, the steel and iron industry are responsible for 7% of total CO2 emissions globally, which is around 30% of the worldwide industrial sector emissions [5]. Coke oven gas (COG) is another industrial waste gas: a major by-product of the coking process of the steel and iron industry, it contains around 55–60 mol% of H2, 23–27 mol% of CH4, 5–8 mol% of CO, 3–5 mol% of N2, and other impurities in small proportions [6].
In light of environmental concerns related to greenhouse gas emissions and the expanding global population, the foremost challenge facing societies is meeting the rising global energy demand while minimizing reliance on fossil fuels to reduce greenhouse gas emissions. Therefore, it is very urgent to develop processes that decrease/utilize the fossil fuel-based CO2 emissions and produce value-added chemicals simultaneously. Since we cannot avoid using fossil fuels, thus, an integrated processing approach is needed to control the emissions of greenhouse gases such as CO2, CO, and CH4 from FG and COG.
As a part of an integrated processing approach, value-added fuels and chemicals can be produced from greenhouse gases of industrial waste gases. For instance, the synthesis of methanol (MeOH) from industrial waste gases (FG and COG) can be a viable solution as it not only controls the emissions of greenhouse gases but also has the potential to make alternative renewable energy. Although the energy density of methanol (20.1 MJ kg−1) is half that of gasoline (44.3 MJ kg−1) [7], a higher-octane number of MeOH (108) relative to gasoline (95) makes it a potential fuel. In addition, it has a higher compression ratio than gasoline, resulting in a more efficient combustion, which can consequently reduce the greenhouse gas emissions [8].
In this regard, the aim of this paper is to study the systematic approach of MeOH production from industrial waste gases (FG and COG) that are considered a great threat to the environment. The specific objective is to analyze the impact of process parameters, including dimensional parameters and operational parameters, over the MeOH synthesis by Aspen Plus. Another specific goal is to maximize heat recovery by exchanging process heat between cold and hot streams while minimizing the required external heating and cooling utilities. To achieve this goal, pinch analysis principles are followed to perform heat integration. Since syngas (SG) is the main feedstock in industry for MeOH production, firstly, a base case MeOH production from the SG model is developed in Aspen Plus. Based on the SG composition and stoichiometric reaction, a stoichiometric number (SN) is calculated for the base case model. Later, MeOH synthesis process models for FG and COG industrial waste gases are developed based on the optimized base case model.

2. Theoretical Background

The reaction mechanisms of methanol synthesis have been studied by several authors, and they have suggested the following microkinetic mechanisms [9]:
C O + 2 H 2 C H 3 O H H = 91   k J m o l 1
C O 2 + 3 H 2 C H 3 O H + H 2 O H = 49.5   k J m o l 1
C O 2 + H 2 C O + H 2 O H = + 41   k J m o l 1
The microkinetic mechanism includes several reaction steps among the adsorbed species, and about 50 reactions have been proposed. The Langmuir–Hinshelwood (L-H) and Eley–Rideal (E-R) mechanisms are usually adopted, and one or more of the steps are considered to be the rate-determining step (RDS) for MeOH synthesis. MeOH production mainly depends on the composition of SG, which is a mixture of CO, CO2, and H2. The composition of SG can be best described by SN. The SN can be expressed by the following equation:
S N = M o l e s H 2 M o l e s C O 2 M o l e s C O 2 + M o l e s C O
The SN can be calculated from the stoichiometric equations (Equations (1)–(3)), and the SN value is assumed to be 2 [10] under the ideal condition. But several authors suggested that SN should remain slightly higher than 2 for better results, and the optimum value of SN is recommended as 2–2.1 [10,11]. In addition, to have a better yield of MeOH, the H2 to CO ratio is suggested to remain within 2.4–3.0 [11]. According to Sahibzada et al. [12], around 4% CO2 in SG can help increase MeOH production. But based on different types of biomass and different reforming/gasification processes, the composition of SG varies, and none of the SG composition falls within the suggested range of SN value (2–2.1) and H2 to CO ratio (2.4–3.0) as reported by Arashiro et al. [13] and AlNouss et al. [14]. As the development of the pretreatment process of SG is not the main aim of this study, therefore, a hypothetical SG composition is considered in the subsequent analysis. The composition of SG is considered as 28.5978% CO, 2.7675% CO2 and 68.6347% H2, and we assumed that there is no presence of inert gases such as CH4, N2, etc. Based on these hypothetical values, the SN of HSG comes up as 2.1 and H2/CO as 2.4.
To synthesize MeOH from FG and COG, pretreatment is also necessary for better yield, which can be completed in various ways. According to Abdelaziz et al. [15], FG can be pretreated by capturing CO2 for subsequent steps, which is economically more efficient than other processes [15]. As FG contains no hydrogen gas, an external source of hydrogen is required to produce MeOH from FG. Among various established methods, the water electrolysis method is suggested as the source of hydrogen [16]. Abdelaziz et al. [15] recommended an optimum composition of FG for MeOH synthesis, which is considered in this study and presented in Table 1. In addition, the present study has adopted the iron-molybdenum hydro-desulfurization pretreatment process for COG, which was proposed by Kim et al. [17] for effective desulfurization and providing optimum proportion of H2, CO, and others in the COG for MeOH synthesis. Table 1 states the composition of the reactor feed for SG, FG, and COG for MeOH production [17].
A different kinetic model is proposed for the methanol synthesis [18,19,20]. Among the different established kinetic models, the most frequently used models are those of Graaf et al. [21] and Bussche and Froment [22]. To predict the performance of the MeOH synthesis reactor, Langmuir–Hinshelwood–Hougen–Watson (LHHW)-based kinetic models have been proposed (Equation (5)) by Bussche and Froment [22].
r = k i n e t i c f a c t o r d r i v i n g f o r c e t e r m a d s o r p t i o n t e r m
In this model, it is assumed that CO2 hydrogenation produces methanol as well as CO, and a reverse water gas shift (rWGS) reaction occurs simultaneously (Equations (2) and (3)). To determine the kinetic parameters for this model, experiments have been performed at a range of pressure and temperature on an industrial catalyst Cu/ZnO/Al2O3. The validated range of this kinetic model is 15 to 51 bar and 180 to 280 °C. For a better representation of these experimental data, Mignard and Pritchard readjusted the activation energy [23], which expanded the application range of the model up to 75 bar. The kinetic model of Bussche and Froment with readjusted parameters of Mignard and Pritchard are given by the following expressions (Equations (6) and (7)):
Methanol synthesis reaction:
r C H 3 O H = k 1 p C O 2 p H 2 1 1 K e q 1 p H 2 O p C H 3 O H p H 2 3 p C O 2 1 + k 2 p H 2 O p H 2 + k 3 p H 2 0.5 + k 4 p H 2 O 3 m o l   k g c a t 1 s 1
Reverse water gas shift reaction:
r r W G S = k 5 p C O 2 1 K e q 2 p H 2 O p c o p H 2 p C O 2 1 + k 2 p H 2 O p H 2 + k 3 p H 2 0.5 + k 4 p H 2 O 3 m o l   k g c a t 1 s 1
where r i = reaction rate ( m o l   k g c a t 1 s 1 ) ;
  • k 1 , 5 = kinetic factor ( k m o l   k g c a t 1 s 1 b a r 1 ) or ( k m o l   k g c a t 1 s 1 b a r 2 ) ;
  • p i = partial pressure ( b a r ) ;
  • K e q , i = equilibrium constant [−] or ( b a r 2 ) ;
  • k 2 , 3 , 4 = adsorption constant ( b a r n ) .
Arrhenius law is used to calculate the kinetic constants of Equations (6) and (7) [22], and Table 2 summarizes the constants.
Thermodynamic equilibrium constants ( K e q 1 and K e q 2 ) are adapted from Graaf et al. [24] by Equations (8) and (9), whereas the pressure drop within the reactor is calculated by Ergun Equation [25,26].
l o g 10 K e q 1 = 3066 T 10.592
l o g 10 1 K e q 2 = 2073 T + 2.029
However, to design, analyze, and optimize a chemical process, simulations are largely implicated in evaluating different process scenarios. To achieve the objective of this study, Aspen ONE™ (Advanced System for Process Engineering) v10.0 software was used. Here, process design and heat integration were accomplished using Aspen Plus and Aspen energy analyzer (AEA), respectively. To create the process flowsheet, several key assumptions were taken into consideration [27]. Firstly, it was assumed that there is negligible dispersion in the axial direction. Secondly, radial mixedness is presumed to be at its maximum. Ad-ditionally, concentration, velocity, and temperature profiles were assumed to remain constant in the radial direction. Furthermore, the feasibility activities of the process were carried out in steady-state mode, employing a pseu-do-homogeneous model. It was also assumed that the catalyst’s effectiveness remains constant, with negligible catalyst deactivation. Finally, side reactions, excluding the rWGS (reverse water-gas shift) reaction, were deemed to be negligible.

3. Methodology

3.1. Method Overview

The traditional approach of MeOH production from SG is portrayed using a simplified block diagram, as shown in Figure 1. Based on this basic block diagram, the proposed model was developed by Aspen Plus for MeOH production from different feedstocks.
At first, a baseline case was developed, and then performance analysis and optimization was conducted for this case. After optimizing the process for SG to MeOH production, the feed was changed by FG and COG to the same optimized process for achieving the quest of production and behavioral comparison of MeOH synthesis. A systematic procedure was followed to achieve the process simulation model in Aspen Plus. The Aspen Plus simulation engine follows an iterative method to evaluate the process variables. In this work, the process simulation was completed through the Newton–Raphson iteration method. To converge the model, maximum iteration and error tolerance was maintained at 30 and 0.0001, respectively.

3.1.1. Specify Components and Methods

Firstly, a system of unit was introduced in the Aspen properties environment using ‘a user defined’. After selecting the suitable unit system, a component list was created, which contains all components that are involved in the process. Here, the H2, CO, CO2, O2, N2, H2O, CH3OH, CH4, and C2H6 components were introduced as ‘conventional’ type. The ‘property method’ was used to calculate the thermodynamic properties of the components following Soave–Redlich–Kwong (SRK) according to Graaf et al. [24], as the SRK cubic equation of state describes the chemical equilibria of the methanol synthesis reaction very well. This equation of state gave significantly better results by correcting the non-ideality [24,28]. On the other hand, to simulate the separation column like a flash separator, the distillation column “IDEAL” property method was used. All these tasks were completed in a ‘properties environment’ in Aspen Software(v10.0). Once all the essential components and property methods were incorporated, the project proceeded to the simulation environment for comprehensive modeling and analysis of the entire process.

3.1.2. Kinetic Model for MeOH Synthesis Reaction

The MeOH synthesis reaction was designed in Aspen Plus by selecting the LHHW type of reaction. But the model shown by Equations (6)–(9) could not be directly implemented in Aspen Plus; therefore, this model was needed to be rearranged to create a compatible kinetic model. This rearrangement was accomplished here by incorporating the thermodynamic equilibrium equations into the kinetic constant. Again, to meet the requirements of Aspen Plus, the units of the equations were also modified. Equations (10) and (11) represent the rearranged kinetic model [4].
Methanol synthesis reaction:
r C H 3 O H = k 1 p C O 2 p H 2 k 6 p H 2 O p C H 3 O H p H 2 2 1 + k 2 p H 2 O p H 2 1 + k 3 p H 2 0.5 + k 4 p H 2 O 3 k m o l   k g c a t 1 s 1
Reverse water gas shift reaction:
r r W G S = k 5 p C O 2 k 7 p H 2 O p c o p H 2 1 1 + k 2 p H 2 O p H 2 1 + k 3 p H 2 0.5 + k 4 p H 2 O k m o l   k g c a t 1 s 1
The values of these kinetic parameters ( k 1   k 7 ) of the rearranged kinetic model are given in Appendix B (Table A1), which assisted in developing the process. A well-established commercial catalyst, Cu/ZnO/Al2O3 [23], was used in this process. The properties stated in Table 3 are used to define this catalyst in Aspen Plus.

3.2. Flowsheet Description

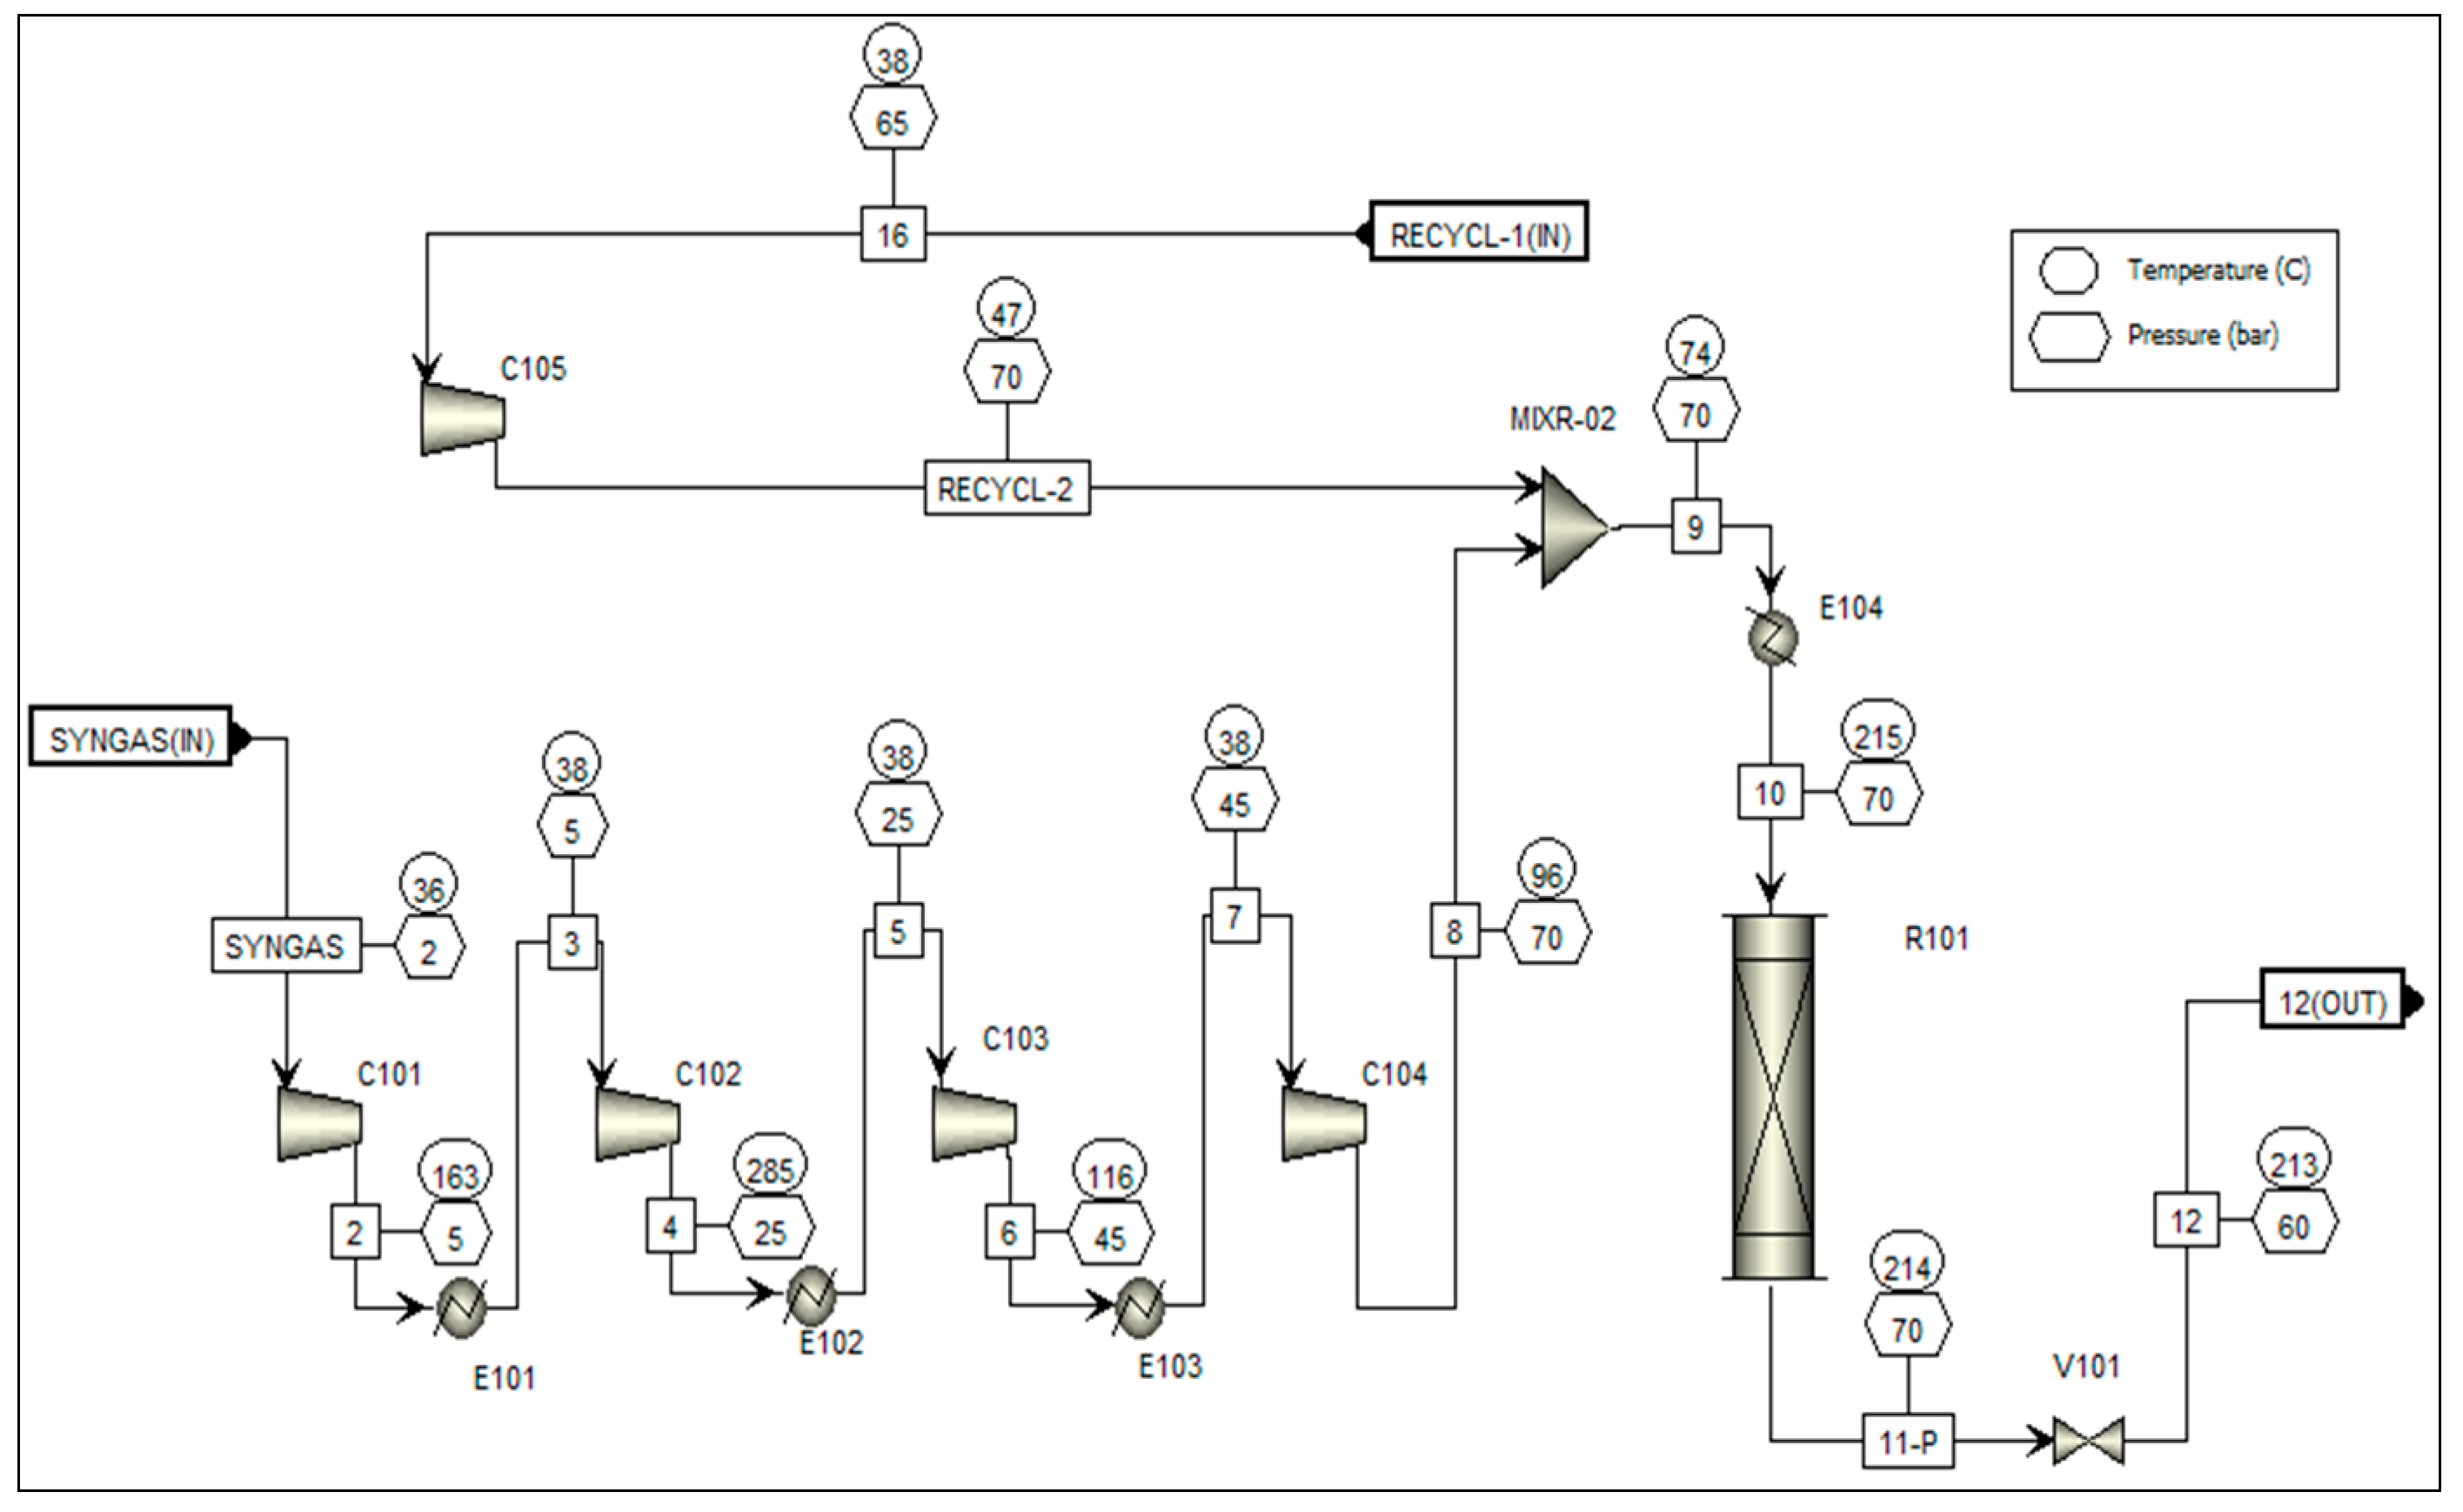
To build the process flowsheet, the temperature, pressure, flow rate, and composition of all material streams were specified. It is essential to define the specific design and operation parameters for every process unit to fulfill its degrees of freedom. Since the pretreated feed was taken to build this process, the flowsheet (Figure 2 and Figure 3) of the process consists of only two units—a reactor unit and the separation unit. The reactor unit is configured with several compressors, coolers, heat exchangers and a reactor. The feed was compressed through a series of four compressors with the intermediate cooling system. After compression, the stream was passed through a mixer where the recycle stream was mixed. Then, the resulting stream was heated to the reaction temperature by a heat exchanger/heater and afterward fed into the reactor. A plug flow reactor (PFR) was modeled by considering the condition of the Lurgi-type reactor. A thermal fluid was passed through the shell side of the reactor to remove the excess heat and make the conversion higher. In this study, a large amount of thermal fluid was used; thus, the temperature of the fluid remains constant. Therefore, a ‘reactor with constant thermal fluid temperature’ was selected to develop this process in Aspen Plus. This reactor consists of multiple tubes where the catalyst was packed inside this tube. The reported operating conditions of MeOH synthesis are in the ranges of 15–75 atm and 180–280 °C. The pretreated feed stream was compressed using four compressors (C-101, C-102, C-103, and C-104) with an inter-stage cooler (E-101, E-102, and E-103) to cool down the feed stream. In case of high compression, the output from C-101 becomes very hot, which increases the compression duty of C-102. To avoid this situation, a cooler was used after each compressor, and only after compressor C-104, a heater E-104 was used to heat the stream to gain the operating temperature. Instead of using one large compressor, four small size compressors were used to split the loads and make the process more efficient [29]. Then, the stream was introduced to reactor R-101, which is a plug flow reactor with constant thermal fluid temperature.
In the MeOH synthesis process, the conversion per pass through a packed bed is low, causing MeOH synthesis reactions to be restricted by equilibrium consideration. Thus, the recycling of unconverted gases is needed to make the process economically viable. To recycle the unconverted gases, it was needed to separate this gas from crude MeOH at first. Generally, crude methanol contains water, dissolved gases, and small amounts of by-products such as methyl–formate, acetone, and some higher alcohol. In this study, it is assumed that no by-product is formed except water. Thus, for separating the water and dissolved gases, a subsequent separation unit was included. The separation unit contains two flash separators followed by a distillation column. In the beginning of the separation unit, water and methanol were separated through the first flash drum, while the unconverted gases (CO, CO2, H2) were recycled with a ‘recycle ratio’ equal to 90% to improve the methanol yield. The schematic flowsheet of the separation unit is shown in Figure 3.
The outlet stream of the reactor R-101 mainly consists of non-reacted reactants, methanol and water. The stream was then cooled (E-105) and depressurized (V-101), which was then sent to a flash-separator (S-101) for separation over two phases. The gaseous phase was then split using SPLTR-01 into two flows. Most of that flow was recycled back to the reactor using mixer MIXR-02, while the second part was purged out through PURGE. The liquid phase was depressurized (V-102 and V-103) to 1 bar, and then, the stream was flashed (S-102) to remove several light components. Hereafter, the liquid stream from the flash tank was then heated (E-106) and channeled to a distillation column. Here, a rigorous distillation column (D-101) was used for purifying the crude MeOH. For modeling the rigorous distillation column, at first, a short cut distillation column was simulated to calculate the minimum reflux ratio. Then, the optimum reflux ratio was calculated by multiplying the minimum reflux ratio with 1.2 to 1.3 [30]. This optimum reflux ratio was considered as the design reflux ratio for a rigorous distillation column. Here, the reflux ratio was equal to 0.4426 and had twenty stages. The distillation column had two sections: one was the rectifying section (CS-1) and another one was stripping section (CS-2). Other specifications of this rigorous distillation column are stated in Table 4. All the blocks of the separation unit were simulated in Aspen plus using the ‘IDEAL’ property method.

3.3. Flowsheet Analysis

After developing the process flowsheet, the process parameters were analyzed and then optimized to increase the yield. Here, the ‘model analysis tool’ of Aspen Plus was used for this analysis and optimization. Two type of process parameters are studied: dimensional parameters and operational parameters. The length, diameter, and number of the tube were analyzed as dimensional parameters, while the reactor temperature, pressure and thermal fluid temperature were studied as operational parameters. These parameters were analyzed with respect to the conversion which was calculated using the following equations (Equations (12) and (13)).
R e a c t o r   C o n v e r s i o n = ( F C O , 10 + F C O 2 , 10 ) ( F C O , 11 + F C O 2 , 11 ) ( F C O , 10 + F C O 2 , 10 )
O v e r a l l C o n v e r s i o n = F C O , 8 + F C O 2 , 8 F C O , p u r g e + F C O 2 , p u r g e + F C O , 15 + F C O 2 , 15 F C O , 8 + F C O 2 , 8
Here, F i , j = molar flow rate of the i component in the j stream of the developed flowsheet (kmol h−1).

3.3.1. Sensitivity Analysis

The steady-state behavior of the process as a function of the process parameters (mentioned in Section 3.3) is investigated by performing sensitivity analysis. The ‘sensitivity tool’ of Aspen Plus was used for this purpose. In this tool, the selected parameter was introduced as a ‘manipulated variable’. To tabulate the conversion with respect to manipulated variables, the required equation (Equations (14) and (15)) was introduced as a Fortran statement. Then, the simulation model was executed for different manipulated variables. Based on these resulting conversion values, the number of graphs was formulated with selected parameters. Table 5 represents a summary of the sensitivity analysis, which was performed in this study.

3.3.2. Model Optimization

For developing an efficient and economical process, it is necessary to optimize the process parameter. Optimization has an enormously positive impact on MeOH synthesis [10]. According to Giulia Bozzano et al. [10], the optimization of a process is divided into two main classes: one is the optimization for design purposes (dimensional optimization) and the other is optimization for operational purposes (operational optimization). Sequential Quadratic Programming (SQP) was used as an optimization technique to optimize the baseline case. In this study, optimization is performed by the Aspen Plus Optimization tool, using the built-in SQP technique. In the optimization tool, the SQP technique follows the quasi-Newton nonlinear programming algorithm. Tear streams, equality and inequality constraints simultaneously converged with the optimization operation. Tear equations were not satisfied until the optimum point was located, since the SQP algorithm involves just one pass through the flowsheet per iteration [31]. Table 6 represents the specification that was required to perform the optimization approach in the Aspen Plus. The values of the individual constraint were taken from the sensitivity analysis. Dimensional optimizations are carried out on the length, tube diameter and number of tubes in the reactor. On the other hand, operational optimization of parameters such as temperature, pressure and the thermal fluid temperature was also achieved.

3.4. Analysis of the MeOH Synthesis Efficiency

After optimizing the baseline process, it was necessary to modify this process by changing the feedstock to attain the objective of this study. The newly modified process was needed to remain in similar conditions to the baseline process for comparing the MeOH production from different sources. But the pre-established treatment procedure for various feedstocks was not similar due to the versatile variability of the composition of different feedstocks. Therefore, except for the pretreatment unit (section), all other units had been kept at the same as the baseline case in the newly constructed process. The feed compositions for the FG to MeOH and COG to MeOH processes are stated in Table 1. After developing the process for all feedstocks (SG, FG, and COG), a comparative analysis was studied by calculating the SN, recycle ratio, reactor conversion, and overall conversion. The conversion of SG to MeOH and the COG to MeOH synthesis process were calculated by Equations (12) and (13).
Due to the absence of CO in FG, Equations (14) and (15) were used for calculating the conversions of FG to MeOH. The recycle ratio was calculated by Equation (16). In all cases, the molar flow rate of the reactor feed was maintained at 10,000 kmol h−1.
R e a c t o r   C o n v e r s i o n F G t o M e O H = F C O 2 , 10 F C O 2 , 11 F C O 2 , 10
O v e r a l l   C o n v e r s i o n F G t o M e O H = F C O 2 , 8 F C O 2 , p u r g e + F C O 2 , 15 F C O 2 , 8
Here, F i , j = molar flow rate of the ith component in the jth stream of the developed flowsheet (kmol h−1).
R e c y c l e R a t i o = F 10 ( F 15 + F P u r g e ) F 8
Here, F i = molar flow rate of the ith stream of the developed flowsheet (kmol h−1).
For comparative analysis, two further parameters, such as the changing behavior of conversion with respect to SN and recycle ratio, were studied using performing sensitivity analysis in Aspen Plus for each process separately. Here, SN was varied based on the molar composition/flow rate of hydrogen in the reactor feed, and the recycle ratio was calculated by changing the purge fraction. Sensitivity analysis for studying the effect of SN and recycle ratios is given in Table 5 (S-6 and S-7).

3.5. Heat Integration

Heat integration was carried out for three MeOH synthesis processes with the aim of investigating interprocess heat-exchanging capabilities. This interprocess heat exchange reduced the external hot and cold utility requirements at a cost of adding the heat transfer area. Heat integration was carried out to maximize the heat recovery between the hot and cold process streams of each MeOH synthesis process at a minimum temperature difference (ΔTmin). At ΔTmin, also known as a process pinch point, minimum external hot and cold utility requirements (targets) were determined for each process after the maximum possible heat recovery between process streams [32]. Heat integration based on process pinch analysis also calculated heat exchanger area requirements for possible heat recovery. Composite curves were generated at first in the pinch analysis for the above utilities and area targeting. After that, a heat exchanger network (HEN) was designed to achieve those targets. A couple of rules were followed (from previous studies) during the HEN design based on process pinch analysis in this study [33,34]. The pinch analysis divided the MeOH production process in two parts: heat source (below pinch) and heat sink (above pinch). No cross-pinch heat exchange was allowed to avoid the higher utility requirements other than the composite curve targeting. In addition, external hot utilities were used only above the pinch at the heat sink, whereas cold utilities were allowed only in the heat source.
Aspen Energy Analyzer (AEA) software(v10.0) was used for the heat integration in this study. Required energy stream data such as temperature, heat duty, heat capacity, etc. was extracted from the developed MeOH synthesis processes and was used as an input of AEA for composite curve construction. The in-built hot and cold utilities of the AEA were used to determine the minimum external utility requirements (targets). Then, an HEN design was started with the objective of maximizing the interprocess heat recoveries for achieving external utility targets. Initially, energy streams were developed in the AEA where each sub-process operated independently without any heat recovery. Then, an integrated HEN was designed for heat transfer between all the streams. Finally, with the assistance of the in-built optimization tool for achieving heat integration objectives, several HEN designs were generated for each MeOH synthesis process, and one was selected based on achieving utility targets and area requirements.

4. Result and Discussion

4.1. Optimization of Baseline Case

The baseline case—SG to MeOH production process—was optimized by dimensional and operational parameter optimization. Dimensional optimization was completed by analyzing the effect of length, diameter, and number of tubes, while the operational parameter optimization was completed by analyzing the effect of reactor temperature, pressure, and thermal fluid temperature on reactor conversion during MeOH production.

4.1.1. Optimization of Dimensional Parameters

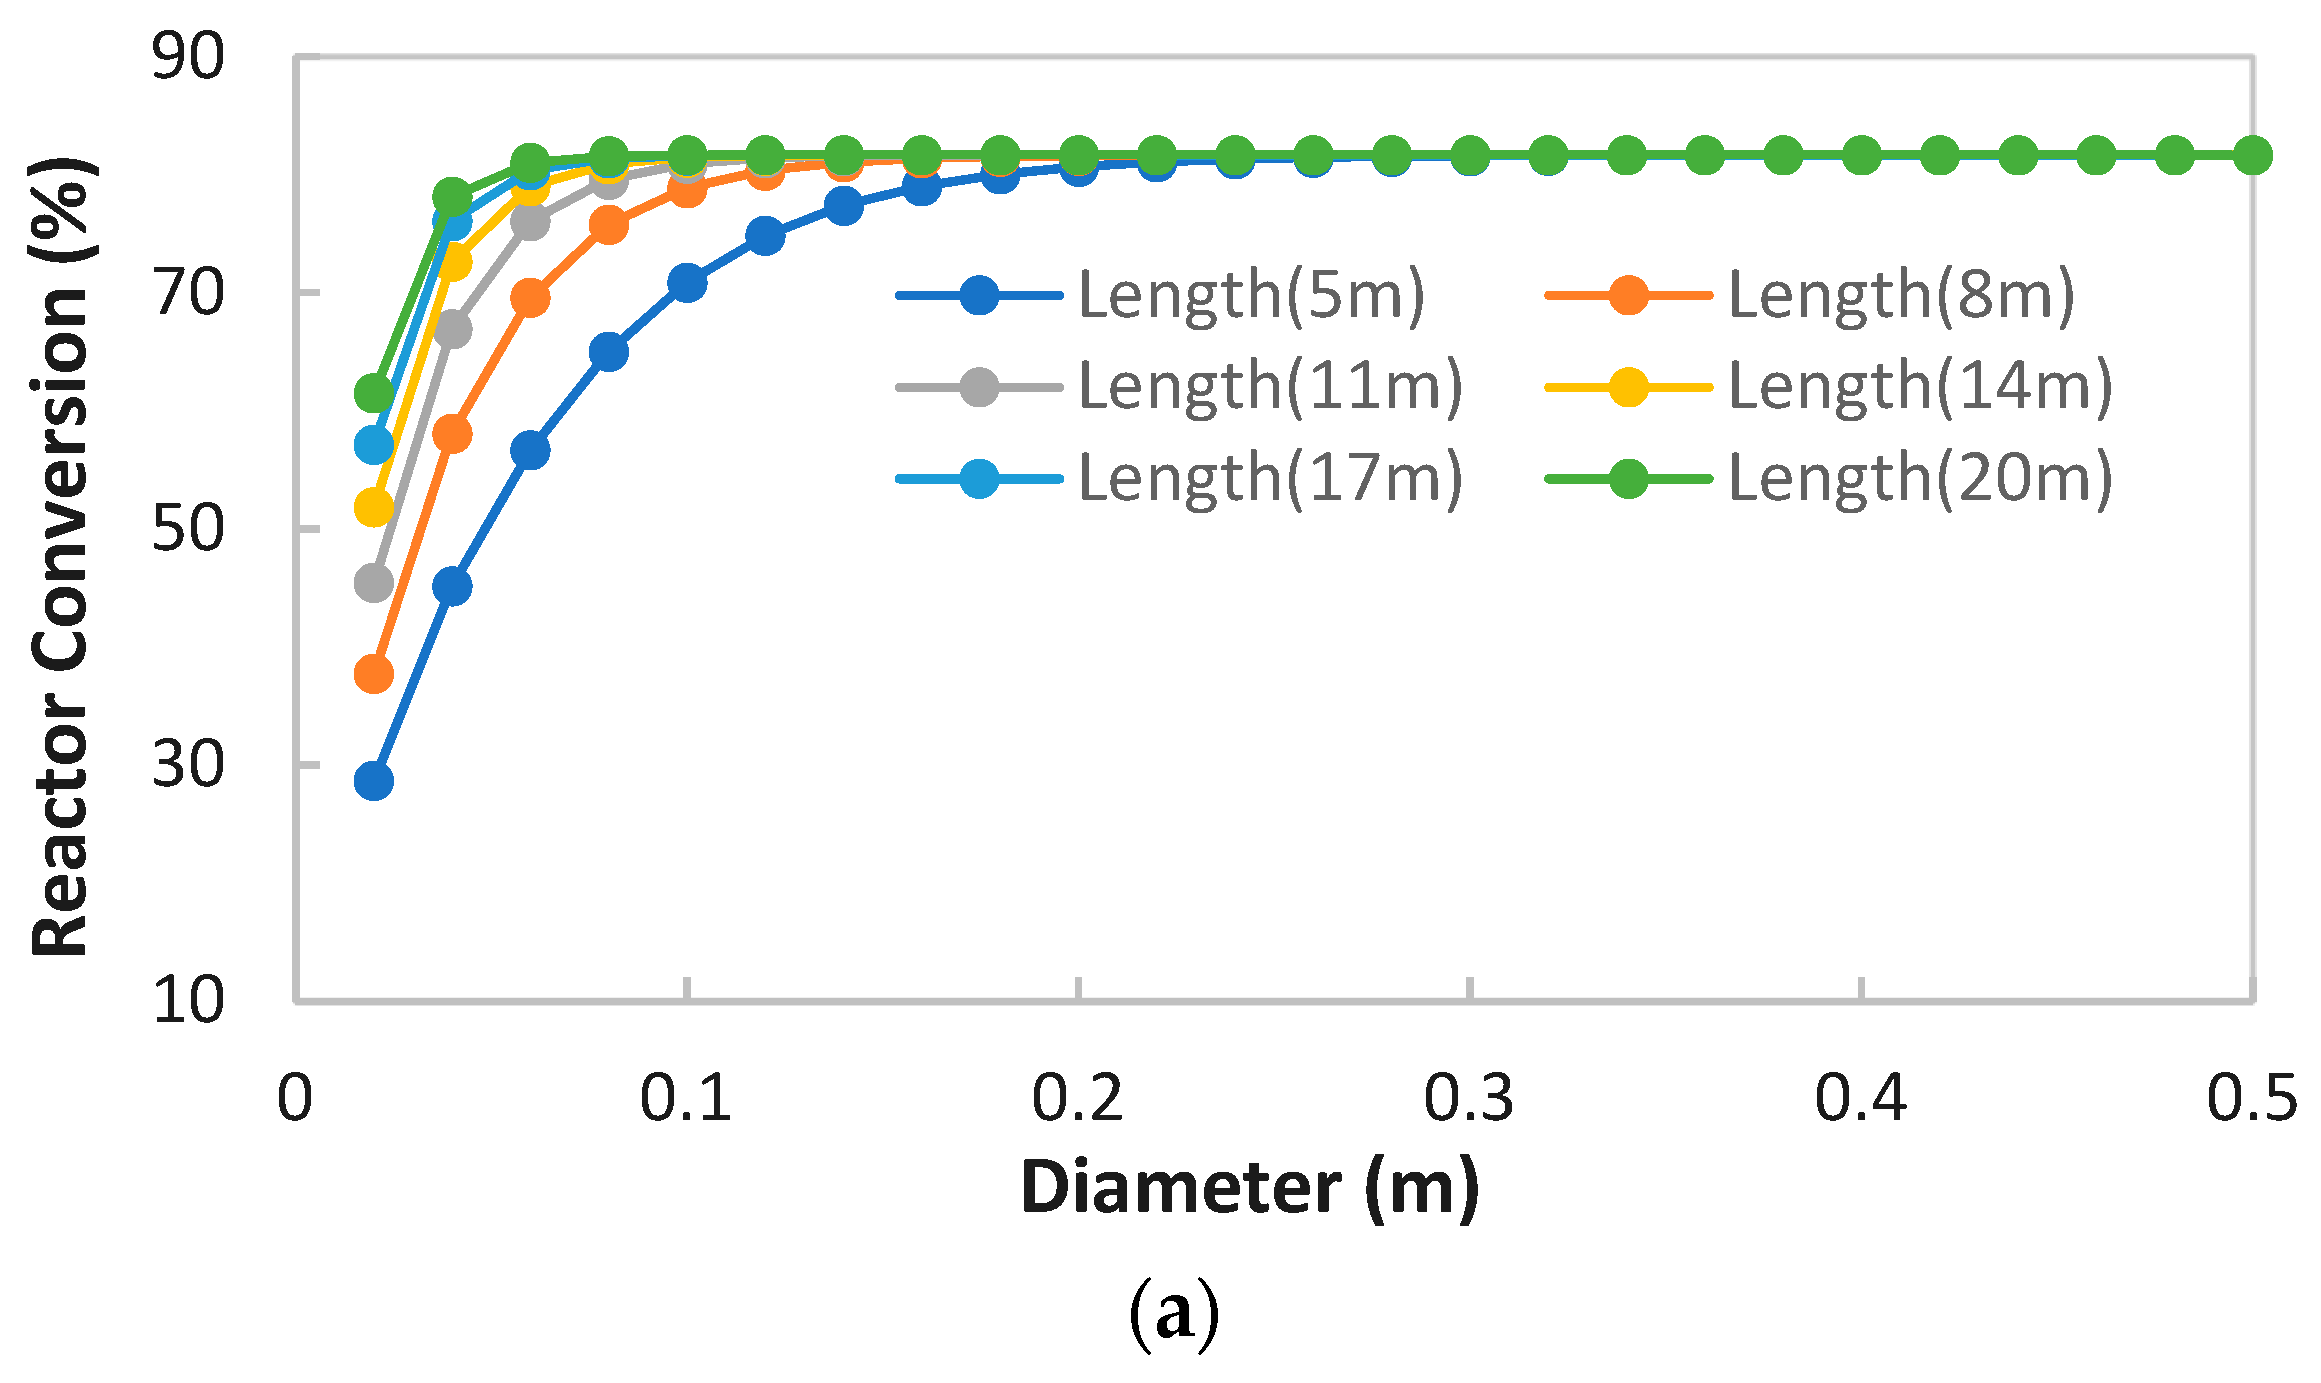
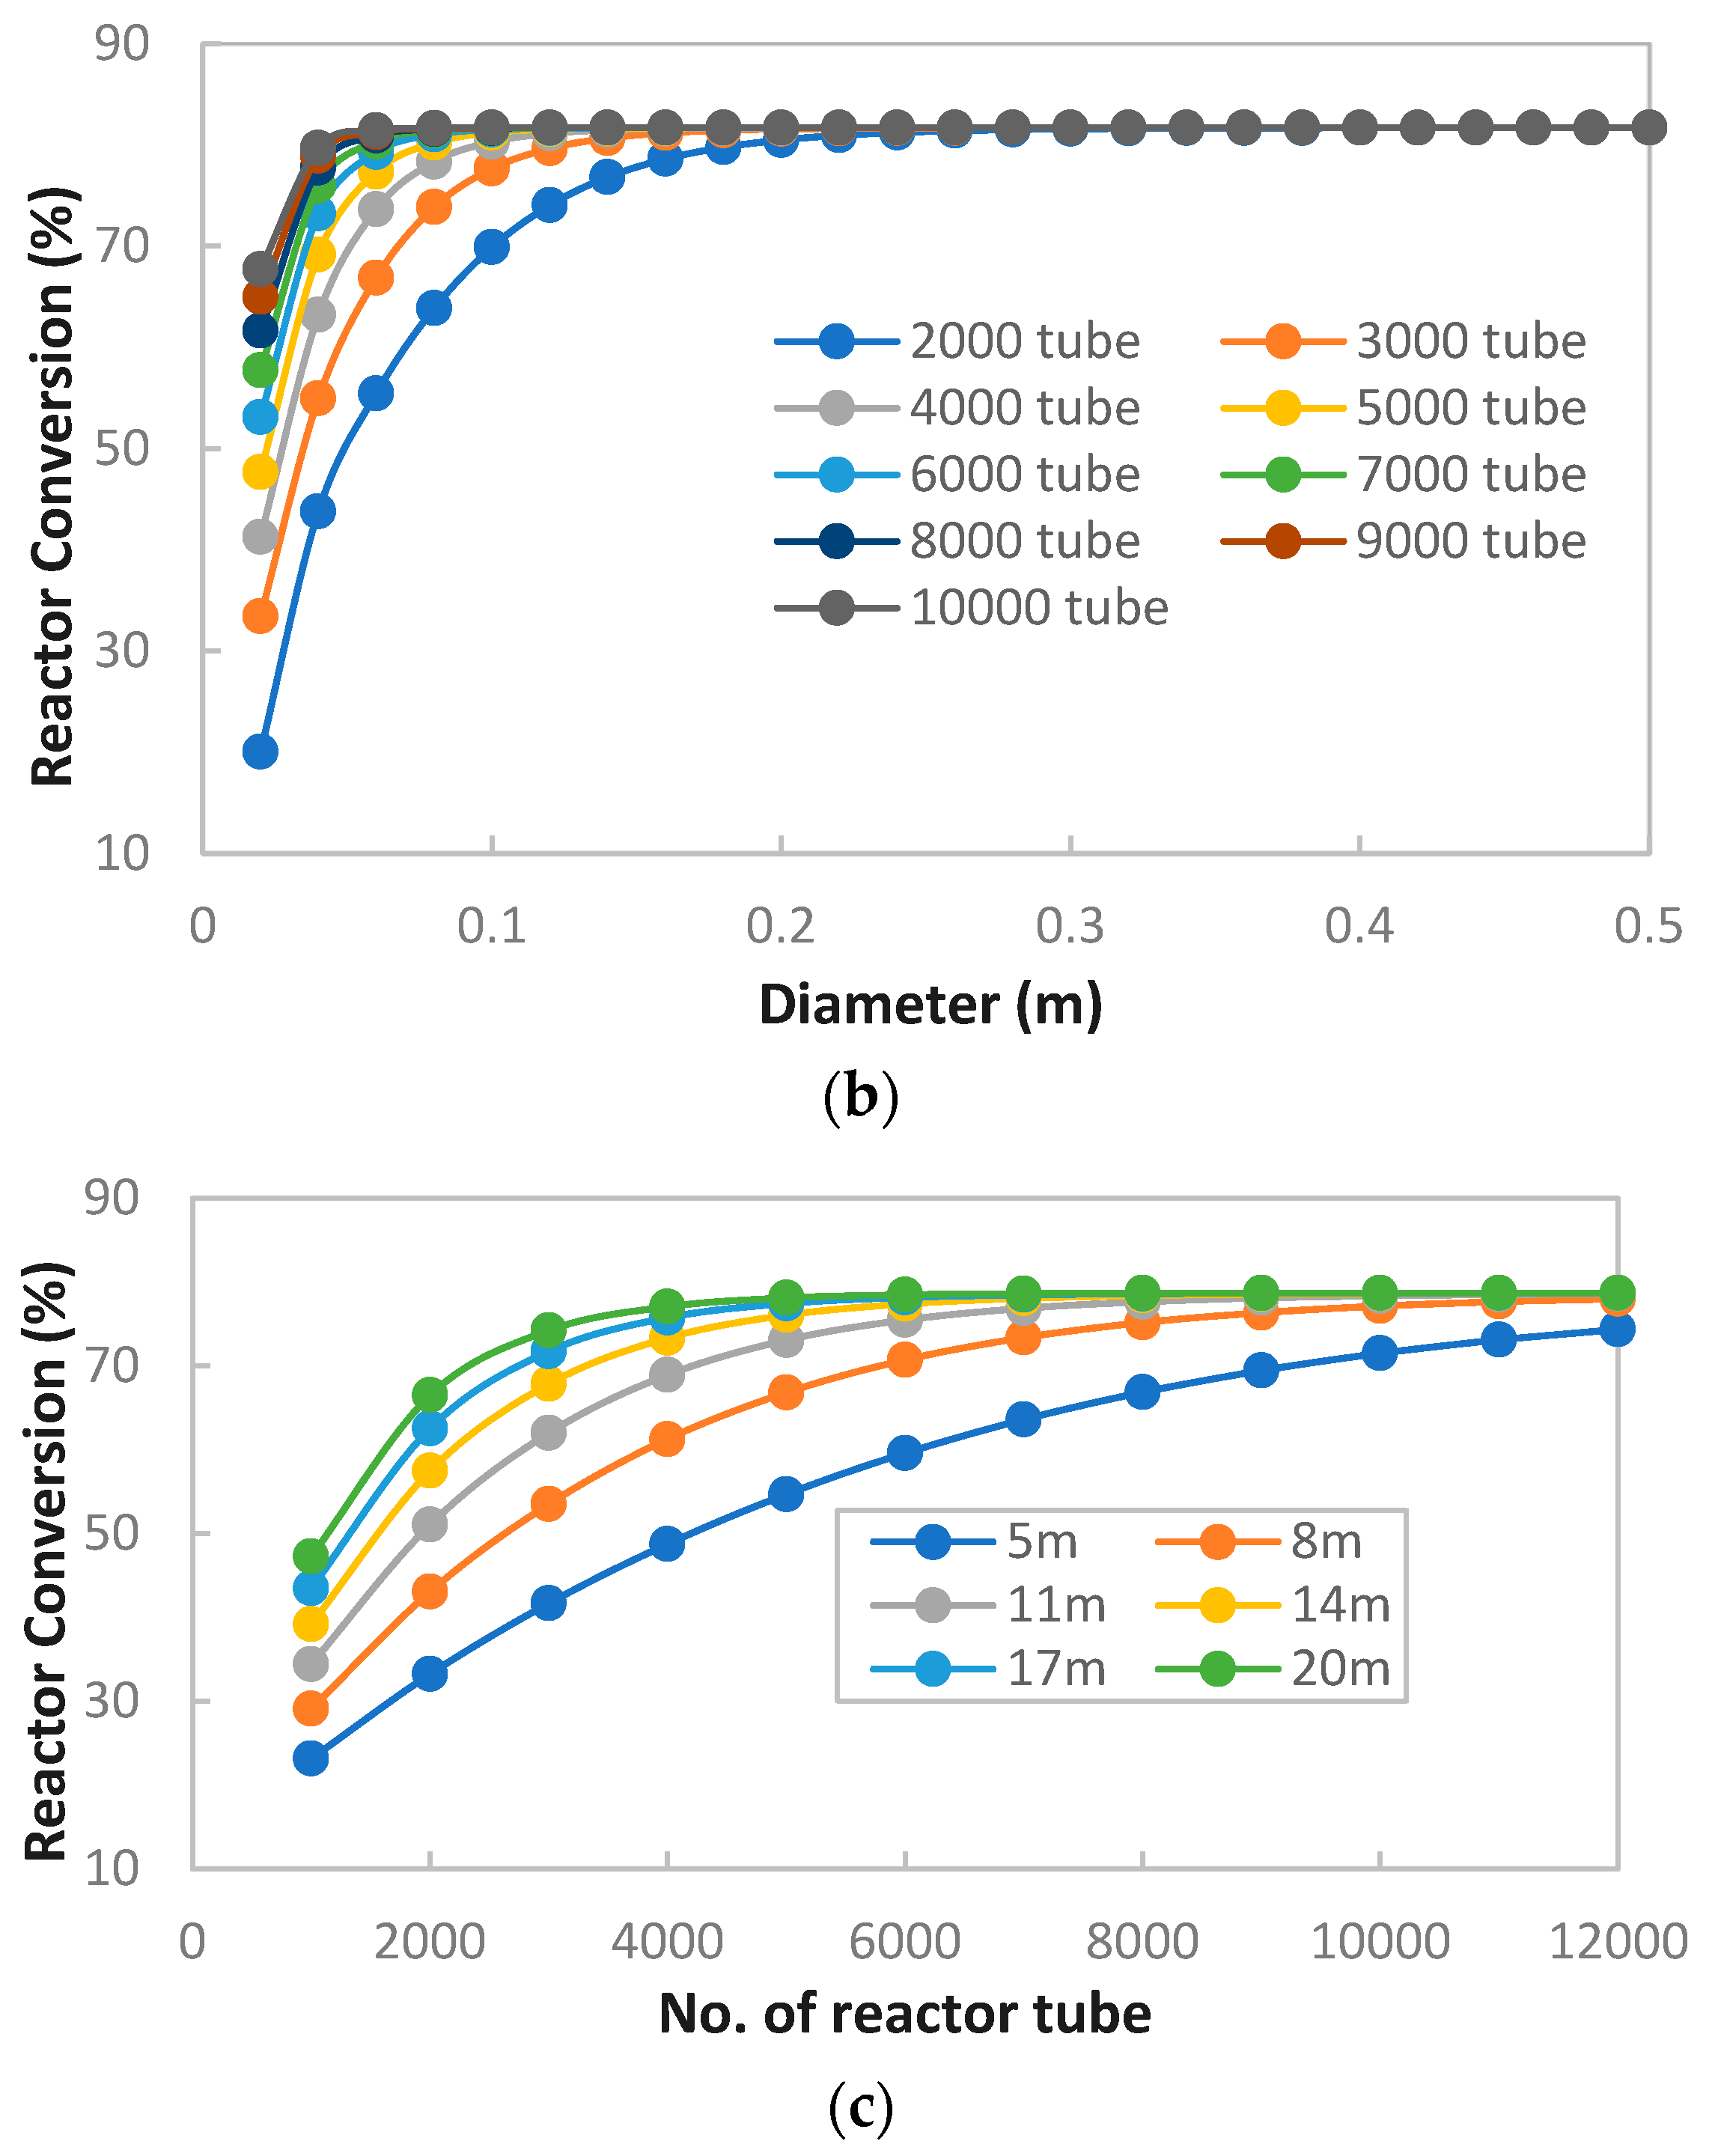
Analysis of the results of S-1, S-2, and S-3 is depicted in Figure 4, which illustrates the effect of changing the reactor volume on reactor conversion. A plug flow reactor (PFR) is being used in MeOH synthesis, and this reactor volume can be changed with the variation of number, length, and diameter of tubes used. Figure 4a shows that the reactor conversion reduces with the decrease in tube diameter, whereas the volume of the reactor remains unchanged. The pressure drop is increased with decreasing the diameter, and thus, superficial mass velocity is increased. The retention time is inversely changed with the velocity, and this retention time has a positive effect on the conversion increase [25]. Thus, with the diameter increasing, conversion can be maximized (Figure 4b). But the increase in diameter raises the chance of gas channeling and decreases the ratio of the heat transfer surface area [25].
Again, in the case of enhancing the length and number of tubes, the conversion is changed positively. This enhancement of the length and number of tubes in a reactor is limited by capital cost and operational costs. Now, the length, diameter, and number of tubes in the reactor need to be optimized so that the required volume for the maximum conversion should be minimized. The main objective of this optimization is to minimize the volume of the reactor with a feasible conversion. From Figure 4a–c, it is seen that increasing the reactor conversion after 75% is not feasible, although the dimensional variable is changed. Therefore, in constraint C-1, 75% conversion is set as the highest value. Likewise, the values of 14 m length, 0.04 m diameter, and 5000 tubes were incorporated in the constraint specifications of C-2, C-3, and C-4 respectively. These stipulated values are selected based on an analysis of the results obtained from sensitivity analysis of S-1, S-2, and S-3. The optimized results are presented in Table 7.

4.1.2. Optimization of Operational Parameters

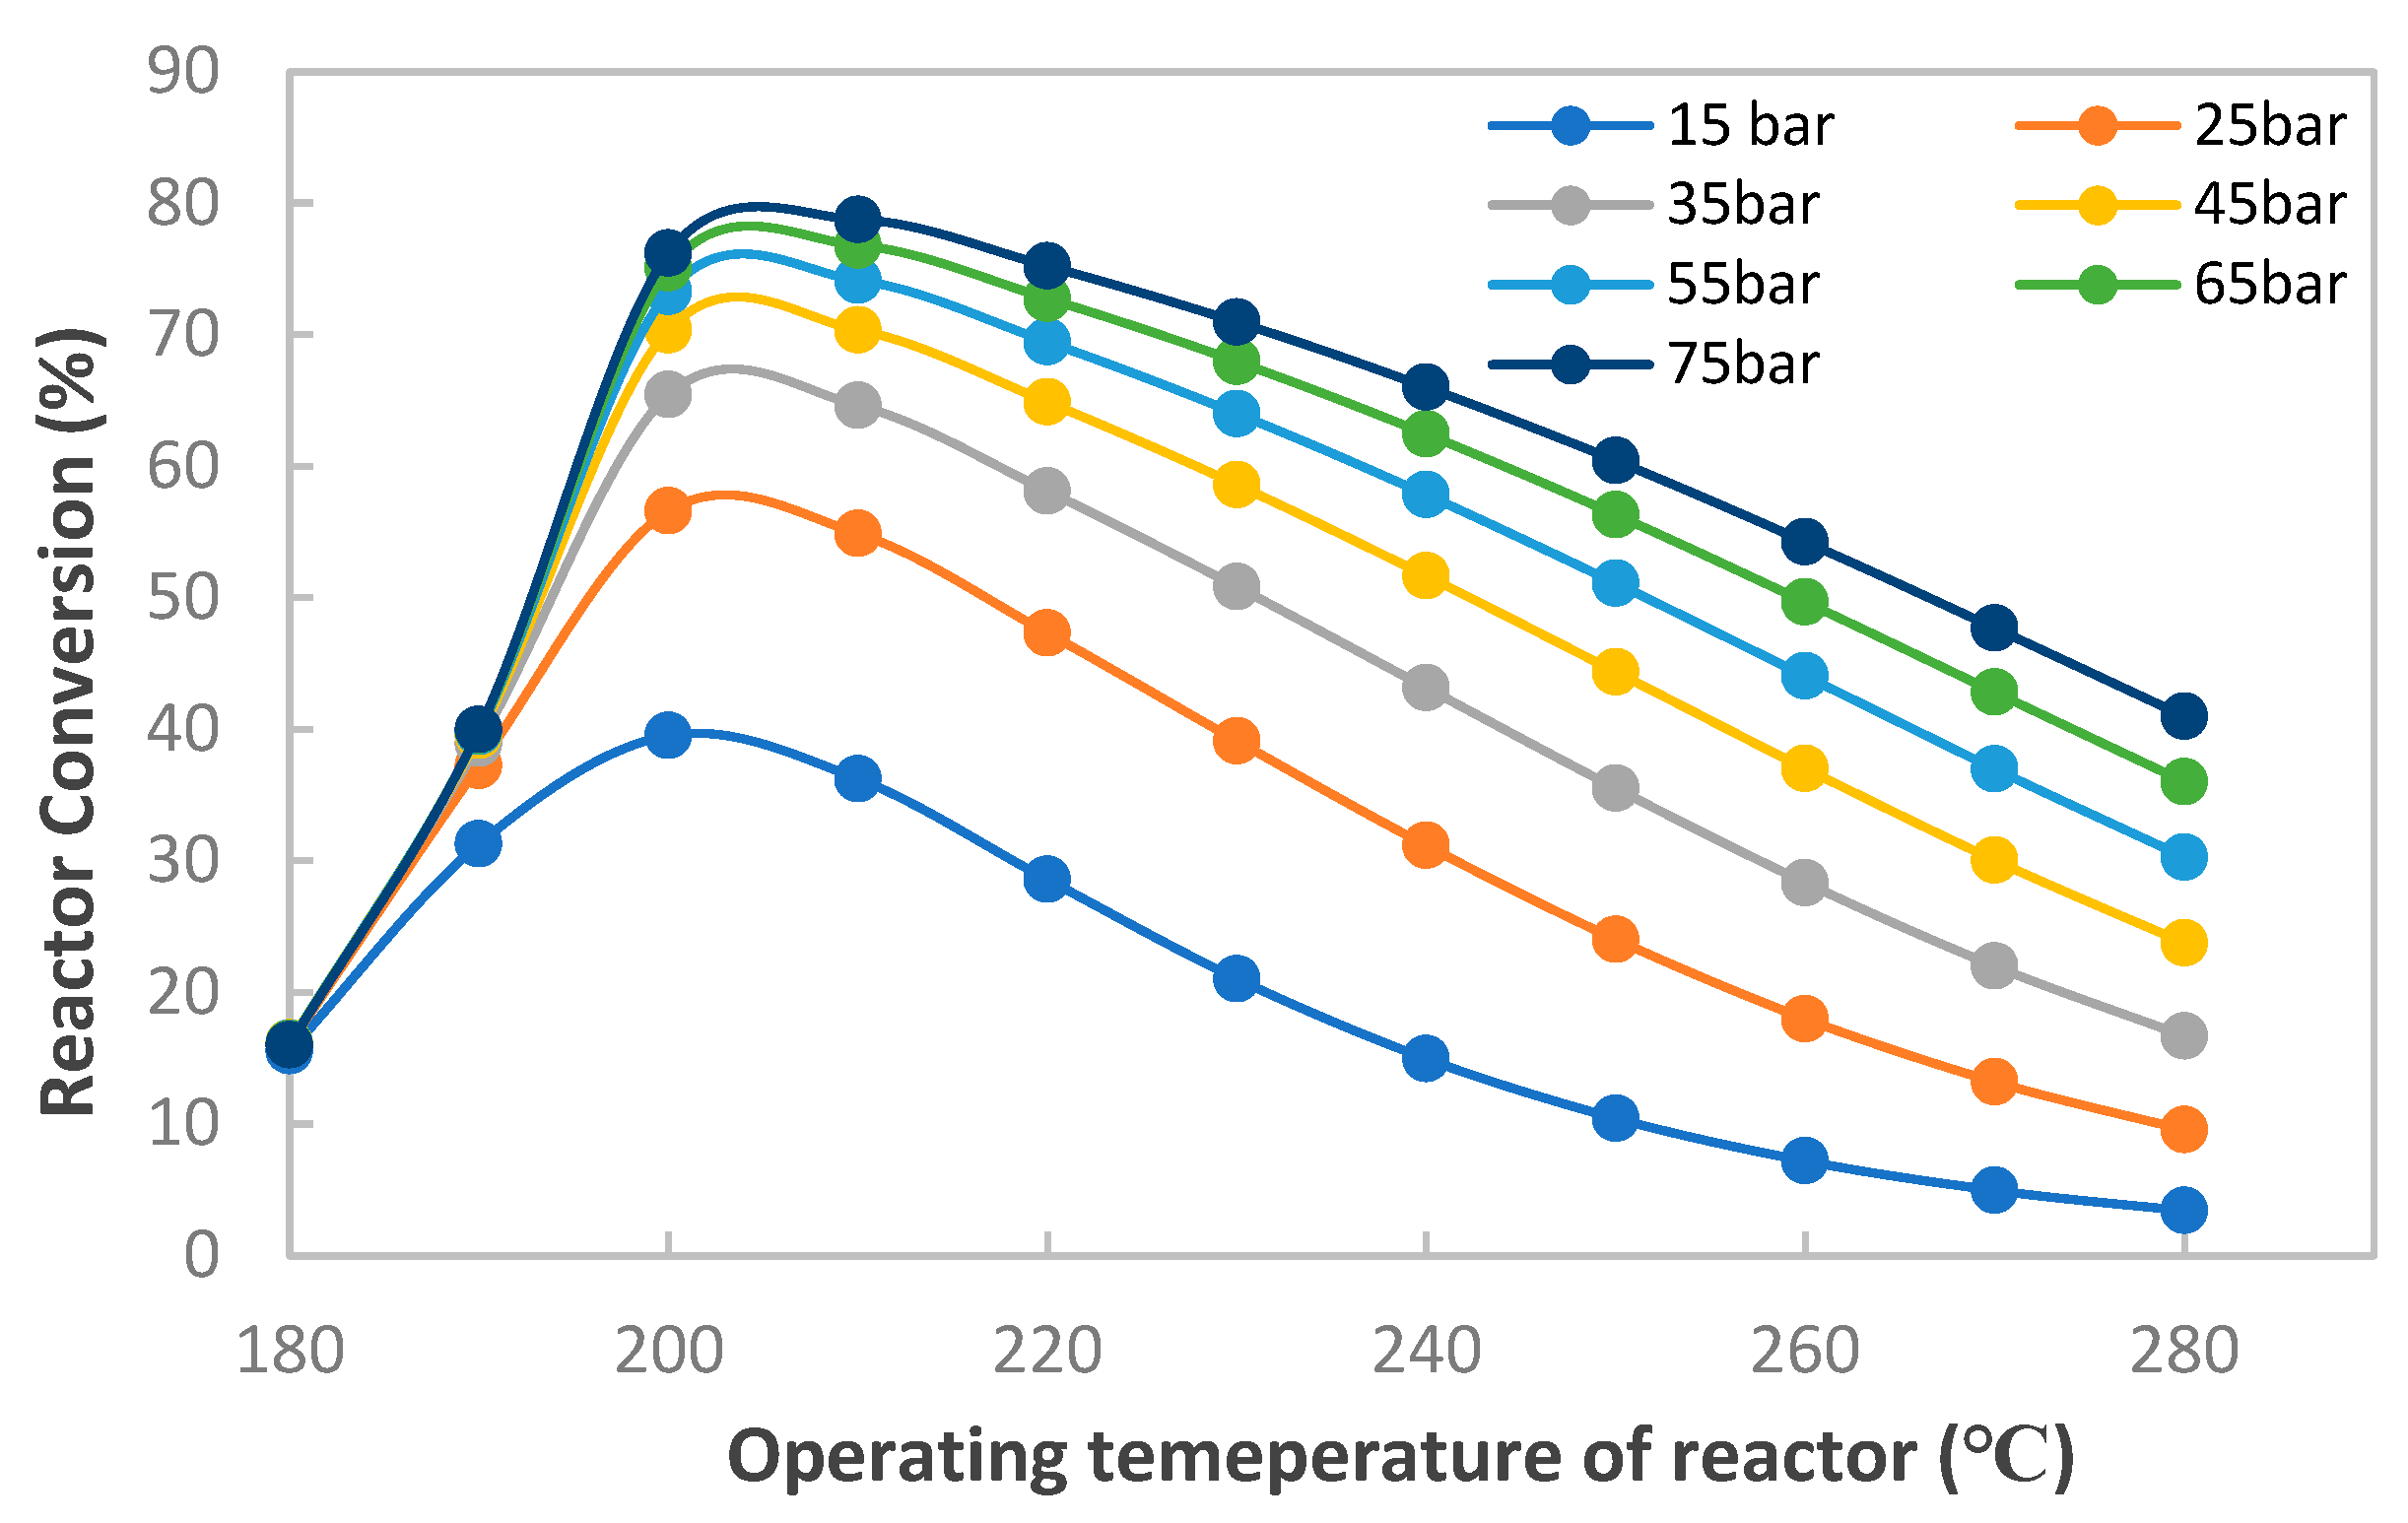
Operational optimization was completed by varying the operating parameters of the MeOH production processes. The considered operational parameters were the reactor temperature, pressure, and thermal fluid temperature. To observe the effect of these parameters on reactor conversion, sensitivity analyses such as S-4 and S-5 were conducted. The pressure of the feedstock material has a significant impact on the yield and conversion of the reactor. By varying the pressure (15–75 bar) and temperature (180–280 °C) of the reactor inlet stream, the sensitivity analysis S-4 was performed for the reactor conversion analysis.
The resulting curve of the sensitivity analysis (S-4) is presented in Figure 5, which depicts that the reactor conversion is maximized with increasing pressure and in a specific temperature range. After this temperature range, the conversion rate decreased with the temperature increase. The MeOH synthesis reaction is reversible and exothermic. According to Le Chatelier’s principle, at lower temperatures, it is kinetically limited, and at higher temperatures, it is limited by equilibrium [19,22]. But the rWGS reaction is more favored in high temperatures because it is endothermic in nature. On the other hand, sintering phenomena may happen at high temperatures, which can interfere with the catalyst activity, resulting in lower conversion [27]. Again, the MeOH synthesis reaction proceeds with a decrease in the number of moles. Hence, the rate of reaction and subsequent conversion is increased by increasing the reactor pressure. However, operating the reactor at a high pressure brings some complications, such as higher operating and capital cost as well as safety issues [19].
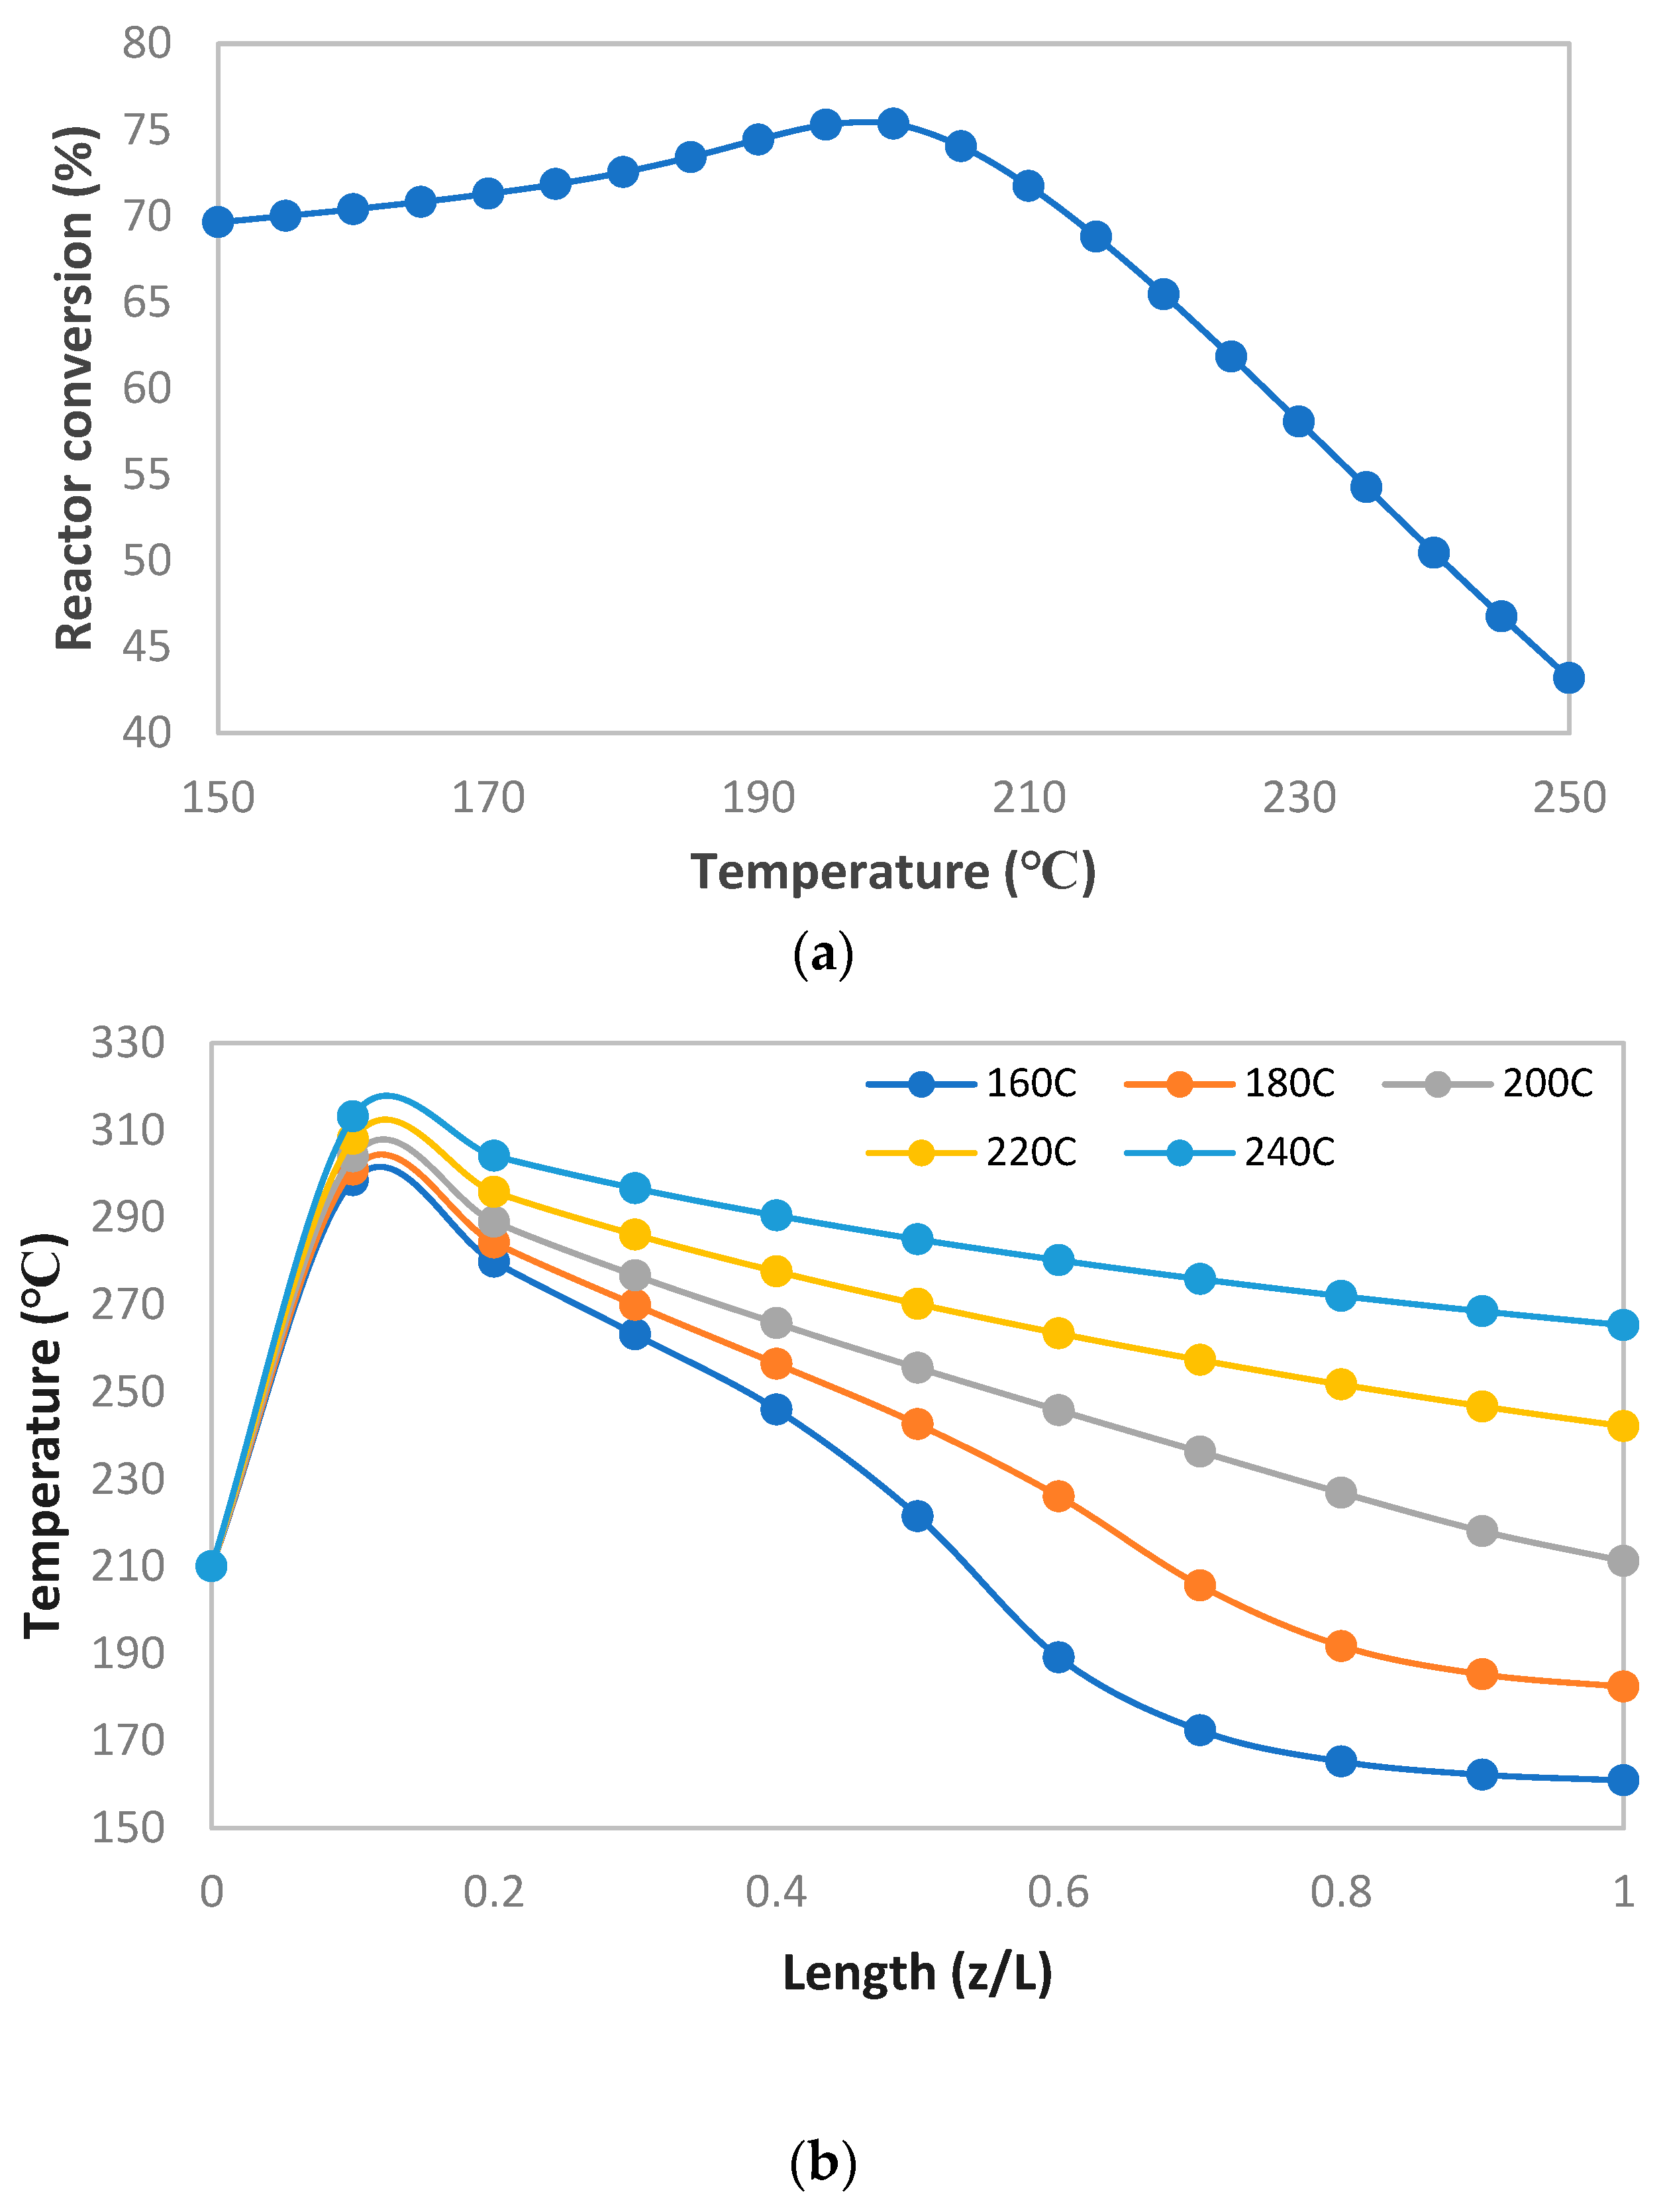
By circulating a thermal fluid in the shell side of the reactor, the effect of excessive heat formation during MeOH synthesis had been controlled. The reactor conversion greatly depends on this inlet temperature of the thermal fluid. The pattern of conversion with thermal fluid temperature change and the temperature profile within the reactor are illustrated in Figure 6a,b. This conversion pattern is generated by S-5 sensitivity analysis, where the thermal fluid temperature is manipulated from 150   t o   250   ° C . From Figure 6a, it is observed that the conversion is increasing with thermal fluid temperature, but after a while, it is decreased drastically.
This is because the temperature gradient is changed with the thermal fluid temperature and, thus, the heat removing rate is also varied. For increasing the conversion, it is necessary to maintain an optimum reaction temperature range inside the reactor, and this reaction temperature is controlled by the heat-removing mechanism of thermal fluid [25]. Figure 6b depicts the temperature profile inside the reactor at different thermal fluid temperatures. Figure 6b shows that the reactor temperature is increasing along the length of the reactor, but it is decreased later. A provable reason might be that the reaction takes place rapidly at the entrance because of the abundance of a reactant. Thus, the heat-releasing rate is much higher than the removal rate of thermal fluid at the entrance of the reactor. This abundance of reactant decreases further from the entrance of the reactor as well as increases the product concentration. These also restrain the reaction from moving forward. Hence, the heat releasing rate goes lower along with the moving further from the reactor entrance. The temperature profile for 160   ° C and 180   ° C depicts that the heat removal rate is not constant with the heat releasing rate. But, in other temperatures, these heat removal and releasing rates remain constant. This behavior can affect the reactor conversion rate. Therefore, it must be necessary to optimize this operating temperature, pressure, and thermal fluid temperature for a better performance of the process.
By performing the operational optimization, the operating parameters are optimized. In operational optimization, three constraints are specified by analyzing Figure 6a,b to achieve the objective. Here, an 180   ° C reactor temperature, 70 bar pressure, and 180   ° C thermal fluid temperature are selected as constraint values for C-1, C-2, and C-3, respectively. The result of the operational optimization is stated in Table 8.

4.2. Comparative Analysis

Using the optimized values, the SG to MeOH process was rebuilt, producing 2902.09 kmol h−1 methanol with 75.39% reactor conversion and 0.60 yield. Chen et al. also worked on optimizing the methanol production from SG using a Lurgi-type reactor and reported 0.20 methanol yield [35]. The optimized dimensional parameters of the reactor were 7 m length, 0.4 m diameter, and 1620 tubes, whereas the optimized operational parameters were 236 °C, and 69.7 bar. The Lurgi-type reactor used a counter-current thermal fluid flow, and the untreated syngas feed was 6264.8 kmol h−1 in the study carried out by Chen et al. [35]. On the other hand, in this study, to build up a baseline case, a treated hypothetical syngas was used and a 10,000 kmol h−1 feed flow rate was maintained. An ideal PER with a constant thermal fluid reactor was considered in this research. Table 9 represents the comparison of MeOH production from different feedstocks, and the conversions achieved at dimensional and operational optimized conditions are also tabulated in the same table.
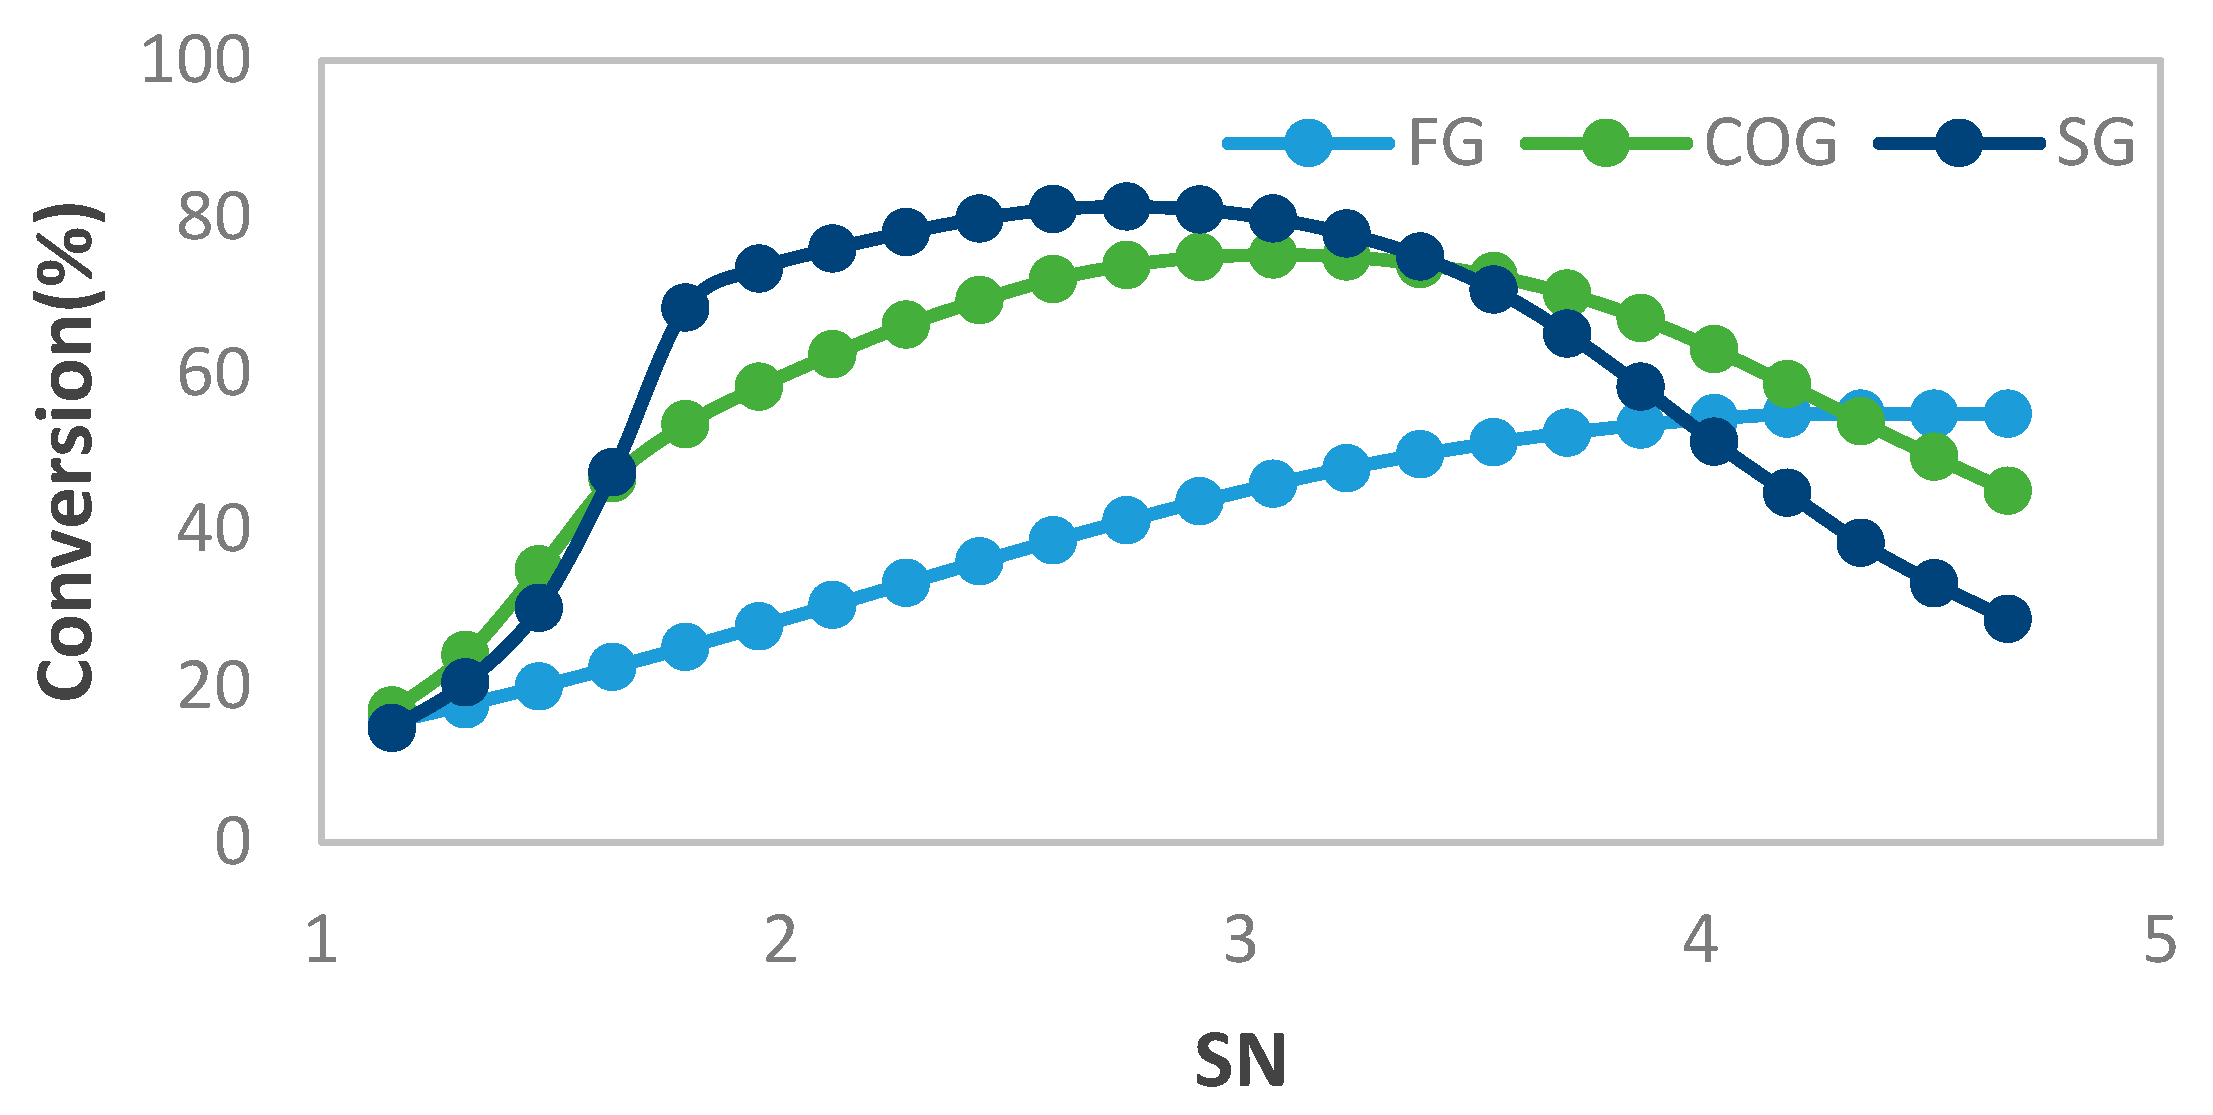
Table 9 shows that the lowest reactor (15.5%) and overall (63.19%) conversion were achieved from the FG to MeOH process at a recycle ratio of 4.76 and SN value of 2.43. However, a relatively higher level of reactor and overall conversion was attained in the MeOH synthesis processes utilizing SG and COG feedstocks, even at comparatively lower SN and recycle ratio values. For instance, when SN was set at 2.1 and the recycle ratio was 1.4, an impressive 94.32% overall conversion was achieved with the SG feedstock. Similarly, during the COG-based MeOH synthesis process, a noteworthy 95.79% overall conversion was achieved at SN 2.7 and a recycle ratio of 2.61. Hence, sensitivity analyses S-6 and S-7 were conducted to examine the impact of varying SN values (ranging from 1.15 to 4.67) and recycle ratios (ranging from 0.45 to 4.67) on conversion levels. The effect of SN on conversion is illustrated in Figure 7, whereas the effect of recycle ratio on conversion is shown in Figure 8. Figure 7 depicts that the values of SN for the highest conversion are 2.75, 4.5 and 3.07 for SG, FG, and COG, respectively, and under these conditions, conversion can be increased by 3.13%, 21.72%, and 0.96% accordingly. Equation (4) portrays that SN increases proportionally with the amount of hydrogen, and it also changes reversely with the amount of CO2. Under ideal conditions, the assumed value of SN is 2 [13], but the optimal value of SN is about 2–2.1 [12]. The higher value of SN means a higher amount amount of hydrogen (H2), and increasing this H2 up to a certain value helps to increase the forward reaction of MeOH synthesis, and it results in higher reactor conversion [10,11].
In contrast, by performing S-7, the effect of recycle ratio on the conversion for all the processes is studied and presented in Figure 8a–c. The recycle ratio for S-7 is calculated by changing the purge fraction between 0.05 and 0.9. The overall conversion was increased with increasing the recycle ratio, while the reactor conversion was decreased. However, after a specific value, this reactor conversion was increased further. The value of the recycle ratio for the highest conversion is 1.83 for SG, 7.14 for FG, and 4.67 for COG.

4.3. Heat Integration

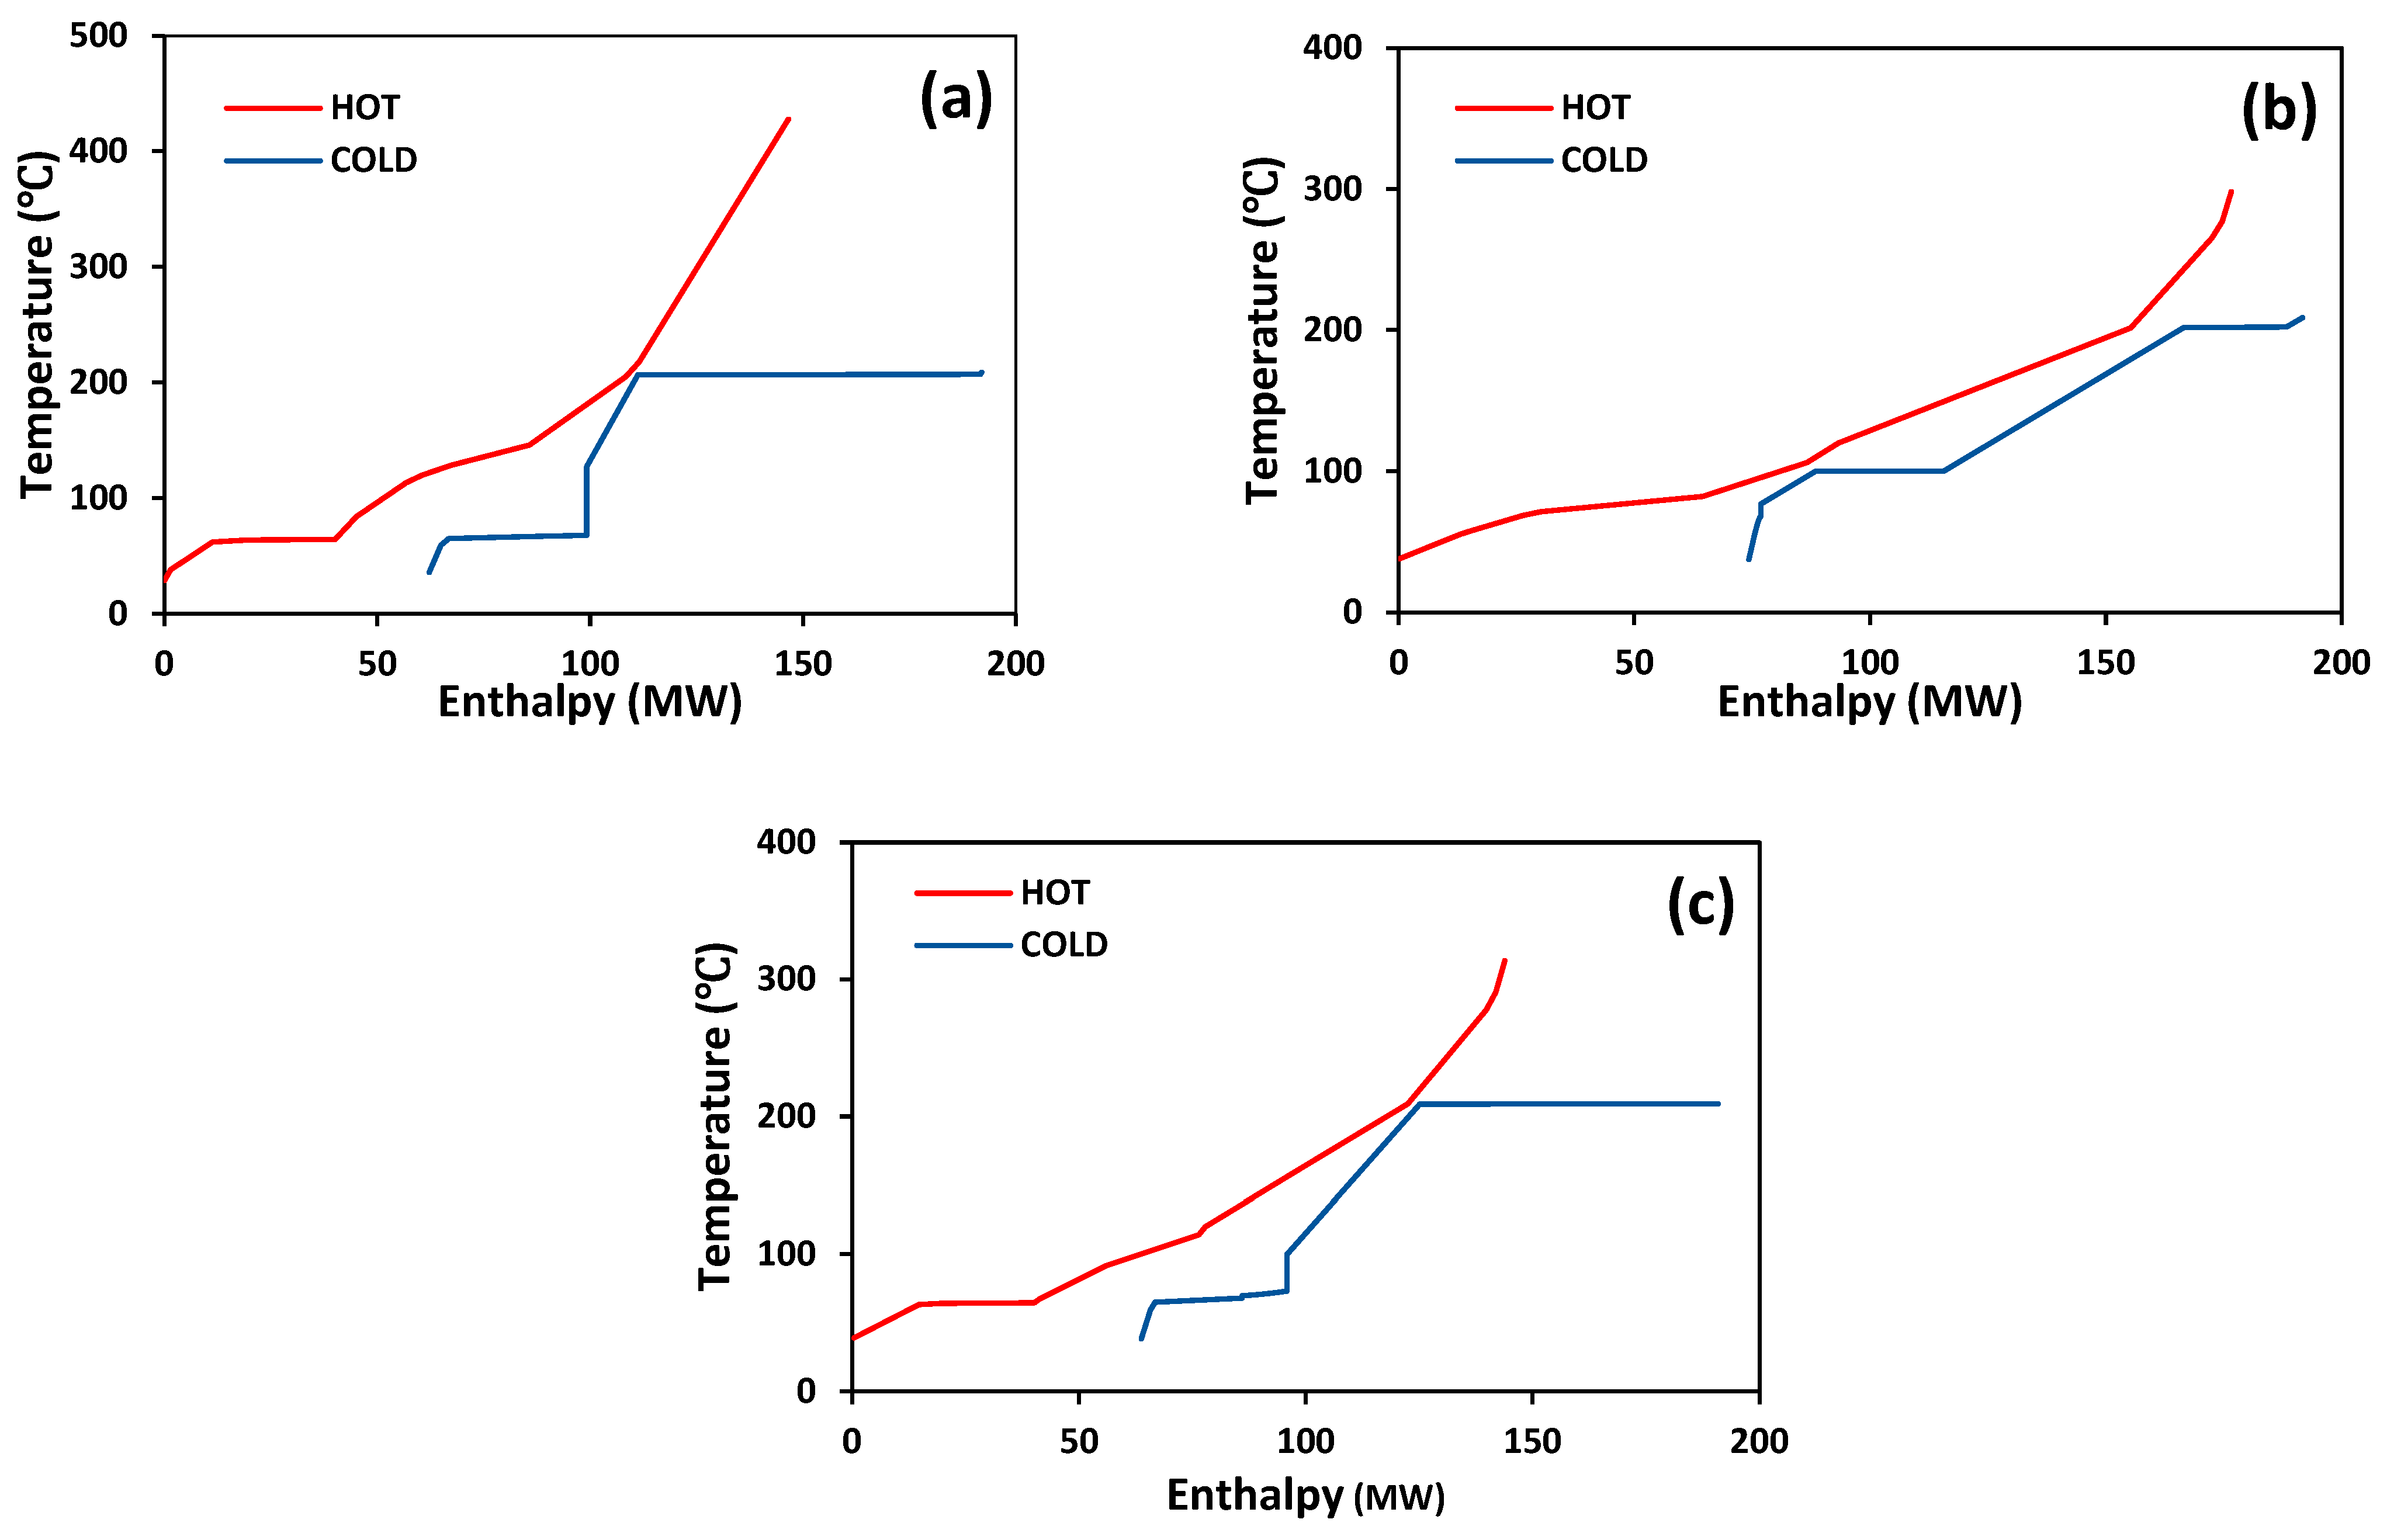
Figure 9 shows the composite curves of the MeOH synthesis processes. After the maximum heat recovery between each process, composite curves determined the external hot and cold utilities requirements. Table 10 lists the external utility requirements of each MeOH synthesis process from composite curve analysis. It is seen that MeOH synthesis utilizing COG had the highest hot utility requirements (50.28 MW), while it was the lowest (16.58 MW) in the case of the FG-based MeOH production process. The hot utility requirements were also reported in the rage of 5.00–108.33 MW by previous authors during the MeOH synthesis from various industrial waste gases [36,37]. In contrast, the cold utility requirement was the maximum for FG-based MeOH synthesis, and it was targeted as the lowest during the MeOH synthesis from SG. Wang et al. [38] also reported a similar amount of hot utility consumption, while the MeOH synthesis process was designed based on FG and SG. Similarly, composite curve analysis shows that the lowest heat transfer area requirement (20,030 m2) for maximum heat recovery resulted from the case of SG feedstock. In addition, composite curve analysis is also reported via pinch points in Table 10, which were subsequently used in HEN design to meet the external utilities and area requirements.
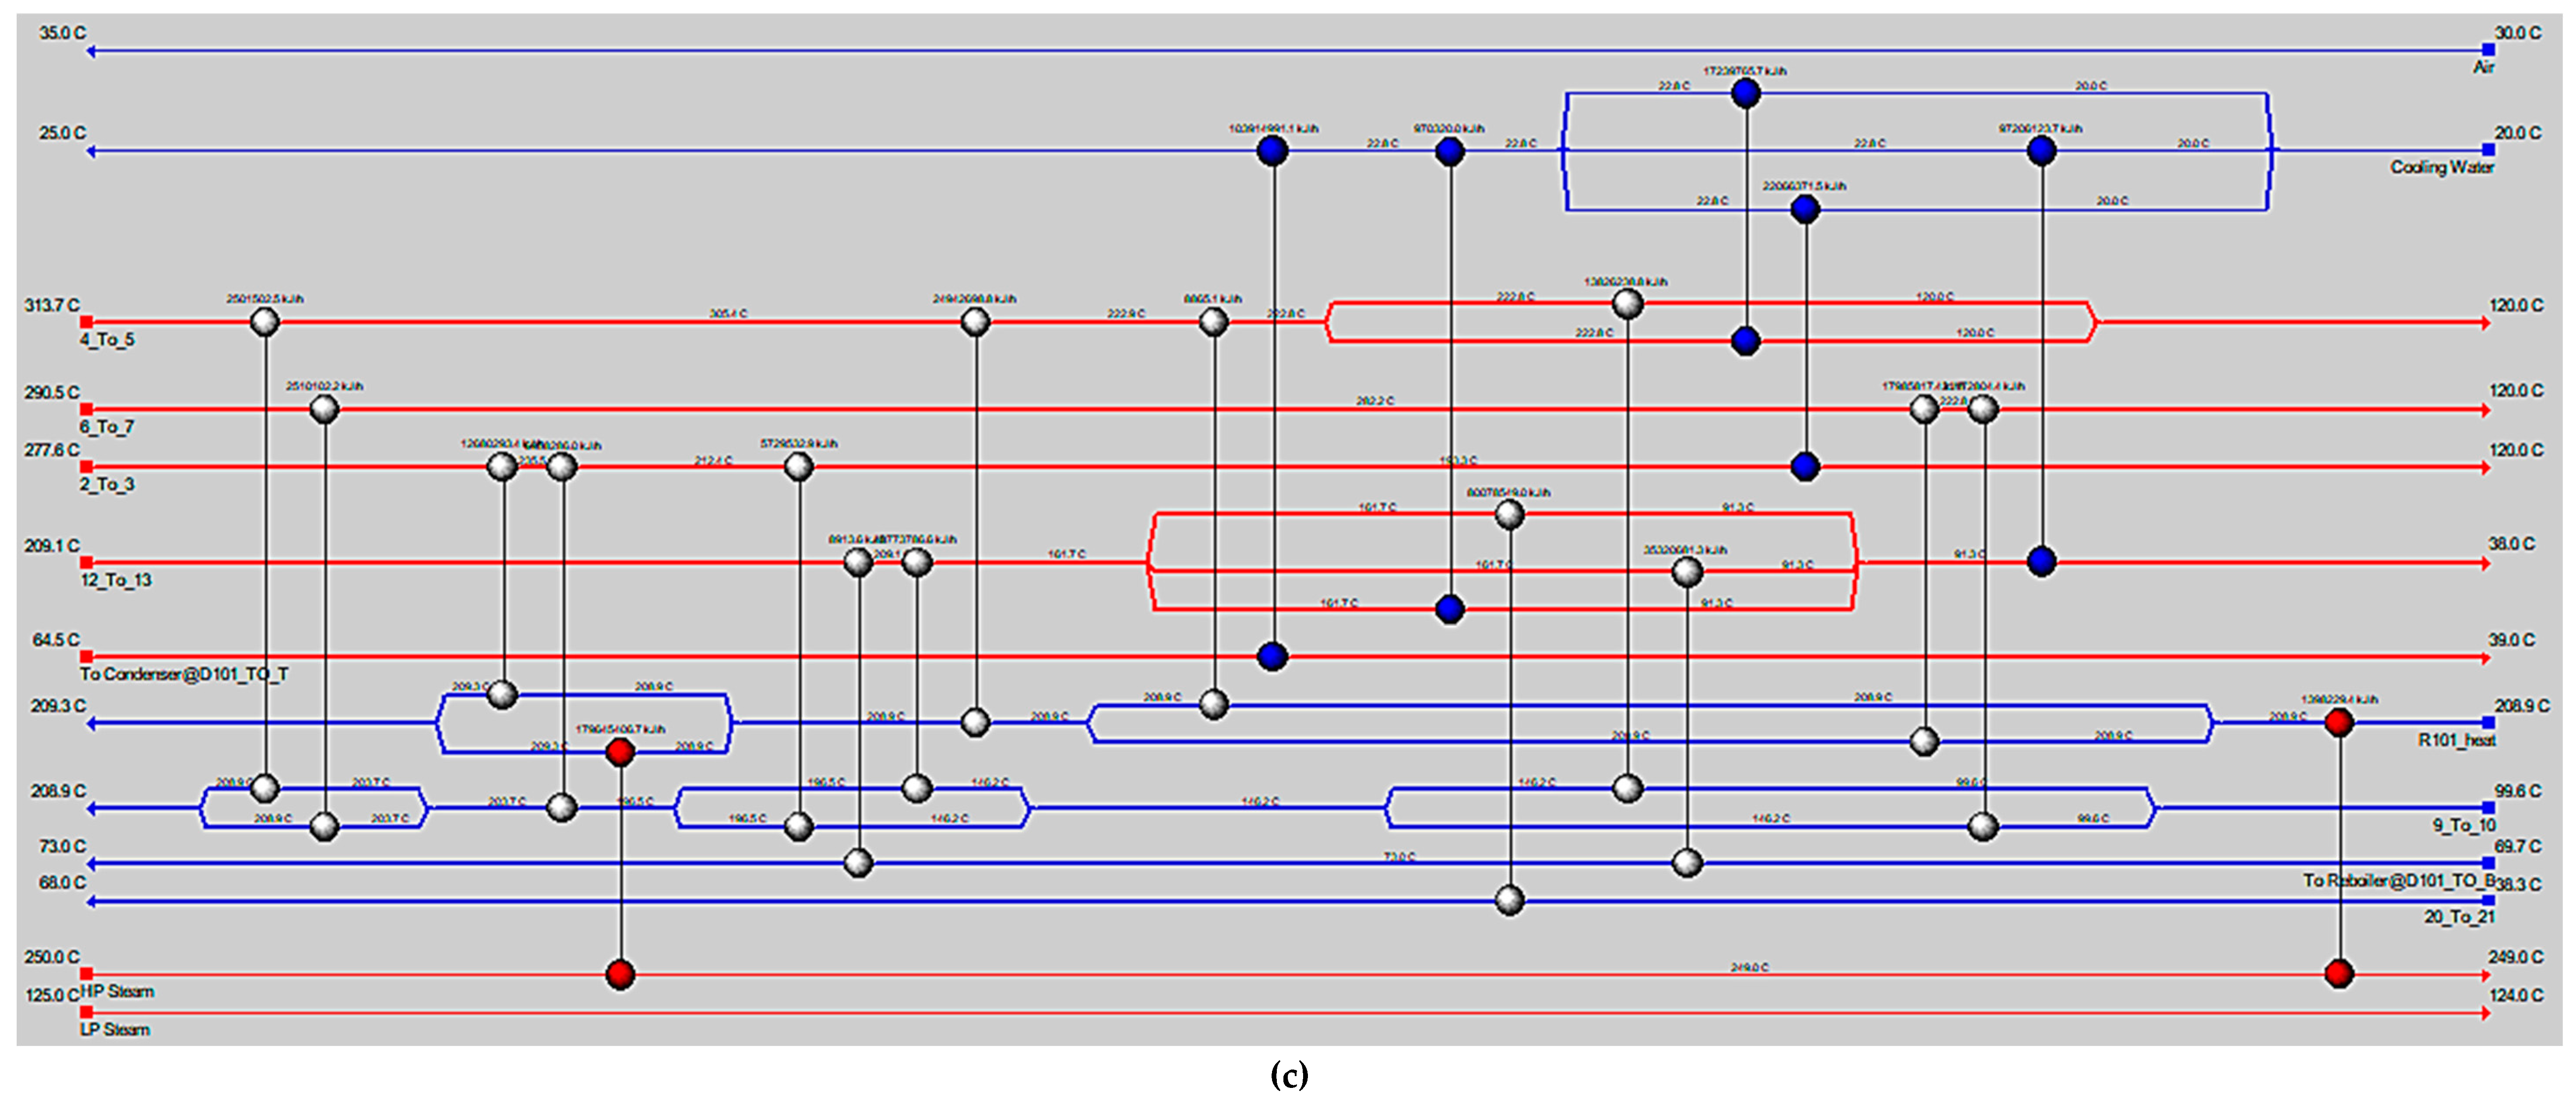
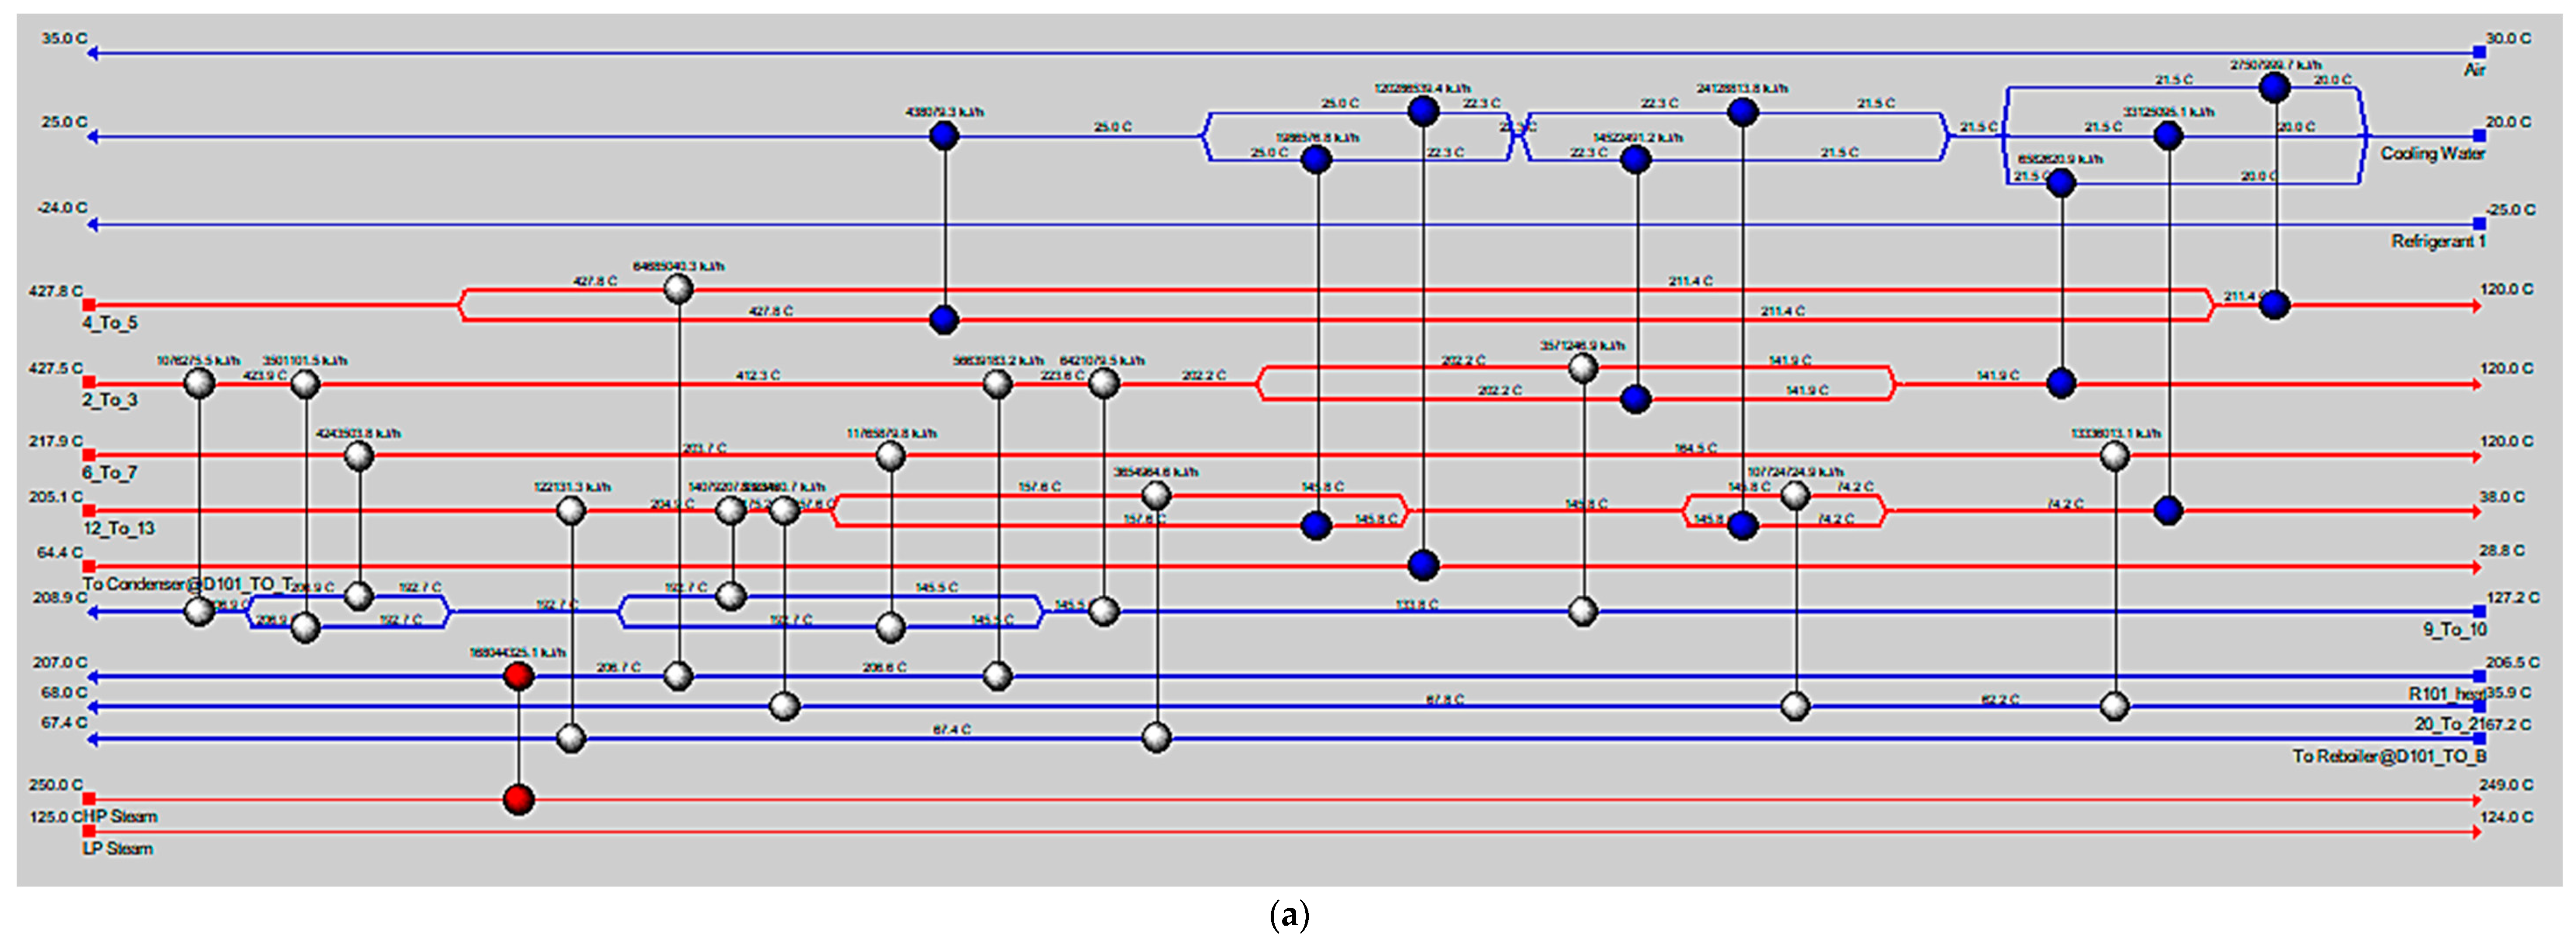
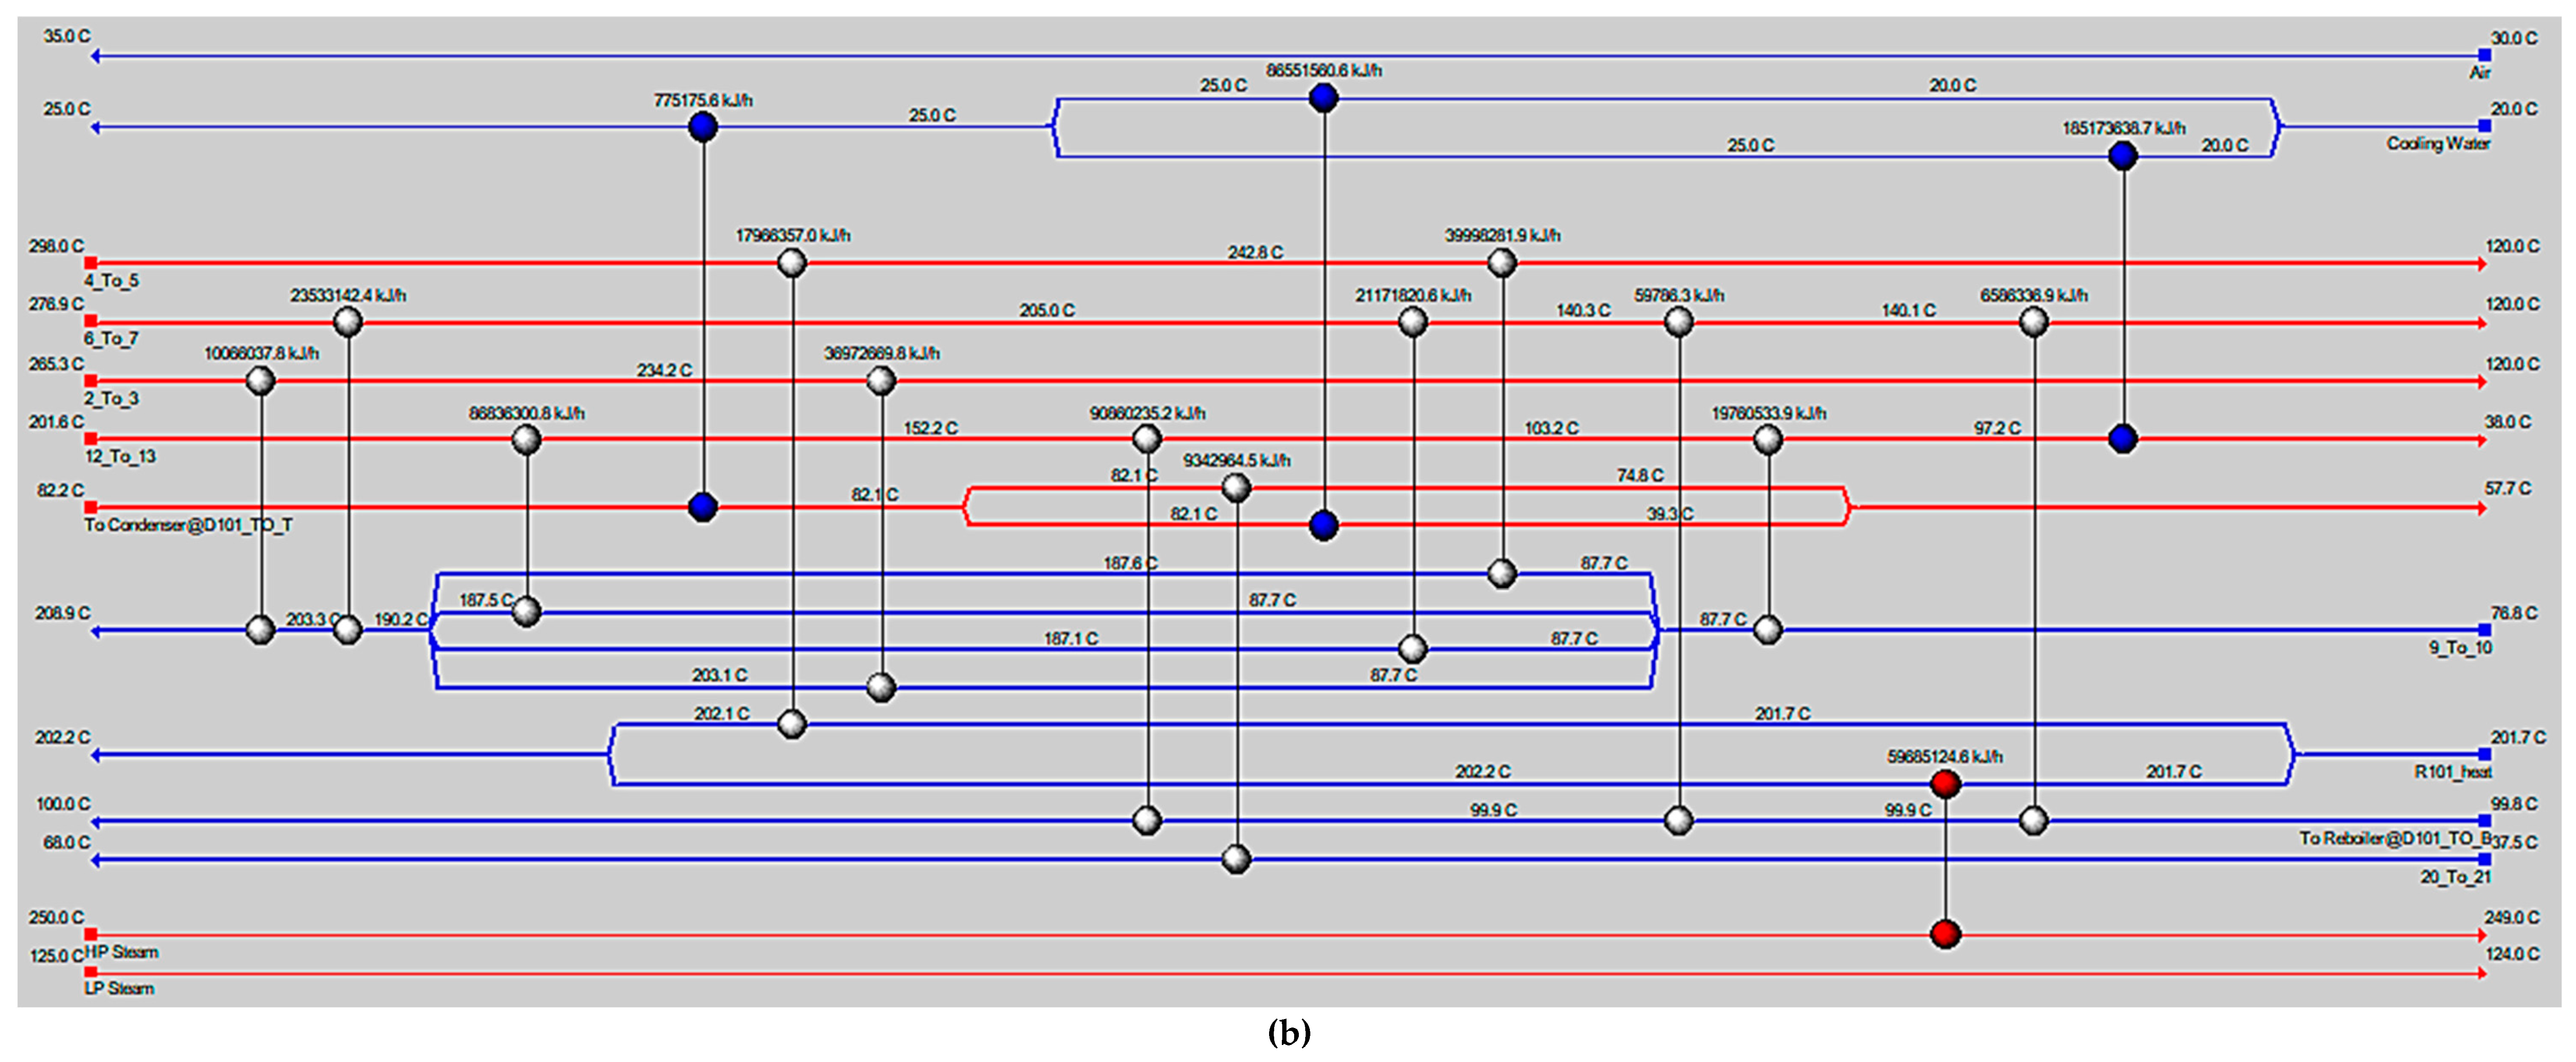
Interestingly, the external hot and cold utility requirements in each of the MeOH synthesis processes were decreased in the HEN design compared to the composite curve targeting. This implies that more heat recoveries were achieved by the HEN design than by the composite curve analysis. The higher heat recoveries by the HEN design are also further supported by the higher heat transfer area requirements relative to the composite curve targets. However, higher heat recoveries and heat transfer area requirements resulted in more than 12 heat exchangers in the HEN designs, which is associated with capital costs. Thus, the HEN designs were optimized with the optimization goals of minimizing annual capital costs and maximizing heat recoveries. The optimum HEN designs (shown in Appendix A Figure A1) were still requiring the external heaters and coolers to satisfy the process utility requirements. Table 10 shows that the optimized HEN design for FG-based MeOH production required the lowest number of external heaters (1) and coolers (3) because of the higher heat recovery using a higher heat transfer area (61,190 m2). The optimized HEN design resulting in a lower energy requirement is also reported in previous studies. Mehdizadeh-Fard et al. reported 43% more heat recovery in an optimized HEN design developed for a natural gas refinery using a comparatively lower ΔTmin value [39]. Similarly, 15.24% and 86.47% thermal and energy efficiency increases were reported by Konur et al. [40] in an optimized HEN design for a marine vessel for waste heat recovery.

5. Conclusions

MeOH production based on SG feedstock was developed by the modified LHHW kinetic model in Aspen Plus. Later, Aspen Plus process models were optimized for both dimensional and operating parameters for MeOH production. Optimization results showed that 5000 tubes, each with a 12 m length and 0.06 m diameter, resulted in the optimum 75.39% PFR conversion. To achieve the similar conversion from the SG feedstock, the optimum operational parameters for the RFR were 209 °C, 70 bar, and thermal fluid circulating at 196 °C. However, the variations in conversion and MeOH production were observed when the feedstock material was replaced with the FG and COG within the optimized process for SG. It was found that FG resulted in significantly lower MeOH production with a reactor conversion of only 15.5% compared to other feedstocks. SG and COG-based MeOH production processes achieved conversions of 75.39% and 74.01%, correspondingly. The lower conversion of FG feedstock can be improved up to 21.72% by increasing the SN value to 4.5. In addition, a higher recycle ratio of 7.14 can also increase the conversion of FG-based MeOH synthesis. Finally, composite curve analyses showed that all three MeOH synthesis processes have interprocess heat-exchanging capability with a cost of adding the heat transfer area. To utilize the heat-exchanging capability, an optimized HEN was designed for each process. It was found that a comparatively lower number of heat exchangers (12), heaters (1), and coolers (3) were required for the SG feedstock for interprocess heat exchanging relative to SG and COG-based MeOH synthesis processes.
Author Contributions

Conceptualization, A.Y. and M.S.H.; methodology, N.P. and M.W.S.; software, M.S.H., N.P. and M.W.S.; validation, D.K., D.P., A.N.S. and P.K.; formal analysis, A.Y., M.S.H., P.K. and A.N.S.; resources, A.Y. and M.S.H.; data curation, N.P. and M.W.S.; writing—original draft preparation, N.P., A.Y. and M.S.H.; writing—review and editing, A.Y., M.S.H., D.K., P.K. and D.P.; visualization, N.P., A.N.S. and M.W.S.; supervision, A.Y. and M.S.H.; project administration, A.Y. and M.S.H.; funding acquisition, A.Y. and M.S.H. All authors have read and agreed to the published version of the manuscript.

Funding

This research received no external funding.

Data Availability Statement

All data are available in the main text. Additional datasets related to this study are available from the corresponding author upon reasonable request.

Conflicts of Interest

The authors declare no conflict of interest.

Appendix A

Figure A1. Optimized HEN design for MeOH synthesis processes: (a) SG, (b) FG, and (c) COG.
Energies 16 06557 g0a1aEnergies 16 06557 g0a1bEnergies 16 06557 g0a1c

Appendix B

Table A1. Parameters of rearranged kinetic model [3].
VariableAiBi
k 1 −29.874811.2
k 2 8.4170
k 3 −6.4522068.4
k 4 −34.9514,928.9
k 5 4.804−11,797.5
k 6 17.55−2249.8
k 7 0.1310−7023.5

References

  1. Olah, G.A.; Goeppert, A.; Prakash, G.K.S. Chemical Recycling of Carbon Dioxide to Methanol and Dimethyl Ether: From Greenhouse Gas to Renewable, Environmentally Carbon Neutral Fuels and Synthetic Hydrocarbons. J. Org. Chem. 2009, 74, 487–498. [Google Scholar] [PubMed]
  2. Anicic, B.; Trop, P.; Goricanec, D. Comparison between two methods of methanol production from carbon dioxide. Energy 2014, 77, 279–289. [Google Scholar]
  3. Hogan, K.B.; Hoffman, J.S.; Thompson, A.M. Methane on the greenhouse agenda. Nature 1991, 354, 181–182. [Google Scholar]
  4. Van-Dal, É.S.; Bouallou, C. Design and simulation of a methanol production plant from CO2 hydrogenation. J. Clean. Prod. 2013, 57, 38–45. [Google Scholar]
  5. Pardo, N.; Moya, J.A. Prospective scenarios on energy efficiency and CO2 emissions in the European Iron & Steel industry. Energy 2013, 54, 113–128. [Google Scholar]
  6. Chen, L.; Yang, B.; Shen, X.; Xie, Z.; Sun, F. Thermodynamic optimization opportunities for the recovery and utilization of residual energy and heat in China’s iron and steel industry: A case study. Appl. Therm. Eng. 2015, 86, 151–160. [Google Scholar]
  7. Balki, M.K.; Sayin, C. The effect of compression ratio on the performance, emissions and combustion of an SI (spark ignition) engine fueled with pure ethanol, methanol and unleaded gasoline. Energy 2014, 71, 194–201. [Google Scholar]
  8. Gong, C.-M.; Huang, K.; Jia, J.-L.; Su, Y.; Gao, Q.; Liu, X.-J. Improvement of fuel economy of a direct-injection spark-ignition methanol engine under light loads. Fuel 2011, 90, 1826–1832. [Google Scholar]
  9. Pirola, C.; Bozzano, G.; Manenti, F. Fossil or Renewable Sources for Methanol Production? Methanol 2018, 53–93. [Google Scholar] [CrossRef]
  10. Bozzano, G.; Manenti, F. Efficient methanol synthesis: Perspectives, technologies and optimization strategies. Prog. Energy Combust. Sci. 2016, 56, 71–105. [Google Scholar]
  11. Ortiz, F.J.G.; Serrera, A.; Galera, S.; Ollero, P. Methanol synthesis from syngas obtained by supercritical water reforming of glycerol. Fuel 2013, 105, 739–751. [Google Scholar]
  12. Sahibzada, M.; Metcalfe, I.S.; Chadwick, D. Methanol Synthesis from CO/CO2/H2over Cu/ZnO/Al2O3 at Differential and Finite Conversions. J. Catal. 1998, 174, 111–118. [Google Scholar]
  13. Arashiro, S.M.T. Thermophilic Carboxydotrophs and Their Applications in Biotechnology; Springer: Dearborn, MI, USA, 2014. [Google Scholar]
  14. AlNouss, A.; McKay, G.; Al-Ansari, T. Production of syngas via gasification using optimum blends of biomass. J. Clean. Prod. 2020, 242, 118499. [Google Scholar]
  15. Abdelaziz, O.Y.; Hosny, W.M.; Gadalla, M.A.; Ashour, F.H.; Ashour, I.A.; Hulteberg, C.P. Novel process technologies for conversion of carbon dioxide from industrial flue gas streams into methanol. J. CO2 Util. 2017, 21, 52–63. [Google Scholar]
  16. Naimi, Y.; Antar, A. Hydrogen Generation by Water Electrolysis. In Advances in Hydrogen Generation Technologies; IntechOpen: London, UK, 2018. [Google Scholar]
  17. Kim, S.; Kim, M.; Kim, Y.T.; Kwak, G.; Kim, J. Techno-economic evaluation of the integrated polygeneration system of methanol, power and heat production from coke oven gas. Energy Convers. Manag. 2019, 182, 240–250. [Google Scholar]
  18. Skrzypek, J.; Lachowska, M.; Grzesik, M.; Słoczyński, J.; Nowak, P. Thermodynamics and kinetics of low pressure methanol synthesis. Chem. Eng. J. Biochem. Eng. J. 1995, 58, 101–108. [Google Scholar]
  19. Smith, R. Chemical Process Design and Integration; John Wiley & Sons Ltd.: Hoboken, NJ, USA, 2005. [Google Scholar]
  20. Al-Kalbani, H.; Xuan, J.; García, S.; Wang, H. Comparative energetic assessment of methanol production from CO2: Chemical versus electrochemical process. Appl. Energy 2016, 165, 1–13. [Google Scholar]
  21. Graaf, G.H.; Stamhuis, E.; Beenackers, A. Kinetics of low-pressure methanol synthesis. Chem. Eng. Sci. 1988, 43, 3185–3195. [Google Scholar]
  22. Bussche, K.V.; Froment, G.F. A steady-state kinetic model for methanol synthesis and the water gas shift reaction on a commercial Cu/ZnO/Al2O3Catalyst. J. Catal. 1996, 161, 1–10. [Google Scholar]
  23. Mignard, D.; Pritchard, C.L. Processes for the Synthesis of Liquid Fuels from CO2 and Marine Energy. Chem. Eng. Res. Des. 2006, 84, 828–836. [Google Scholar]
  24. Graaf, G.H.; Sijtsema, P.; Stamhuis, E.; Joosten, G. Chemical equilibria in methanol synthesis. Chem. Eng. Sci. 1986, 41, 2883–2890. [Google Scholar] [CrossRef]
  25. Fogler, H.S. Elements of Chemical Reaction Engineering; Prentice-Hall, Inc.: Hoboken, NJ, USA, 2002. [Google Scholar]
  26. Towler, G.; Sinnott, R. Chemical Engineering Design Principles, Practice and Economics of Plant and Process Design; Elsevier: Amsterdam, The Netherlands, 2012. [Google Scholar]
  27. Leonzio, G.; Zondervan, E.; Foscolo, P.U. Methanol production by CO2 hydrogenation: Analysis and simulation of reactor performance. Int. J. Hydrogen Energy 2019, 44, 7915–7933. [Google Scholar] [CrossRef]
  28. Chang, T.; Rousseau, R.W.; Kilpatrick, P.K. Methanol synthesis reactions: Calculations of equilibrium conversions using equations of state. Ind. Eng. Chem. Process Des. Dev. 1986, 25, 477–481. [Google Scholar] [CrossRef]
  29. Evans, J. Technologies to reduce refrigeration energy consumption in the food industry. In Handbook of Waste Management and Co-Product Recovery in Food Processing; 02: Woodhead Publishing Series in Food Science, Technology and Nutrition; Woodhead Publishing: Sawston, UK, 2009; pp. 196–220. [Google Scholar]
  30. Dutta, B.K. Principles of Mass Transfer and Separation Processes; PHI Learning: New Delhi, India, 2009. [Google Scholar]
  31. Seider, W.D.; Seader, J.D.; Lewin, D.R.; Widagdo, S. Product and Process Design Principles: Synthesis, Analysis and Evaluation; Wiley: Hoboken, NJ, USA, 2004. [Google Scholar]
  32. Roetzel, W.; Luo, X.; Chen, D. Optimal design of heat exchanger networks. In Design and Operation of Heat Exchangers and Their Networks; Academic Press: Cambridge, MA, USA, 2020; pp. 231–317. [Google Scholar] [CrossRef]
  33. Hossain, M.S.; Theodoropoulos, C.; Yousuf, A. Techno-economic evaluation of heat integrated second generation bioethanol and furfural coproduction. Biochem. Eng. J. 2019, 144, 89–103. [Google Scholar]
  34. Li, N.; Klemeš, J.J.; Sunden, B.; Wu, Z.; Wang, Q.; Zeng, M. Heat exchanger network synthesis considering detailed thermal-hydraulic performance: Methods and perspectives. Renew. Sustain. Energy Rev. 2022, 168, 112810. [Google Scholar]
  35. Chen, L.; Jiang, Q.; Song, Z.; Posarac, D. Optimization of methanol yield from a Lurgi reactor. Chem. Eng. Technol. 2011, 34, 817–822. [Google Scholar] [CrossRef]
  36. Xu, Y.-P.; Liu, R.-H.; Shen, M.-Z.; Lv, Z.-A.; Chupradit, S.; Metwally, A.S.M.; Sillanpaa, M.; Qian, Q. Assessment of methanol and electricity co-production plants based on coke oven gas and blast furnace gas utilization. Sustain. Prod. Consum. 2022, 32, 318–329. [Google Scholar] [CrossRef]
  37. Zhao, Y.; Zhao, Y.; Huang, Y.; Wang, J.; Bao, W.; Chang, L.; Shi, L.; Yi, Q. Pinch Analysis for Heat Integration of Pulverized Coke Chemical Looping Gasification Coupled with Coke-Oven Gas to Methanol and Ammonia. Processes 2022, 10, 1879. [Google Scholar] [CrossRef]
  38. Wang, H.; Su, Y.; Wang, D.; Jin, S.; Wei Sa Shen, W. Optimal design and energy-saving investigation of the triple CO2 feeds for methanol production system by combining steam and dry methane reforming. Ind. Eng. Chem. Res. 2020, 59, 1596–1606. [Google Scholar] [CrossRef]
  39. Mehdizadeh-Fard, M.; Pourfayaz, F.; Mehrpooya, M.; Kasaeian, A. Improving energy efficiency in a complex natural gas refinery using combined pinch and advanced exergy analyses. Appl. Therm. Eng. 2018, 137, 341–355. [Google Scholar]
  40. Konur, O.; Saatcioglu, O.Y.; Korkmaz, S.A.; Erdogan, A.; Colpan, C.O. Heat exchanger network design of an organic Rankine cycle integrated waste heat recovery system of a marine vessel using pinch point analysis. Int. J. Energy Res. 2020, 44, 12312–12328. [Google Scholar] [CrossRef]
Figure 1. Block diagram of MeOH synthesis process.
Energies 16 06557 g001
Figure 2. Process flow diagram of reactor unit of MeOH synthesis from pretreated feedstock (syngas, FG, and COG).
Energies 16 06557 g002
Figure 3. Process flow diagram of separation unit of MeOH synthesis from pretreated feedstock (syngas, FG, and COG).
Energies 16 06557 g003
Figure 4. Reactor conversion with respect to (a) tube diameter and length; (b) tube diameter and number of tubes and (c) number of tubes and length.
Energies 16 06557 g004aEnergies 16 06557 g004b
Figure 5. Reactor conversion with respect to operating temperature and pressure.
Energies 16 06557 g005
Figure 6. (a) Effect of thermal fluid temperature on conversion at the reactor and (b) temperature profile at different thermal fluid temperature.
Energies 16 06557 g006
Figure 7. Effect of SN on reactor conversion for different feedstocks (FG, COG, and SG).
Energies 16 06557 g007
Figure 8. Effect of recycle ratio on reactor conversion and overall conversion (a) for SG to MeOH, (b) for FG to MeOH, and (c) for COG to MeOH.
Energies 16 06557 g008
Figure 9. Composite curves of MeOH synthesis processes from feedstocks (a) SG, (b) FG, and (c) COG. (HOT and COLD represent hot and cold streams of the processes accordingly.)
Energies 16 06557 g009
Table 1. Molar composition of different feedstocks.
Molar Composition (%)SGFG [15]COG [17]
CO28.59780.0024.07
H2O-0.192.51
N2-6.161.49
CO22.7675220.951.30
H268.634771.9169.70
O2-0.80-
CH4--0.22
C2H6--0.71
Table 2. Parameters of kinetic model of Equations (6) and (7).
VariableUnit A i B i (J mol−1)
k 1 m o l   k g c a t 1 s 1 b a r 2 1.0736,696
k 2 -3453.38-
k 3 b a r 0.5 0.49917,197
k 4 b a r 1 6.62 × 10 11 124,119
k 5 m o l   k g c a t 1 s 1 b a r 1 1.22 × 10 10 −94,765
Table 3. Specification of the catalyst [26].
Catalyst ParameterValue
Shape (m)Cylindrical
Particle density (kgm−3)1775
Diameter (mm)5.4
Particle height (mm)5.2
Void fraction of bed (m3m−3)0.285
Table 4. Specification of rigorous distillation column.
Rectifying Section (CS-1)Stripping Section (CS-2)
Tray typeNUTTER-BDPBUBBLE-CAP
Section diameter3.683.8
Section height7.31522.1
Number of passes11
Table 5. Summary of the performed sensitivity analysis.
Sensitivity IDManipulated VariableTabulated Variable
S-1Length varied from 5 to 20 m, and tube diameter varied from 0.02 to 0.5 mSingle-pass conversion
S-2Number of reactor tubes manipulated within 2000 to 10,000, varying the tube diameter from 0.02 to 0.5 mSingle-pass conversion
S-3Length was changed from 5 to 20 m and the number of reactor tubes changedSingle-pass conversion
S-4Reactor temperature and pressure Single-pass conversion
S-5Thermal fluid temperatureSingle-pass conversion
S-6Flow rate of hydrogenSN, Overall conversion
S-7Purge fractionRecycle ratio, Single-pass conversion, Overall conversion
Table 6. Specification of the optimization approach.
Optimization IDObjectiveConstraint IDSpecification of Constraint
Dimensional optimizationMinimize the reactor volumeC-1The conversion was constrained by greater than or equal to a specified value.
C-2Length was bounded by less than or equal to a specified value.
C-3Diameter was greater than or equal to a specified value.
C-4No. of tubes was less than or equal to a specified value.
Operational optimizationMaximize the conversionC-5Temperature was greater than or equal to a specified value.
C-6Pressure maintains at less than or equal to a specified value.
C-7Thermal fluid temperature is maintained at greater than or equal to a specified value.
Table 7. Optimized dimensional parameter values of PFR reactor for MeOH synthesis.
ParameterValues
Reactor tube length12 m
Reactor tube diameter0.06 m
Number of tubes5000
Table 8. Optimized operational parameter values for MeOH synthesis.
ParameterValues
Reactor Temperature208.866 °C ≈ 209 °C
Reactor Pressure70 bar
Thermal Fluid Temperature196.027 °C ≈ 196 °C
Table 9. Comparison of MeOH production.
ParameterSG to MeOH (Base Case)FG to MeOHCOG to MeOH
SN2.12.432.7
Recycle Ratio1.44.762.61
Reactor Conversion (%)75.3915.574.01
Overall Conversion (%)94.3263.1995.79
MeOH Production (kmol h−1)2902.091398.972383.18
Table 10. Heat integration analysis of MeOH synthesis processes.
Heat Integration
Parameter
Composite Curve AnalysisHEN Design Analysis
SGFGCOGSGFGCOG
Hot Utility (MW)46.6716.5850.2845.3615.2747.00
Cold Utility (MW)63.5075.6967.0662.1774.2563.78
Heat transfer area
×103 (m2)
20.0329.3725.9836.3861.1947.06
Hot Pinch (°C)216.5, 40, 27.5201.6, 106.2, 40.0209.1, 40same as composite curve analysis
Cold Pinch (°C)206.5, 30, 17.5191.6, 96.2, 30.0199.1, 30same as composite curve analysis
Number of Heat Exchangers, Heater, and Cooler---14, 1, and 812, 1, and 314, 2, and 5
Disclaimer/Publisher’s Note: The statements, opinions and data contained in all publications are solely those of the individual author(s) and contributor(s) and not of MDPI and/or the editor(s). MDPI and/or the editor(s) disclaim responsibility for any injury to people or property resulting from any ideas, methods, instructions or products referred to in the content.