Article

Risk Reliability Assessment of Transmission Lines under Multiple Natural Disasters in Modern Power Systems

1
State Grid Sichuan Economic Research Institute, Chengdu 610095, China
2
State Grid Sichuan Electric Power Company, Chengdu 610072, China
3
College of Electrical Engineering, Sichuan University, Chengdu 610065, China
*
Author to whom correspondence should be addressed.
Energies 2023, 16(18), 6548; https://doi.org/10.3390/en16186548
Submission received: 2 August 2023 / Revised: 25 August 2023 / Accepted: 5 September 2023 / Published: 12 September 2023
(This article belongs to the Special Issue Modern Power System Stability and Optimal Operating)

Abstract

:
Climate change has led to more frequent extreme weather events, and various natural disasters have posed risks to the operation of transmission lines. Line failures caused by natural disasters are unpredictable and bring additional maintenance work. Therefore, this paper proposes a transmission line risk reliability assessment method that considers the combined effects of multiple natural disasters. This method establishes a theory of disaster risk quantification that considers the probability of the occurrence of the risk, the degree of the impact of the risk on the line, and the severity of the risk disaster. The risk weights for different natural disasters are calculated by combining a hierarchical analysis and entropy weighting methods. The example of a transmission line risk assessment under the combined effects of multiple natural disasters for a Sichuan region verifies the proposed method’s effectiveness. The results show that the method effectively assesses the operational risk to transmission lines under the combined effects of natural disasters. The assessment results can be used for disaster recovery and line risk prevention.

1. Introduction

The global climate has changed, and extreme weather events have occurred frequently [1,2,3]. According to the statistics from the China Electricity Reliability Management Center, natural disasters and weather factors are the leading causes of the unplanned outages of transmission lines [4]. Super typhoons, extremely low temperatures, ice and snow, significant earthquakes, and other disasters damage our power grid. Sichuan Province is one of the provinces most affected by natural disasters in China [5]. From 2008 to the present, Sichuan Province has been repeatedly shut down due to natural disasters, such as snowstorms, high winds, and earthquakes. Therefore, it is essential to assess the risk to transmission lines under different scenarios and take preventive measures to enhance the resilience and reliability of the power system [6,7]. A transmission line risk reliability assessment identifies, analyzes, and evaluates the potential disasters and consequences of transmission line failures [8]. It can help the transmission system operator to prioritize maintenance activities, optimize resource allocation, and improve emergency response plans. The operational risk reliability assessment of power systems was first introduced in 2004 by the International Large Power Grid Research Association [9]. Transmission line operational risk is a comprehensive measure of the probability and severity of the uncertainties that arise during the operation of transmission lines. Combined with the internal and external factors affecting the operational status of transmission lines, the operational risk to transmission lines is analyzed and calculated from a wide range and multiple perspectives to provide powerful decision support for the operation and maintenance of the power sector [10]. With modern risk assessment concepts introduced into power systems’ reliability assessment systems, people began using current scientific theory and technology to propose a series of reliability assessment methods [11].
Much research has been performed on the risk reliability assessment of transmission line operations to improve operational reliability [12,13]. Power flow calculations are also a significant area of research in the risk assessment process. Zuo et al. introduced a novel method for the operational reliability assessment of power systems that reduces the computational complexity and time by transforming the optimal power flow model into a multiparameter linear programming model and applying a state reduction method [14]. Ali et al. presented a novel framework that combines agent-based modeling, optimal power flow, and a genetic algorithm to optimize the allocation of distributed generation and reduce the vulnerability of the electric power infrastructure to natural disasters [15]. In recent years, research into the risks associated with the operation of transmission lines has divided into two directions. One direction has studied the risk mechanisms of transmission lines under different natural disasters and meteorological factors to predict the probability of risk occurrence [16]. Another direction has considered the correlation between risks and then quantified the risks of real situations to guide realistic work [17]. Reinoso et al. proposed a risk-based maintenance methodology for transmission lines that uses machine learning and survival analysis to assess their condition and prioritize their replacement [18]. Jones et al. presented a method for evaluating the accessibility and vulnerability of the transmission lines and roads in Puerto Rico using GIS data and graph theory [19]. Deng et al. proposed a risk reliability assessment model to evaluate the impacts of heavy rainfall and geological disasters on transmission line outages using precipitation, tower deflection, a Monte Carlo simulation, and optimal load shedding [20]. Manninen et al. proposed a risk-based maintenance methodology for transmission lines that uses machine learning and survival analysis to assess their condition and prioritize their replacement [21]. Chen et al. proposed a method to assess the wildfire risk to transmission line corridors using the Naive Bayes Network and 14 wildfire-related factors [22]. Shi et al. introduced a novel model to evaluate the risk of line tripping caused by wildfires in high-voltage power line corridors using remote sensing and logic regression techniques [23]. Zhang et al. developed a mid–short-term risk reliability assessment methodology for power systems that considers the impact of external environmental factors, such as ice, bird damage, and lightning flashovers [24]. Oboudi et al. presented a risk-based framework for enhancing the resilience of distribution systems against earthquakes by using the conditional value at risk, risk reduction worth, and distributed energy resources to optimize the retrofitting of substation components and underground cables [25]. Zhuang et al. proposed a method to assess the transient stability risks to power transmission systems from ice disasters and strong wind conditions [26]. In summary, most current studies have focused on preventing and assessing a particular natural disaster; the combined risk from multiple meteorological disasters has not yet been analyzed. But the reality is that transmission lines can be threatened by multiple natural disasters simultaneously [27].
Natural disasters cause unpredictable line failures and complex maintenance work [28], so assessing the risk to transmission line operation is necessary. Hence, this paper establishes a risk reliability assessment system for transmission line operation under numerous natural disasters and a hierarchical model of disaster risk weights, which can be used for the risk control of transmission lines to ensure the safe operation of power systems. Regarding the transmission line risk reliability assessment, various indicators exist, such as snowstorms, lighting, earthquakes, etc. These indicators are of different importance and affect the assessment results differently. Many studies have used the analytic hierarchy process (AHP) and entropy weight method (EWM) to calculate index weights. Han et al. proposed a fuzzy comprehensive evaluation model to assess the risk to transmission lines under different meteorological factors [29]. The model used the AHP and outperformed the GIS data synthesis method in accuracy. Zheng et al. introduced a new method to assess the risk of a lightning trip-out of transmission lines, which used an improved AHP algorithm based on lift-in association rules, and considered the correlation between different factors and lightning trip-out events [30]. Mokarram et al. presented a hybrid method to find the best locations for solar power plants in southern Iran. The method used fuzzy logic and the AHP to evaluate the different factors that affect land suitability for solar power plants [31]. Yang et al. presented an improved EWM to assess the post-failure power system [32]. Fang et al. proposed a novel approach to identify vulnerable lines based on the EWM, which used the EWM to assess the vulnerability of the lines in terms of both power flow transmission and structural links [33]. Xie et al. made a model of complex weather risk sources that affect the power system, which used many weather factors and an improved entropy method [34].
From the above research, it can be found that AHP and EWM are effective means for weight calculation and risk reliability assessment. In this paper, we propose a comprehensive transmission line risk reliability assessment method. It integrates the AHP and EWM methods and considers historical failure statistics and component condition data. The main contributions of this paper are as follows:
  • A group of theories for quantifying disaster risk are proposed, which consider the likelihood of a risk occurring, the degree to which a risk impacts the line, and the reliability of the disaster. These theories aim to provide a more comprehensive measure of the disaster operation risk to overhead transmission lines.
  • The proposed combination of the AHP and EWM weighting methods can comprehensively assess the severity of line operation risk hazards under different natural disasters, balancing the influence of AHP’s intense subjectivity and EWM’s consideration of only objective factors.
  • The risk to transmission lines in a region of Sichuan was evaluated using the AHP-EWM method, resulting in more accurate and reasonable evaluation results.
The rest of this paper is organized as follows: Section 2 introduces the quantitative theoretical analysis of the disaster risk to transmission lines, Section 3 presents the transmission line combinations based on the AHP-EWM, Section 4 illustrates the case study and discusses the results, and Section 5 concludes this paper and suggests topics for future work.

2. Quantitative Theoretical Analysis of Disaster Risk for Transmission Lines

2.1. Definition of Transmission Line Disaster Risk

Lorenz proposed the modern definition of a safety risk, which is a comprehensive measure of the probability of adverse impacts and the severity of the disaster from an event. This definition is extended to represent the following natural disaster risk to transmission lines.
R = f ( p , h ) = p h
where R is the risk value of the impact of natural disasters on transmission lines, p is the probability of transmission line failure caused by natural disasters, and h is the severity of the disaster caused by line failure.
The failure probability of the transmission lines due to natural disasters can be divided into two parts and calculated separately using statistical analysis.
p = δ p 1 p 2
where δ is the factor for line failures caused by natural disasters, p 1 is the probability of a natural disaster, and p 2 is the probability of a line failure due to a disaster.
The risk disaster assessment method directly affects the scientific rationality of the assessment results. To comprehensively measure the severity of the risk disaster, the severity of the danger caused by the line failure is calculated based on Equation (3).
h = Y S
where Y is the line failure transmission capacity loss value and S is the social impact factor of the risk.
Equation (3) is extended to combine multiple natural disasters. Different natural disaster types have different periods of occurrence, risk features, and threats. The natural disaster risk period coefficient and the risk weights of natural disasters are introduced. The social impact coefficient of a specific natural disaster risk is as follows.
S i = α i w i
where S i is the social impact factor of the line risk due to the natural disaster i , α i is the natural disaster i risk period coefficient, and w i is the natural disaster i risk weight.
In summary, transmission line disaster operation risk is a comprehensive function of risk failure probability, line failure transmission capacity loss value, and the social impact coefficient of risk, whose calculation formula is as follows [32].
R = i = 1 n p i h i = i = 1 n p i Y i S i
where R is the line disaster operation risk value, p i is the probability of line failure due to natural disaster i , h i is the line failure disaster value under natural disaster i , and Y i is the line failure transmission capacity loss value under natural disaster i .
The product of p 2 and Y is defined as the line failure transmission capacity loss value, y , in the event of a natural disaster, thus quantifying the line failure transmission capacity.
y = p 2 Y
Then Equation (5) can be equivalently changed to Equation (7).
R = i = 1 n δ p 1 i y i α i w i
where p 1 i is the probability of the occurrence of natural disaster i , y i is the value of line failure transmission capacity loss when natural disaster i occurs, α i is the risk period coefficient of the i-th natural disaster, and w i is the risk weight of the i-th natural disaster.
Based on the range of R-values and considering the “Regulations on Risk Management for Grid Operation Safety”, the assessed integrated operational risks for co-towered multiple transmission lines were classified into six levels. The corresponding integrated operational risk values (R-values) are shown in Table 1.

2.2. Risk Reliability Assessment System for Disaster Operation of Transmission Lines

According to the definition of transmission line risk, a risk reliability assessment system for transmission line operation under various natural disasters is proposed in this paper, as shown in Figure 1.

2.3. Quantification of Risk Disaster Severity

According to Equation (3), the line failure disaster’s severity is determined by the line failure capacity loss value and the social impact factor of the corresponding risk. The loss of line fault capacity includes losses caused by power line faults caused by natural disasters and losses caused by failure of the power suppliers to provide power to users in accordance with the power supply contract. The probability of line failure under different natural disasters is obtained from a statistical analysis. The Monte Carlo method is used to simulate the operating state of the line in the event of a disaster. Then a calculation of the possible line forcing failure times is performed. Finally, the loss of the regional grid load due to the risk is obtained. The degree of line failure transmission capacity loss is assigned according to the proportion of load loss, as shown in Table 2.
When considering the combined effects of multiple natural disasters, the different types of natural disasters have different occurrence periods, risk causes, failure repair difficulties, impact disasters, and other characteristics. Two indicators, the natural disaster risk weight and risk period coefficient, are used to describe the social impact coefficient of line risk caused by a natural disaster, as shown in Equation (4).
The occurrence periods of different natural disasters are accounted for in the risk period coefficients of natural disasters. Based on a Bayesian estimation, the period of power supply protection for transmission lines at the occurrence of various natural disaster risks is obtained. Finally, the natural disaster risk period coefficients are obtained and shown in Table 3.
The risk weight of a natural disaster is a composite scale factor that reflects the impact degree of each disaster risk. The coefficient includes the role of the subjective initiative of the assessment technician in the assessment process, rather than an objective indicator based on statistical data alone. It has a significant impact on the assessment results. To make the evaluation results more reasonable and accurate, and to reduce the influence of individual subjective limitations on the evaluation results, this paper uses an AHP-EWM method to determine the impact weights of different natural disasters on transmission line operation risks.

3. AHP-EWM Weighting Model for Transmission Line Combinations

3.1. AHP-Based Indicator Subjectivity Weighting Model

The hierarchical analysis is a complex, multi-objective weight ranking method focused on hierarchizing the analyzed problem, establishing different hierarchical structures, solving each layer’s priority weight relative to an element in the previous layer, and forming a multi-level analysis structure model based on the affiliation relationship between the different elements. The specific analysis process is as follows.

3.1.1. Building a Judgement Matrix Based on a Hierarchy

First, we identify the indicators included in the question and group, and then stratify the factors according to their interrelationship.
To carry out an AHP analysis is to judge the relative importance of the indicators in the hierarchy based on the model established for the ranking. Therefore, it is necessary to write the two different comparison objects in matrix form, i.e., a judgment matrix.
The judgment matrix is the source of data for conducting a hierarchical analysis. Constructing the judgment matrix is the key to the hierarchical analysis method. Take the third-order judgment matrix as an example, as shown in Equation (8).
A = a n × n
a i j = 1 a j i
where a i j compares the importance of element i and element j .
In a judgment matrix, the degree of influence between the indicators is assigned through “scales,” as shown in Table 4.

3.1.2. Hierarchical Single Ranking and Consistency Tests

The eigenvector corresponding to the largest eigenroot, λ max , of the judgment matrix is normalized to W . The normalization process makes the sum of the elements in the vector equal to one. W is the ranked weight given to the relative importance of a factor between two adjacent levels. This process is called hierarchical ranking. A consistency test confirms the single ranking. The consistency test determines the allowable range of inconsistency for A . The maximum eigenroot is λ max n , of an n-ordered positive inverse matrix. A is consistent if and only if λ max = n .
As λ max follows continuously from a i j , the inconsistency of A increases with the difference between λ max and n . The consistency indicator is calculated using the C I , and a smaller C I means greater consistency. The eigenvector accompanying the largest eigenvalue is the weight vector for the extent to which the factor being compared influences a factor in a higher level. The judgment error increases with the degree of inconsistency. Thus, the amount of inconsistency in A can be determined by the value of λ max n . The consistency indicator is defined as shown in Equation (10) [29].
C I = λ max n n 1
C I = 0 for a perfect agreement and C I is close to 0 for a satisfactory agreement. The random consistency index, R I , is introduced to measure the magnitude of R I .
R I = C I 1 + C I 2 + C I 3 + C I n n
In particular, R I is related to the order of A . In general, the higher the order of A the greater the probability of R I , as shown in Table 5.
Consider that deviations from consistency may be due to random causes. Therefore, when testing whether the judgment matrix is satisfactorily consistent, the C I random consistency index is also compared to produce the tested coefficient C R .
C R = C I R I
If C R < 0.1 , A is regarded as passing the consistency test. Otherwise, it does not satisfy consistency. In determining the weights, the AHP method has a vital subjective element when constructing the corresponding judgment matrix, which often results in inaccurate assessment results.

3.2. EWM-Based Indicator Objectivity Weighting Model

Entropy is a measure of the degree of disorder in a system. The principle is that the greater the degree of disease in an indicator, the lower the entropy value, the more significant the impact on the evaluation index system’s evaluation results, and the greater the weighting. However, the EWM can lead to excessive disorder in assigning weights, leading to extreme weight values. The specific steps are as follows [34].

3.2.1. Indicator Normalization

First, convert them all into relative amounts of data information and construct matrices.
X = x i j y × n
where n is the number of indicators and y is the number of programmers.

3.2.2. Standardization Matrix x

Second, standardize the data information and form a standardized matrix.
B = b i j y × n
b i j = x i j x ¯ x max x min
where x max and x min are the maximum and minimum values of the same indicator, and x ¯ is the mean value.

3.2.3. Calculating Indicator Entropy and Weights

Third, the weights are calculated based on the results of the indicator entropy calculation.
H j = 1 I n y i = 1 y f i j I n f i j , i = 1 , 2 , , n f i j = b i j + 1 i = 1 n b i j + 1
w j = 1 H j n j = 1 n H j
where H j is the entropy value of the indicator corresponding to the EWM and w j is the combined score weight of the different indicators determined by the EWM value.

3.3. AHP-EWM-Based Indicator Weighting Model

The AHP method is a highly subjective method for determining weights. On the other hand, the EWM determines the weighting indicators based primarily on objective information, and the resulting weights do not reflect the corresponding subjective opinions. Discrete extreme values can influence the EWM. Considering the advantages and disadvantages of the AHP and EWM methods, this paper proposes an AHP-EWM weight determination method for the comprehensive indicators from both a subjective and objective perspective.
The weights in this method combine the subjective and objective weights. After calculating the indicator weights for the AHP and entropy methods and then processing them, the final weights are shown in Equation (18).
w = w i H j + w j 1 H j , j = 1 , 2 , n
j = 1 n w j = 1
where w is the combined weight of the different indicators, w i is the weight determined by the AHP method, w j is the weight of the combined score of the other indicators defined by the EWM, and H j is the entropy value of the indicator corresponding to the EWM.

4. Case Study

Using past natural disasters and line failure statistics for an area of Sichuan Province, a case study based on the ATP-EMW method for operational risk reliability assessment of actual transmission lines is presented here.

4.1. Data

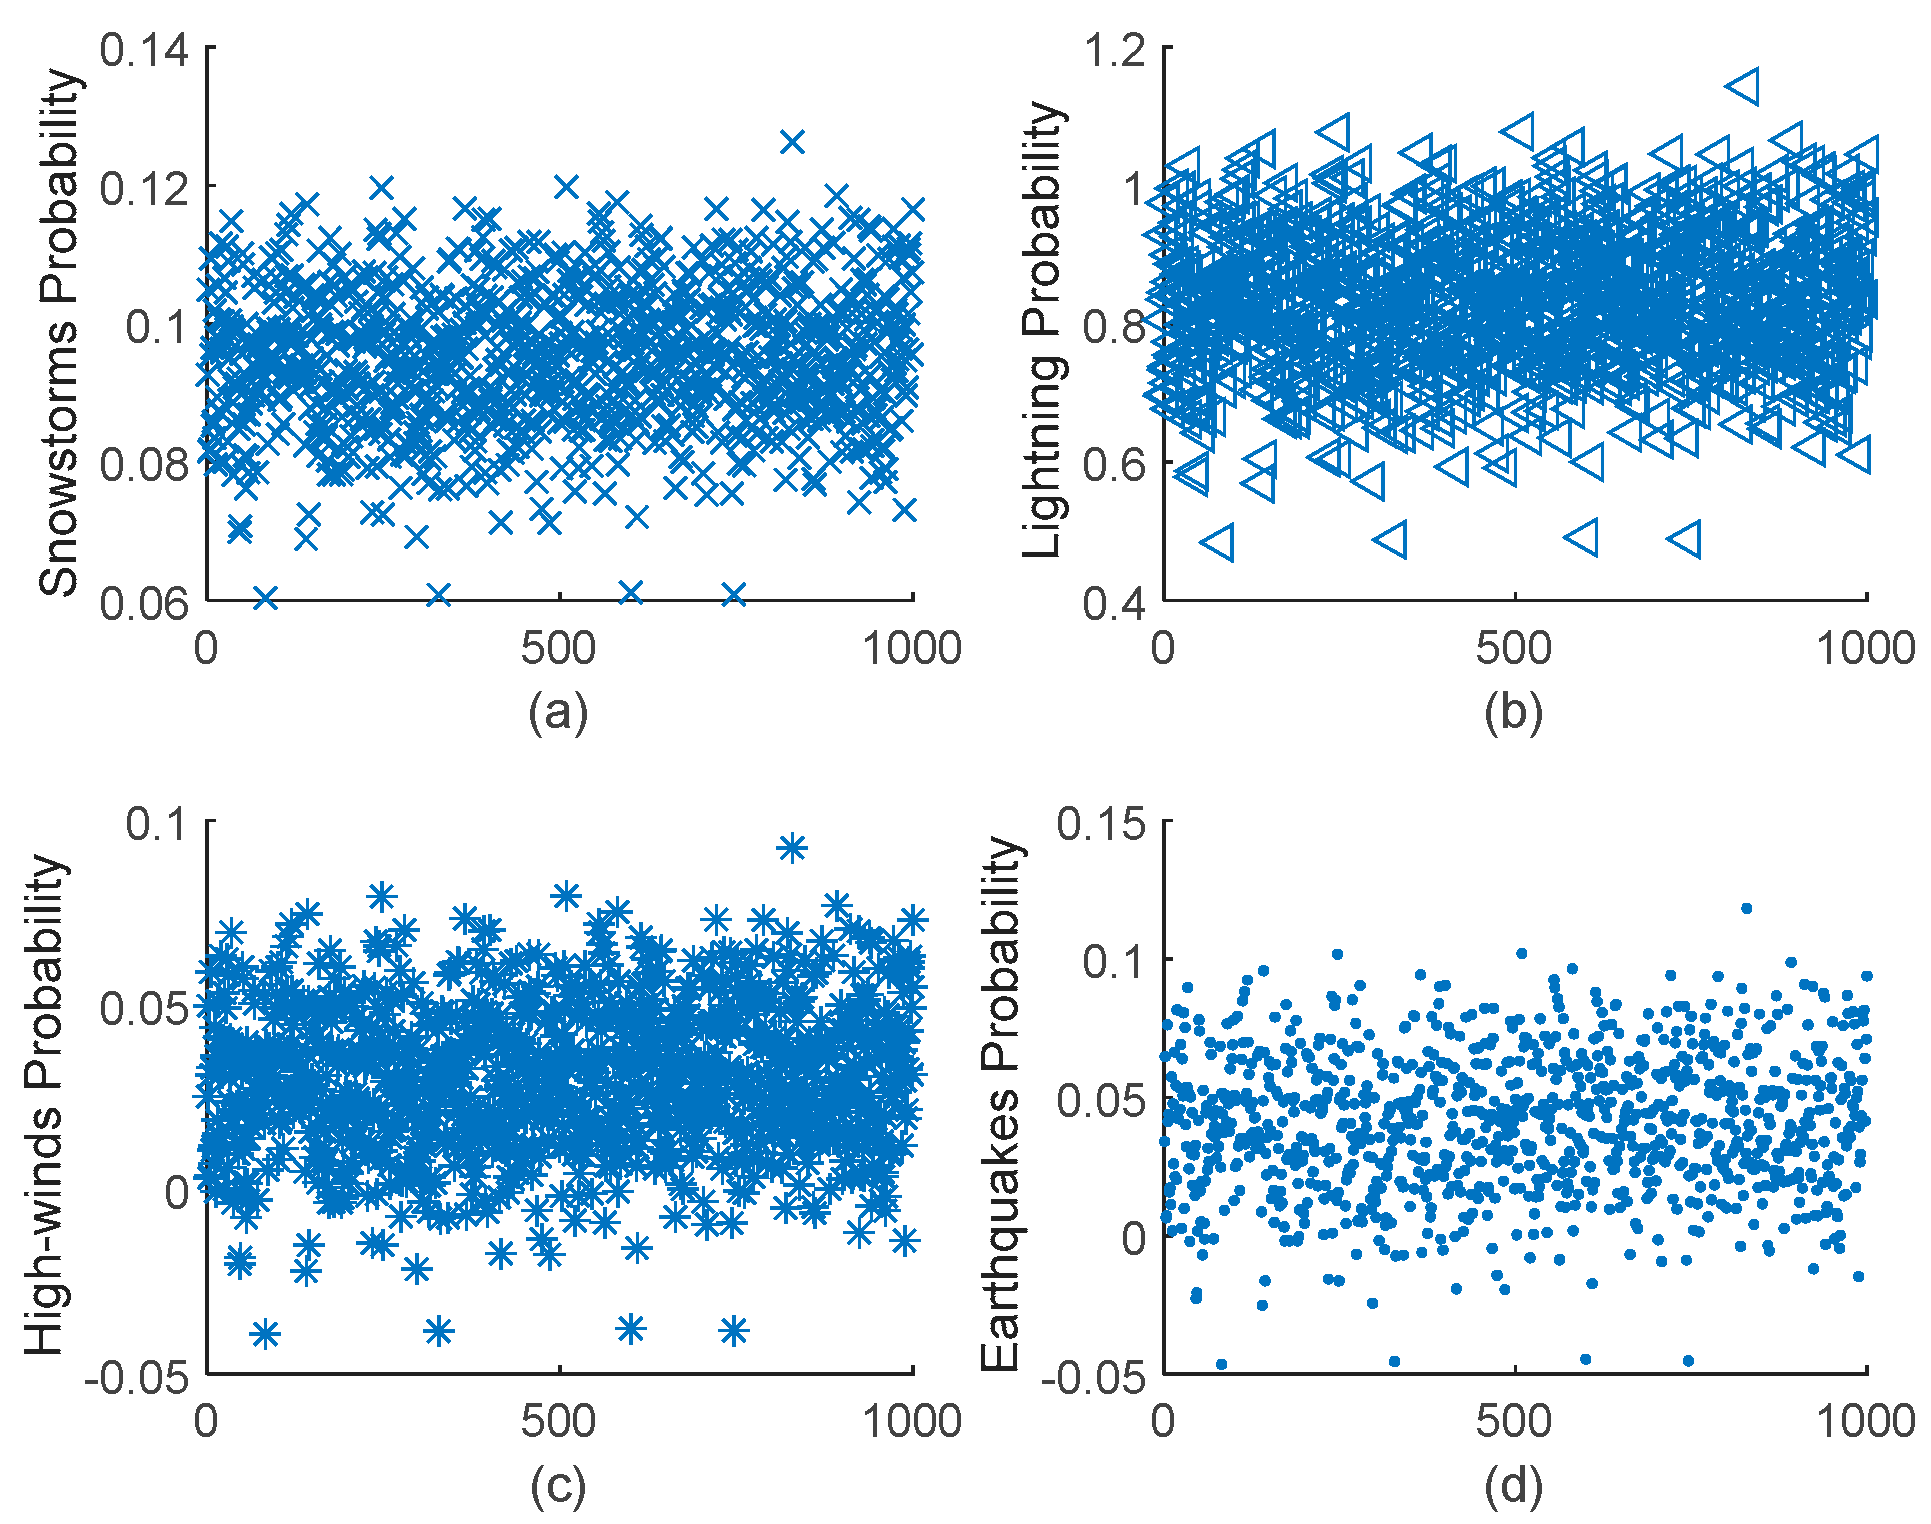
According to the statistics, the operation of transmission lines in the region is mainly affected by natural disasters such as snowstorms, lightning, high winds, and earthquakes. This paper is based on the Monte Carlo method to simulate the tripping of transmission lines under different natural disasters. According to the distribution function of tripping situations, 1000 tripping frequencies are randomly generated. The frequency approximation is used to replace the probability when calculating the probability of the tripping of transmission lines under different natural disasters. Figure 2 shows the Monte Carlo-simulated line trip probabilities for the four natural disasters. According to Bernoulli’s Law of Large Numbers, the probability p 1 of a line trip in this region by a natural disaster, in particular, snowstorms, lightning, high winds, and earthquakes, is 0.0953, 0.8288, 0.0321, and 0.0438. Using 
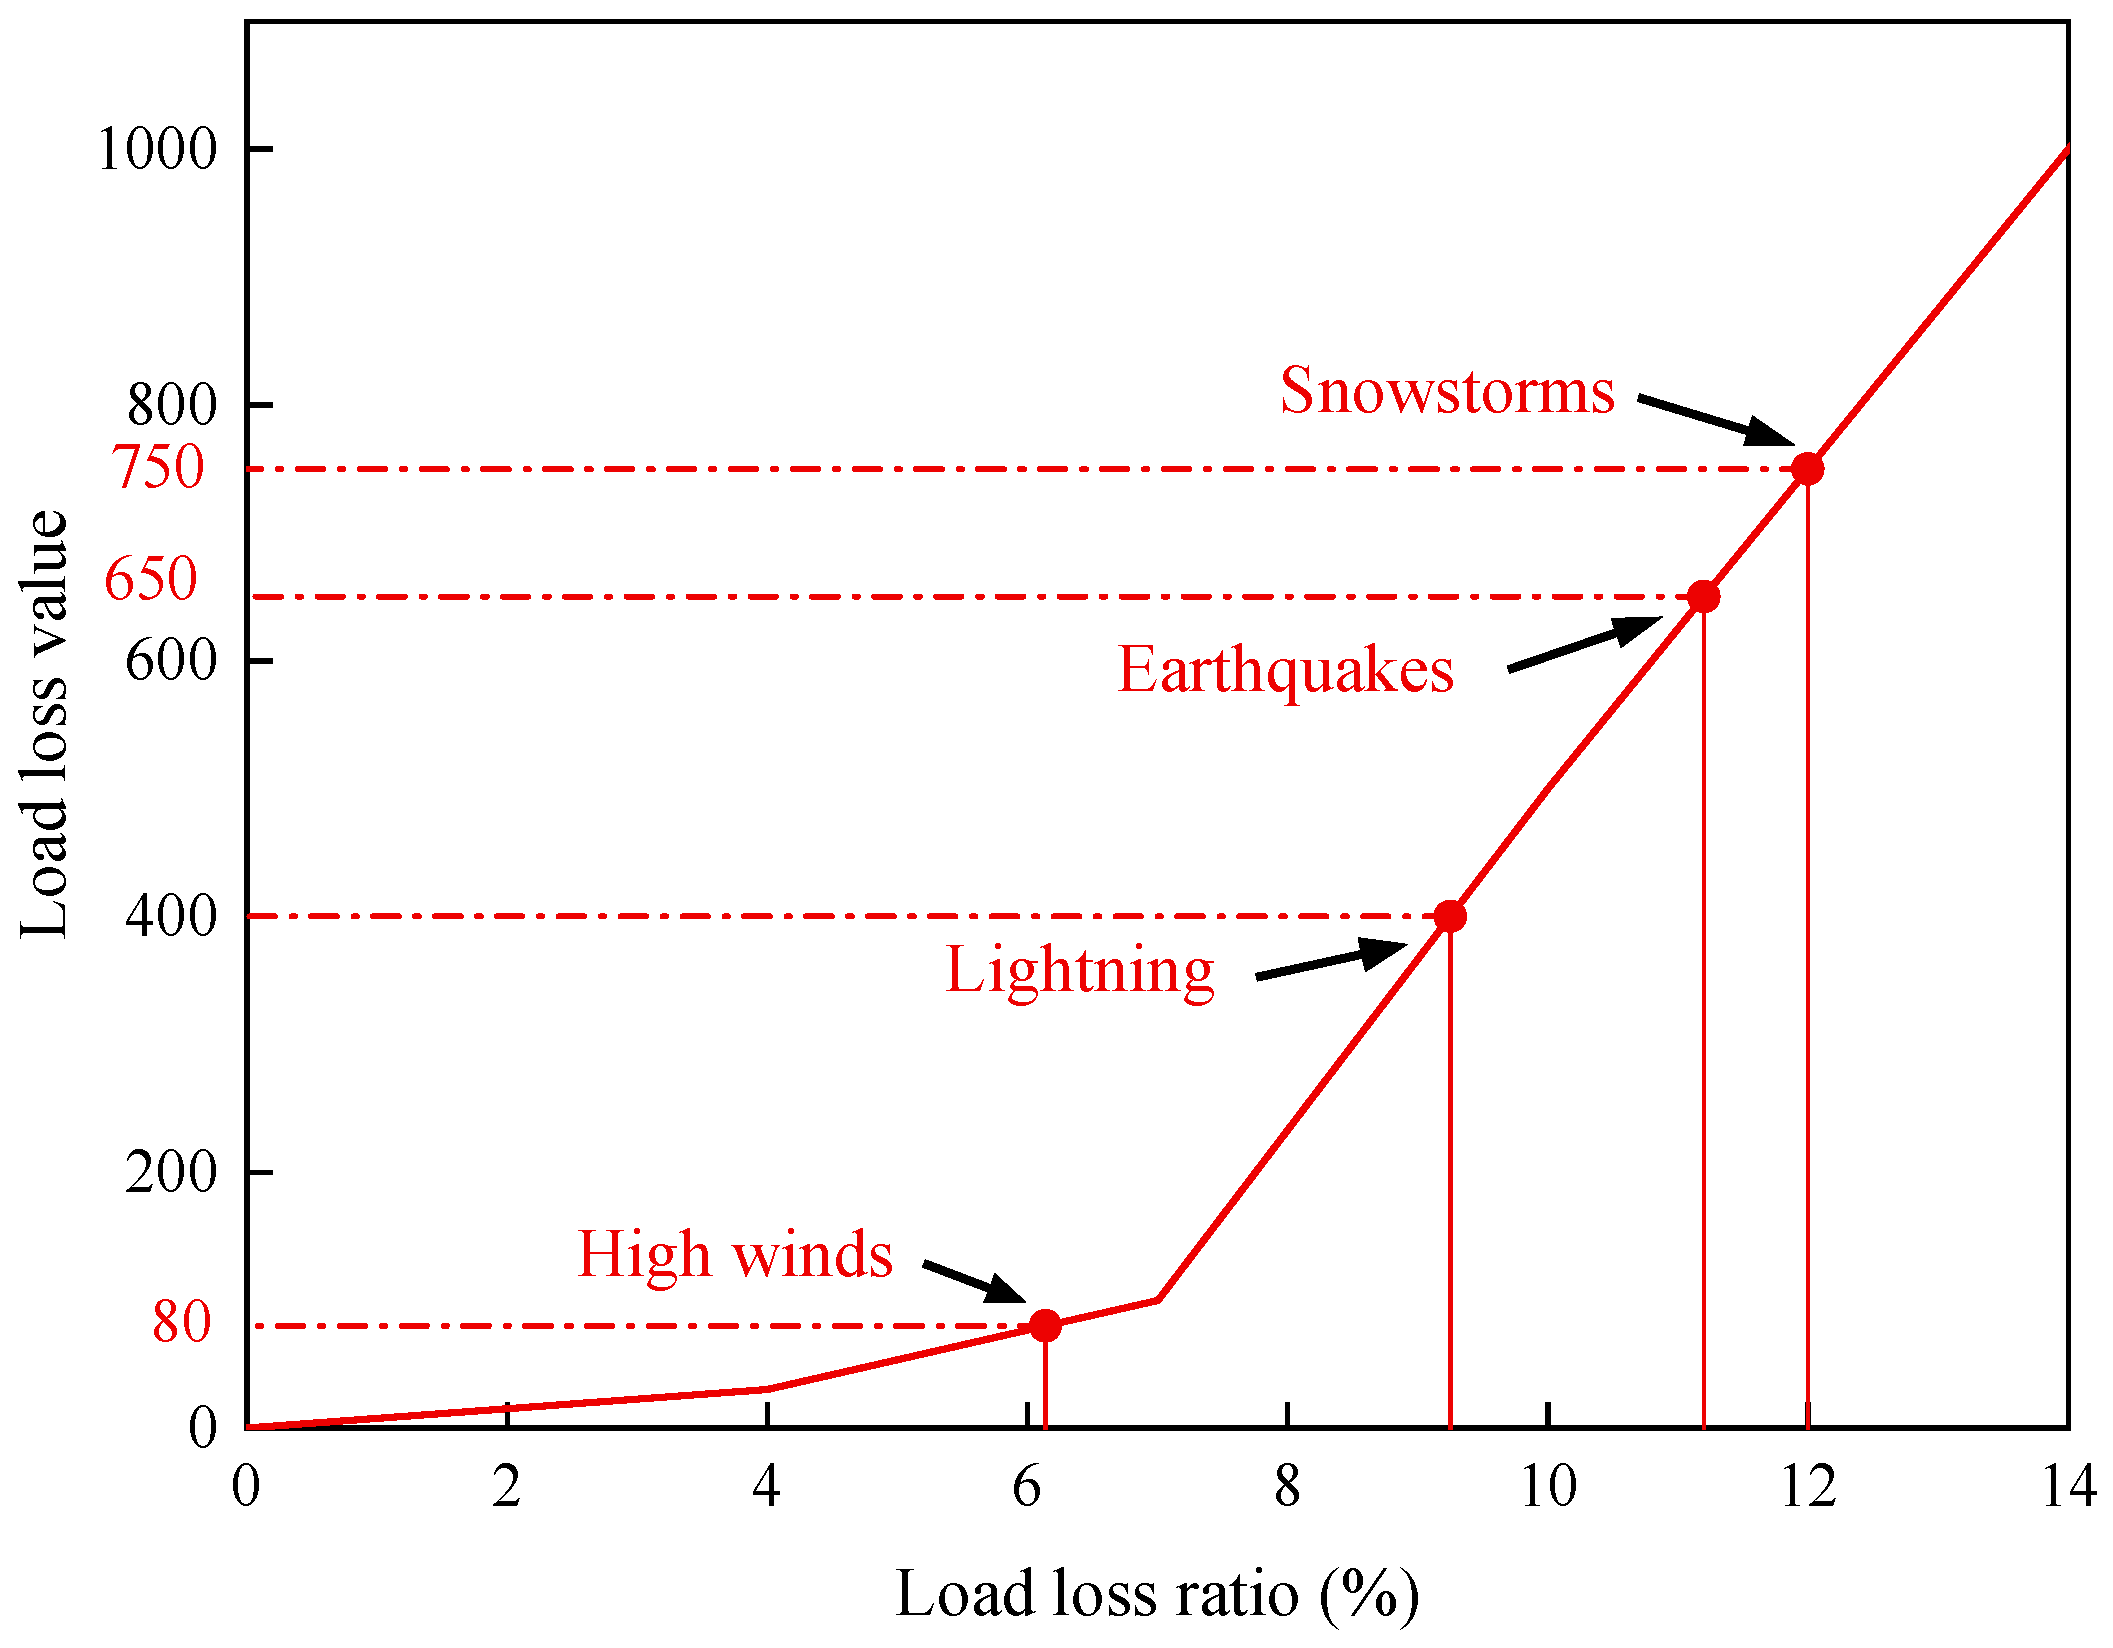
Table 2, combined with the actual situation of load loss under the four disaster types in the region, the load loss under the different disasters is scored using linear interpolation to obtain the line fault transmission capacity loss values y , shown in Figure 3. Snowstorms correspond to the second-grade power supply. Thunderstorms and earthquakes correspond to the first-grade power supply. Windy weather corresponds to the general period power supply. Noting the periods corresponding to the occurrence of the different disasters, the risk period coefficient α , for each disaster is taken from Table 3. The above data are shown in Table 6.

4.2. Weight Calculation Based on the ATP-EWM Method

According to the AHP-EWM, the weights of the different indicators are first calculated using the AHP method. Based on the impact of the different natural disaster indicators on the transmission lines in Table 6, the corresponding judgment matrix A is created as Equation (20), according to the scaling method of the judgment matrix in Table 4.
A = 1 3 5 2 1 / 3 1 3 1 / 3 1 / 5 1 / 3 1 1 / 5 1 / 2 3 5 1
This calculation gives λ max = 4 . 1042 . According to Equation (10), C I = 0.0347 . According to Table 5, R I = 0.90 . Using Equation (12), the consistency index test coefficient C R is used to test A . As C R = 0.0386 < 0.1 , the consistency test is satisfied. Therefore, the consistency of the judgment matrix is acceptable. The weight vectors corresponding to the snowstorm, lightning, high winds, and earthquake indicators are ω = ( 0.4600 , 0.1486 , 0.0665 , 0.3248 ) . The AHP considers the ranking of the risk indicators to be: snowstorm > earthquakes > lightning > high winds.
The EWM determines the weights by first determining the information matrix, which consists of the original matrix. This paper analyses the regional data for a region of Sichuan Province. Five years of data for the region were counted, and the system failure rates caused by the four natural disaster indicators for each year are shown in Table 7.
The mentioned failure rate is used as the data information matrix. The matrix X , is normalized to obtain the corresponding matrix B . Equations (15)–(17) determine the different evaluation indicators’ entropy values and weights, as shown in Table 8. The EWM calculates the snowstorm, lightning, high winds, and earthquake indicator weights as: 0.3216, 0.4310, 0.1282, and 0.1192. The EWM considers the ranking of the risk indicators to be: lightning > snowstorm > high winds > earthquakes.
Using Equation (18), the AHP-EWM calculates the snowstorm, lightning, high winds, and earthquake indicator weights as: 0.4421, 0.1977, 0.0697, and 0.3150. The AHP-EMW considers the ranking of the risk indicators to be: snowstorm > earthquakes > lightning > high winds.
In addition, this paper uses a principal component analysis (PCA) to calculate the weights of the indicators under the four natural disasters. A PCA processes the raw data for covariance and performs a principal component analysis by solving the results with its eigenvalues and eigenvectors. The PCA calculates the snowstorm, lightning, high winds, and earthquake indicator weights as: 0.7186, 0.2210, 0.1638, and 0.
The weight values of the four methods are shown in Table 9.
As seen in Table 9, there is a large difference in the weighting values for high winds and earthquakes when comparing the results of the EMW and AHP-EWM judgments. Based on actual operational experience, the hazard from earthquakes is greater than that from high winds. This could be due to errors in judgment influenced by an incomplete or biased collection of raw data. For the AHP, the order is the same as for the AHP-EWM, but the weight values for lightning have the largest difference. This could be due to the subjective preferences of the experts. The calculation results for the PCA differed significantly from the other three methods, which may be due to the differences in the variance ranges of the initial variables, resulting in a bias in the calculation results. The results of the above weight calculations show that the EWM fully utilizes the data information about the indicators and fully reflects the objective weight values, while the AHP fully reflects the subjective human factors of the experts. The EWM and AHP alone do not capture the actual importance and significance of the indicators. By combining the EWM and AHP, the weights not only contain the information from the data but also reflect the subjective judgment of the experts. This reconciles the effects of the subjective preference of the AHP experts and the bias of the objective data of the EWM, and the results of the evaluation are further adjusted to the risk factors.

4.3. Results of Transmission Line Risk Quantification

Based on Equation (4) and the natural disaster risk period coefficients α , from Table 6, the social impact factors for the different natural disaster risks on the transmission lines are calculated. Based on the risk reliability assessment system and the risk quantification theory for transmission lines under various natural disasters, the operational risk values for the transmission lines under various natural disasters are calculated, and the results are shown in Table 10.
According to Equation (7), the risk value for transmission line disaster operation is calculated as:
R = i = 1 n δ p 1 i y i α i w i = 114.5510
As Table 10 shows, the risk disaster value   R = 114.5510 corresponds to level III. The region should therefore take measures to protect the transmission lines and, thus, strengthen their resilience to natural disasters. Table 9 shows that the percentage of the disaster risk values for snowstorms, lightning, wind, and earthquakes in the region are 27.04%, 64.08%, 0.11%, and 8.77%, respectively. The failure probability from lightning has a significant social impact factor on the risk and, therefore, the largest proportional risk value. The social impact factor on the risk and line failure loss is higher for snowstorms. Thus, the second-highest risk is proportional. Earthquakes have a low-risk probability and a high-risk social impact factor and, hence, the third-highest risk percentage. High winds have the lowest line failure losses, risk probability, and social impact factor; thus, it has the lowest percentage of disaster risk.
The above algorithms are evaluated annually, and the meteorological hazards transmission lines are exposed to vary from season to season. It is also possible to refine the assessment of line operation risk on a quarterly or even monthly basis. Line risks are seasonal and regional, and most do not occur simultaneously. In Sichuan, for example, lightning peaks in the June–July period and declines after the middle of August. Snowstorms occur mainly in winter. The frequency of earthquakes is not seasonal, but relatively few seismic hazards cause tripping. While there have been more trips during these five years, most have been triggered by lightning, earthquakes, and snowstorms. The duration of the disaster is not long compared to the whole year. The probability of lightning is 64.08%. Therefore, a line’s operational risk assessment is primarily based on the lightning risk assessment, supplemented by the combined effect of the other risk assessments. The lightning risk capacity loss value is 400, and the risk period coefficient is 1.6. Thus, the overall composite risk score is 114.5510, which is reasonable and credible, as it is in risk level III. In future transmission line planning processes, risk assessment methods can be used to assess the region’s disaster risk. This can avoid the impact of the Sichuan earthquake zone or other high-frequency natural disasters on the tripping of transmission lines.

5. Conclusions and Future Work

This paper uses data on transmission line tripping caused by natural disasters in a region of Sichuan Province. AHP-EWM was used to calculate the risk weights in the risk assessment process. The following conclusions are drawn:
(1)
The theory of disaster risk quantification is proposed to quantify the transmission line disaster operation risk more comprehensively. The risk for the area is calculated at 114.5510, which is a reasonable risk level of III.
(2)
The use of AHP-EWM to calculate the risk weights counteracts the influence of highly subjective factors in the construction of the assessment matrix using AHP, and the influence of only objective factors considered using EWM, thus making the setting of indicator weights more accurate and reasonable.
(3)
The calculation results yield the risk of line tripping under various natural disasters in a region of Sichuan, providing support for the future planning of transmission lines in the region.
In this paper, only four natural disaster indicator factors were considered. To ensure the accuracy and authenticity of the assessment results, as many impact indicators as possible should be selected to ensure that the assessment results are more representative. In addition, multi-energy systems for distributed generation were not considered. Therefore, in future research, different power grids in other regions should select the corresponding operational indicators to assess the operational risk of the corresponding systems according to various operating conditions. The future planning and design of transmission lines should also consider the risk of line tripping under various natural disasters to reduce the impact of disasters on transmission lines.

Author Contributions

Conceptualization, R.F.; Methodology, W.Z. (Wenhui Zeng); Software, Z.M.; Validation, W.Z. (Wentao Zhang); Formal analysis, R.H.; Resources, J.L. All authors have read and agreed to the published version of the manuscript.

Funding

This work was supported by the Science and Technology Project of the State Grid Corporation (Grant No. 5108-202218280A-2-322-XG).

Data Availability Statement

Data sharing is not applicable to this article.

Conflicts of Interest

The authors declare no conflict of interest.

References

  1. Ebi, K.L.; Vanos, J.; Baldwin, J.W.; Bell, J.E.; Hondula, D.M.; Errett, N.A.; Hayes, K.; Reid, C.E.; Saha, S.; Spector, J.; et al. Extreme Weather and Climate Change: Population Health and Health System Implications. In Annual Review of Public Health; Fielding, J.E., Ed.; Annual Reviews; Palo Alto: Santa Clara, CA, USA, 2021; Volume 42, pp. 293–315. [Google Scholar]
  2. Perera, A.T.D.; Nik, V.M.; Chen, D.; Scartezzini, J.-L.; Hong, T. Quantifying the impacts of climate change and extreme climate events on energy systems. Nat. Energy 2020, 5, 150–159. [Google Scholar] [CrossRef]
  3. Weilnhammer, V.; Schmid, J.; Mittermeier, I.; Schreiber, F.; Jiang, L.; Pastuhovic, V.; Herr, C.; Heinze, S. Extreme weather events in europe and their health consequences—A systematic review. Int. J. Hyg. Environ. Health 2021, 233, 113688. [Google Scholar] [CrossRef] [PubMed]
  4. Panteli, M.; Mancarella, P. Influence of extreme weather and climate change on the resilience of power systems: Impacts and possible mitigation strategies. Electr. Power Syst. Res. 2015, 127, 259–270. [Google Scholar] [CrossRef]
  5. Yao, T.; Cheng, W.; Gao, H. The natural disaster damage assessment of Sichuan province based on grey fixed-weight cluster. Grey Syst. Theory Appl. 2016, 6, 415–425. [Google Scholar] [CrossRef]
  6. Pan, W.; Li, Y. Improving Power Grid Resilience under Extreme Weather Conditions with Proper Regulation and Management of DERs—Experiences Learned from the 2021 Texas Power Crisis. Front. Energy Res. 2022, 10, 921335. [Google Scholar] [CrossRef]
  7. Shi, Z.; Wen, X.; Liu, H.; Wang, H.; Wu, T. A control strategy for improving power system resilience in N-k contingency. Front. Energy Res. 2022, 10, 993408. [Google Scholar] [CrossRef]
  8. Xiang, K.; Zhou, Y.; Zhou, E.; Lu, J.; Liu, H.; Huang, Y. A Spatial Assessment of Wildfire Risk for Transmission-Line Corridor Based on a Weighted Naïve Bayes Model. Front. Energy Res. 2022, 10, 829934. [Google Scholar] [CrossRef]
  9. Morison, K.; Wang, L.; Kundur, P. Power system security assessment. IEEE Power Energy Mag. 2004, 2, 30–39. [Google Scholar] [CrossRef]
  10. Farkhadzeh, E.M.; Muradaliev, A.Z.; Abdullaeva, S.A.; Nazarov, A.A. Quantitative Assessment of the Operational Reliability of Overhead Power Transmission Lines. Power Technol. Eng. 2022, 55, 790–796. [Google Scholar] [CrossRef]
  11. Zekavati, A.A.; Jafari, M.A.; Mahmoudi, A. Regional Multihazard Risk-Assessment Method for Overhead Transmission Line Structures Based on Failure Rate and a Bayesian Updating Scheme. J. Perform. Constr. Facil. 2023, 37, 04022068. [Google Scholar] [CrossRef]
  12. Panteli, M.; Pickering, C.; Wilkinson, S.; Dawson, R.; Mancarella, P. Power System Resilience to Extreme Weather: Fragility Modeling, Probabilistic Impact Assessment, and Adaptation Measures. IEEE Trans. Power Syst. 2017, 32, 3747–3757. [Google Scholar] [CrossRef]
  13. Panteli, M.; Trakas, D.N.; Mancarella, P.; Hatziargyriou, N.D. Power Systems Resilience Assessment: Hardening and Smart Operational Enhancement Strategies. Proc. IEEE 2017, 105, 1202–1213. [Google Scholar] [CrossRef]
  14. Zuo, J.; Peng, S.; Yang, Y.; Li, Z.; Zuo, Z.; Yu, H.; Lin, Y. A Modified Multiparameter Linear Programming Method for Efficient Power System Reliability Assessment. Processes 2022, 10, 2188. [Google Scholar] [CrossRef]
  15. Ali, G.G.; El-adaway, I.H.; Sims, C.; Holladay, J.S.; Chen, C. Reducing the Vulnerability of Electric Power Infrastructure against Natural Disasters by Promoting Distributed Generation. Nat. Hazards Rev. 2023, 24, 04022052. [Google Scholar] [CrossRef]
  16. Liu, J.; Jia, B.; Zhang, Z.; Wang, Z.; Wang, P.; Geng, J. Lightning Failure Risk Assessment of Overhead Transmission Lines Based on Modified Dempster–Shafer Theory. Energies 2022, 15, 2538. [Google Scholar] [CrossRef]
  17. Wen, Y.; Chen, Y.; Wu, J.; Mao, X.; Huang, H.; Yang, L. Research on Risk Assessment and Suppression Measures for Ice-Shedding on 500 kV Compact Overhead Lines. Energies 2022, 15, 8005. [Google Scholar] [CrossRef]
  18. Reinoso, E.; Nino, M.; Berny, E.; Inzunza, I. Wind Risk Assessment of Electric Power Lines due to Hurricane Hazard. Nat. Hazards Rev. 2020, 21, 04020010. [Google Scholar] [CrossRef]
  19. Jones, C.B.; Bresloff, C.J.; Darbali-Zamora, R.; Lave, M.S.; Bezares, E.E.A. Geospatial Assessment Methodology to Estimate Power Line Restoration Access Vulnerabilities After a Hurricane in Puerto Rico. IEEE Open Access J. Power Energy 2022, 9, 298–307. [Google Scholar] [CrossRef]
  20. Deng, C.; Liu, Y.; Tan, Y.; Liu, J. The Power System Risk Assessment under Rainfall Weather and Subsequent Geological Disasters. In Proceedings of the 2016 China International Conference on Electricity Distribution (CICED), Xi’an, China, 10–13 August 2016; IEEE: New York, NY, USA, 2016. [Google Scholar]
  21. Manninen, H.; Kilter, J.; Landsberg, M. A holistic risk-based maintenance methodology for transmission overhead lines using tower specific health indices and value of loss load. Int. J. Electr. Power Energy Syst. 2022, 137, 107767. [Google Scholar] [CrossRef]
  22. Chen, W.; Zhou, Y.; Zhou, E.; Xiang, Z.; Zhou, W.; Lu, J. Wildfire Risk Assessment of Transmission-Line Corridors Based on Naive Bayes Network and Remote Sensing Data. Sensors 2021, 21, 634. [Google Scholar] [CrossRef] [PubMed]
  23. Shi, S.; Yao, C.; Wang, S.; Han, W. A Model Design for Risk Assessment of Line Tripping Caused by Wildfires. Sensors 2018, 18, 1941. [Google Scholar] [CrossRef]
  24. Zhang, N.; Kang, C.; Liu, J.; Xin, J.; Wan, J.; Hu, J.; Wei, W. Mid-short-term risk assessment of power systems considering impact of external environment. J. Mod. Power Syst. Clean Energy 2013, 1, 118–126. [Google Scholar] [CrossRef]
  25. Oboudi, M.H.; Mohammadi, M.; Trakas, D.N.; Hatziargyriou, N.D. A Risk-Based Framework to Improve a Distribution System’s Resilience against Earthquakes. J. Energy Eng. 2023, 149, 04022049. [Google Scholar] [CrossRef]
  26. Zhuang, G.; Wang, W.; Li, D.; Gao, S.; Wang, C. Research on identification method of weak links in transmission network considering strong wind in severe cold weather. J. Phys. Conf. Ser. 2023, 2450, 012042. [Google Scholar] [CrossRef]
  27. Božiček, A.; Franc, B.; Filipović-Grčić, B. Early Warning Weather Hazard System for Power System Control. Energies 2022, 15, 2085. [Google Scholar] [CrossRef]
  28. Zhang, W.; Shao, C.; Hu, B.; Xie, K. Pre-disaster transmission maintenance scheduling considering network topology optimization. Front. Energy Res. 2023, 10, 1116564. [Google Scholar] [CrossRef]
  29. Han, B.; Ming, Z.; Zhao, Y.; Wen, T.; Xie, M. Comprehensive risk assessment of transmission lines affected by multi-meteorological disasters based on fuzzy analytic hierarchy process. Int. J. Electr. Power Energy Syst. 2021, 133, 107190. [Google Scholar] [CrossRef]
  30. Zheng, Y.; Wu, Z.; Shu, S.; Xu, J.; Fang, C.; Xie, W. Lightning risk assessment model for transmission lines with lift-based improved analytic hierarchy process. IET Gener. Transm. Distrib. 2021, 15, 2905–2914. [Google Scholar] [CrossRef]
  31. Mokarram, M.; Pham, T.M.; Khooban, M.H. A hybrid GIS-MCDM approach for multi-level risk assessment and corresponding effective criteria in optimal solar power plant. Environ. Sci. Pollut. Res. 2022, 29, 84661–84674. [Google Scholar] [CrossRef]
  32. Yang, H.; Han, W.; Zeng, T.; Wang, K. Failure Risk Assessment of the Power System transmission Line based on an Improved Entropy Method. In Measurement Technology and Engineering Researches in Industry, Pts 1–3; Yarlagadda, P., Kim, Y.H., Eds.; Trans Tech Publications Ltd.: Durnten-Zurich, Switzerland, 2013; pp. 1514–1517. [Google Scholar]
  33. Fang, R.; Shang, R.; Wang, Y.; Guo, X. Identification of vulnerable lines in power grids with wind power integration based on a weighted entropy analysis method. Int. J. Hydrogen Energy 2017, 42, 20269–20276. [Google Scholar] [CrossRef]
  34. Xie, M.; Yin, Y.; Du, Y.; Cheng, P.; Liu, M. Assessment on available transfer capability considering complex weather risk sources. Electr. Power Autom. Equip. 2018, 38, 16–22. [Google Scholar]
Figure 1. Risk reliability assessment system for transmission lines under multiple natural disasters.
Energies 16 06548 g001
Figure 2. Monte Carlo stochastic simulation of the four disaster probabilities. (a) Monte Carlo simulation of snowstorms line fault tripping probability. (b) Monte Carlo simulation of lightning line fault tripping probability. (c) Monte Carlo simulation of high-winds line fault tripping probability. (d) Monte Carlo simulation of earthquakes line fault tripping probability.
Energies 16 06548 g002
Figure 3. Line fault transmission capacity loss value.
Energies 16 06548 g003
Table 1. Comprehensive operation risk levels for multiple transmission lines in the same tower.
Risk LevelRisk Impact LevelScore
Level IExtraordinary Loss R 1000
Level IIMajor Loss 300 R < 1000
Level IIISevere Loss 60 R < 300
Level IVGreater Loss 20 R < 60
Level VGeneral Loss 5 R < 20
Level VILesser Loss R < 5
Table 2. Transmission capacity loss level of transmission line failure.
LevelThe Loss Extent of Failure Delivery CapacityScore
1Area grid destabilization or loss of the load by more than 30%3000 or more
2Area grid loss load 10~30%500~3000
3Area grid loss load 7~10% 100~500
4Area grid loss load 4~7%30~100
5Area grid loss load 4% and below0~30
Table 3. Natural disaster risk period coefficient for transmission lines.
LevelPeriod of FailureScore
1Extraordinary power supply 2.0
2First-grade power supply 1.6
3Second-grade power supply 1.4
4Special period power supply1.2
5General period power supply1.0
Table 4. Judgment matrix, a i j , for the scaling method.
ScaleMeaning
1The factor i is equally important as j .
3The factor i is slightly more important than j .
5The factor i is significantly more important than j .
7The factor i is strongly more important than j .
9The factor i is extremely more important than j .
2, 4, 6, 8A median of adjacent judgments.
CountdownJudgments a i j and corresponding factors i and j .
Table 5. Random consistency indicator R I .
Matrix Order, n 12345678910
R I 000.580.901.121.241.321.411.451.49
Table 6. Relevant values for different disasters.
Disaster Type Probability ,   p 1 Load Loss Ratios y α
Snowstorms0.0953 0.12007501.4
Lightning0.8288 0.09254001.6
High winds0.0321 0.0614801
Earthquakes0.0438 0.11206501.6
Table 7. System failure rates corresponding to different impact indicators in a specific region.
Disaster Type20172018201920212022
Snowstorms0.02640.00910.14000.07780.0803
Lightning0.62080.66360.48220.58330.5508
High winds0.01320.00910.03110.01300.0459
Earthquakes0.03960.01820.04670.02590.0230
Table 8. The corresponding entropy values and weights under different impact indicators.
Disaster TypeEntropy ValuesWeights ω
Snowstorms0.8703 0.3216
Lightning0.8261 0.4310
High winds0.9483 0.1282
Earthquakes0.9519 0.1192
Table 9. The weight values determined using the four methods.
MethodsSnowstormsLightningHigh WindsEarthquakes
AHP0.4600 0.1486 0.0665 0.3248
EWM0.3216 0.4310 0.1282 0.1192
AHP-EWM0.4421 0.1977 0.0697 0.3150
PCA0.71860.22100.16380.0000
Table 10. Risk value of transmission lines under various natural disasters.
Disaster Type δ p 1 y ω S R
Snowstorms0.0667227500.4421 0.618930.9727
Lightning0.5801534000.1977 0.316373.4056
High winds0.022455800.0697 0.06970.1252
Earthquakes0.030676500.5040 0.504010.0475
Disclaimer/Publisher’s Note: The statements, opinions and data contained in all publications are solely those of the individual author(s) and contributor(s) and not of MDPI and/or the editor(s). MDPI and/or the editor(s) disclaim responsibility for any injury to people or property resulting from any ideas, methods, instructions or products referred to in the content.

