1. Introduction
The energy sector is responsible for a large share of anthropogenic carbon emissions that lead to climate change and global warming. The 2015 United Nations Climate Change Conference in Paris set the milestone of limiting the average temperature increase to below 1.5 °C [
1]. A total of 160 countries around the world have agreed to combat global heating through the installation of renewable energy sources (RES) for a more sustainable energy scenario. Consequently, the overall energy production by RES has increased from 20 to 28% since 2010, and the target is for production to reach at least 43% by 2030 [
2]. Focusing on the European Union (EU), the EU Green Deal and the “Fit-for-55” package set the goal is of reducing greenhouse gas emissions by 55% with respect to 1990 by 2030 [
3].
RES have a low carbon footprint and are, therefore, among the main candidates for energy sources that could be used to reach these decarbonization targets. In any case, their integration into the energy system is not straightforward. These sources are characterized by the high intermittency and non-programmability of the energy output, which complicates the balance between supply and demand in the power system [
4]. Grid-connected battery energy storage systems (BESS) represent a viable resource to cope with those issues and guarantee the balance, stability, and adequacy of a decarbonizing power system. Compared to other storage systems, BESS are close to market maturity, with prices dropping by 87% from 2010 to 2019 [
5]. The installed grid-scale battery storage capacity will expand 44-fold between 2021 and 2030 to 680 GW according to IEA [
6]. In addition, lithium-ion batteries outperform other storage technologies in terms of energy density, power density, and round-trip efficiency. Moreover, their operational reliability can last up to 20 years with suitable management strategies, such as temperature regulation and capacity augmentation [
7]. The success of this technology is attributed to the flexibility and scalability of these assets, coupled with their ability to behave as bulk energy systems. These characteristics enable the provision of a wide set of services to system operators and active users. Such services could reduce RES uncertainty and make BESS attractive investments.
Despite the possible enhancement that BESS could provide to electric power system operation, this technology still has shortcomings. Although battery prices are decreasing yearly, the overall cost per kWh is still high, representing the most common challenge. To cope with high capital costs, it is crucial to capture multiple cash flows to increase the financial viability of the project. The dynamic stacking of BESS services ensures higher profits for the asset [
8]. Therefore, it is of paramount importance to evaluate an efficient system operation that creates multiple streams of revenues to increase the economic benefits. To properly assess and optimize the cash flow, the owner of the system must optimally size the BESS, accounting for several economic aspects such as cell technology, installation cost, and maintenance cost. These expenditures are mainly affected by lifetime, battery capacity, and overall performance, which interact in a non-linear manner. The proper evaluation of these aspects allows for more accurate modeling and, consequently, a more precise economic analysis.
High-fidelity BESS modelization is mandatory to ensure accurate economic evaluation. This paper proposes a model-aware BESS-sizing procedure that accurately represents the performance of BESS in different energy markets during their lifetime, accounting for the main non-linearities. In general, the stacking of the services is mostly addressed by constant BESS models that do not consider the non-linearities of this technology and the presence of auxiliaries. Furthermore, service stacking with grid-scale storage is mainly investigated in a stand-alone configuration, without evaluating the possible services that the system can provide to an RES power plant. Lastly, services such as the capacity market have not been assessed to date. Based on the state-of-art described in the next section, the novelties of this work are as follows:
The work is structured as follows.
Section 2 reviews the modelization and the algorithms exploited for sizing BESS in the literature.
Section 3 describes the proposed empirical model, the methodology of the sizing procedure, and the novel algorithm proposed for stacking the energy markets.
Section 4 introduces the study cases.
Section 5 discusses the main results. Lastly,
Section 6 summarizes the activities and lists future works.
2. Literature Review
The BESS sizing procedure consists of identifying the most cost-effective configuration for the stakeholders. The application is complex and non-linear. This section aims to describe two different fundamental aspects of the procedure: the modeling, and solution methods [
10].
2.1. Modeling
Modeling focuses on the mathematical representation of the key components of BESS. A wide number of approaches have been developed, with different levels of complexity and computational effort. According to the degree of physical insight, battery models can be divided into three different levels: electrochemical model, circuit-oriented (or electrical) model, and black box models (empirical or stochastic) [
11]. The selection of a model is bounded to the application area. Namely, a specific model ensures a different degree of accuracy and computational effort, and depending on the details required by the implementation, an efficient balance between the two characteristics improves the quality of the analysis. For instance, electrochemical models are the most accurate approach to battery representation. They describe the chemical reactions that take place in the electrodes and the electrolytes using a set of non-linear differential equations [
12]. The expressions detail the effect of the electrochemical reactions, such as the diffusion, migration, kinetic phenomena, and lithium concentration, to truly represent the state variables of the system [
13]. A description of the batteries at a microscopic scale accurately represents the key behaviors of the nonlinear system [
14]. Although there is no doubt regarding the accuracy of electrochemical models, they are used in low-speed applications, such as online capacity estimation [
15,
16], predictive maintenance [
17] or the validation of complementary models [
18]. Circuit-oriented models are electrical equivalent models that are able to represent the state variables of the batteries [
11]. Electrical models consist of electrical circuits made by capacitors and resistances, whose proper connection emulates the behavior of the batteries. The basic electrical model, known as Rint, has a big capacitor that can describe the open-circuit voltage of the cell, and a series resistance that can simulate the battery’s internal resistance [
19]. Moreover, RC circuits can be connected in series to the Rint model to increase the order of the system and emulate relaxation and polarization effects [
20]. Despite the empirical nature of those elements, these modelizations are widely adopted thanks to their computational efficiency in capturing the dynamic response of the system [
21]. The ability to estimate the state of batteries in real-time makes these models suitable for applications such as EV state estimation [
20], and grid stability [
22,
23]. Furthermore, electrical models ensure a good performance when evaluating the terminal voltage and SOC of the batteries. Articulated modelization, such as a three-order model, allows for these state variables to be described with errors lower than 1% [
21,
24]. However, if the accuracy of the model increases, the same occurs regarding the computational effort [
25]. In sizing applications, computational efficiency is a priority since it requires the evaluation of steady-state performances over a long time-window (e.g., 15–20 years). Therefore, the complexity of the electrical model could not produce results that are valuable for the procedure in a reasonable time. Empirical models ensure the optimal computational effort for this kind of analysis. The modelization is characterized by mathematically constructed models that utilize the observed data and measurements to represent the behavior and performance of BESS systems. These models are developed by an analysis of real-world operational data and the characteristics gathered from datasheets or experiments, allowing for them to capture the key relationships and patterns between various parameters [
26,
27]. By leveraging statistical techniques, regression analyses, or other mathematical approaches, empirical models provide a parametric representation of how different factors, such as battery lifetime, efficiency, and capacity, interact and impact the overall performance of BESS systems [
9].
A fair share of BESS sizing procedures are based on scalar linear empirical systems that resemble the BESS performances. In [
28], a constant battery and inverter efficiency model has been exploited to size a PV residential system by evaluating the economic criteria of the annuity method. Study [
29] investigates the optimal sizing of BESS through a life-cycle cost model. This model inspects the different phases of the system, also accounting for the final decommissioning, maintenance and recycling, and disposal as a reduction in the economics of the system. Ref. [
30] proposes a constant-efficiency empirical model to size an energy storage system, accounting for hosting capacity and reductions in wind curtailment. Although these simplified empirical models represent the easiest approach to configuring and producing results for BESS, they are generally the least accurate [
31]. Nevertheless, high-fidelity empirical models that represent varying efficiencies and power capabilities depending on SoC and C-rate improve the accuracy of the analysis [
32]. These approaches rely on experimental campaigns to create a computationally efficient BESS model that contains an error. In [
33], a regression technique has been exploited to build a non-linear BESS with an average SOC root mean square error of 3%. In [
34], a detailed non-linear power losses model has been implemented to more precisely capture the low-efficiency working region of the storage system. In [
9], a grid-scale BESS has been modeled with lookup tables to represent the non-linear efficiency and the auxiliary consumption of the system, ensuring an average SOC error of 0.168%. Despite the high fidelity of the modelization, the latter applications are limited to the operation perspective, and no one has used the accuracy of the model to size the BESS.
2.2. Solution Method
The solution method consists of the approach used to investigate the optimal size of the BESS, i.e., the mathematical procedure adopted to set the schedule and the dispatching of different services. The goal of the algorithm selected in the sizing procedure is to identify the best power setpoint to efficiently maximize the benefits generated by the BESS. The algorithm needs to emulate the provision of diverse and multiple services by the BESS. Namely, at each time step, given the actual SOC, the storage system is charged or discharged according to a logic that improves the welfare of the BESS owner. Most existing studies are based on mathematical programming due to their ability to identify a global optimum for the objective function under analysis. Stochastic Dynamic Programming (DP), and stochastic Mixed-Integer Linear Programming (MILP) or techniques derived from these two approaches are the most-adopted solutions to the sizing problem [
35]. For instance, studies [
36,
37] propose a stochastic MILP and DP, respectively, to optimize the sizing of a grid-scale storage system with constant efficiency. However, these methodologies show important limitations in terms of the modeling and objectivity of the solution [
38]. The optimal sizing problem is a non-convex and non-linear combinatorial optimization problem [
39]. Therefore, MILP-sizing procedures need to rely on techniques such as relaxation, piecewise linear approximation, or the implementation of a constant efficiency to generate a problem that can be treated by the standard solvers [
32,
40,
41]. However, DP is afflicted by dimensionality problems that need to be solved with the so-called approximated dynamic programming [
42,
43]. Although these techniques solve the main issues related to computational effort, their implementation comes at the expense of accuracy. Moreover, sizing problems are computationally intensive, and many works consider a timeframe that does not evaluate the whole investment lifespan. Lastly, to properly manage technical and economic targets, multi-objective functions are typically required [
44]. These lead to a lack of objectivity in the solutions, which needs to be properly evaluated with Pareto analysis [
45]. It follows that mathematical programming cannot provide diversified system operation. However, without the support provided by these techniques, it is necessary to develop algorithms that are capable of efficiently scheduling the assets. Furthermore, considering the actual cost of BESS, the profits from multiple applications are fundamental to generating a positive investment. Therefore, algorithms capable of effectively stacking the services are necessary to improve the economics of a storage system. Implementing those algorithms is not straightforward, since BESS are limited in power and energy. The desired output of the service stacking problem is a strategy for optimal capacity allocation during a given period, accounting for market prices and system dynamics. Three distinct types of service stacking are defined in the literature: sequential, parallel, and dynamic [
46]. In parallel stacking, a constant allocation of storage capacity is given to the services whilst the sequential multi-use provides these services in turn. The dynamic multi-use aims to increase profit as it combines the advantages of the two predecessors. It follows that service stacking in sizing applications is a complex topic and aspects such as the type of stacking or the services’ optimum sizing represent important challenges for the stakeholder [
47]. Furthermore, power plant configuration has a relevant role in the BESS-sizing procedure due to the different services that this technology can provide. For instance, a BESS coupled with an energy district could perform tasks such as load peak reductions and smooth power injections. Vice versa, in a stand-alone setup, the main activities are exclusively grid- and market-oriented. BESS-sizing approaches have been categorized into four main categories to deal with different configurations: microgrids, distributed renewable energy systems, standalone hybrid renewable energy systems, and renewable energy power plants [
48]. Despite the wide interest in BESS-sizing in the literature, the proposed approaches typically focus on a single configuration. Conversely, industrial and utility-scale BESS stakeholders are interested in flexible tools that are able to evaluate heterogeneous configurations of power plants, storage systems, markets, and services.
Table 1 lists the studies that have addressed the stacking of services for a grid-scale BESS.
As stated in the Introduction, this work improves on the state-of-the-art by developing a high-fidelity model of BESS and novel stacking algorithms, considering both stand-alone and RES-coupled operations.
3. Methodology
This work proposes a novel flexible tool evaluating the size of a BESS and computing its cost-effectiveness while providing multiple services. The exploitation of the tool has been eased thanks to a graphic user interface (GUI) developed in The structure allows for the easy evaluation of candidate groups of BESS and identifies the configuration that ensures the best economic return. The GUI compares different specific BESS sizes to accurately assess the trade-off between the size and the cost. The procedure is designed to be compatible with the generic EU market (e.g., it implements standard balancing products, and considers the day-ahead market according to the EU framework), meaning that it can be easily adapted to different requirements. However, the focus of the proposed algorithm in this paper is specifically related to the Italian market (e.g., the ancillary services market price scenarios and award rates, a well as the rules and prizes of the capacity remuneration mechanism, suit the Italian case).
This procedure may investigate both stand-alone and BESS hybrid-renewable energy power plants with wind and photovoltaic services connected to the national grid. Furthermore, the power managed at the point of delivery (POD) with the grid can be limited to a specified value to address study cases where there is an existing contractual connection power, and the curtailment of the overproduction is foreseen. The proxy model adopted in the procedure is a high-fidelity (cf. realistic) empirical battery model based on an experimental campaign at the Joint Research Centre (JRC) of Ispra (VA-Italy) on nickel–manganese cobalt (NMC) BESS [
9]. The main features are the efficiency of the overall system, including transformer and power-conversion systems, and the auxiliary consumption. The nonlinear round-trip efficiency is expressed as a function of power and SOC through look-up tables. Instead, the auxiliaries’ consumption relies on the power flown in the BESS and the ambient temperature. Although the model emulates the performances of NMC technology, its structures easily allow for the fitting of the data of different electrochemical technologies (e.g., lithium iron phosphate or even non-lithium-based batteries).
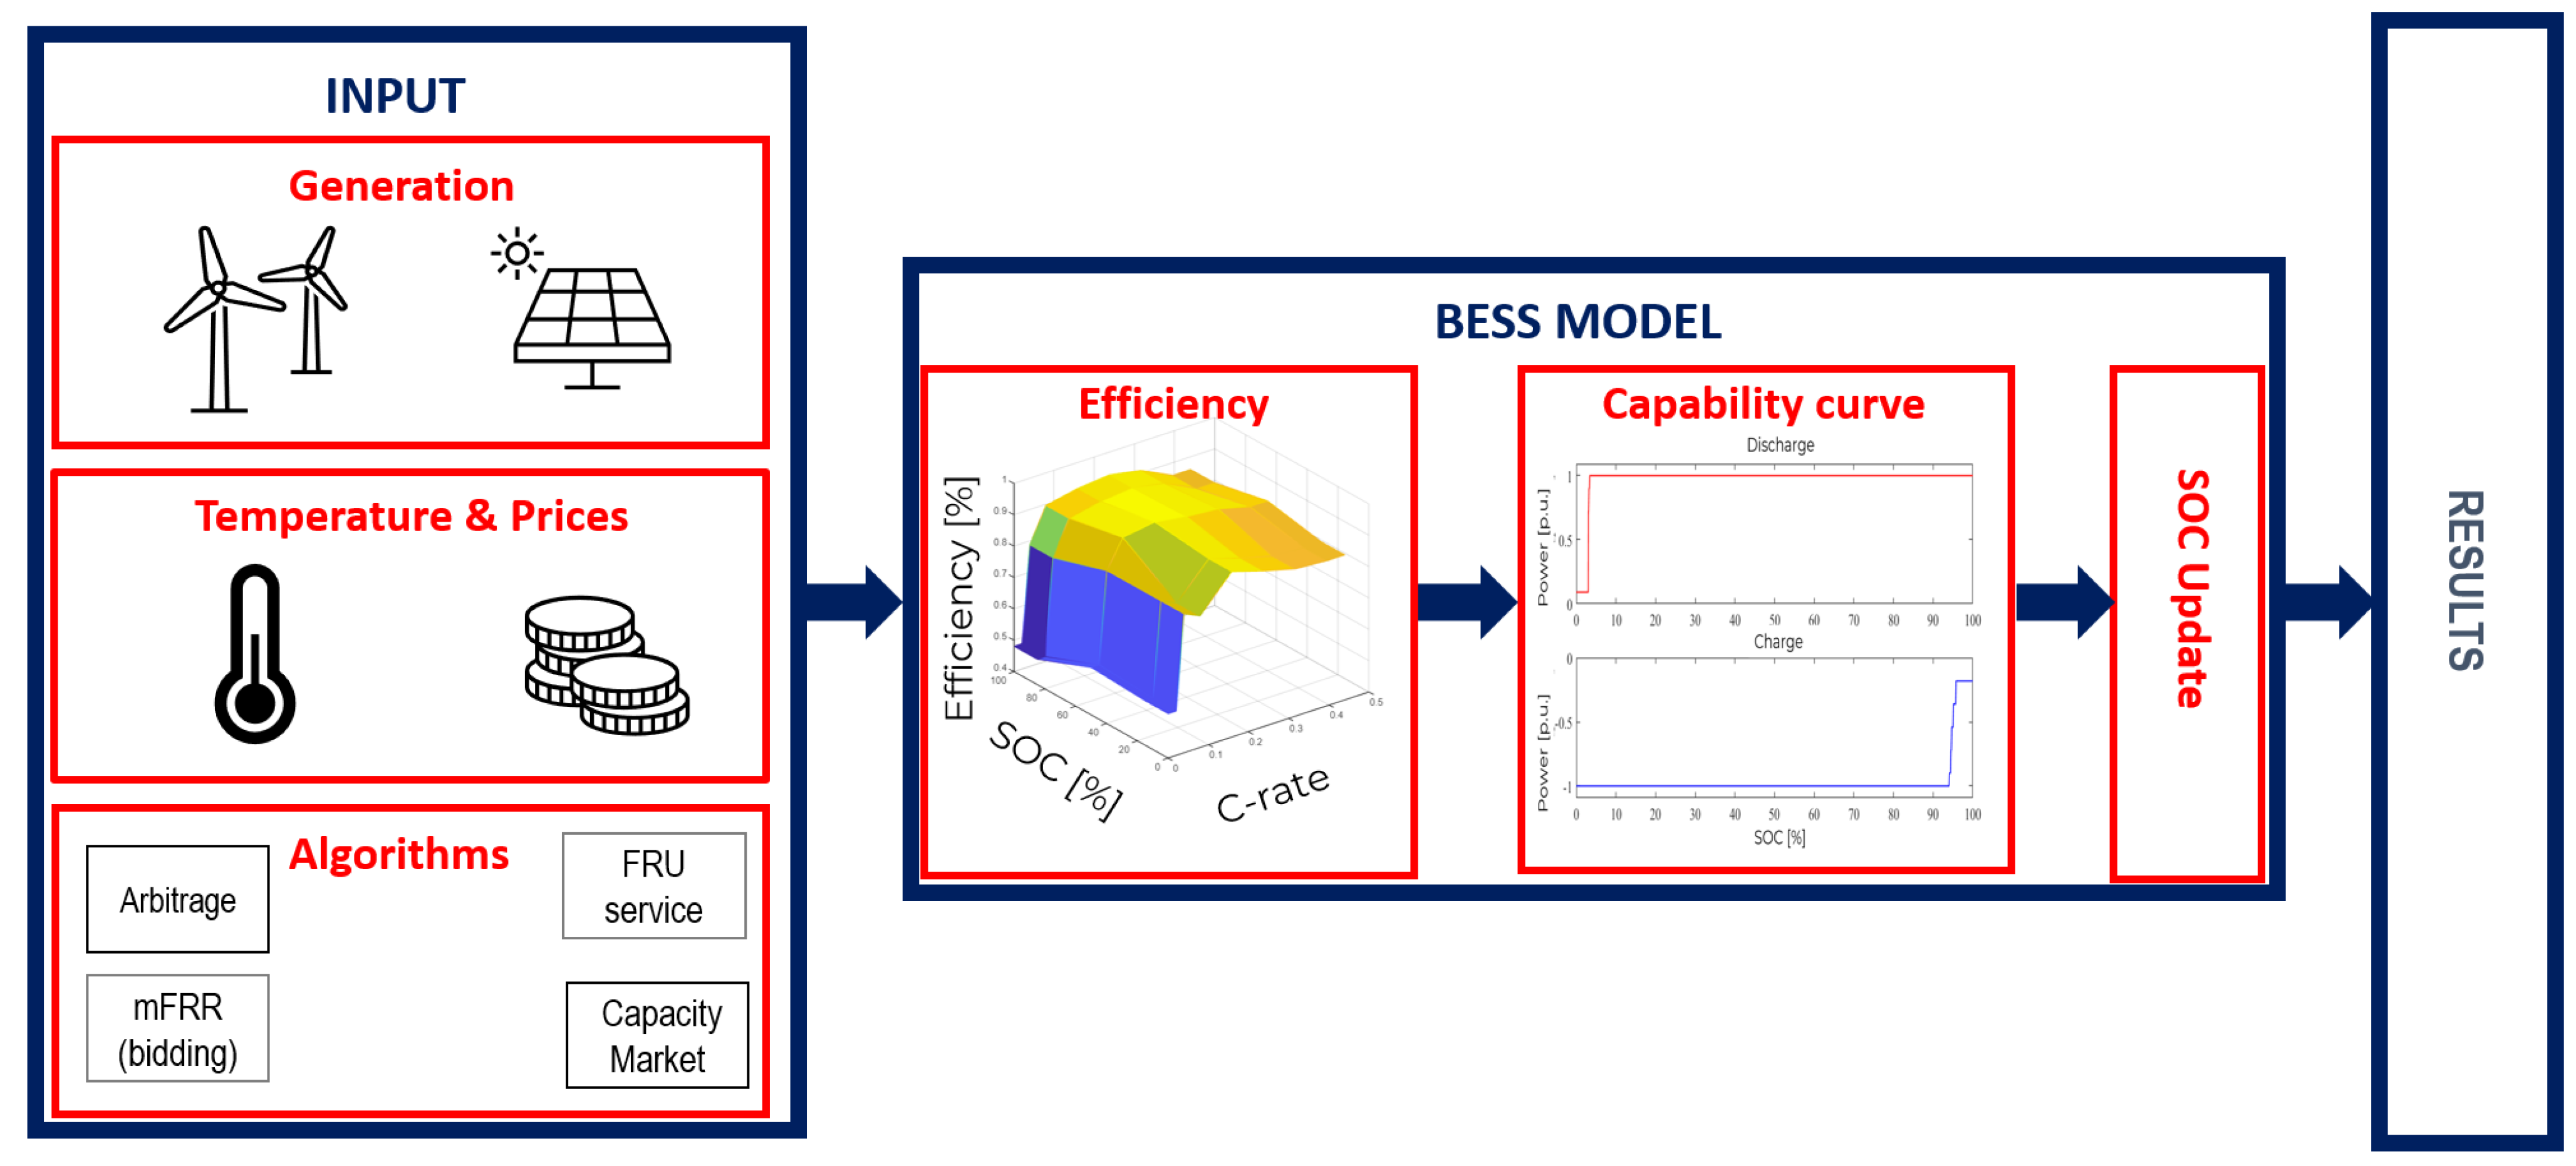
Figure 1 depicts the block diagram of the high-fidelity empirical model adopted in this work using
. Each block has a specific purpose that ensures the emulation of a large-scale BESS. The overall efficiency block takes the AC power, and the SOC as input and converts them into DC power using the previously mentioned look-up table. After this, the DC input is processed by the capability curve that limits the C-rate depending on the actual SOC. Lastly, the actual C-rate is used to update the SOC of the system. Inside the latter block, the energy content of the system is evaluated at each time sample.
To ensure a realistic representation of BESS performances, an aging model from the literature was inserted into this framework. It is well-known that capacity degradation is affected by various chemical reactions, which can typically be classified into two major phenomena: calendar and cycle aging [
57]. To account for these processes, two equations that describe the cycle and the calendar aging of the system have been inserted into the SOC update block to reduce the nominal capacity throughout the simulation. Both expressions were obtained from the literature. The cycle aging is related to the use of the BESS and its C-rate. The complete expression implemented in the model was obtained in [
58].
Equation (1) describes the system degradation due to cycling by evaluating the depth of discharge between each time sample and the specific C-rate at which the BESS is cycled. The proposed tool investigates the BESS operation with a 15-min granularity, over a very long time window of up to several years; consequently, the equation computes the percentage of capacity reduction generated in 15 min by a specific constant C-rate.
The second degradation mechanism has been modeled as a constant-capacity degradation in the square root of time function. This trend has been widely adopted to describe the chemical reaction inside the system that occurs due to calendar aging. The expression adopted in this work is based on [
59], assuming an average SOC of 50% for the system.
Equation (2) reports the capacity calendar degradation depending on the age of the storage system, considering the gas constant and the temperature at which the system is kept by the auxiliaries. It has been assumed that the two effects superimpose to continuously update the SOH of the system. Therefore, at each time sample the BESS’ nominal energy is reduced depending on the C-rate and the time that has elapsed.
The left side of
Figure 1 reports the possible power plant setup evaluated by the tool. The inputs for the analysis are time series that can be ascribed into three different categories: energy, market, and ambient inputs. An additional block considering the optional presence of RES plants was also included to investigate hybrid configurations. Energy input returns the MW production of a given RES plant, if present. Market input contains fundamental information about the structure of each service being addressed. Lastly, temperature inputs are necessary for the auxiliary consumption of the BESS model. These parameters can be easily changed thanks to the GUI, which allows for the selection of the Excel file that is necessary for the analysis.
The evaluation of the nominal energy of the BESS depending on a given set of inputs is evaluated by the tool with iterations of different sizes through the definition of two distinct sets of parameters: nominal power and energy-to-power ratio (EPR). Moreover, if the storage system is coupled with RES, the tool can evaluate variable power plant sizes.
The cost-effectiveness of BESS relies on the profits that the asset can generate by participating in different services. Therefore, different algorithms were developed to emulate the participation of the BESS in various energy markets. Each algorithm elaborates the inputs and returns a power setpoint that simulates the dispatching of the BESS power flows or the possibility of charging using the assets in the energy district.
The algorithms proposed in this paper are analytical adaptive algorithms. Every day, the input data are fed to the algorithms that compute the operation of the BESS as a combination of charge and discharge signals. The simulation calculates the cash flow for twenty years for each size. The outcomes of each analysis are exploited to compute the performance indicators fundamentals to determine the optimal size of the system. The tool evaluates the internal rate of return (IRR) and the CAPEX that is covered to quantify the cost-effectiveness of each investment. The IRR was computed with the financial toolbox implemented in
. Instead, the CAPEX covering 20 years was obtained following Equation (3), using the constant interest rate r.
CAPEX and OPEX are properly addressed in the analysis. Equation (4) describes the capital cost as a product of the nominal energy and an exponential function of the duration. This expression was obtained through an interpolation of the values reported in [
60].
This condition is justified by the fact that equipment cost is strictly correlated with the power being handled and not only with the nominal energy. The hypothesis adopted for this work is that yearly OPEX corresponds to 2.5% of the CAPEX [
61].
Lastly, due to the novelties of the application, a validation procedure based on previous works has not been added. Nevertheless, the high-fidelity empirical model represents an updated version of a previously developed structure. In [
62], the adopted model has been compared with state-of-the-art models: the accuracy of performance representation increases when using a variable BESS efficiency and considering auxiliary system demand.
The algorithms implemented in the tools aim to emulate participation in different services. The next paragraphs briefly describe the logic adopted for their implementation. Four services typically present in EU markets have been modeled: energy arbitrage, capacity market participation, the provision of manual Frequency Restoration Reserve (mFRR), and the provision of fast frequency regulation within the Fast Reserve (FR) project. Each algorithm generates a signal that simulates the charge and discharge requirement for the BESS that participates in the specific service.
3.1. Energy Arbitrage
The term energy arbitrage refers to the possibility of storage systems exploiting day-ahead market spread to generate profits. To achieve this control, the algorithm identifies the minimum and maximum prices of the market each day to set up the proper control logic. The algorithm was limited to a cycle per day to cope with the uncertainty of the prices that are always present in a multi-year analysis. To grant an economic profit, the procedure has a feedback control that checks whether the cycling cost of the system cancels the profits per cycle. Namely, this cost can be described as the total lifetime cost of the investment in electricity storage, divided by the cumulative delivered electricity. This parameter is customizable from the GUI and impacts the arbitrage provision. Furthermore, in case of BESS coupled with RES, if the RES power plant produces a power higher than the POD limit (i.e., the contractual connection power), the algorithm directs the exceeding generation toward the BESS if it is not fully charged. The latter charging process is considered free of charge since that energy will be curtailed if not stored. To properly address this aspect, an SOC control is implemented inside the algorithm to check the boundary condition of the storage system. Lastly, it has been hypothesized that the BESS acts as a price-taker in the day-ahead market. Algorithm 1 describes the structure of the energy arbitrage algorithm in detail.
| Algorithm 1: Energy Arbitrage |
Input:
Output: ,
CHARGE PHASE
for I in 96 (quarter of hours in a day) do
if
if
Else
If
for i in 96 (quarter of hours in a day) do
if
if
Else
DISCHARGE PHASE
for i in 96 (quarter of hours in a day) do
while > 0
if
if
Else
SOC CONTROL
for i in 96 (quarter of hours in a day) do
If
Else if
PROFITS PER CYCLE CONTROL
for i in 96 (quarter of hours in a day) do
If
If
|
3.2. Capacity Market
The electricity capacity market is coupled with the energy market. The scope of this service is to ensure power plant owners have sufficient capacity to meet the system demands and reliability. Participation in the market is defined through a tender procedure. The winners receive the capacity payment if they correctly provide power during the scarcity hours defined by the authority. In Italy, the assets that won the tender are entitled to the capacity payment if they participate in the day-ahead market in 1000 mandatory hours. The capacity payment differs from each power plant and is based on the probability of derating a given technology. Namely, the Italian authority associated a parameter with each type of power plant, related to their reliability in producing the nominal power [
63]. This value reduces the capacity payment depending on the characteristics of each technology. For instance, BESS derating is shown in
Table 2 and is proportional to the duration of the storage system, which means that a larger duration ensures better reliability in the provision of the capacity. Thus, the remunerated power of a BESS is its qualified power times (1—derating).
Furthermore, the non-programmable RES, due to their reliance on natural phenomena, face difficulties in providing a constant power setpoint. Hereby, the Italian authority has defined a derating factor for the capacity payment that these power plants can receive.
Table 3 details the derating factor for the capacity payment of wind and PV power plants.
In this work, when the capacity algorithm is enabled, it is assumed that the hybrid power plant has won the tender for, and participates in, the capacity market. The capacity payment can be extended to account for a hybrid system with multiple energy sources following Equation (5), where the overall remunerated capacity
is equal to the summation of the product between the peak power
and the derating
of each technology multiplied by the capacity payment
specified by the user. Algorithm 2 describes the logic used to emulate the capacity market inside the model.
| Algorithm 2: Capacity Market Algorithm |
Input:
Output: ,
If() > 0
CHARGE PHASE
for i in 96 (quarter of hours in a day) do
if
if and
Else if and
DISCHARGE PHASE
for i in 96 (quarter of hours in a day) do
if
if
Else
Energy Arbitrage Algorithm (Algorithm 1) |
The derating parameters adopted in this work are those proposed by the Italian authority and reported in
Table 2 and
Table 3. Nevertheless, the tool allows for those values to be adapted to a different regulatory scenario.
Lastly, the inadequacy of an asset to properly participate in the capacity market is computed ex-post. This calculation is mandatory to verify if the system correctly provides the requested capacity and is entitled to the capacity payment. The criteria established by the Italian authority foresee a neglection of the payment when the power plant does not provide more than 80% of the capacity for at least three months.
3.3. Manual Frequency Restoration Reserve (mFRR)
mFRR is the manual activation of frequency reserve that has the purpose of restoring the power balance of the electric power system. In Italy, this service is traded in the ancillary services market with a pay-as-bid approach. In [
64], it has been pointed out that distrusted energy sources such as hybrid RES plants have a very low share of acceptance in the market. Despite the small liquidity of the ancillary services market, the participation of the asset in these services could be profitable. Indeed, as an inherent structure of the process, the mFRR prices tend to be less competitive than those in the day-ahead market and consequently generate more profit. To properly model the opportunity generated by participation in the mFRR, an acceptance criterion has been developed in [
65]. The procedure, based on historical results on mFRR, develops around two important pieces of information. Firstly, among all the bids that were submitted, only 13% were accepted. Secondly, a correlation between bid acceptance and the submission price is present. In light of these statements, the tool was programmed to create a binary input vector that expresses the acceptance of the bids in the mFRR. The acceptance array changes depending on the average price that the user foresees being submitted in the market. Lastly, the accepted bids are remunerated at a value that is equal to the constant price times a gain that is proportional to the hour at which the bid is accepted. This solution was implemented to grasp the hourly price fluctuations in the bids in the ancillary services market.
Algorithm 3 describes the logic behind the control of the system participating in the mFRR. In particular, the approach evaluates whether the mFRR bids are more profitable than those in the day-ahead market to ensure higher revenues.
| Algorithm 3: mFRR Algorithm |
Input:
Output: ,
DISCHARGE PHASE
for I in 96 (quarter of hours in a day) do
if > 0
if
if
if
Else if
Else
|
3.4. Fast Frequency Reserve
Fast frequency reserve is a service enabled by the Italian authority with the resolution 200/2020/R/eel [
66]. It consists of the rapid provision of power from BESS to counteract the more usual frequency swings in the electric power system. The service is exclusive to BESS selected through a tender procedure. In detail, the pilot project launched in 2021 in Italy mandated the provision of a fast frequency reserve for 1000 specified hours for the storage systems entitled to participate in this market. In those periods, the assets must ensure the provision of the power submitted during the tender to the service and grant it in all the hours specified by the authority. The correct interaction of the BESS with the grid is remunerated with a capacity payment from the TSO that is proportional to the power made available to the service. Fast frequency reserve requirements limit both the power and energy of the storage system. Algorithm 4 describes the fast frequency reserve algorithm as a limitation of the available power and energy during the hour mandated by the authority for the service.
| Algorithm 4: Fast Frequency Reserve |
Input:
Output: ,
SOC Control
for i in 96 (quarter of hours in a day) do
If and
Else if
If
Else if
|
4. Study Cases
The sizing procedure was divided into two different study cases, labeled as stand-alone and RES-coupled. The purpose of this classification is to highlight the different benefits and shortcomings of the two configurations and the tool’s ability to operate in different configurations. The stand-alone case analyzes the performance of the sole BESS interacting with the grid. The second one foresees a hybrid RES power plant coupled with a BESS that is capable of exchanging energy with the grid and the RES. In each study case, four different sets of simulations were carried out with different combinations of the algorithms, as described in
Section 3. Each set of simulations aims to properly allocate different combinations of services to investigate the impact that a multi-use BESS has on its economics. The first simulation exclusively addresses the provision of energy arbitrage by the storage system. The second set couples the first service that was investigated with the capacity market through sequential stacking. In detail, the capacity algorithm has the dispatch priority due to the necessity of satisfying the energy provision mandated by the service regulations. The third simulation package couples the mFRR with the arbitrage and capacity algorithms. The ancillary service structure interacts with the arbitrage to identify the most profitable trading strategy for each day. It follows that the most remunerative dispatch is selected depending on the day-ahead market (DAM) prices and the acceptance in the mFRR. Lastly, the fast frequency reserve is evaluated in the fourth set of simulations stacked with the other services. The provision of this application is superimposed with the previous markets that were modeled. As a consequence, the fast reserve and a further service can be provided in parallel, and the latter is derated by the power and capacity required for the frequency regulation. The list of simulations described has allowed for an investigation of the impact that service stacking has on the revenues of the BESS. The tool iterates the power and EPR of the system and identifies the optimal size of different configurations using the CAPEX being covered and IRR.
Figure 2 summarizes the sets selected for each study case. Furthermore, the figure specifies the stacking classification of the investigated service. The number of services included in the stacking configuration is incremental. The first one investigates sole arbitrage. Configuration 2 adds the capacity market to the arbitrage. The third one involves the mFRR in the previous services. Finally, configuration 4 investigates the stacking of all the services.
It is worth stating that the parameters reported in
Figure 2 are completely customizable through the GUI to cover different setups. The tool evaluates the economic performance of the BESS, allowing for the charge from the grid or the power plants.
Moreover, a POD limit was established to limit the power injection into the grid.
Table 4 details the parameters adopted for the study cases. The capacity payment duration complies with the current Italian framework [
67]. Furthermore, the fast reserve being implemented reflects the actual one in place in Italy [
68]. Both capacity payments refer to the outcomes of the auction for the Sardinia market zone. To correctly compare the latter service with BESS of various sizes, the power enslaved to the fast reserve is defined as a percentage of the nominal power of the system.
The input vectors describe a twenty-year time series with a time sample of 15 min. The main input vectors are reported in
Figure 3. The wind and PV profiles were generated by the open-access software AtlanteEolico-RSE [
69] and PVGIS, respectively, for Southern Italy. The lack of seasonality of the wind was modeled by randomly sampling the weeks of the three years wind profile used as input. The PV power profile was reduced every year by a degradation equal to 1%/year. The historical temperatures were downloaded from the ARPA website for Southern Italy and linearly increased up to 2 °C to account for global warming [
70]. Lastly, the day-ahead market prices of the year 2019 were exploited for the study case [
71]. The profile was chosen because it represents the last year of business as usual before the pandemic and the gas shortages. Furthermore, due to the high prices recorded in 2021 and 2022, the 2019 price profile can be adopted as a conservative solution for the investment cash flow. A one-year simulation exclusively involving the arbitrage with the 2019-2020-2021 prices profile was developed, resulting in different realized revenues, as depicted in
Table 5.
The scope of this brief estimation has been the identification of the price profile that grants a lower economic return for the investment and can be used as input for the main analysis. The considered trend was extended to the period under evaluation and coupled with two different yearly gains. The scope of the gains is to create two distinct price scenarios to cope with the possible evolution of the prices in the future and provide a wider economic analysis of the investment. The yearly gains, defined as low- and high-price scenarios, were extrapolated from the results reported in [
72]. The profits per cycle were kept low to understand the main differences that arise in the BESS cycling due to this parameter.
5. Results
This section presents the results obtained from the different algorithms implemented in the sizing tool. The results focus strictly on the economic indexes that are fundamental for evaluating the profitability of an investment. For the sake of completeness, both the covered CAPEX and IRR are reported. Furthermore, technical pieces of information are provided through the full equivalent cycle (FEC) and the capacity fades of the storage system under analysis.
Firstly, it is worth stating that the tool takes from 4.3 to 12.1 min (Intel i7 1260 CPU—16 GB) to simulate 20 years of service of a sole BESS with the lightest and heaviest algorithm; such a limited computational effort validates the approach’s viability in tecno-economical studies. In the specified period, the procedure evaluates the power flow, degradation, and revenues of the BESS to provide valuable information on the investment.
The first reported outcomes concern the identification of a price profile that can act as a conservative solution.
Table 5 details the revenues generated in one year by a 20 MW/60 MWh BESS, which performs energy arbitrage with three different price scenarios: the day-ahead market prices of 2019, 2021, and 2022.
It is possible to note that the larger volatility of the prices during the gas shortages returns better economics for the storage system. In particular, almost 10% of the 21.3 M€ of BESS CAPEX is covered in a single year in the most profitable price scenario. Nevertheless, these profits were generated by the abnormal market conditions of 2022 that, thanks to the more widespread adoption of RES, will not recur in the coming years. It follows that DAM prices for 2019 were exploited as a base to develop high and low price scenarios for the next 20 years.
The algorithms have different impacts on the economics of the system. The aim of the following paragraphs is to detail the benefits of each approach and their limitations in both stand-alone and RES coupled configurations to understand the outcomes of the tool in more depth.
5.1. Study Case 1: Stand-Alone BESS
5.1.1. Stacking Configuration 1: Energy Arbitrage
The arbitrage algorithm investigated in stacking configuration 1 is by far the less remunerative scheme for a stand-alone system. Firstly, the profit is strictly related to the spot market outcomes and, generally, a certain degree of uncertainty characterizes these variables. Furthermore, the operation of the BESS is connected to the market price spread. The high-price scenario has a larger spread than the low-price profile; consequently, it represents the most remunerative profile. The IRR difference between the same BESS with the two price trends corresponds to 4.5% on average. This value corresponds to a difference in revenues between the two scenario prices equal to 12.0% of the CAPEX for the whole investment lifespan. Furthermore, it is important to correctly estimate the profits per cycle to seize the correct trade-off between the operation of the system and the covered CAPEX. A reduction in the capital cost will directly impact the cycling cost of the system and increase the possibility of profits for arbitrage. The degradation is strictly related to these parameters, since a larger cycling will correspond to a higher cycle aging. The final capacity after 20 years for the arbitrage service is, on average, equal to 81.3%, considering a periodic capacity augmentation. Revenues are linearly impacted by the degradation. The phenomenon leads to a reduction in the profit at the end of the investment equal to 12.2%. A possible solution to increase the revenues from the arbitrage algorithm consists of increasing the cycling limits of the BESS set to one cycle per day. This condition may seem quite conservative for a system with a small EPR. Indeed, it is possible to increase profits if the market price spread allows for multiple cycles. However, profits larger than the profits per cycle must be always granted to perform the arbitrage. This condition is difficult to ensure with a higher number of cycles because the spread between the charge and discharge must be higher than the cycling cost. Furthermore, for a large EPR (>5 h), the benefits of multiple cycles are null due to the inherent structure of the market outcomes, which, in general, has two peaks lasting 2–3 h each [
73]. It follows that BESS with durations over 5 h are less-suited to the daily energy arbitrage. As a consequence, the best configuration for the sole arbitrage is a 3 h BESS that correctly grasps the variation in the day-ahead market. Lastly, the revenues for BESS with the same EPR are linear with power because the efficiency of the service is exclusively related to the duration of the storage system. Therefore, BESS with the same duration, which mostly provide the arbitrage at the nominal power, have a similar IRR.
5.1.2. Stacking Configuration 2: Energy Arbitrage + Capacity Market
The capacity market represents an important source of income for the storage system as evaluated in configuration 2. The fixed revenues ensured by the provision of the services increase the economic return of the asset. However, in the best scenario, the profits cover only 55.8% of the CAPEX. Nevertheless, a stand-alone system must participate in this service to cover the missing money due to the excessive capital cost. Moreover, the service does not increase the degradation compared to the sole arbitrage strategy: indeed, in Italy, capacity remuneration is due if the obligation of bidding the remunerated capacity on the market is respected, as BESS would do in the case of energy arbitrage. However, capacity fade is slightly lower since the algorithms limit the BESS cycling to ensure the provision of the energy required by the regulation. Furthermore, due to the structure of the Italian capacity market, a longer duration of BESS benefits more from the capacity market. Indeed, as reported in
Table 2 a lower derating factor is mandated by the authority of storage systems with a longer duration. This condition coupled with the economy of scale granted by a larger system EPR, which identifies BESS with a 5 h duration as the best candidate for the provision of arbitrage and capacity services.
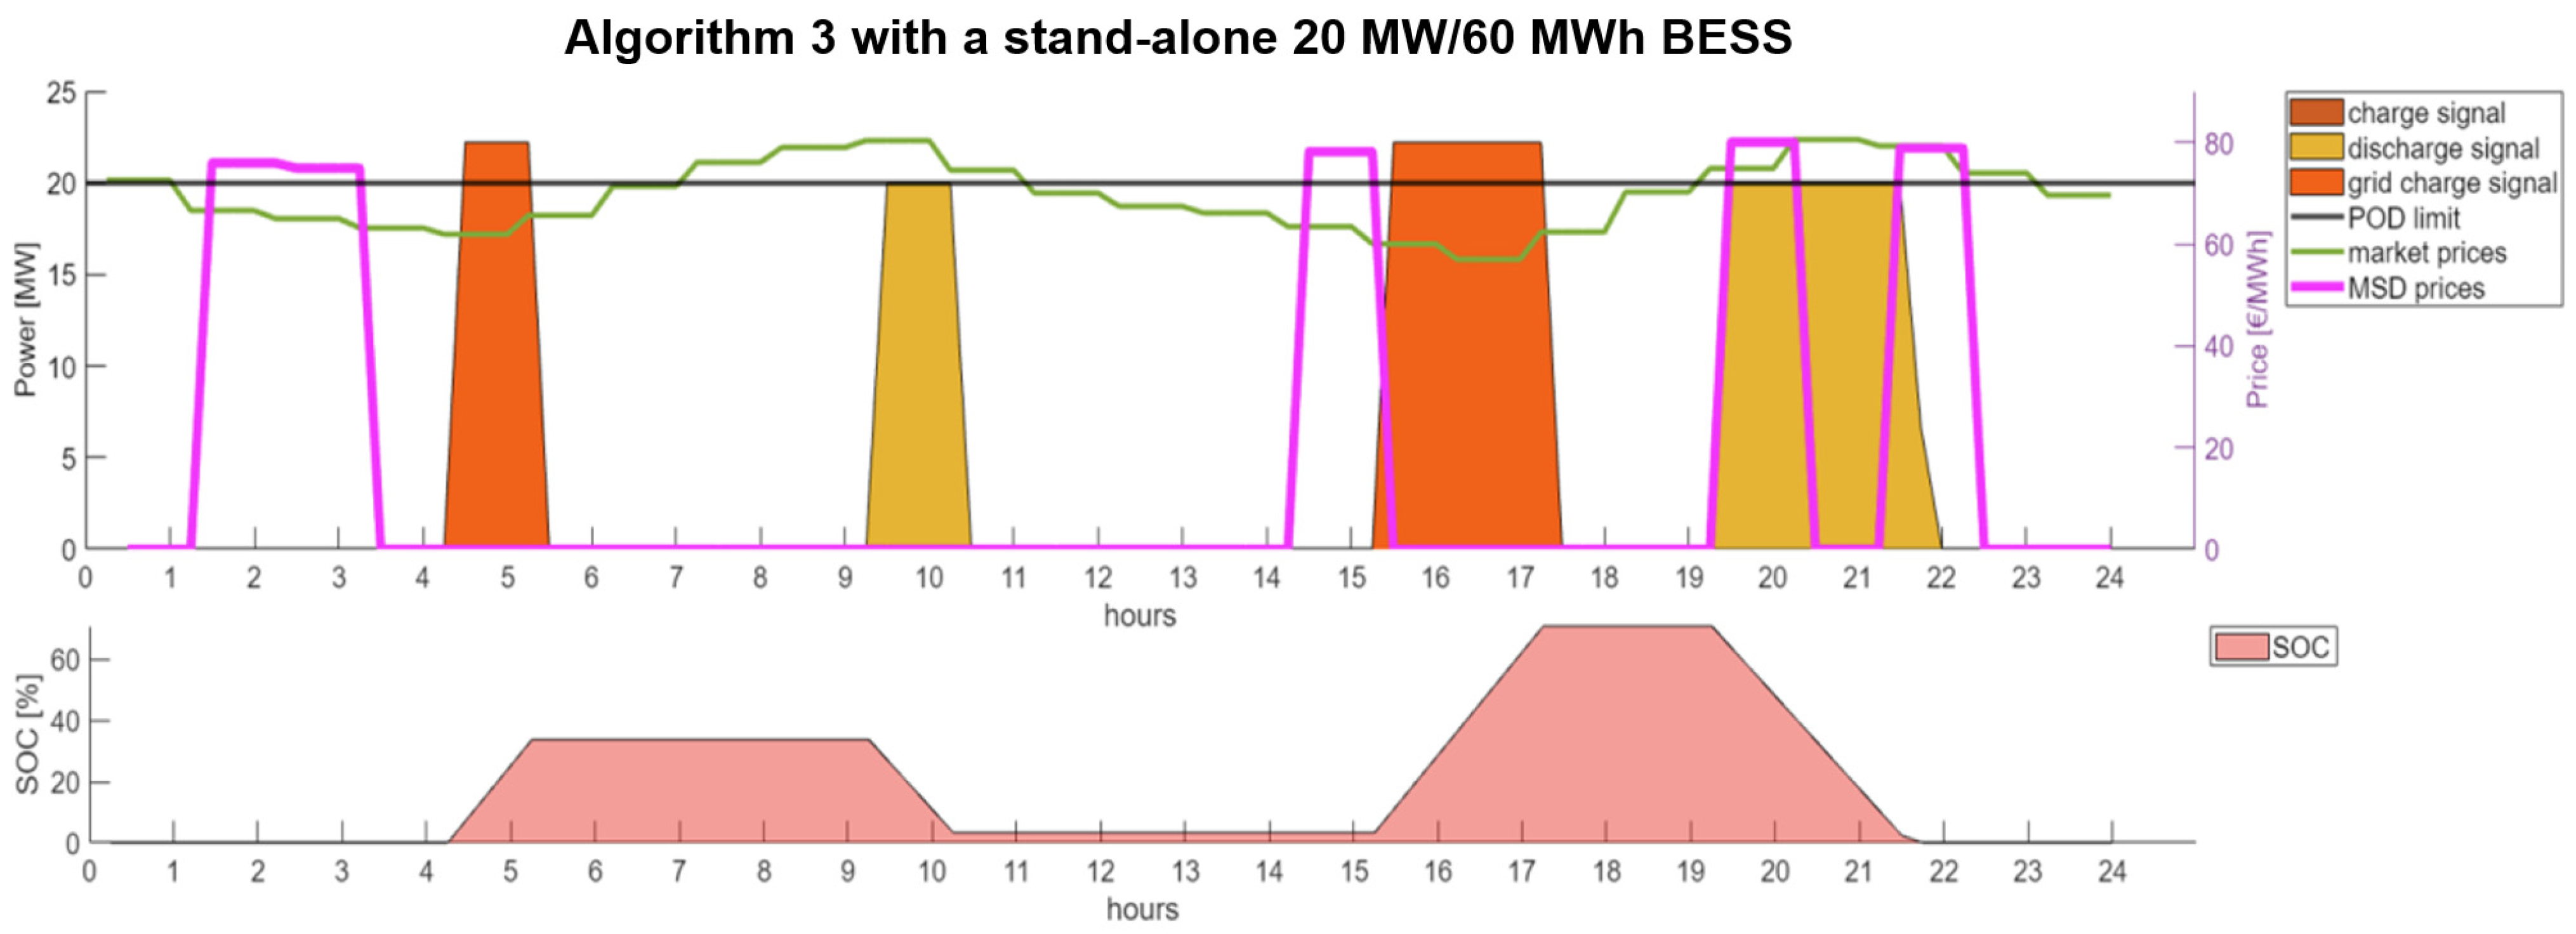
5.1.3. Stacking Configuration 3: Energy Arbitrage + Capacity Market + mFRR
The addition of the mFRR to the services provided in stacking configuration 3 grants slightly better revenues thanks to the higher profits generated by the bids in the ancillary services market. On average, the increase in profits attests to around 1–2% of the CAPEX for the whole investment lifespan. In this case, the limits are mainly driven by the low award rate of assets on the Italian ancillary services market. However, with the increased penetration of RES, the liquidity of these assets inside the ancillary services market could increase. Therefore, future updates based on new market analysis may lead to an important increase in the cash flows. In the upper part of
Figure 4, it is possible to observe how the BESS is dispatched by Algorithm 3, which selects the most profitable solution between mFRR and DAM. Furthermore, an SOC control, as depicted in the bottom part of the image, ensures that the BESS can efficiently participate in multiple services.
5.1.4. Stacking Configuration 4: Energy Arbitrage + Capacity Market + mFRR + FR
Lastly, the fast frequency reserve algorithm has been coupled with the other three in the stacking configuration 4. It has been noted that the impact of these initiatives on the economics of the system is inversely proportional to the nominal energy of the asset. Indeed, the regulation foresees a capacity payment based on the percentage of the nominal power enslaved to the service. However, the CAPEX of the asset increases with the duration of the BESS. Therefore, the service leads to a higher improvement in the economics of systems with a low duration. The covered CAPEX, thanks to three years of fast reserve service, goes from 2.0% of the 6 h BESS to 3.5% of the 3 h system. It is worth stating that the revenues generated by the capacity market maintain the 5 h duration system as the best investment for the stand-alone configuration. Nevertheless, the hypothesis adopted for the fast reserve is conservative. Indeed, after the three years mandated by the authority, no further service is foreseen for fast reserve provision inside the tool. However, the fast reserve provided by BESS may be standardized in the future and remunerated with regulations that are not yet specified.
Table 6 lists the best results for the stand-alone study case for each stacking configuration. It is possible to observe that, despite being negative in all stacking configurations under our assumptions, the best IRR is granted by configuration 4, which is the solution that couples the higher number of services. Nevertheless, it is worth noting that the adopted price scenarios are conservative and return the minimum profit that BESS can generate. Furthermore, better economics are not strictly related to the asset cycling if capacity payments are granted to the storage system. Indeed, the same number of cycles allows for the revenues of the storage system to be tripled thanks to its participation in the capacity market and fast reserve provision. The general outcome of the stand-alone configuration is that, for a one-cycle-per-day system, the 20-year investment is not remunerative, no matter the adopted revenue stacking strategy: this unprofitable result is mainly due to the conservative assumption of using the 2019 DAM price scenario. However, the coupling of various services boosts the CAPEX covered by the profits from 49% to 60%. Therefore, the asset operator must carefully evaluate which services the system can provide to increase profit and ensure capacity payment. This is fundamental, especially for those services where participation is granted through an auction mechanism. Indeed, thanks to the capacity payment, the best investment is represented by 10 MW/50 MWh BESS. In general, systems with a duration of 5 h have better economics because they represent the optimal trade-off between capacity payment and CAPEX.
5.2. Study Case 2: RES-Coupled BESS
5.2.1. Stacking Configuration 1: Energy Arbitrage
The second study case exploits the presence of RES to increase profits. Indeed, the energy curtailment mandated by the POD limit is equivalent to free energy that will be lost without the storage system. This parameter, together with the PV and wind size, show a large sensitivity regarding the free charging energy for the BESS and the energy lost by the power plant. Although the overproduction of RES provides advantages to the BESS, it is fundamental to highlight that the configurations with the lowest peak power production barely improve the economics of the BESS. In the worst case, namely, a covered CAPEX of 50 MW/300 MWh BESS this increases by only 3% following the addition of 20 MWp of both PV and wind compared to the stand-alone case. A further observation related to the coupling of the asset to the RES is the higher number of cycles. The availability of cheap energy for charging the system due to the presence of RES increases the use of the BESS and its degradation, which reaches over 30% for the system with a smaller duration. However, increased use of the storage system corresponds to better economics; as augmentation of the asset is usually included in the OPEX, it is always better to cycle the system and boost the profits.
The presence of a power plant allows for the BESS to be charged for free and save energy that, without the storage system, will be curtailed. This condition leads to benefits proportional to the energy being stored. In the best scenarios, namely high prices and high-power plant peak power, the investment of a BESS generates value with the sole arbitrage. The revenues from the sole arbitrage are almost doubled in the best-case scenario. The most cost-effective BESS size with the provision of the sole arbitrage is 10 MW/30 MWh. This system represents an optimal trade-off between the CAPEX and the ability to collect the byproducts caused by RES plant overproduction. Higher powers reduce the curtailment but not linearly. Therefore, the expenditure increase is higher than the revenue generated for the increment in energy savings. Instead, the EPR increases only the expenditures without further energy savings, leading to a higher cost and similar profit.
5.2.2. Stacking Configuration 2: Energy Arbitrage + Capacity Market
Stacking configuration 2, which couples the capacity market with the arbitrage, improves the economic results. Following Equation (5), coupling with RES led to a higher-capacity payment compared to the stand-alone case. This condition drastically improves the economics of the system. However, this increase in capacity may lead to a mandatory power provision value that is larger than the nominal power of the BESS. Therefore, if the unpredictable production of RES goes to zero, in some cases, the BESS does not have the necessary characteristics to fulfill the constraints of the capacity market. It follows that, for a small BESS and large RES-size capacity, payment is not received due to the power limits of the storage system. However, larger BESS benefit from this condition, with an improvement of up to 30% in the CAPEX covered compared to the sole arbitrage provision. This aspect is fundamental to justify the presence of a storage system in a hybrid energy district. Indeed, for small-scale BESS, the capacity payment is not granted and the same will occur if no BESS is present in the energy district. Therefore, for an RES owner that is willing to participate in the capacity market, it is mandatory to purchase a BESS to fulfill the requirements of the Italian authorities. Lastly, as in the previous study, participation in this new service has a very low impact on cycling and degradation.
Figure 5 depicts the covered CAPEX for the RES-coupled study case with Algorithm 2. The heatmap produced by the GUI can identify the most cost-effective BESS for the scenario under analysis, namely the 20 MW/60 MWh system.
5.2.3. Stacking Configuration 3 and 4: Energy Arbitrage + Capacity Market + mFRR + FR
Lastly, mFRR and fast reserve provision has a similar influence on the RES-coupled study case to the stand-alone. Indeed, the two services are strictly related to the operation of the BESS rather than the presence of RES power plants.
The best results for the RES-coupled study case are listed in
Table 7. The outcomes of the second study case are more impacted by service stacking than the first analysis. Indeed, the capacity prize is larger due to the necessity of coupling RES with a BESS to provide a constant power setpoint. The service stacking improves the covered CAPEX by up to 30% compared to the sole arbitrage provision. Furthermore, as stated in [
74], BESS have an important economic advantage in supporting RES systems compared to the stand-alone case. The coupling with power sources reduces the expenditures on the energy sale on the day-ahead market and stabilizes the unpredictability of RES granting the capacity payment.
6. Conclusions
This article proposes a model-aware analysis to resolve the BESS sizing issue considering different applications that implement service stacking. The economic analysis evaluated the investment throughout a 20-year scenario, exploiting a high-fidelity empirical BESS model equipped with equations that are able to describe both (i) the performance of BESS in different operating and ambient conditions and (ii) the capacity degradation of the asset. Novel algorithms were developed to properly emulate the BESS control strategy participating in the capacity and energy markets. Flexibility and reduced computational effort make the tool valid for the rapid assessment of different system configurations (e.g., stand-alone or RES-integrated), the sizing (e.g., the varying power and duration of the BESS), and the services (i.e., a control strategy block can implement complex algorithms to emulate service provision under different regulatory frameworks).
In this work, two systems were simulated, featuring a stand-alone and RES-coupled BESS, which served as case studies. The provided services are implemented to fit Italian regulation and market conditions. The outcomes highlighted the wide difference between the stand-alone and RES-coupled BESS’ return of the investment. A stand-alone system that is cycled once per day could not cover more than 60% of the CAPEX in 20 years. Although the inclusion of capacity payments led to an improvement in terms of economics, the current Italian regulations do not provide sufficient revenue to return on the investment, as per the assumptions made in the study. However, in the future, reductions in the system inertia will require more BESS use for frequency regulation. As a consequence, a new market or an extension of the existing mechanisms (e.g., fast reserve, limited to 1000 h per year as of 2023) could enter the pitch and provide new remuneration schemes for BESS. Conversely, the configuration presenting a BESS coupled with RES shows a positive IRR thanks to the optimal synergy between the storage and the intermittent power production. A comparison between the two study cases highlighted the advantage that BESS has in supporting the RES system.
This can be used to obtain the best result from the energy sale on the day-ahead market and allows for a better integration of the RES + BESS system in the grid. This is testified by the decreased connection power required for the hybrid RES + BESS plant and the exploitation of a larger capacity payment.
Optimal sizing is fundamental to obtaining a positive economic outcome, as highlighted by the results. Moreover, the system configuration play a key role in the economics of the asset. Indeed, the same services and the same power rating with RES can provide a 2.3 times higher return on the investment compared to the stand-alone case.
Additionally, the outcomes highlighted the necessity of service stacking to fully cover the investment costs. In particular, it has been pointed out that the sole energy service (i.e., arbitrage) cannot cover the capital costs of the assets, increasing the interest for BESS participation in capacity remuneration mechanisms or long-term contracts to ensure flexibility. The most efficient service stacking led to an increase in the covered CAPEX that was equal to 11% in the stand-alone study case and an astonishing 45% in the hybrid configuration. This improvement was achieved without increasing the number of cycles performed by the BESS.
The limitations of the study include the fact that the iterative procedure is not an optimization; thus, the optimal solution can be hidden between two tested configurations. Given the possibility of increasing the granularity of the simulations thanks to the low computational effort required, this is not considered a major issue. Additionally, the study was performed using a BESS model from the literature, featuring a Li-NMC battery. It is well-known that, as of 2023, LFP chemistry has overcome Li-NMC, especially in utility-scale applications. The generalization of the procedure to include an LFP battery model is of great interest.
Future works could focus on improving the algorithms proposed in this article. These include the possibility of cycling the BESS more than once per day (to better test the trade-off between BESS life and NPV), the inclusion of an aging-aware algorithm to identify an efficient trade-off between profit and degradation, and the testing of innovative ancillary services that can fulfil the new needs of power systems. Furthermore, the possibility of easily evaluating different BESS technologies will drive the comparison and identification of efficient services for a specific cell chemistry.


 ,
, 


