

TERA of Gas Turbine Propulsion Systems for RORO Ships

 ,
, 
Abstract
:1. Introduction
- Armellini [11] studied the performance of GTs fuelled with marine gas oil instead of diesel engines fuelled by HFO as the propulsion system for large cruise ships equipped with abatement devices such as scrubbers and selective catalytic reactor systems. The results of his study demonstrated that GTs are less efficient, much lighter, more compact, and can more easily reach low NOx emissions than diesel engines.
- Barsi [12] studied the performance of GTs fuelled with LNG, analysed from an environmental point of view. The results of his study demonstrated that GT combustion technology, with steady-state and controlled flame temperature, grants a heavy reduction in NOx emission, easily matching nitrogen regulations for current marine engines.
- Kayadelen [13] studied the advantages of gas turbines and gas turbine systems in the marine industry. The results of his study demonstrated that the GT has advantages, especially in size, noise, vibration, and environmentally friendliness.
- Bonet [14] studied the performance of a liquified natural gas carrier powered by two marine gas turbines, several trip scenarios have been assessed for the liquefied natural gas carrier.
- Brynolf et al. [15] investigated the emissions impact of liquified natural gas (LNG), biomethanol, methanol, and liquified biogas. The results showed that the biofuels were a favourable solution for reducing emissions compared to HFO.
- Deniz and Zincir [16] examined HYD, LNG, ethanol, and methanol fuel based on many criteria. The results showed that HYD and LNG were the most suitable alternative fuels for the marine sector.
- A comprehensive evaluation of the environment using an international journey mission to examine the emissions of NOx and CO2 from a GT fuelled with NG and HYD instead of a four-stroke diesel engine fuelled with MDO as a propulsion system for a RORO ship.
- An economical assessment, conducted through the net present value and payback period to evaluate the capital cost, operating cost, and maintenance cost of a GT propulsion system fuelled by HYD and NG. A four-stroke diesel engine fuelled by MDO was also evaluated for comparison.
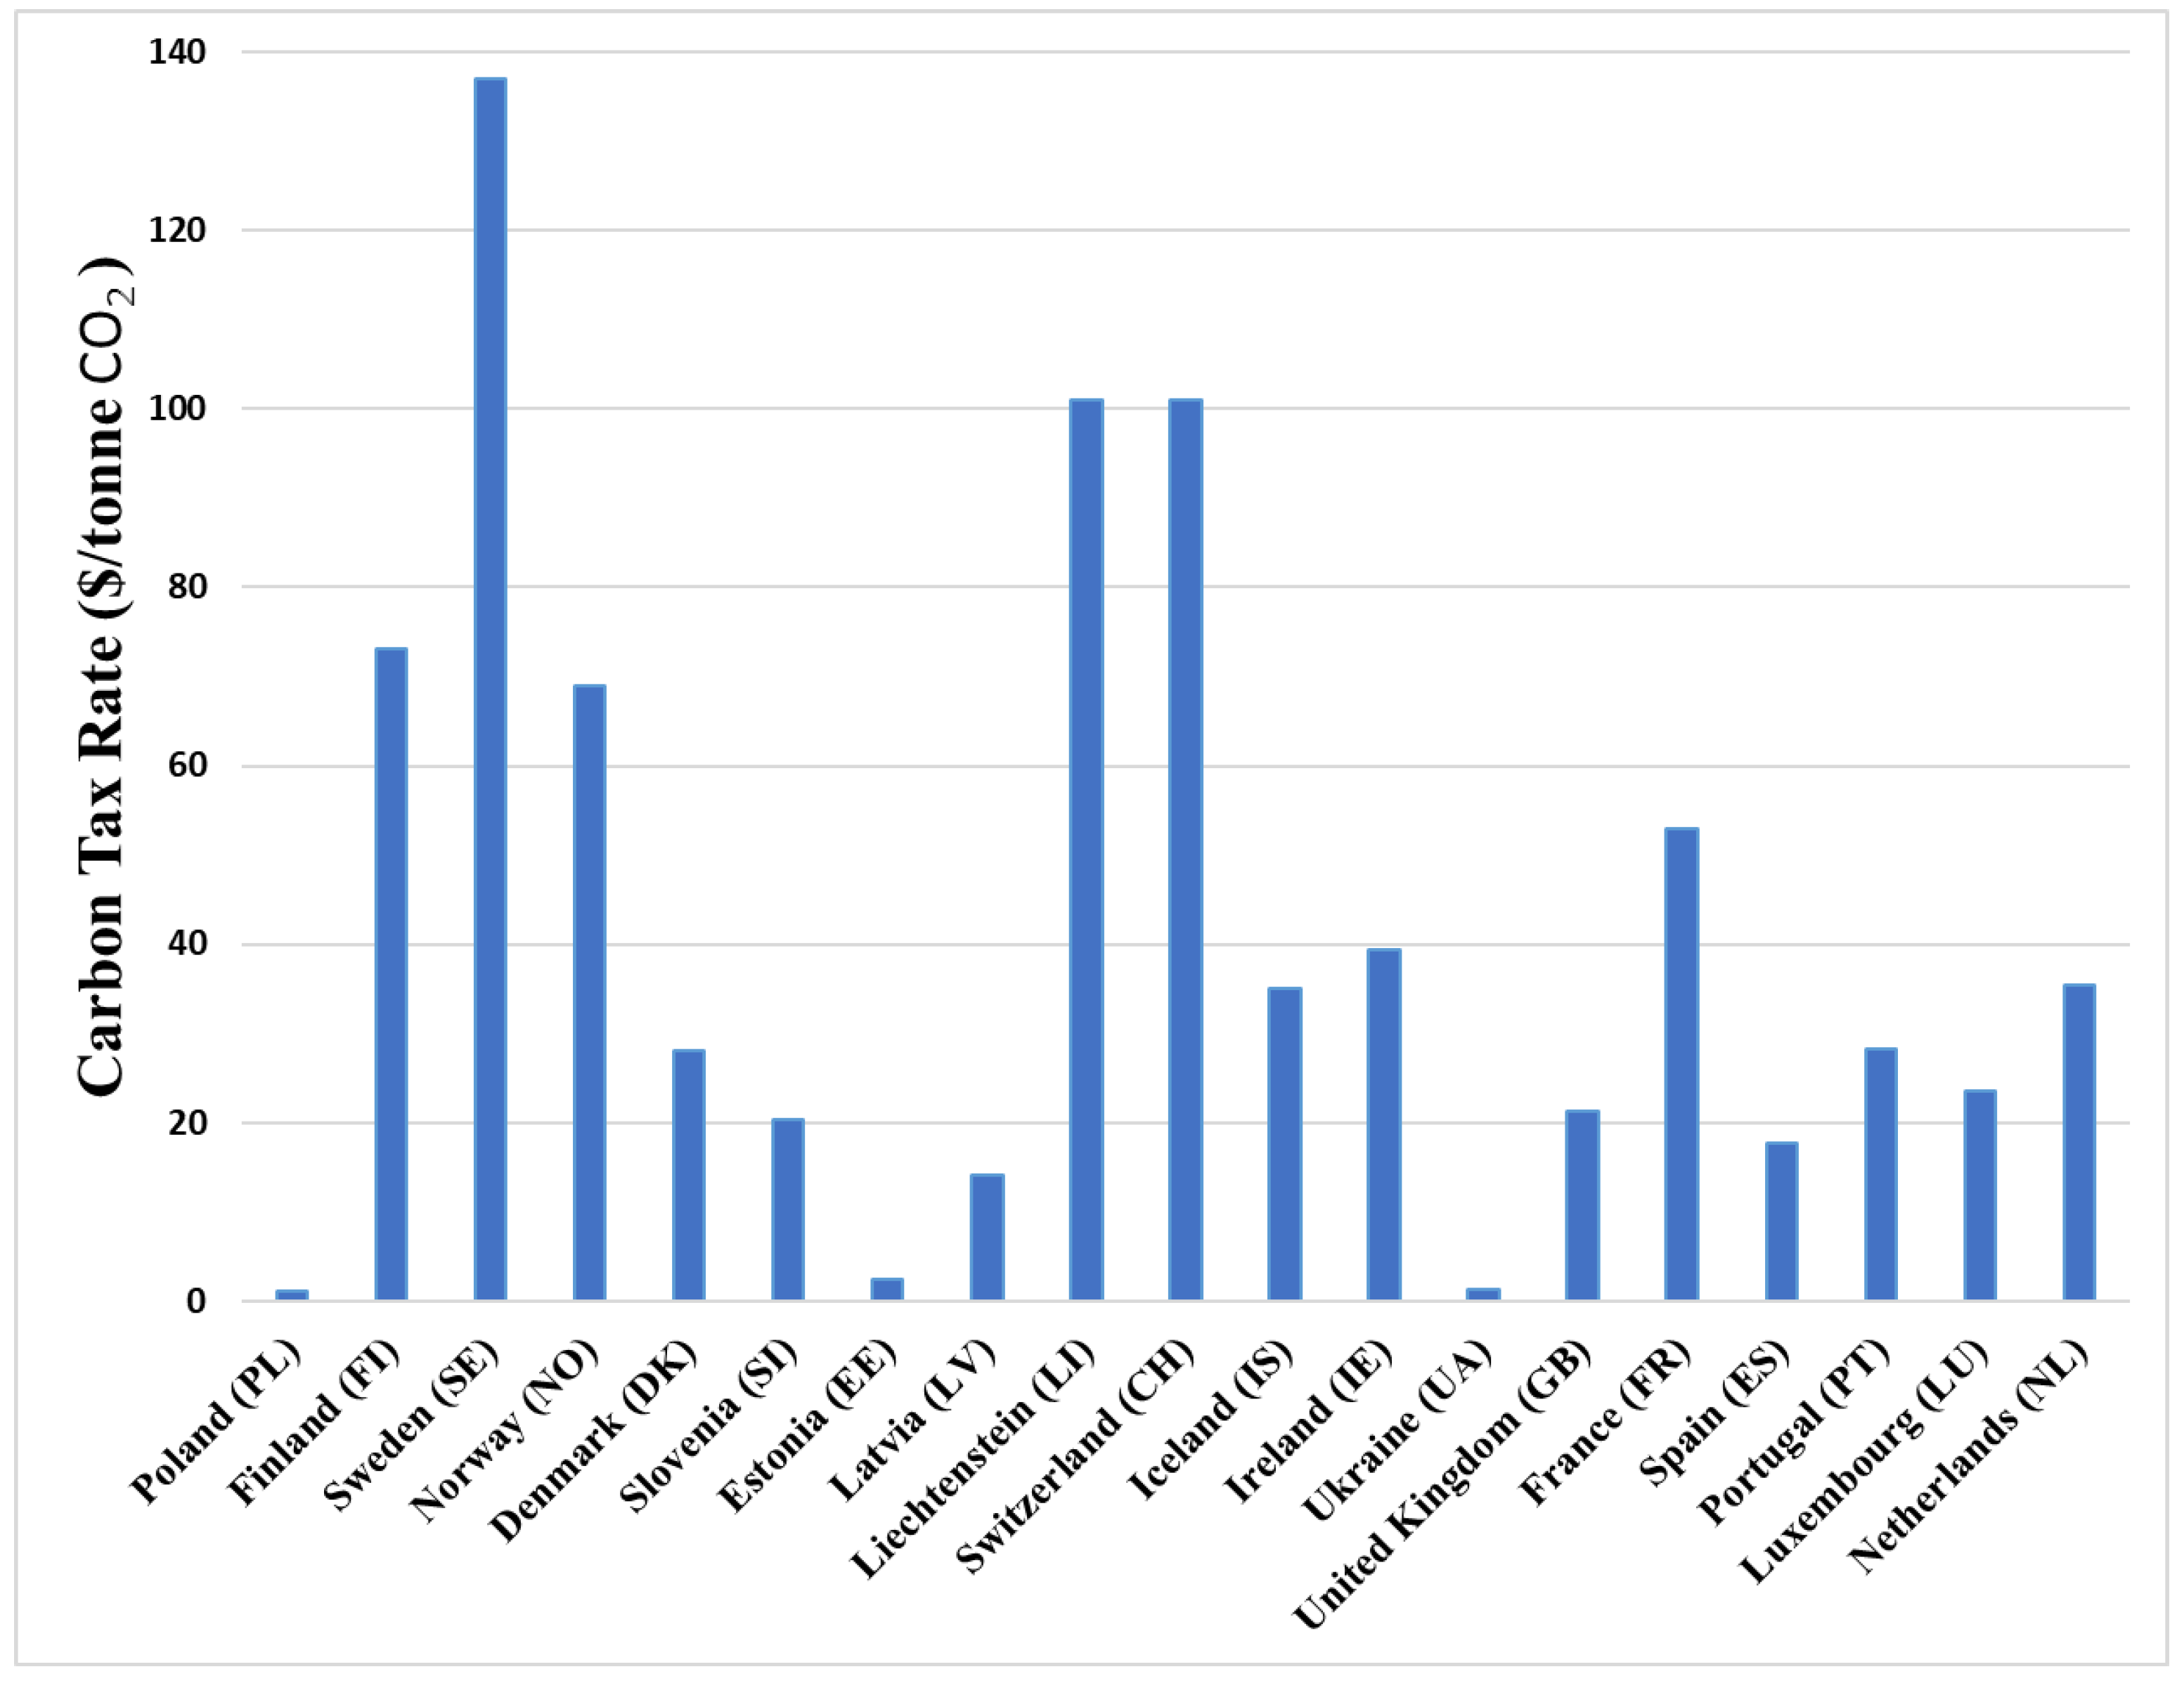
- A risk analysis to examine the impact of an emission tax on the economic analysis.
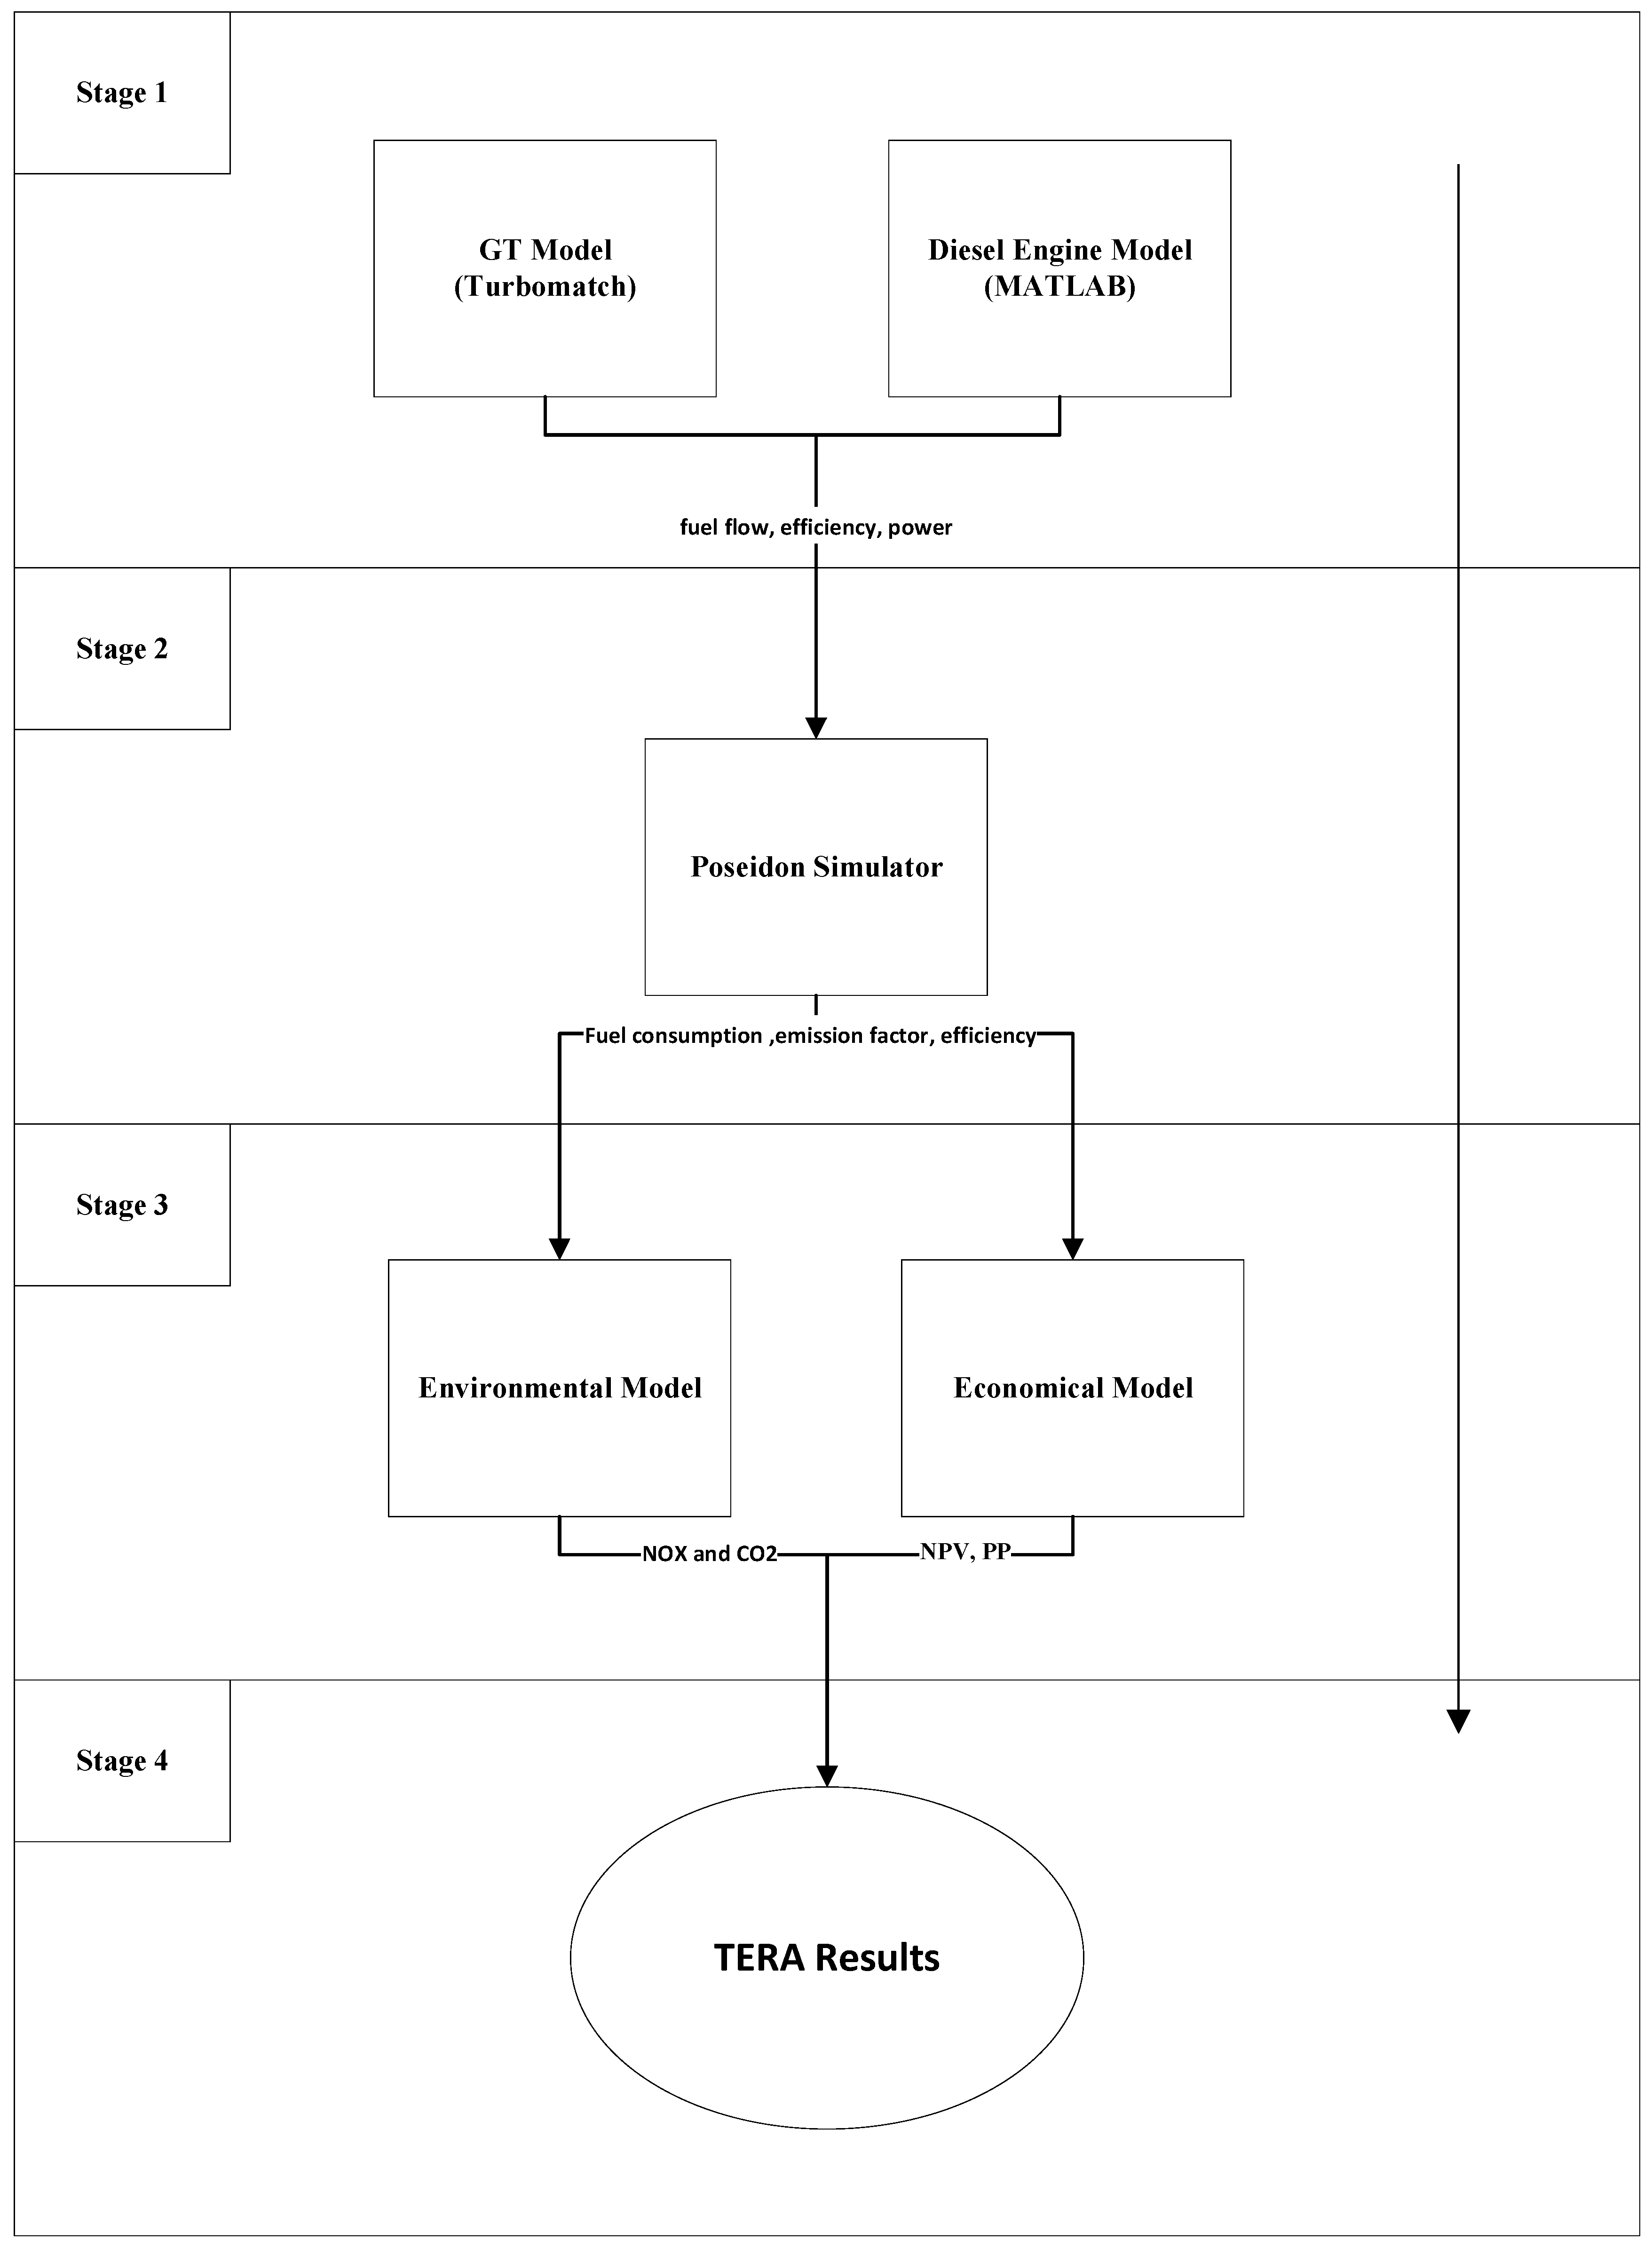
2. Methodology
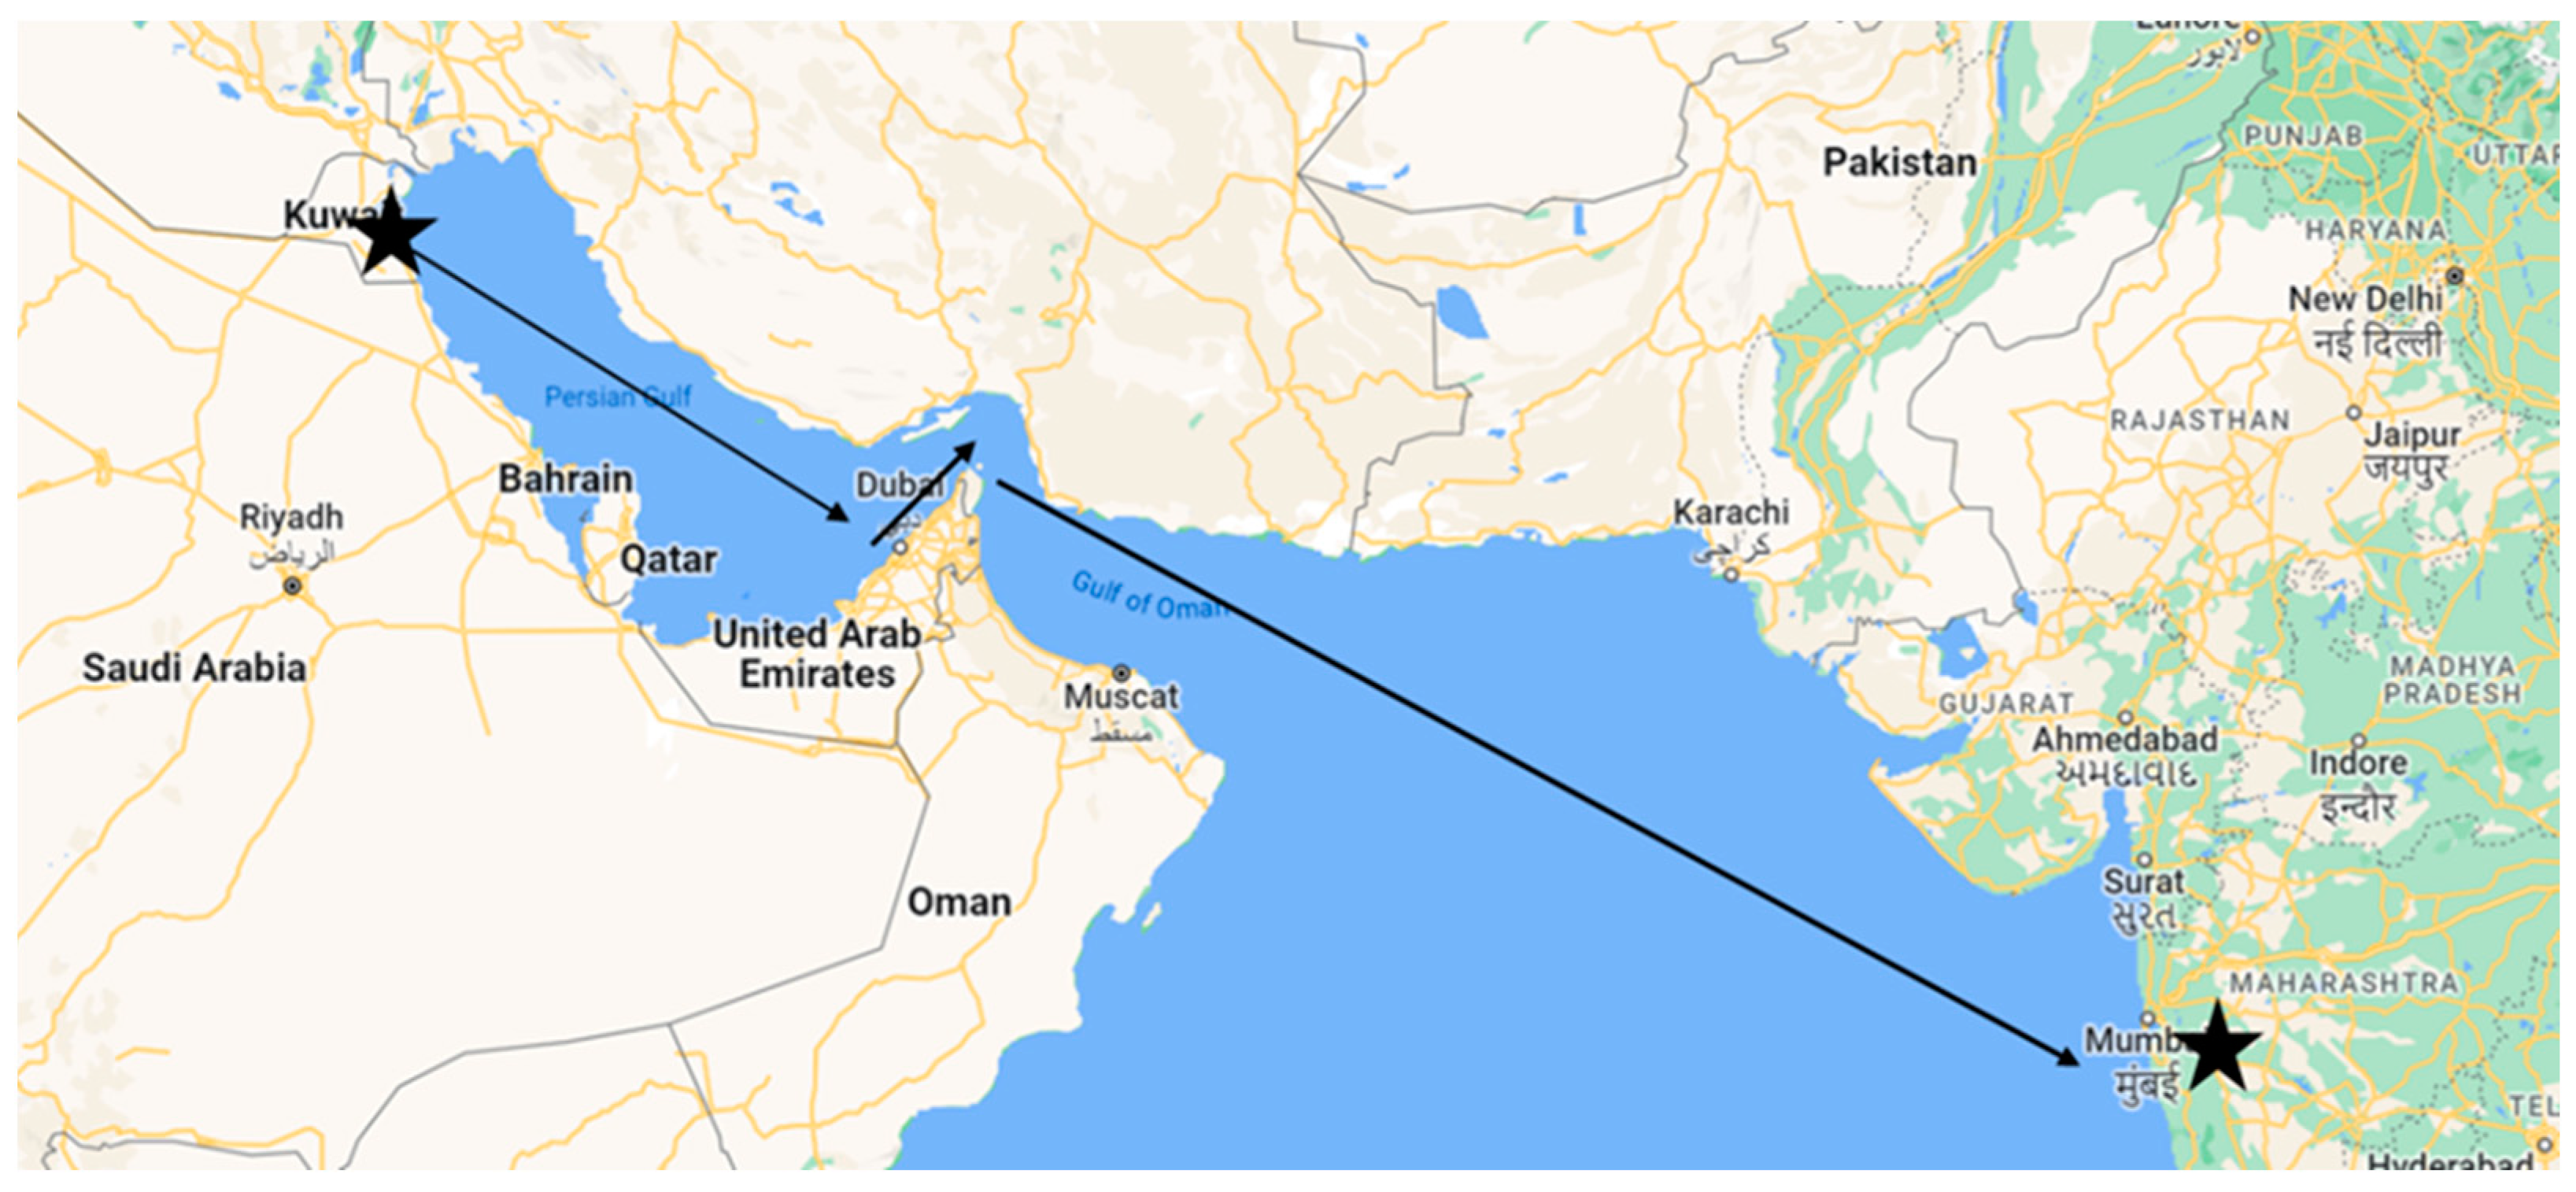
- The voyages of the ship were expected to follow straight and direct routes.
- The operational speed of the RORO steel ship was assumed to consistently be 14.5 knots.
2.1. GT Model
2.2. Diesel Engine Model
2.3. Poseidon Ship Simulator
2.4. Environmental Model
2.5. Economic Model
- The capital cost included the cost of installing the propulsion system.
- The maintenance and operating costs took into account the fuel cost of the journey.
- A risk assessment was conducted to examine the impact of implementing the emissions tax on the economic analysis.
3. Results
3.1. Assumptions
3.2. Route Analysis
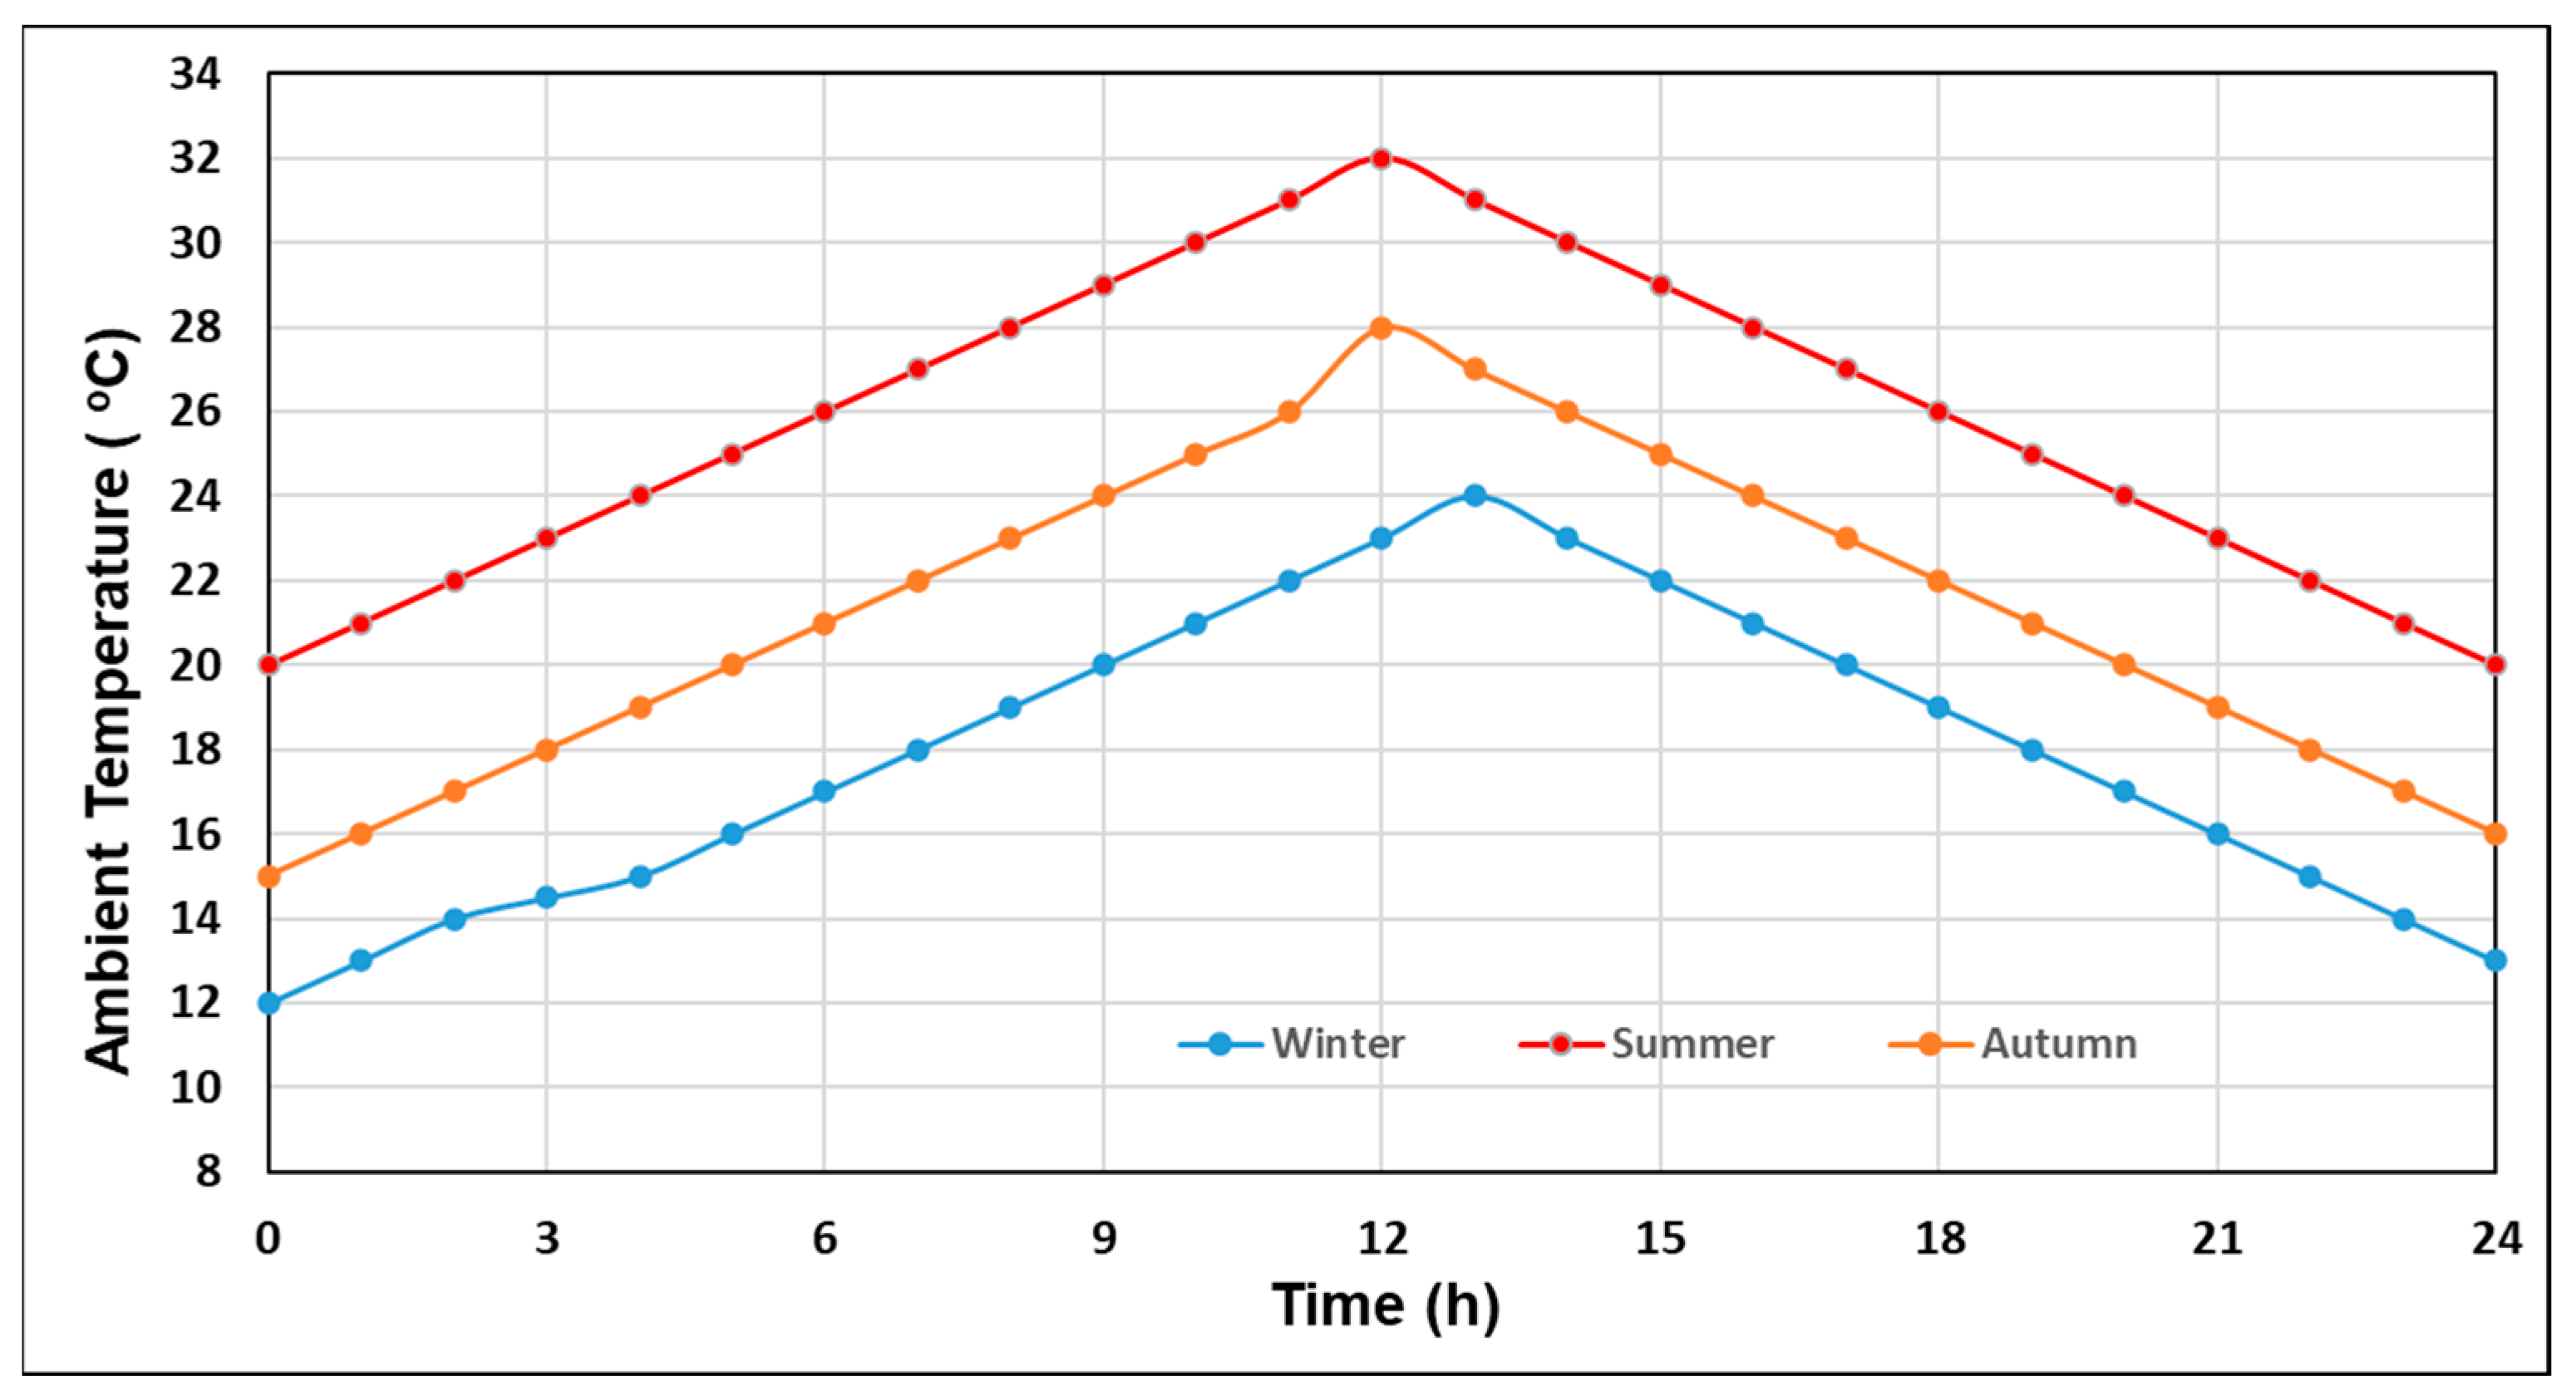
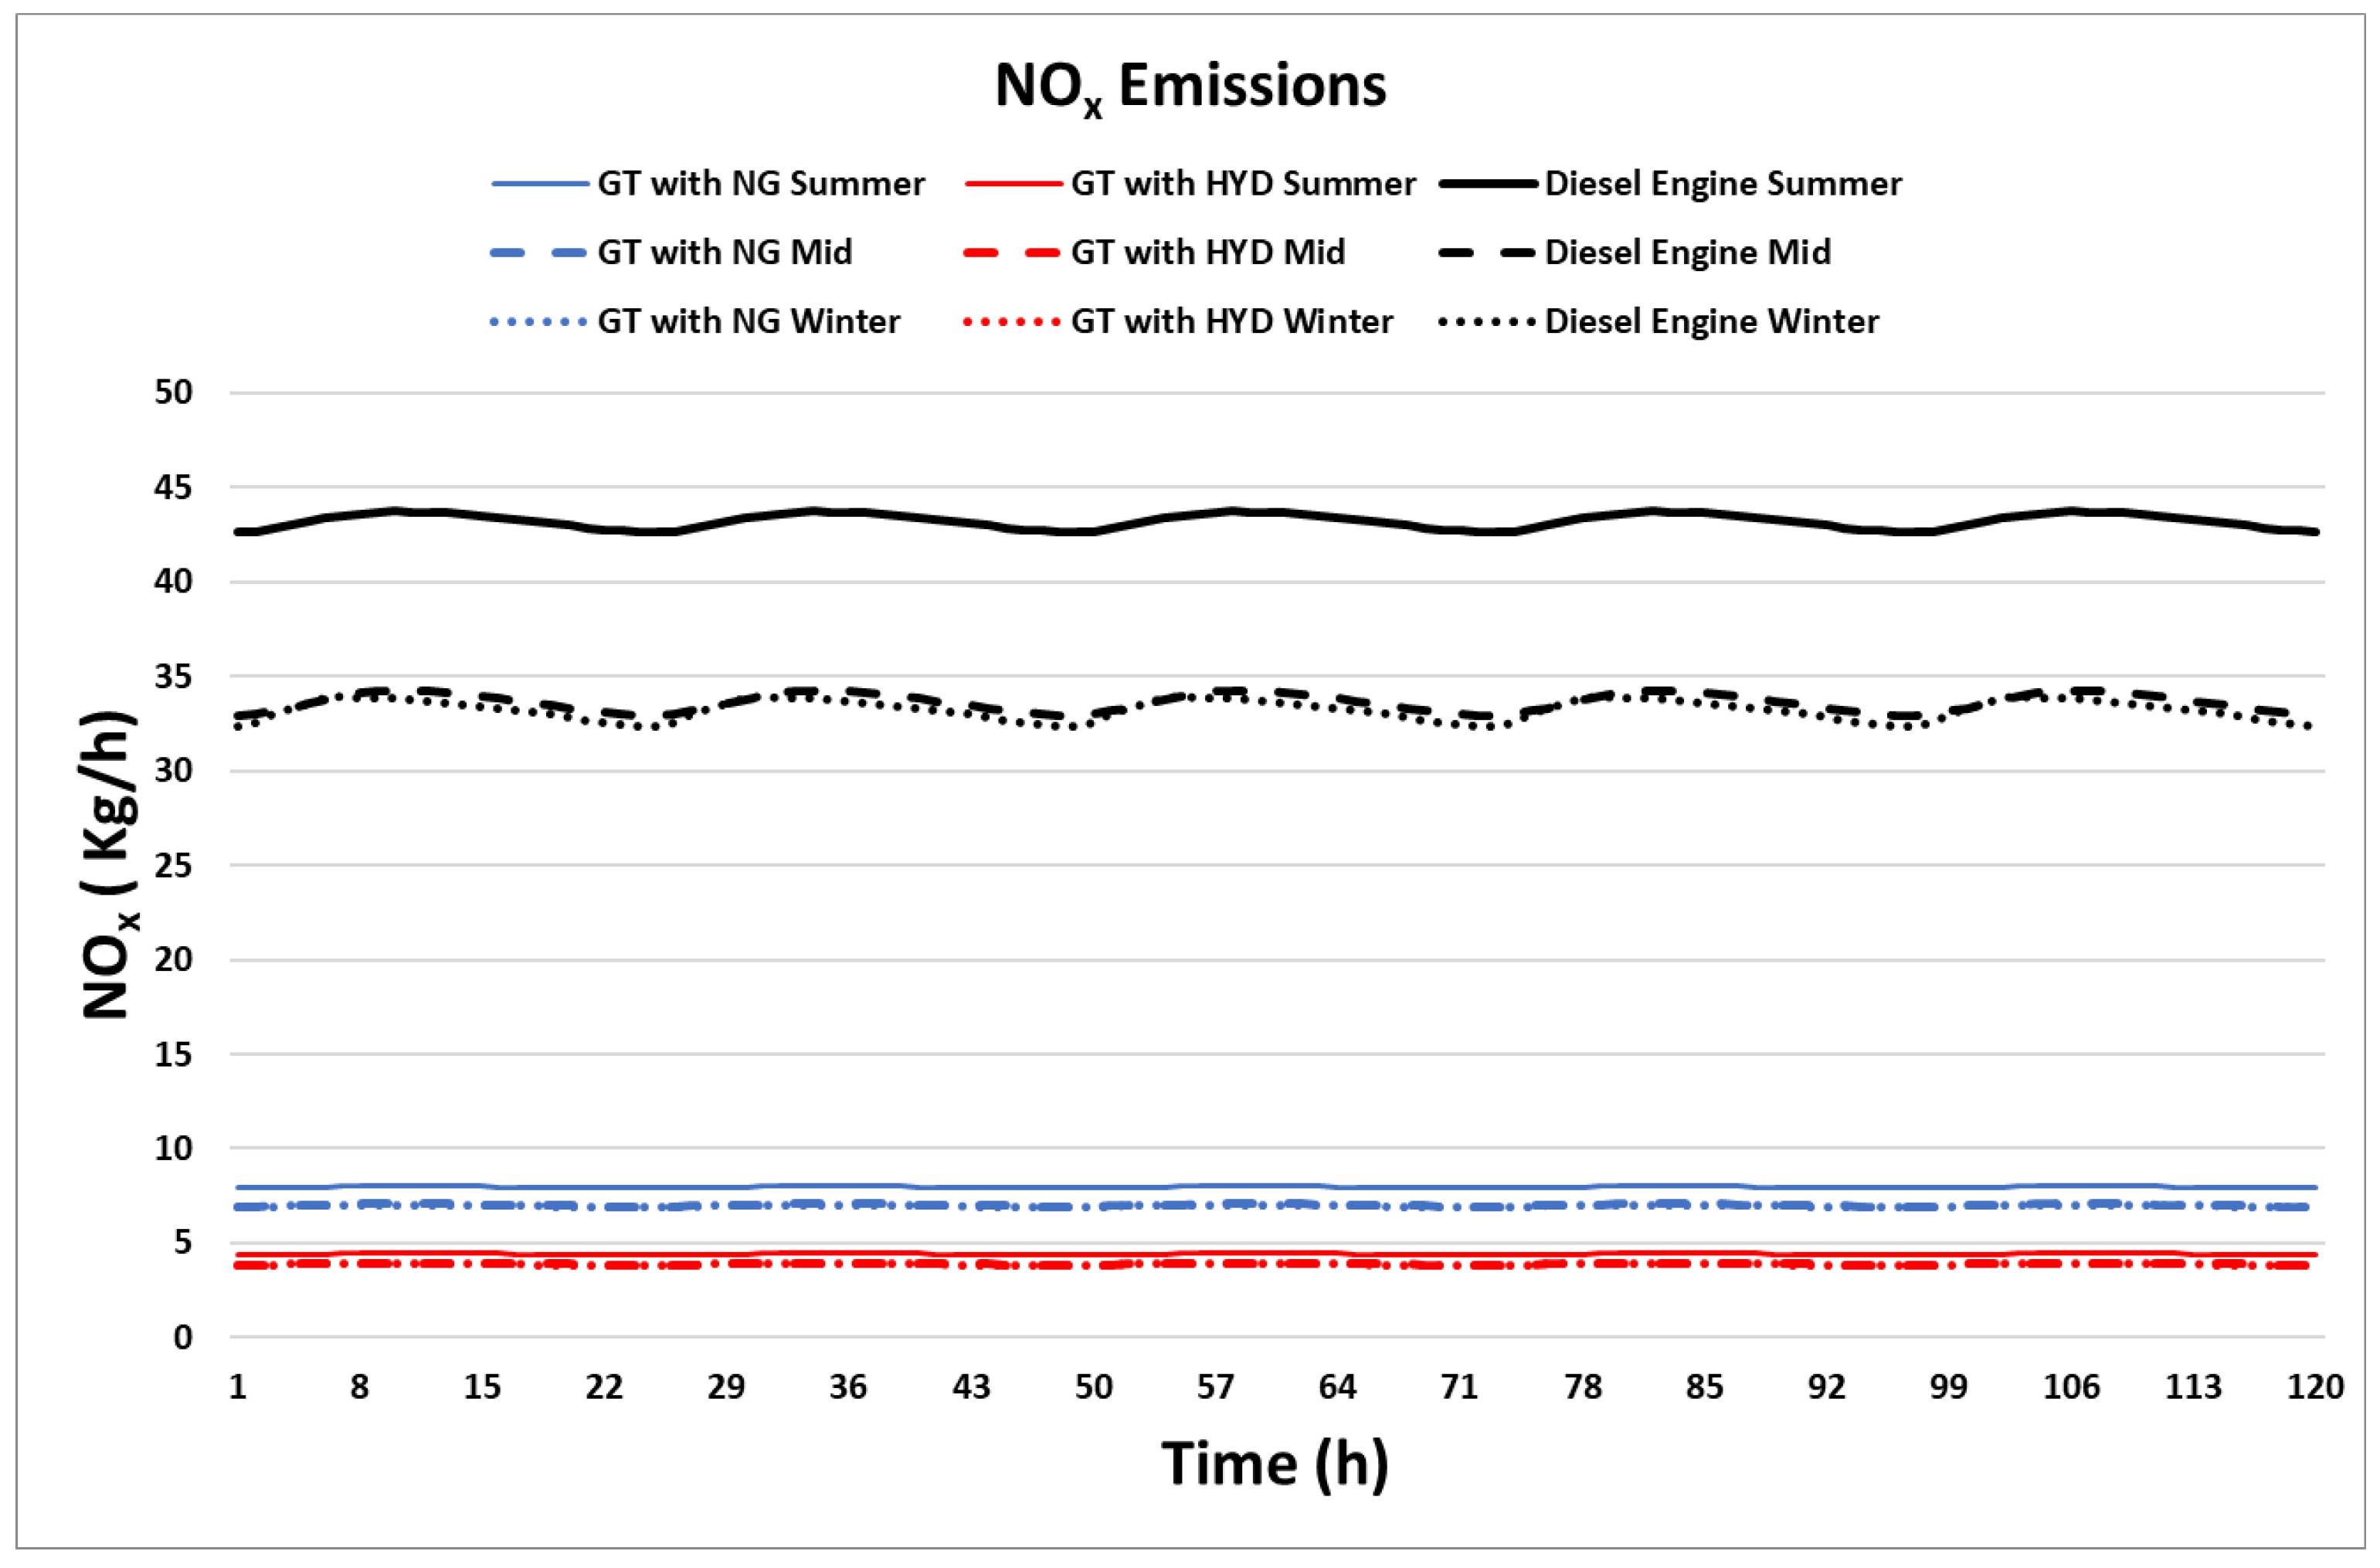
3.3. Environmental Results
3.4. Economic Analysis
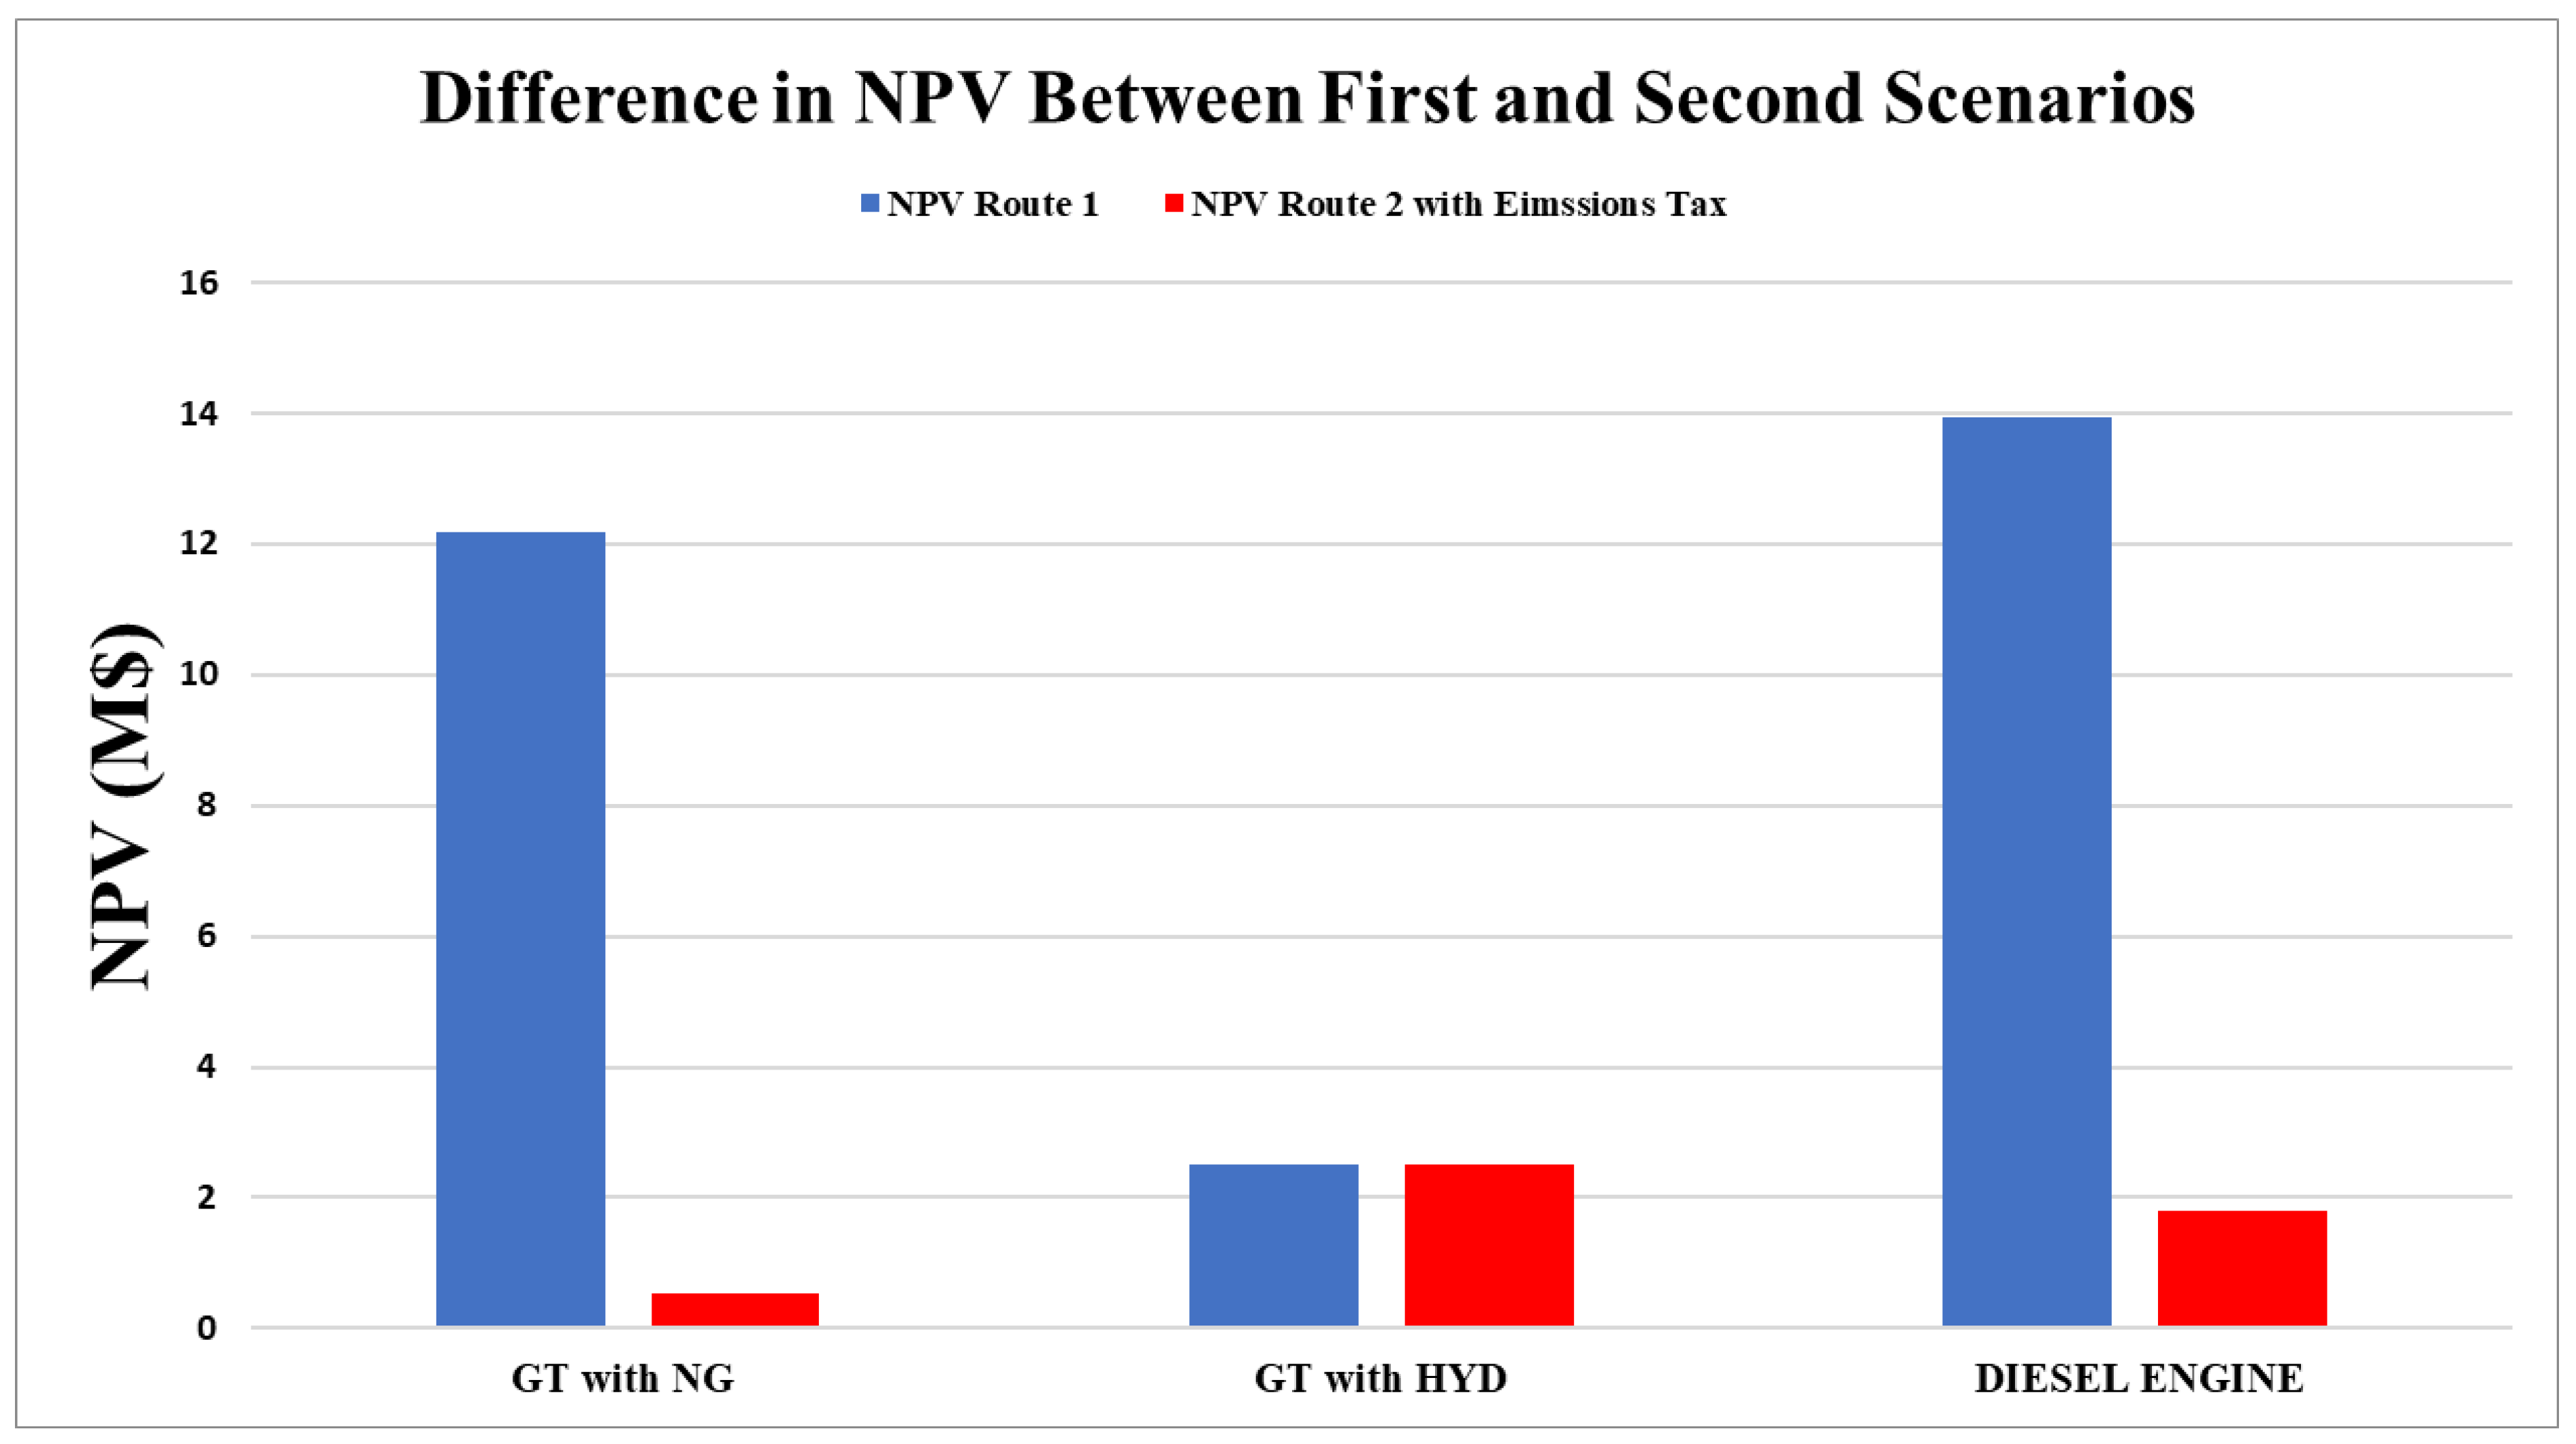
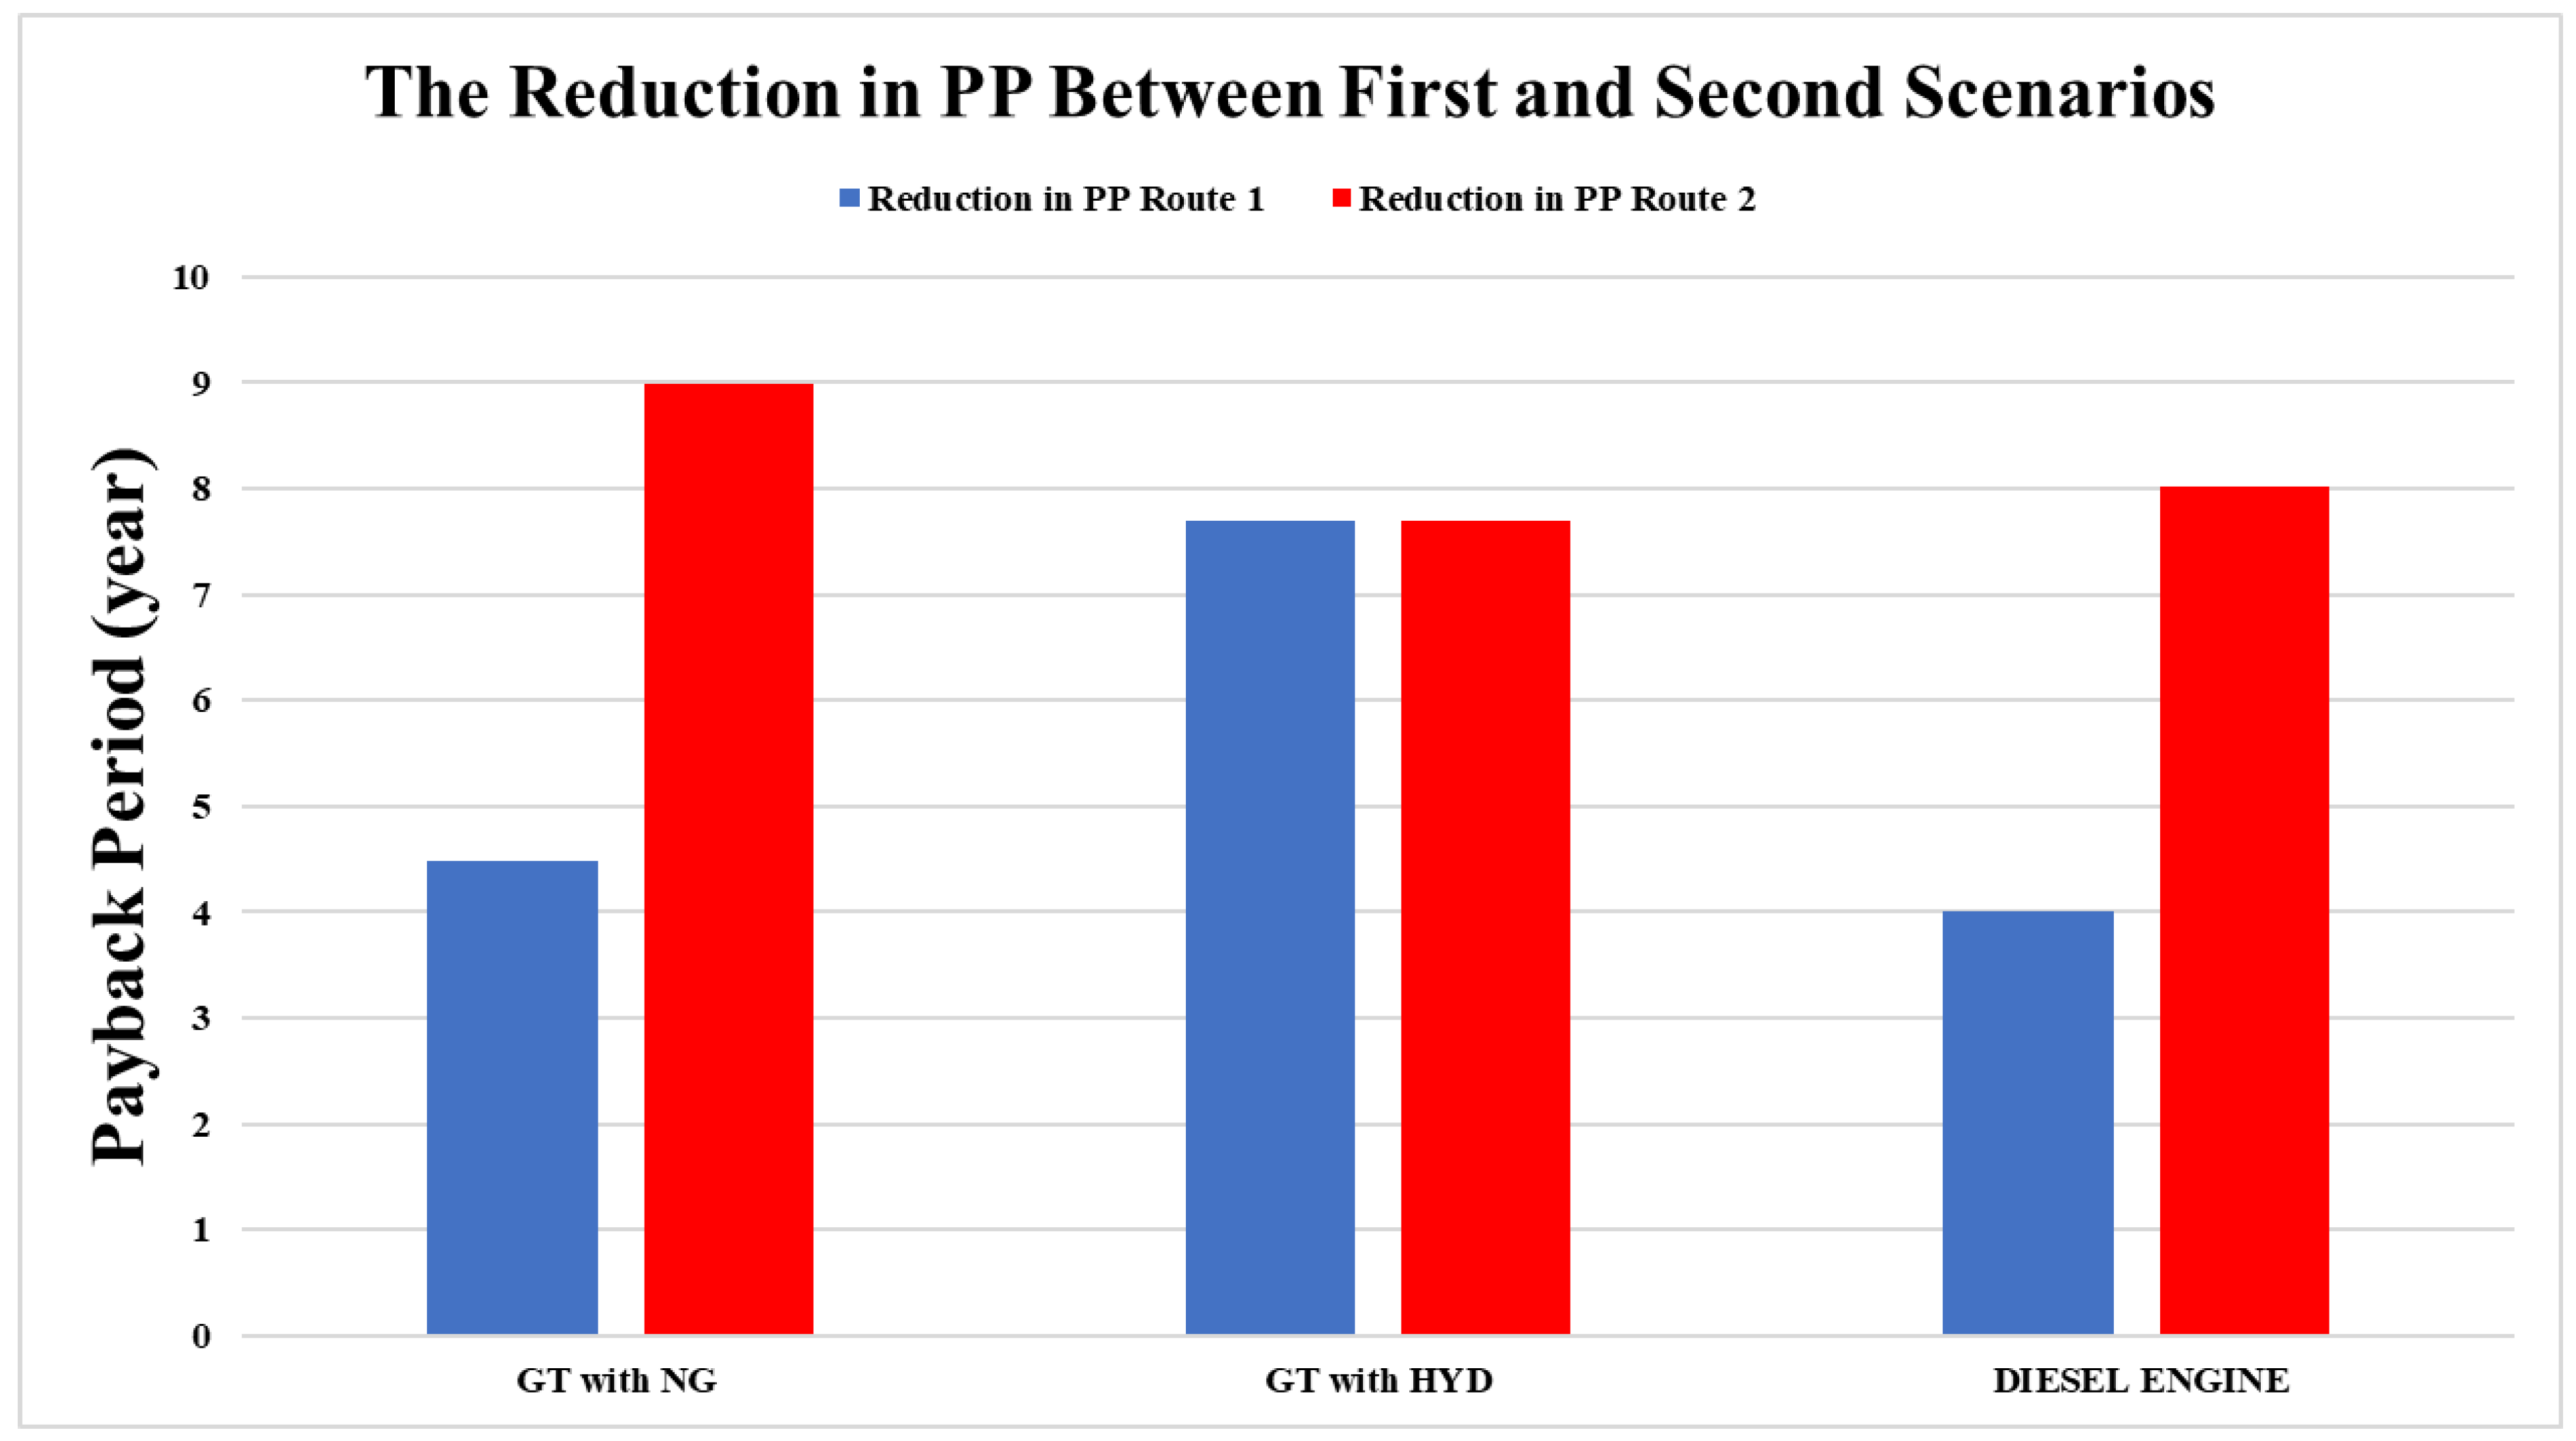
- First Scenario:
- Second Scenario:
4. Conclusions
- The diesel engine emitted higher NOx emissions than the GT fuelled by NG and HYD by approximately 84% and 89%, respectively. The GT with HYD had zero CO2 emissions, making it a viable option for sustainable energy production. The CO2 emissions of the diesel engine fuelled with MDO were lower than the GT fuelled by NG by approximately 14%, owing to the higher efficiency of the diesel engine.
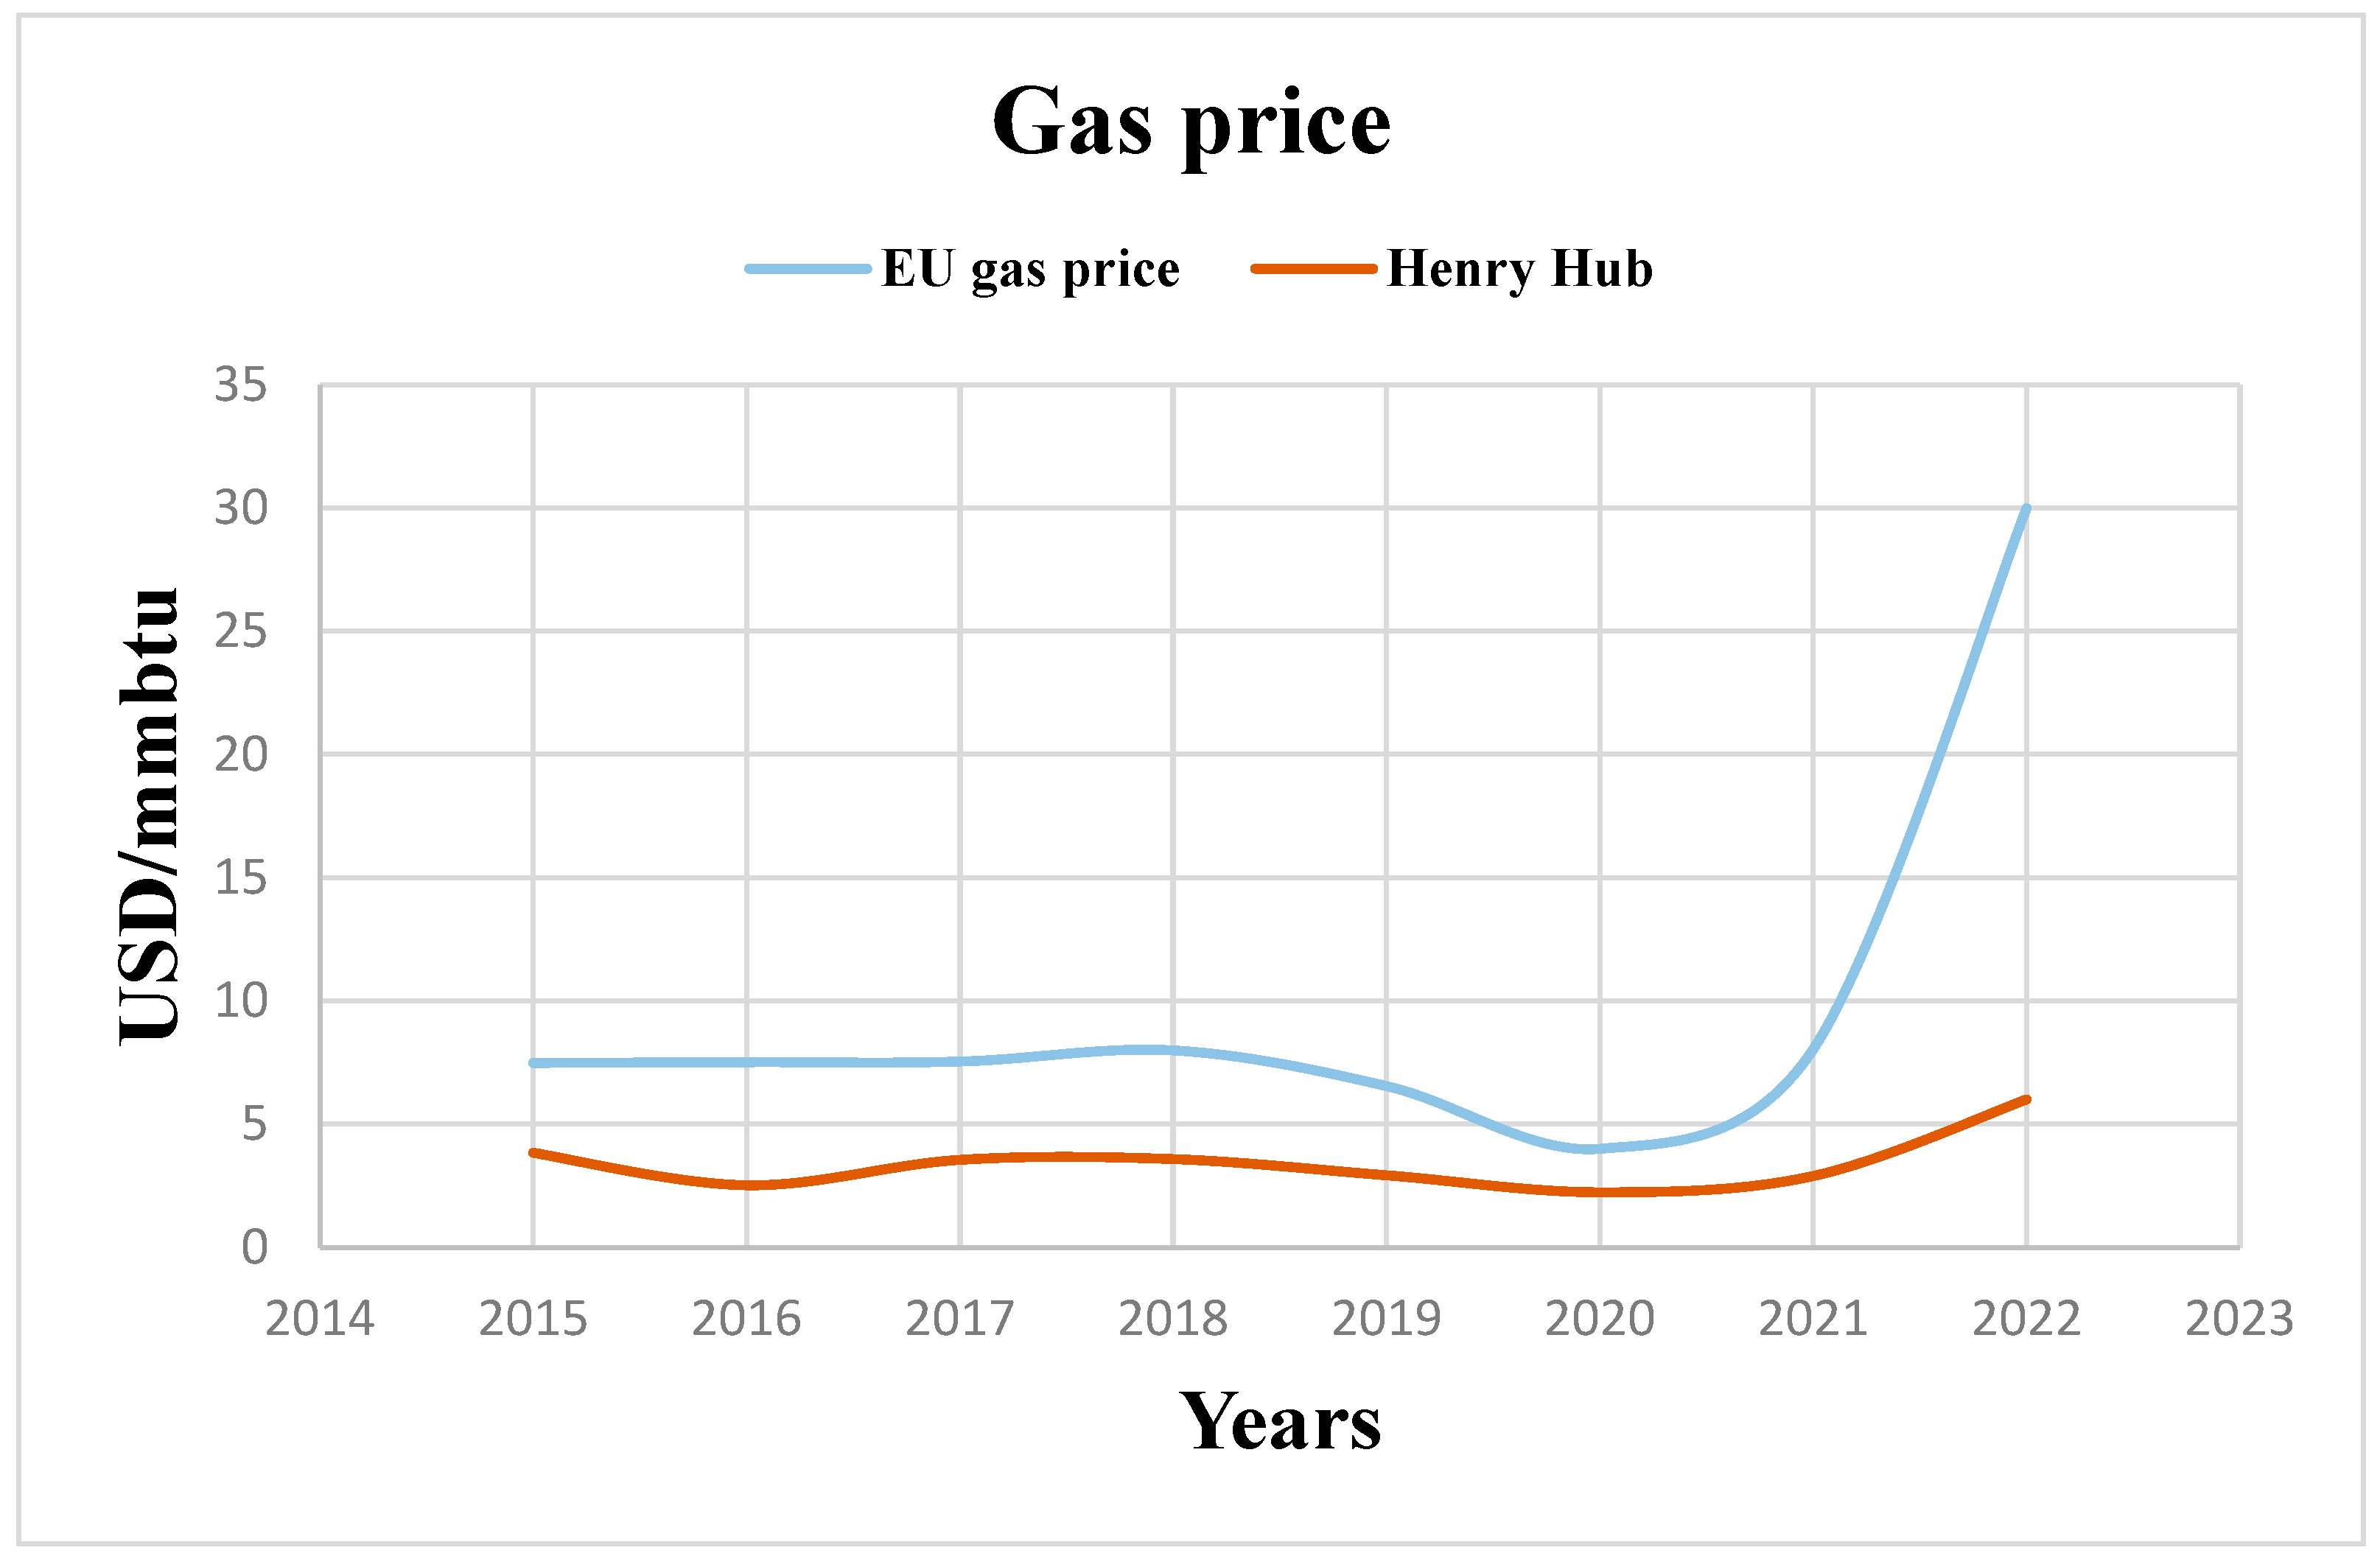
- Economic aspects were evaluated based on an international route. The economic profitability significantly relied on fuel cost and consumption.
- The first scenario revealed that the diesel engine fuelled by MDO and the GT fuelled by NG were economically attractive due to fuel cost and operating. The HYD-fuelled GT was less viable due to its high operating cost.
- The second scenario considered the effects of introducing a CO2 tax on the economic analysis. For the routes considered and when a carbon dioxide tax was applied, the four-stroke diesel engine fuelled by marine diesel oil and GT fuelled with NG showed higher reductions in net present values; 86.4% and 90.4%, respectively. At the same time, the PP was increased by 44.4% and 50%, respectively. The results showed that the GT fuelled by HYD had potential as a substantial low-risk investment compared with the other technologies.
Author Contributions
Funding
Data Availability Statement
Acknowledgments
Conflicts of Interest
References
- Lee, H.J.; Yoo, S.H.; Huh, S.Y. Economic benefits of introducing LNG-fuelled ships for imported flour in South Korea. Transp. Res. Part D Transp. Environ. 2020, 78, 102220. [Google Scholar] [CrossRef]
- Iliuta, I.; Larachi, F. Modeling and Simulations of NOx and SO2 Seawater Scrubbing in Packed-Bed Columns for Marine Applications. Catalysts 2019, 9, 489. [Google Scholar] [CrossRef] [Green Version]
- Li, K.; Wu, M.; Gu, X.; Yuen, K.F.; Xiao, Y. Determinants of ship operators’ options for compliance with IMO 2020. Transp. Res. Part D Transp. Environ. 2020, 86, 102459. [Google Scholar] [CrossRef]
- Chu Van, T.; Ramirez, J.; Rainey, T.; Ristovski, Z.; Brown, R.J. Global impacts of recent IMO regulations on marine fuel oil refining processes and ship emissions. Transp. Res. Part D Transp. Environ. 2019, 70, 123–134. [Google Scholar] [CrossRef]
- Kwak, D.H.; Heo, J.H.; Park, S.H.; Seo, S.J.; Kim, J.K. Energy-efficient design and optimization of boil-off gas (BOG) re-liquefaction process for liquefied natural gas (LNG)-fuelled ship. Energy 2018, 148, 915–929. [Google Scholar] [CrossRef]
- Deng, J.; Wang, X.; Wei, Z.; Wang, L.; Wang, C.; Chen, Z. A review of NOx and SOx emission reduction technologies for marine diesel engines and the potential evaluation of liquefied natural gas fuelled vessels. Sci. Total Environ. 2021, 766, 144319. [Google Scholar] [CrossRef] [PubMed]
- George, D.G.; Eleftherios, K.D.; Chariklia, G.A. LNG carrier two-stroke propulsion systems: A comparative study of state of the art reliquefaction technologies. Energy 2020, 195, 116997. [Google Scholar] [CrossRef]
- Perčić, M.; Vladimir, N.; Fan, A. Life-cycle cost assessment of alternative marine fuels to reduce the carbon footprint in short-sea shipping: A case study of Croatia. Appl. Energy 2020, 279, 115848. [Google Scholar] [CrossRef]
- Atilhan, S.; Park, S.; El-Halwagi, M.M.; Atilhan, M.; Moore, M.; Nielsen, R.B. Green hydrogen as an alternative fuel for the shipping industry. Curr. Opin. Chem. Eng. 2021, 31, 100668. [Google Scholar] [CrossRef]
- Alzayedi, A.M.T.; Sampath, S.; Pilidis, P. Techno-Environmental Evaluation of a Liquefied Natural Gas-Fuelled Combined Gas Turbine with Steam Cycles for Large Container Ship Propulsion Systems. Energies 2022, 15, 1764. [Google Scholar] [CrossRef]
- Armellini, A.; Daniotti, S.; Pinamonti, P.; Reini, M. Evaluation of gas turbines as alternative energy production systems for a large cruise ship to meet new maritime regulations. Appl. Energy 2018, 211, 306–317. [Google Scholar] [CrossRef] [Green Version]
- Barsi, D.; Bono, A.; Satta, F.; Zunino, P. Gas turbine prime movers fuelled by LNG as a future alternative for sustainable power in marine propulsion: Current emission policy assessment and exhaust quality evaluation. E3S Web Conf. 2019, 113, 02018. [Google Scholar] [CrossRef] [Green Version]
- Kayadelen, H.K.; Ust, Y. Marine Gas Turbines. In Proceedings of the 7th International Advanced Technologies Symposium (IATS’13), Istanbul, Turkey, 30 October–1 November 2013; Volume 85. [Google Scholar]
- Bonet, M.; Doulgeris, G.; Pilidis, P. Assessment of a Marine Gas Turbine Installation on a Liquefied Natural Gas Carrier. Nausivios Chora 2010, 1–13. Available online: https://nausivios.snd.edu.gr/docs/c1_2010.pdf (accessed on 1 February 2023).
- Brynolf, S.; Fridell, E.; Andersson, K. Environmental assessment of marine fuels: Liquefied natural gas, liquefied biogas, methanol and bio-methanol. J. Clean. Prod. 2014, 74, 86–95. [Google Scholar] [CrossRef]
- Deniz, C.; Zincir, B. Environmental and economical assessment of alternative marine fuels. J. Clean. Prod. 2016, 113, 438–449. [Google Scholar] [CrossRef]
- Alzayedi, A.M.T.; Batra, A.; Sampath, S.; Pilidis, P. Techno-Environmental Mission Evaluation of Combined Cycle. Energies 2022, 15, 4426. [Google Scholar] [CrossRef]
- Alzayedi, A.M.T.; Sampath, S.; Pilidis, P. Techno-Economic and Risk Evaluation of Combined Cycle Propulsion Systems in Large Container Ships. Energies 2022, 15, 5178. [Google Scholar] [CrossRef]
- Alkhaledi, A.N.F.N.R.; Sampath, S.; Pilidis, P. A hydrogen fuelled LH2 tanker ship design. Ships Offshore Struct. 2022, 17, 1555–1564. [Google Scholar] [CrossRef]
- Alkhaledi, A.N.; Sampath, S.; Pilidis, P. Techno environmental assessment of Flettner rotor as assistance propulsion system for LH2 tanker ship fuelled by hydrogen. Sustain. Energy Technol. Assess. 2023, 55, 102935. [Google Scholar] [CrossRef]
- Alkhaledi, A.N.; Sampath, S.; Pilidis, P. Economic analysis of a zero-carbon liquefied hydrogen tanker ship. Int. J. Hydrogen Energy 2022, 47, 28213–28223. [Google Scholar] [CrossRef]
- Alkhaledi, A.N.; Batra, A.; Sampath, S.; Pilidis, P. Techno-environmental assessment of a hydrogen-fuelled combined-cycle gas turbine for a liquid hydrogen tanker. Energy Rep. 2022, 8, 10561–10569. [Google Scholar] [CrossRef]
- Nikolaidis, T. The Turbomatch Scheme for Aero/Industrial Gas Turbine Engine; The Turbomatch Manual; Cranfield University: Cranfield, UK, 2015. [Google Scholar]
- GenSet; MAN Energy Solutions. MAN Energy Solutions 86224 Augsburg GERMANY. 2022; 252p. Available online: https://man-es.com/applications/projectguides/4stroke/manualcontent/L32-40_GenSet_TierII.pdf (accessed on 15 February 2023).
- Talluri, L.; Nalianda, D.K.; Giuliani, E. Techno economic and environmental assessment of Flettner rotors for marine propulsion. Ocean Eng. 2018, 154, 1–15. [Google Scholar] [CrossRef] [Green Version]
- Talluri, L.; Nalianda, D.K.; Kyprianidis, K.G.; Nikolaidis, T.; Pilidis, P. Techno economic and environmental assessment of wind assisted marine propulsion systems. Ocean Eng. 2016, 121, 301–311. [Google Scholar] [CrossRef] [Green Version]
- Doulgeris, G.; Korakianitis, T.; Pilidis, P.; Tsoudis, E. Techno-economic and environmental risk analysis for advanced marine propulsion systems. Appl. Energy 2012, 99, 1–12. [Google Scholar] [CrossRef]
- Birk, L. Holtrop and Mennen’s Method. In Fundamentals of Ship Hydrodynamics: Fluid Mechanics, Ship Resistance and Propulsion; John Wiley & Sons, Ltd.: Hoboken, NJ, USA, 2019; pp. 611–627. [Google Scholar] [CrossRef]
- Schneekluth, H.; Bertram, V. Ship Design for Efficiency and Economy, 2nd ed.; Butterworth-Heinemann: Oxford, UK, 1998. [Google Scholar]
- World Map—Worldometer. Available online: https://www.worldometers.info/world-map/ (accessed on 21 March 2022).
- Trozzi, C. Emission Estimate Methodology for Maritime Navigation. 2010; Volume 6. Available online: http://www.epa.gov/ttnchie1/conference/ei19/session10/trozzi.pdf (accessed on 22 April 2023).
- (AMC), A.M.C. Development of a Methodology to Measure and Assess Ship Emissions Theme; University of Tasmania: Hobart, Australia, 2016; Volume 61. [Google Scholar]
- Coşofreţ, D.; Bunea, M.; Popa, C. The Computing Methods for CO2 Emissions in Maritime Transports. Int. Conf. Knowl. Based Organ. 2016, 22, 622–627. [Google Scholar] [CrossRef]
- Fetnstein, S.P.; Lander, D.M. A better understanding of why NPV undervalues managerial flexibility. Eng. Econ. 2007, 47, 418–435. [Google Scholar] [CrossRef]
- Alrashed, M.; Nikolaidis, T.; Pilidis, P.; Alrashed, W.; Jafari, S. Economic and environmental viability assessment of NASA’s turboelectric distribution propulsion. Energy Rep. 2020, 6, 1685–1695. [Google Scholar] [CrossRef]
- Pra, A.; Pettenella, D. Investment returns from hybrid poplar plantations in northern Italy between 2001 and 2016: Are we losing a bio-based segment of the primary economy? Ital. Rev. Agric. Econ. 2019, 74, 49–71. [Google Scholar] [CrossRef]
- Borden, B.T. Math Behind Financial Aspects of Partnership Distribution Waterfalls. Available online: http://ssrn.com/abstract=2519258%0AElectronic (accessed on 25 April 2023).
- Ammar, N.R. Environmental and cost-effectiveness comparison of dual fuel propulsion options for emissions reduction onboard lng carriers. Brodogradnja 2019, 70, 61–77. [Google Scholar] [CrossRef]
- Furqon Rochyana, M.; Yamin Jinca, M.; Siahaya, J. MDO and LNG as Fuels (Duel Fuel) to Support Sustainable Maritime Transport (A Case Study in KM. Ciremai). Int. Ref. J. Eng. Sci. (IRJES) 2014, 3, 32–38. [Google Scholar]
- Fernández, I.A.; Gómez, M.R.; Gómez, J.R.; Insua, Á.B. Review of propulsion systems on LNG carriers. Renew. Sustain. Energy Rev. 2017, 67, 1395–1411. [Google Scholar] [CrossRef]
- Gilbert, P.; Walsh, C.; Traut, M.; Kesieme, U.; Pazouki, K.; Murphy, A. Assessment of full life-cycle air emissions of alternative shipping fuels. J. Clean. Prod. 2018, 172, 855–866. [Google Scholar] [CrossRef]
- Klassen, M. Fuel Flexibility for Dry Low Emission Gas Turbines—Cleanly Burning Biofuels. Coal Liquids and Petroleum Fuels. In Proceedings of the PowerGen International 2007, New Orleans, LA, USA, 10–14 December 2007. [Google Scholar]
- Willis, J.D.; Toon, I.J.; Schweiger, T.; Owen, D.A. Industrial RB211 DRY low emission combustion. In Turbo Expo: Power for Land, Sea, and Air; American Society of Mechanical Engineers: New York, NY, USA, 1993. [Google Scholar]
- Douglas, C. NOx Emissions from Hydrogen-Methane Fuel Blends; Georgia Institute of Technology: Atlanta, GA, USA, 2022. [Google Scholar]
- Herdzik, J. Decarbonization of marine fuels—The future of shipping. Energies 2021, 14, 4311. [Google Scholar] [CrossRef]
- Rievaj, V.; Gaňa, J.; Synák, F. Is hydrogen the fuel of the future? Transp. Res. Proc. 2019, 40, 469–474. [Google Scholar] [CrossRef]
- Fikri, M.; Hendrarsakti, J.; Sambodho, K.; Felayati, F.; Octaviani, N.; Giranza, M.; Hutomo, G.A. Estimating Capital Cost of Small Scale LNG Carrier. In Proceedings of the 3rd International Conference on Marine Technology—SENTA, Surabaya, Indonesia, 5–6 December 2018; pp. 225–229. [Google Scholar] [CrossRef]
- Lazard. Lazard’s Levelised Cost of Energy Analysis. Lazard.com. 2017; pp. 1–21. Available online: https://www.lazard.com/perspective/levelized-cost-of-energy-2017/ (accessed on 30 April 2023).
- Breeze, P. The Cost of Power Generation. Business Insight. 2010. Available online: http://lab.fs.uni-lj.si/kes/erasmus/TheCostofPowerGeneration.pdf (accessed on 2 May 2023).
- Seebregts, A.J. Gas-Fired Power. IEA ETSAP—Technology Brief E02—April 2010. 2010; pp. 1–5. Available online: http://www.iea-etsap.org/web/E-TechDS/PDF/E02-gas_fired_power-GS-AD-gct.pdf (accessed on 5 May 2023).
- Jodat, A. Exergoeconomic analysis of gas turbines cogeneration systems. J. Eng. Appl. Sci. 2016, 11, 2545–2550. [Google Scholar] [CrossRef]
- Goldstein, L.; Hedman, B.; Knowles, D.; Freedman, S.I.; Woods, R. Gas-Fired Distributed Energy Resource Technology Characterizations; Gas Research Institute and the National Renewable Energy Laboratory (NREL): Golden, CO, USA, 2003; Volume 226. Available online: http://www.osti.gov/bridge (accessed on 8 May 2023).
- Korberg, A.D.; Brynolf, S.; Grahn, M.; Skov, I.R. Techno-economic assessment of advanced fuels and propulsion systems in future fossil-free ships. Renew. Sustain. Energy Rev. 2021, 142, 110861. [Google Scholar] [CrossRef]
- Aurecon. 2019 Costs and Technical Parameter Review. 2019; 57p. Available online: https://www.aemo.com.au/-/media/Files/Electricity/NEM/Planning_and_Forecasting/Inputs-Assumptions-Methodologies/2019/Aurecon-2019-Cost-and-Technical-Parameters-Review-Draft-Report.PDF (accessed on 10 May 2023).
- LNG as Marine Fuel—DNV. Available online: https://www.dnv.com/maritime/insights/topics/lng-as-marine-fuel/current-price-development-oil-and-gas.html (accessed on 12 May 2023).
- Han, T.C.; Wang, C.M. Shipping bunker cost risk assessment and management during the coronavirus oil shock. Sustainability 2021, 13, 4998. [Google Scholar] [CrossRef]
- Dinu, O.; Ilie, A.M. Maritime vessel obsolescence, life cycle cost and design service life. IOP Conf. Ser. Mater. Sci. Eng. 2015, 95, 012067. [Google Scholar] [CrossRef]
- RORO Shipping—Hezelinks|Air Freight Cargo|Sea Freight Cargo|World Wide Freight Cargo Delivery. Available online: https://hezelinks.com/roro-shipping/ (accessed on 15 May 2023).
- Ascope Shipping—Shipping Prices for RoRo and Containers. Available online: https://www.ascopeshipping.co.uk/shipping-prices/ (accessed on 17 May 2023).
- EU Emissions Trading System (EU ETS). Available online: https://ec.europa.eu/clima/eu-action/eu-emissions-trading-system-eu-ets_en (accessed on 19 May 2023).
- Asen, E. European Countries with a Carbon Tax, 2021|Tax Foundation. Tax Foundation. 2021. Available online: https://taxfoundation.org/carbon-taxes-in-europe-2021/ (accessed on 3 August 2021).
- Carbon Pricing Dashboard|Up-to-Date Overview of Carbon Pricing Initiatives. Available online: https://carbonpricingdashboard.worldbank.org/map_data (accessed on 21 May 2023).


| Displacement (t) | 11,012 |
| Overall length (m) | 126.3 |
| Breadth (m) | 20 |
| Draught (m) | 5.5 |
| Speed (knots) | 14.5 |
| Parameter | Value |
|---|---|
| Thermal efficiency (%) | 32 |
| Exhaust gas temperature (K) | 838 |
| Exhaust mass flow (kg/s) | 16.3 |
| Power (kW) | 4470 |
| Pressure ratio | 14.5 |
| Specific fuel consumption (kg/kWh) | 0.269 |
| Parameter | Simulated Value |
|---|---|
| Exhaust gas temperature (°C) | 546 |
| Exhaust mass flow (kg/s) | 9.11 |
| Power (kW) | 4500 |
| Specific fuel consumption (g/kWh) | 186.0 |
| Stroke (mm) | 400 |
| Bore diameter (mm) | 320 |
| Journey | Trip Duration | Annual Trips | Annual Winter Trips | Annual Summer Trips | Annual Mid-Season Trips |
|---|---|---|---|---|---|
| Shuwaikh–Mumbai | 5 d 04 h | 61.1 | 15.2 | 15.2 | 30.5 |
| Emissions | Fuel Coefficient (kg CO2/kg of Fuel) | NOx (ppm) |
|---|---|---|
| NG | 2.75 | 25 |
| HYD | 0 | 1.37 |
| MDO | 3.2 | 156 |
| GT (USD/kW) | 490 |
| GT O&M costs | 4% of the capital cost per year |
| GT installation costs | 30% of the capital cost |
| Diesel engine (USD/kW) | 349 |
| Diesel engine O&M costs | 7% of the capital cost per year |
| Diesel engine installation costs | 30% of the capital cost |
| Fuel | Price (USD/Tonne) |
|---|---|
| NG | 500 |
| HYD | 2000 |
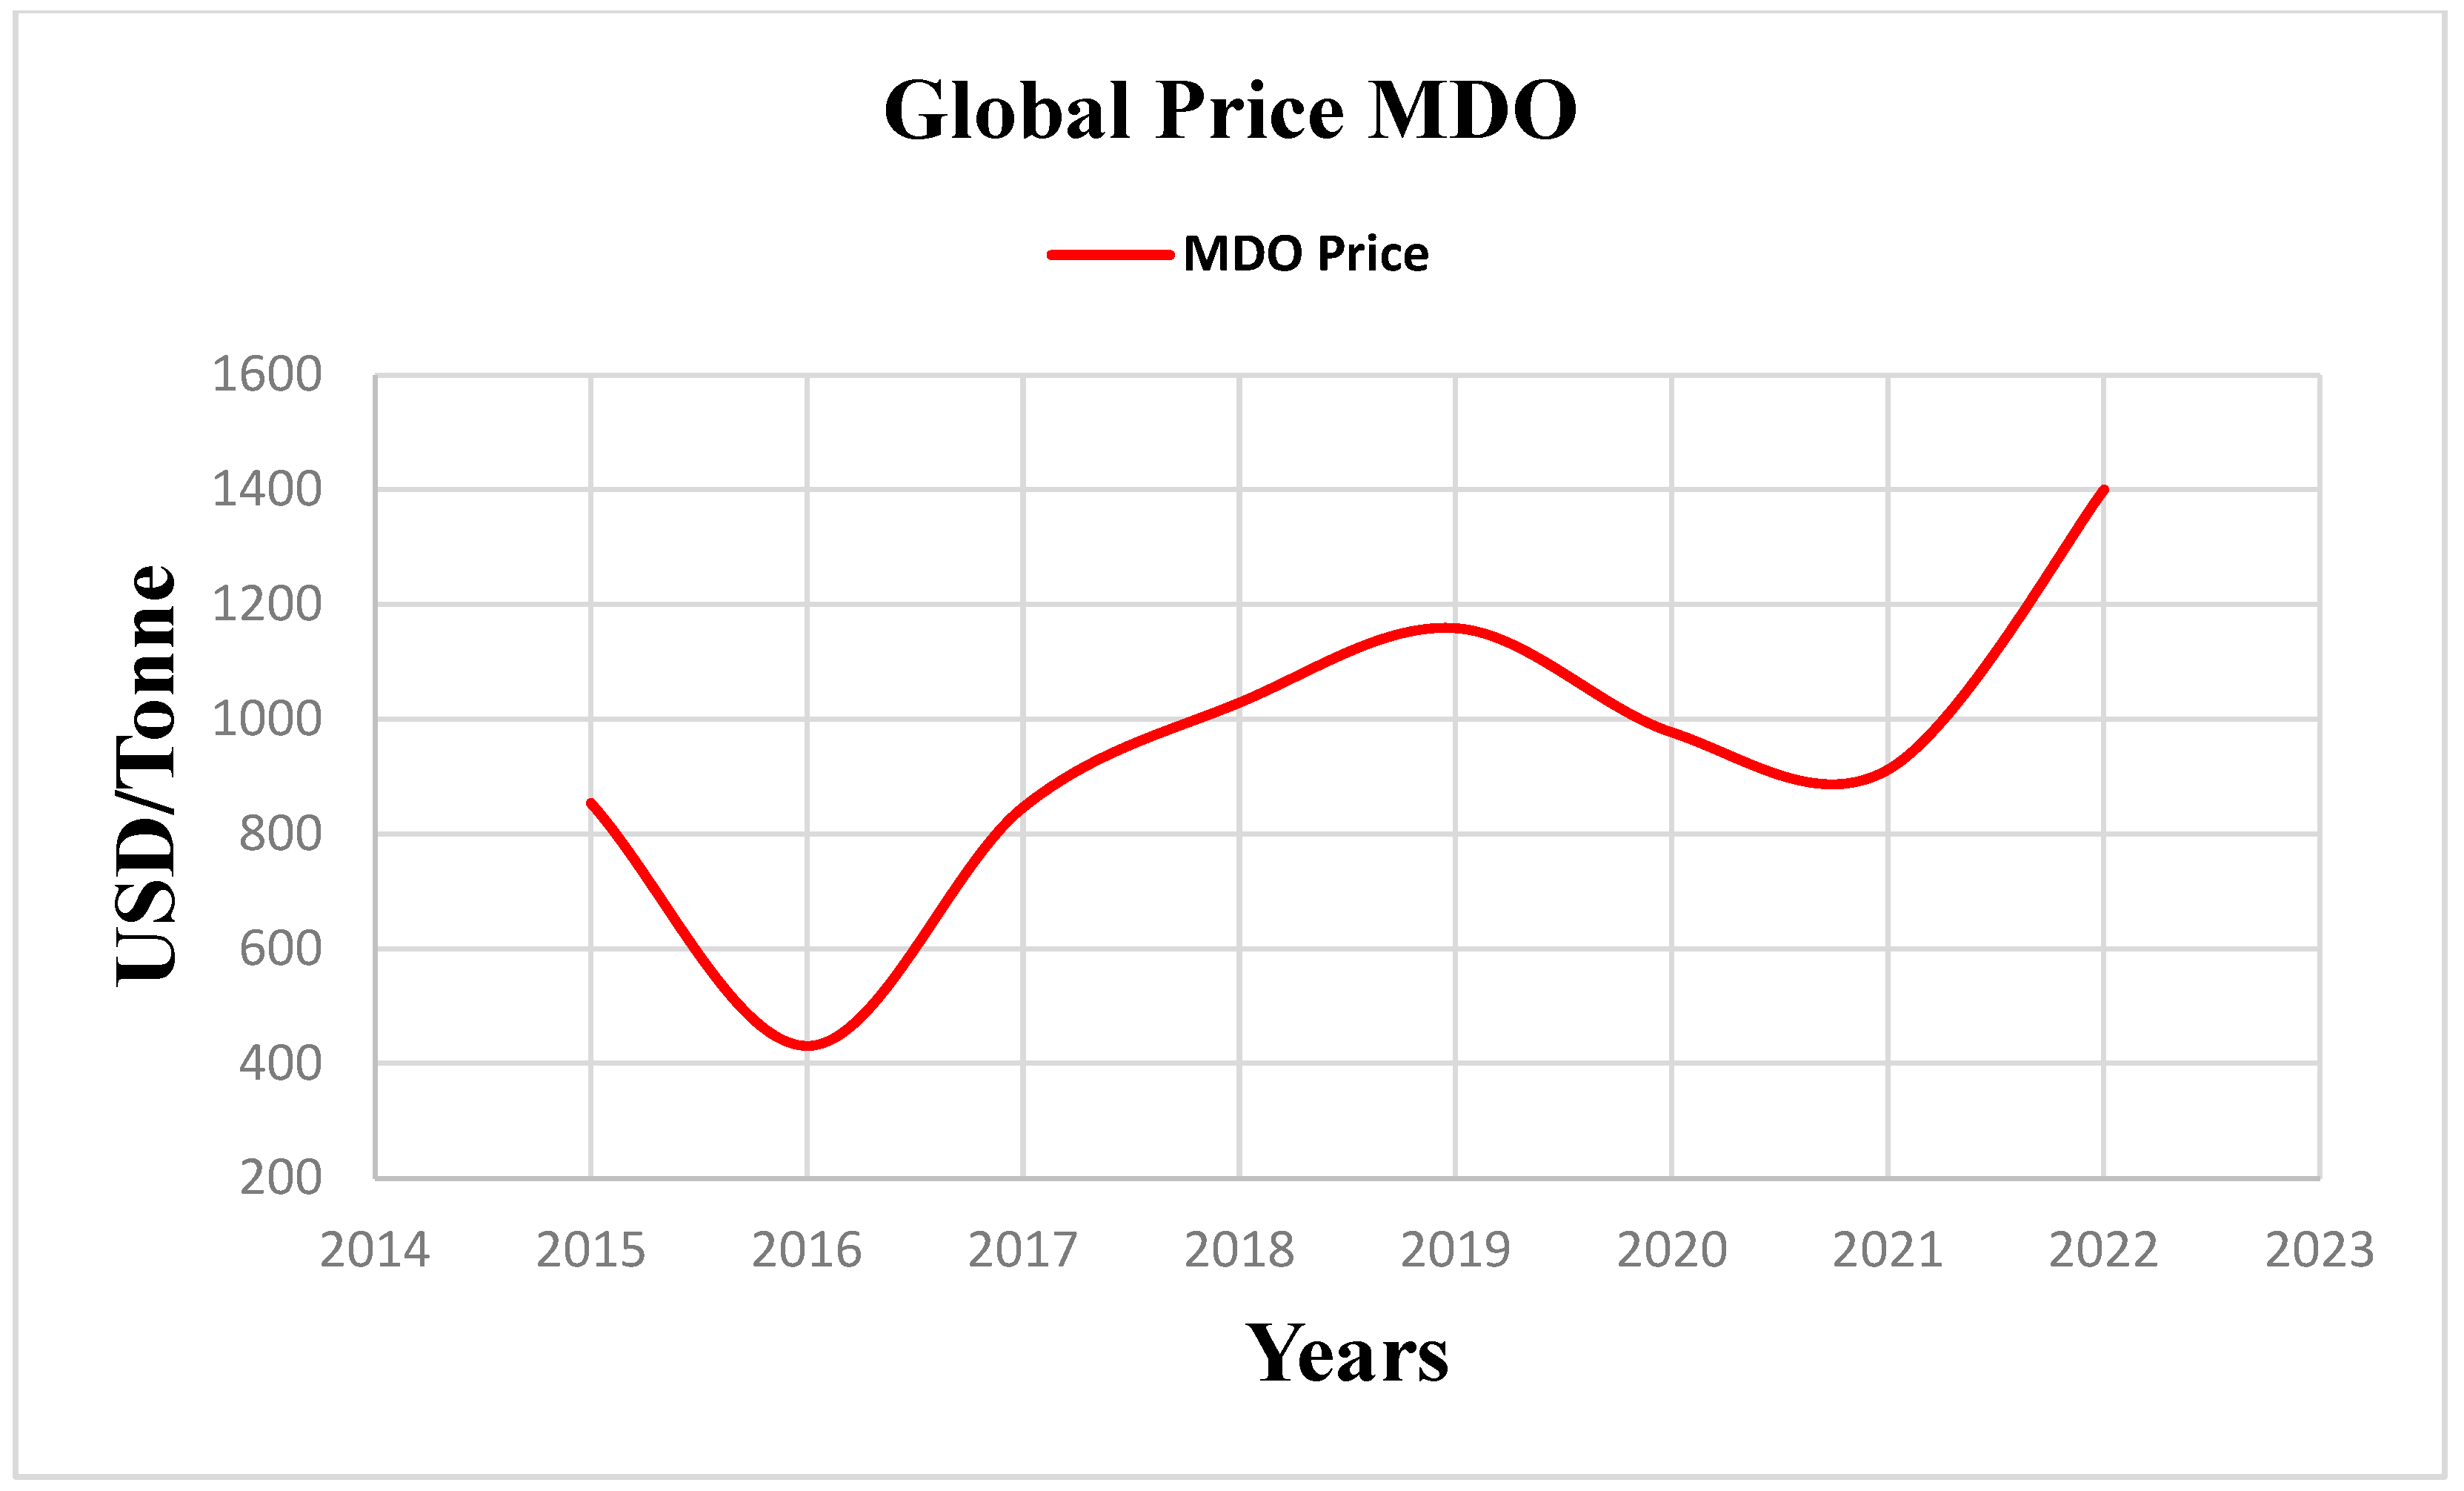
| MDO | 900 |
| GT NG | GT HYD | Diesel Engine | |
|---|---|---|---|
| NPV | USD 12,191,843.3 | USD 2,508,272.2 | USD 13,926,599.1 |
| PP | 4.49 years | 7.6 years | 4.08 years |
Disclaimer/Publisher’s Note: The statements, opinions and data contained in all publications are solely those of the individual author(s) and contributor(s) and not of MDPI and/or the editor(s). MDPI and/or the editor(s) disclaim responsibility for any injury to people or property resulting from any ideas, methods, instructions or products referred to in the content. |
© 2023 by the authors. Licensee MDPI, Basel, Switzerland. This article is an open access article distributed under the terms and conditions of the Creative Commons Attribution (CC BY) license (https://creativecommons.org/licenses/by/4.0/).
Share and Cite
Alzayedi, A.M.T.; Alkhaledi, A.N.F.N.R.; Sampath, S.; Pilidis, P. TERA of Gas Turbine Propulsion Systems for RORO Ships. Energies 2023, 16, 5875. https://doi.org/10.3390/en16165875
Alzayedi AMT, Alkhaledi ANFNR, Sampath S, Pilidis P. TERA of Gas Turbine Propulsion Systems for RORO Ships. Energies. 2023; 16(16):5875. https://doi.org/10.3390/en16165875
Chicago/Turabian StyleAlzayedi, Abdulaziz M. T., Abdullah N. F. N. R. Alkhaledi, Suresh Sampath, and Pericles Pilidis. 2023. "TERA of Gas Turbine Propulsion Systems for RORO Ships" Energies 16, no. 16: 5875. https://doi.org/10.3390/en16165875
APA StyleAlzayedi, A. M. T., Alkhaledi, A. N. F. N. R., Sampath, S., & Pilidis, P. (2023). TERA of Gas Turbine Propulsion Systems for RORO Ships. Energies, 16(16), 5875. https://doi.org/10.3390/en16165875