Article

Development of a Biomass Component Prediction Model Based on Elemental and Proximate Analyses

1
Department of Interdisciplinary Program in Smart Agriculture, Kangwon National University, Hyoja 2 Dong 192-1, Chuncheon 24341, Republic of Korea
2
Agriculture and Life Science Research Institute, Kangwon National University, Hyoja 2 Dong 192-1, Chuncheon 24341, Republic of Korea
3
Department of Biosystems Engineering, Kangwon National University, Hyoja 2 Dong 192-1, Chuncheon 24341, Republic of Korea
*
Author to whom correspondence should be addressed.
These authors contributed equally to this work.
Energies 2023, 16(14), 5341; https://doi.org/10.3390/en16145341
Submission received: 22 May 2023 / Revised: 4 July 2023 / Accepted: 10 July 2023 / Published: 13 July 2023
(This article belongs to the Special Issue Thermochemical Conversions of Biomass and Its Safety Evaluation)

Abstract

:
Emerging global environmental pollution issues have caused a reduction in coal utilization, leading to an increased research focus on biomass use as an alternative. However, due to the low heat values of biomass, studies in this field are still in progress. Biomass primarily comprises cellulose, hemicellulose, and lignin. To determine the composition of these three components, the measurement methods recommended by TAPPI (Technical Association of the Pulp and Paper Industry) and NREL (National Renewable Energy Laboratory) are typically employed involving equipment such as HPLC. However, these methods are time consuming. In this study, we proposed a model for predicting cellulose, hemicellulose, and lignin contents based on elemental and industrial analyses. A dataset comprising 174 samples was used to develop this model. This was validated using 25 additional samples. The R2P values for cellulose, hemicellulose, and lignin were 0.6104–0.6362, 0.4803–0.5112, and 0.7247–0.7914, respectively; however, the R2CV values obtained from the validation results were 0.7387–0.7837, 0.3280–0.4004, and 0.7427–0.7757, respectively. The optimal models selected for cellulose, lignin, and hemicellulose were C1, L2, and 100-(C1-L2) or H2, respectively. Our predictions for woody and herbaceous biomass, including torrefied samples, should be applied with caution to other biomass types due to the potential accuracy limitations. To enhance the prediction accuracy, future research should broaden the range of biomass types considered and gather more data specifically related to woody and herbaceous biomass.

1. Introduction

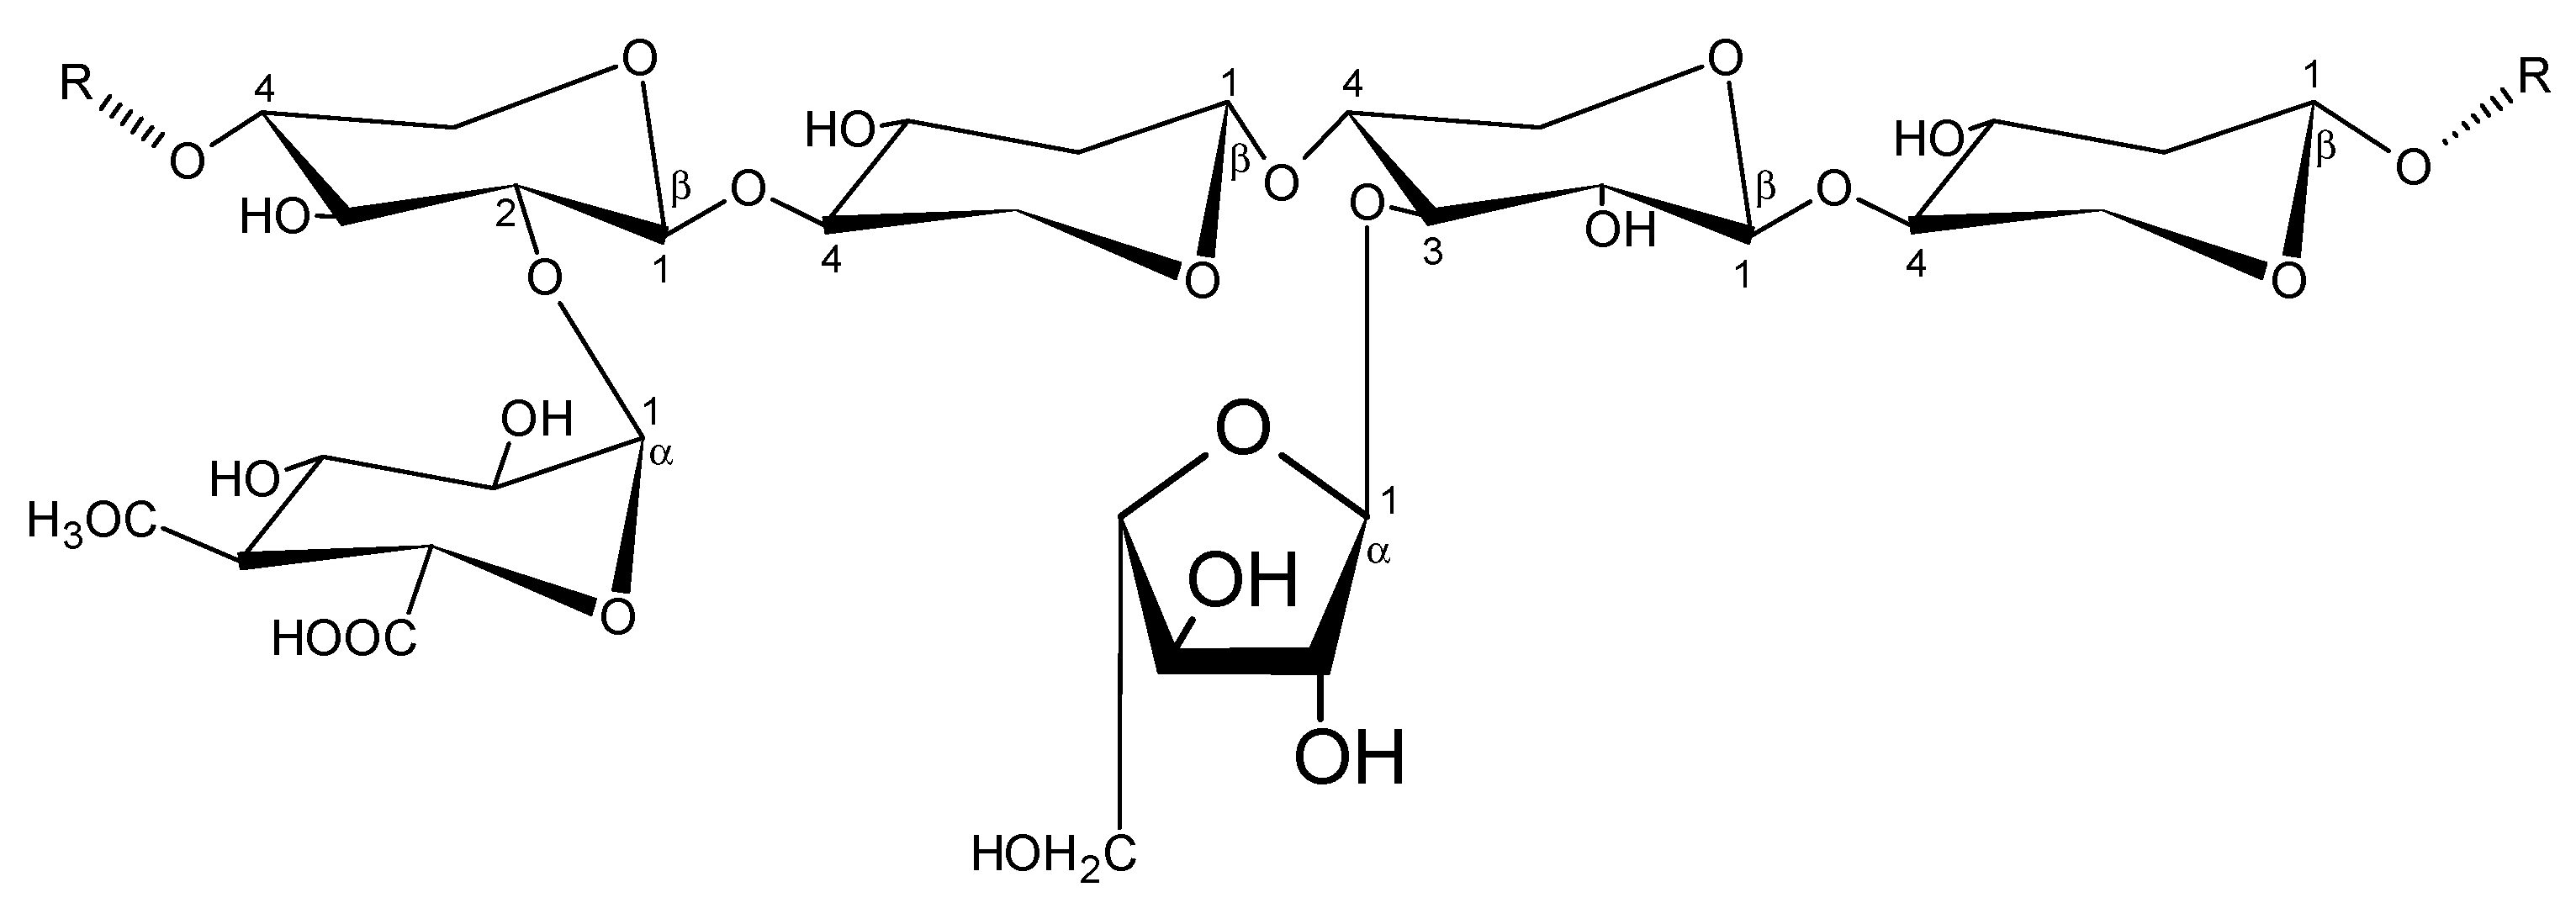
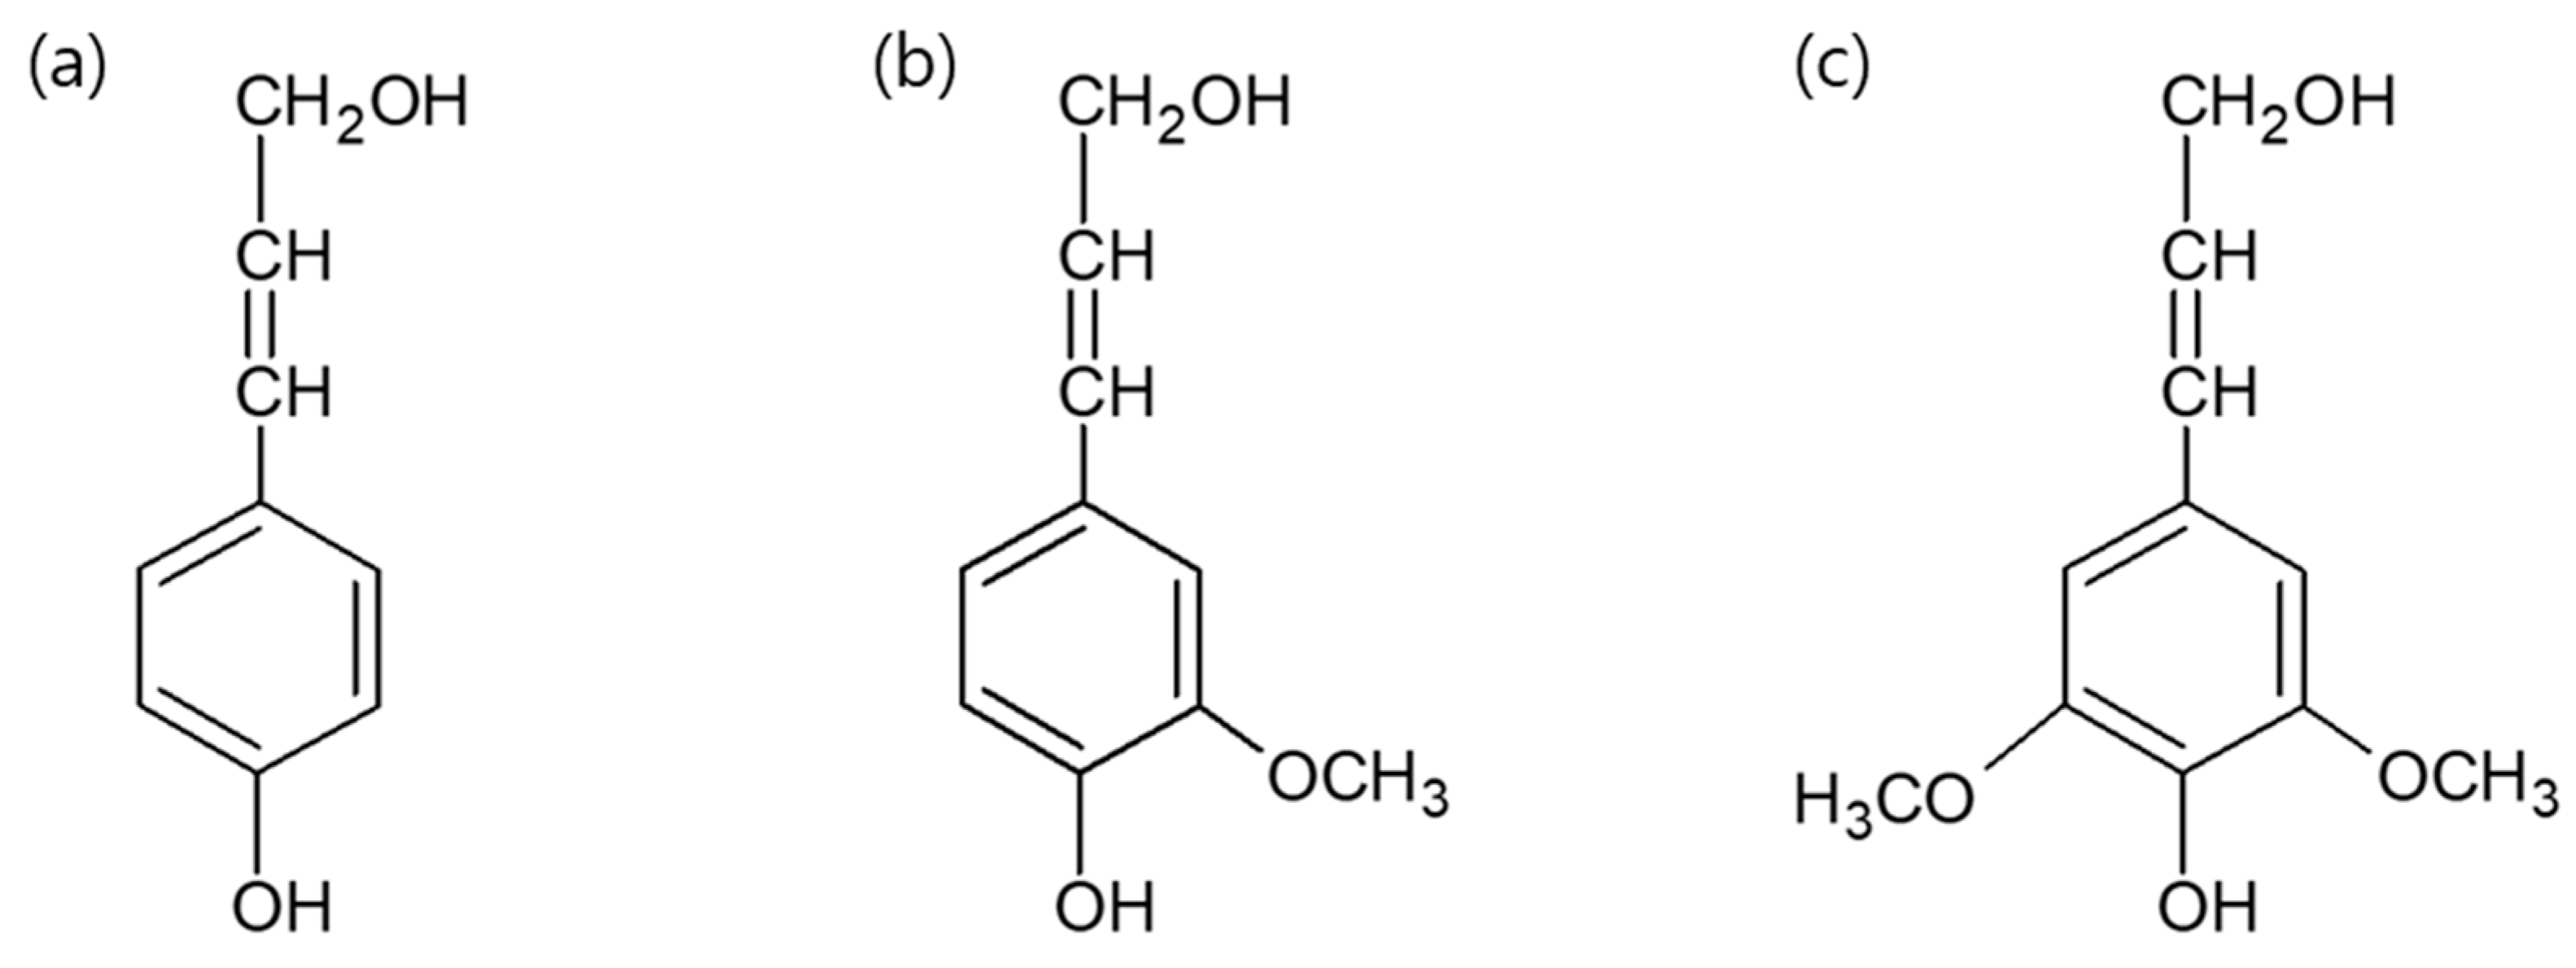
As interest in the environment is on the rise, much research is being conducted on alternative renewable energy sources to replace traditional fossil fuels. In particular, research has been conducted on alternative energy sources, such as hydrogen energy and batteries, which are currently prevalent. Globally, there is a strong reliance on thermal power generation to generate large amounts of electricity. This has caused increasing interest in biomass power plants that use biofuels as an alternative to coal. The use of agricultural and forest-based biomass is particularly advantageous because it is continuously produced by human activities and is relatively evenly distributed worldwide, unlike fossil fuels, which are concentrated in specific regions. However, biomass has been criticized for its high ash content and low calorific value compared with fossil fuels. To address these drawbacks, various thermochemical conversion processes have been conducted. In particular, processes such as torrefaction and carbonization have been developed to use biomass as a solid fuel. During the thermochemical conversion of biomass, the contents of the three components of biomass—cellulose, hemicellulose, and lignin—are important. Cellulose (Figure 1) is a glucose polymer with the structure [C6H10O5]n [1]. Hemicellulose (Figure 2) is a complex of 6-carbon and 5-carbon sugars, primarily composed of arabinose, xylose, mannose, galactose, and glucose [2]. In contrast, lignin comprises three phenylpropanoid units (p-coumaryl, coniferyl, and sinapyl alcohols) derived from cinnamyl alcohol (Figure 3) [3].
However, not all chemical compositions are solely based on these chemical structures. In most cases, other elements such as nitrogen, sulfur, and chlorine are included in addition to C, H, and O. If these elements are considered only from the elemental composition perspective, an elemental analysis will divide only the organic components of the sample into C, H, N, and S, assuming the remaining mass to be oxygen, leading to misunderstandings regarding the composition of sulfur, chlorine, ash, and other elements present in the sample [4]. However, in proximate analysis, the total biomass composition can be determined [5]. Cellulose is primarily composed of volatile matter. Hemicellulose has less volatile matter and more fixed carbon than cellulose and includes some ash. Lignin has relatively less volatile matter and more fixed carbon, with a particularly higher ash content than the other two components [6,7,8,9]. These characteristics cannot be determined using elemental analysis alone.
The ratios of these components vary depending on the biomass sources, such as herbaceous plants, hardwoods, or softwood. The TAPPI (Technical Association of the Pulp and Paper Industry) and the NREL (National Renewable Energy Laboratory) methods were used to determine the amounts of these three chemical components [10,11,12,13,14,15]. However, this method requires extensive time, samples, and equipment, such as HPLC and spectrometers. Consequently, various studies attempted alternative analyses for predicting biomass compositions rather than using conventional methods. Sheng et al. attempted to predict cellulose and lignin contents based on carbon dioxide and hydrogen consumption, and volatile matter [16]. Burhenne et al. predicted the chemical structure using elemental ratios [17]. However, the methods of Sheng et al. had a limited range of O/C and H/C, and that of Burhenne et al. was sensitive to even minor changes in the elemental composition. Díez et al. suggested the low-cost and rapid TGA-PKM method for determining the main lignocellulosic fraction contents of different types of biomasses from agricultural by-products [18]. Xing et al. reported a chemical constituent prediction model from ultimate analysis using a random forest model [19]. However, although an analysis of untreated biomass has been conducted, there is little research on the prediction of torrefied biomass. Therefore, this study proposed a model that predicts the cellulose, hemicellulose, and lignin contents based on the elemental content ratios determined during biofuel evaluation. From untreated biomass to torrefied biomass, this study attempted to make predictions using this method.

2. Methodology

2.1. Collection of Data

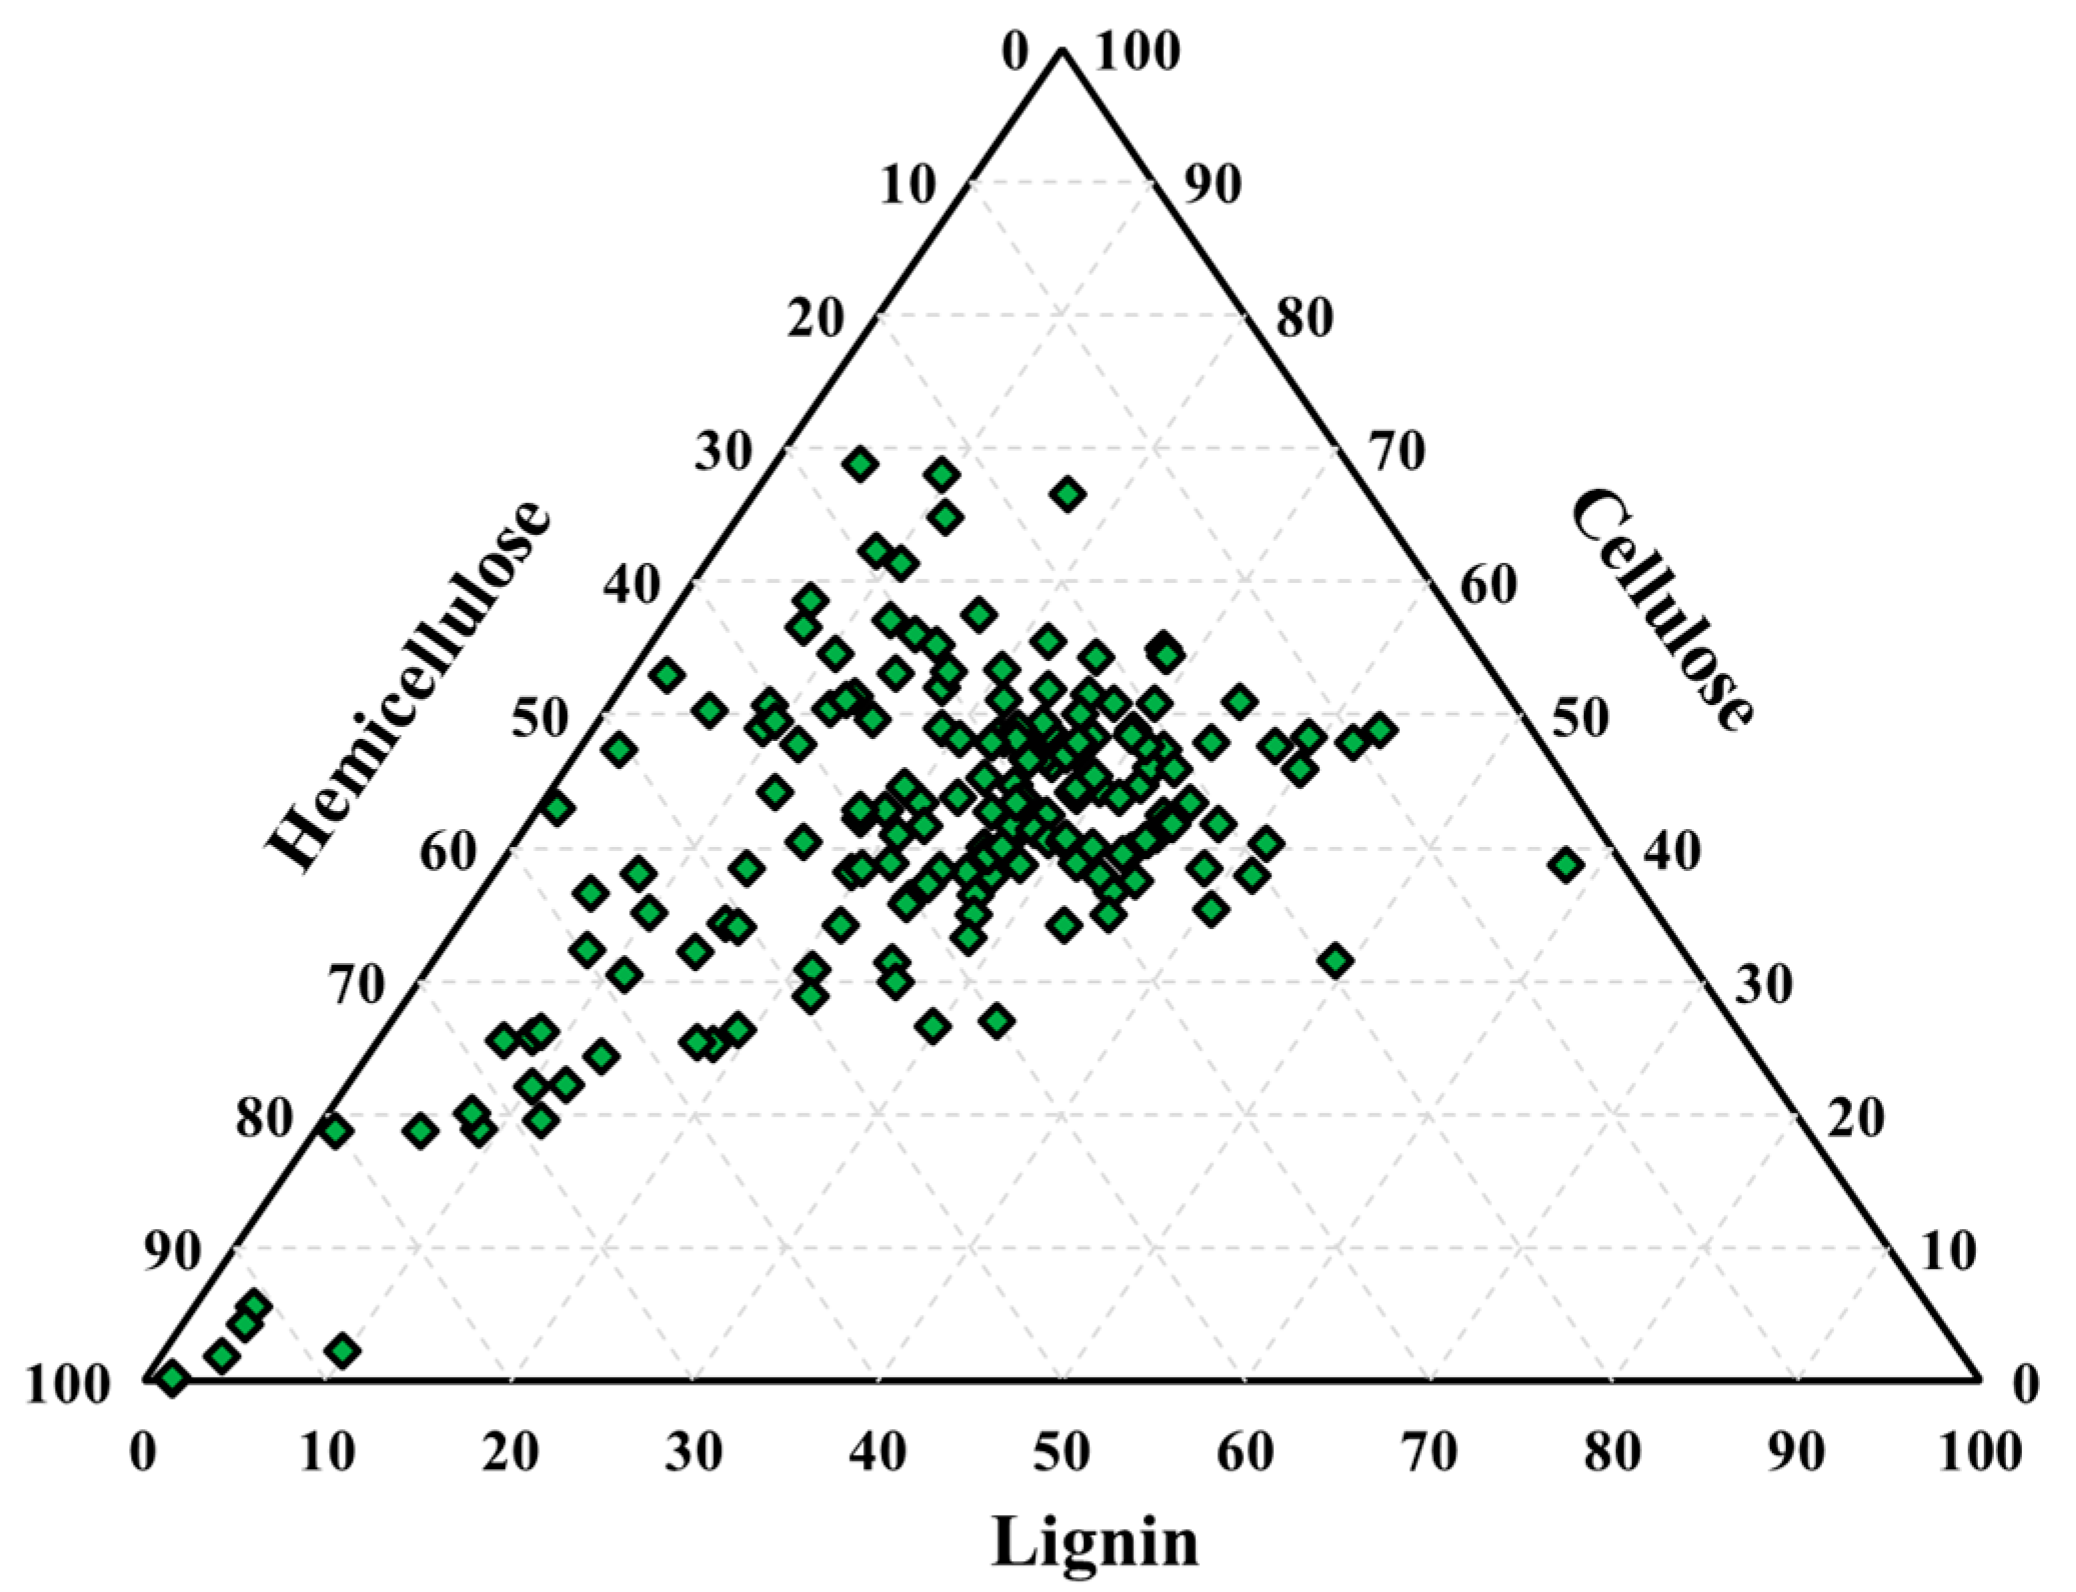
The elemental analysis, proximate analysis, and chemical structure results of the biomass were obtained from previous studies. A total of 174 data points were collected and normalized [20,21,22,23,24,25,26,27,28,29,30,31,32,33,34,35,36,37,38,39,40,41,42,43,44,45,46,47,48,49,50,51,52,53,54,55,56]. The collected data are summarized in Figure 4 and Table S1.

2.2. Pearson Correlation Coefficient

The Pearson correlation coefficient (Equation (1)) was used to examine the correlation between the various elements (C, H, N, O, and S), and proximate (VM and FC) and composition (Cell, Hemi, and Lig) analysis results. The Pearson correlation coefficient, as described in Equation (1), was used to analyze the degree of correlation between two populations. It ranges from −1 to 1, where positive and negative values indicate a proportional and inverse relationship, respectively. Values closer to −1 or 1 indicate a stronger linear correlation, whereas those closer to 0 indicate a weaker correlation [57]. Correlation equations with different goodness of fit values were obtained by performing linear and nonlinear regressions on the final analysis data using IBM SPSS version 22.0. The data analyses in this study utilized a combination of the “stepwise” and “enter” methods in SPSS software.
R = ( i = 1 n ( X i X ¯ ) ( Y i Y ¯ ) ) i = 1 n ( X i X ¯ ) 2 i = 1 n ( Y i Y ¯ ) 2

2.2.1. Linear Regression

Linear regression is a statistical method commonly used to determine the value of a dependent variable based on that of an independent variable [58]. This technique uses a mathematical equation that outputs a simple value based on a combination of input properties. The linear regression equation is as follows [59]:
y ^ = β O + x 1 β 1 + x 2 β 2 + x 3 β 3 + + x n β n

2.2.2. Polynomial Regression

In polynomial regression, the data are approximated using a polynomial function [60]. It involves the use of high-order terms of variables for estimating the polynomial regression and creating a curved response surface [61]. Since there is no universal polynomial equation, the equation should be determined based on the specific problem at hand. The general expression for a polynomial of a function is as follows [59]:
f ( x ) = c o + c 1 x + c 2 x 2 + + c n x n

2.3. Model Evaluation

Four performance metrics (equations) were used to evaluate the suitability of the models including the coefficient of determination (R2), mean absolute error (MAE), root mean squared error (RMSE), and average absolute error (AAE). The coefficient of determination is a convenient tool for comparing relative performance. The MAE was used because it has the same units as the measured and predicted values and is intuitive. Although the RMSE had the advantage of reducing the distortion of values resulting from the square of the error, errors < 1 were further reduced due to the square, whereas errors > 1 increased. AAE and ABE represent the average error of the correlation equation; if they have positive values, they are evaluated highly, whereas if they have negative values, they are evaluated as somewhat low. The optimal selected prediction models were cross-validated using the data summarized in Table 1.
R 2 = 1 i = 1 n V a l u e M V a l u e P i = 1 n V a l u e M V a l u e P ¯
M A E = Σ i = 1 n ( V a l u l e M V a l u e P )   n
A A E = 1 n i = 1 n | V a l u e P V a l u e M V a l u e M |

3. Results & Discussions

3.1. Result of Pearson Correlation Coefficient

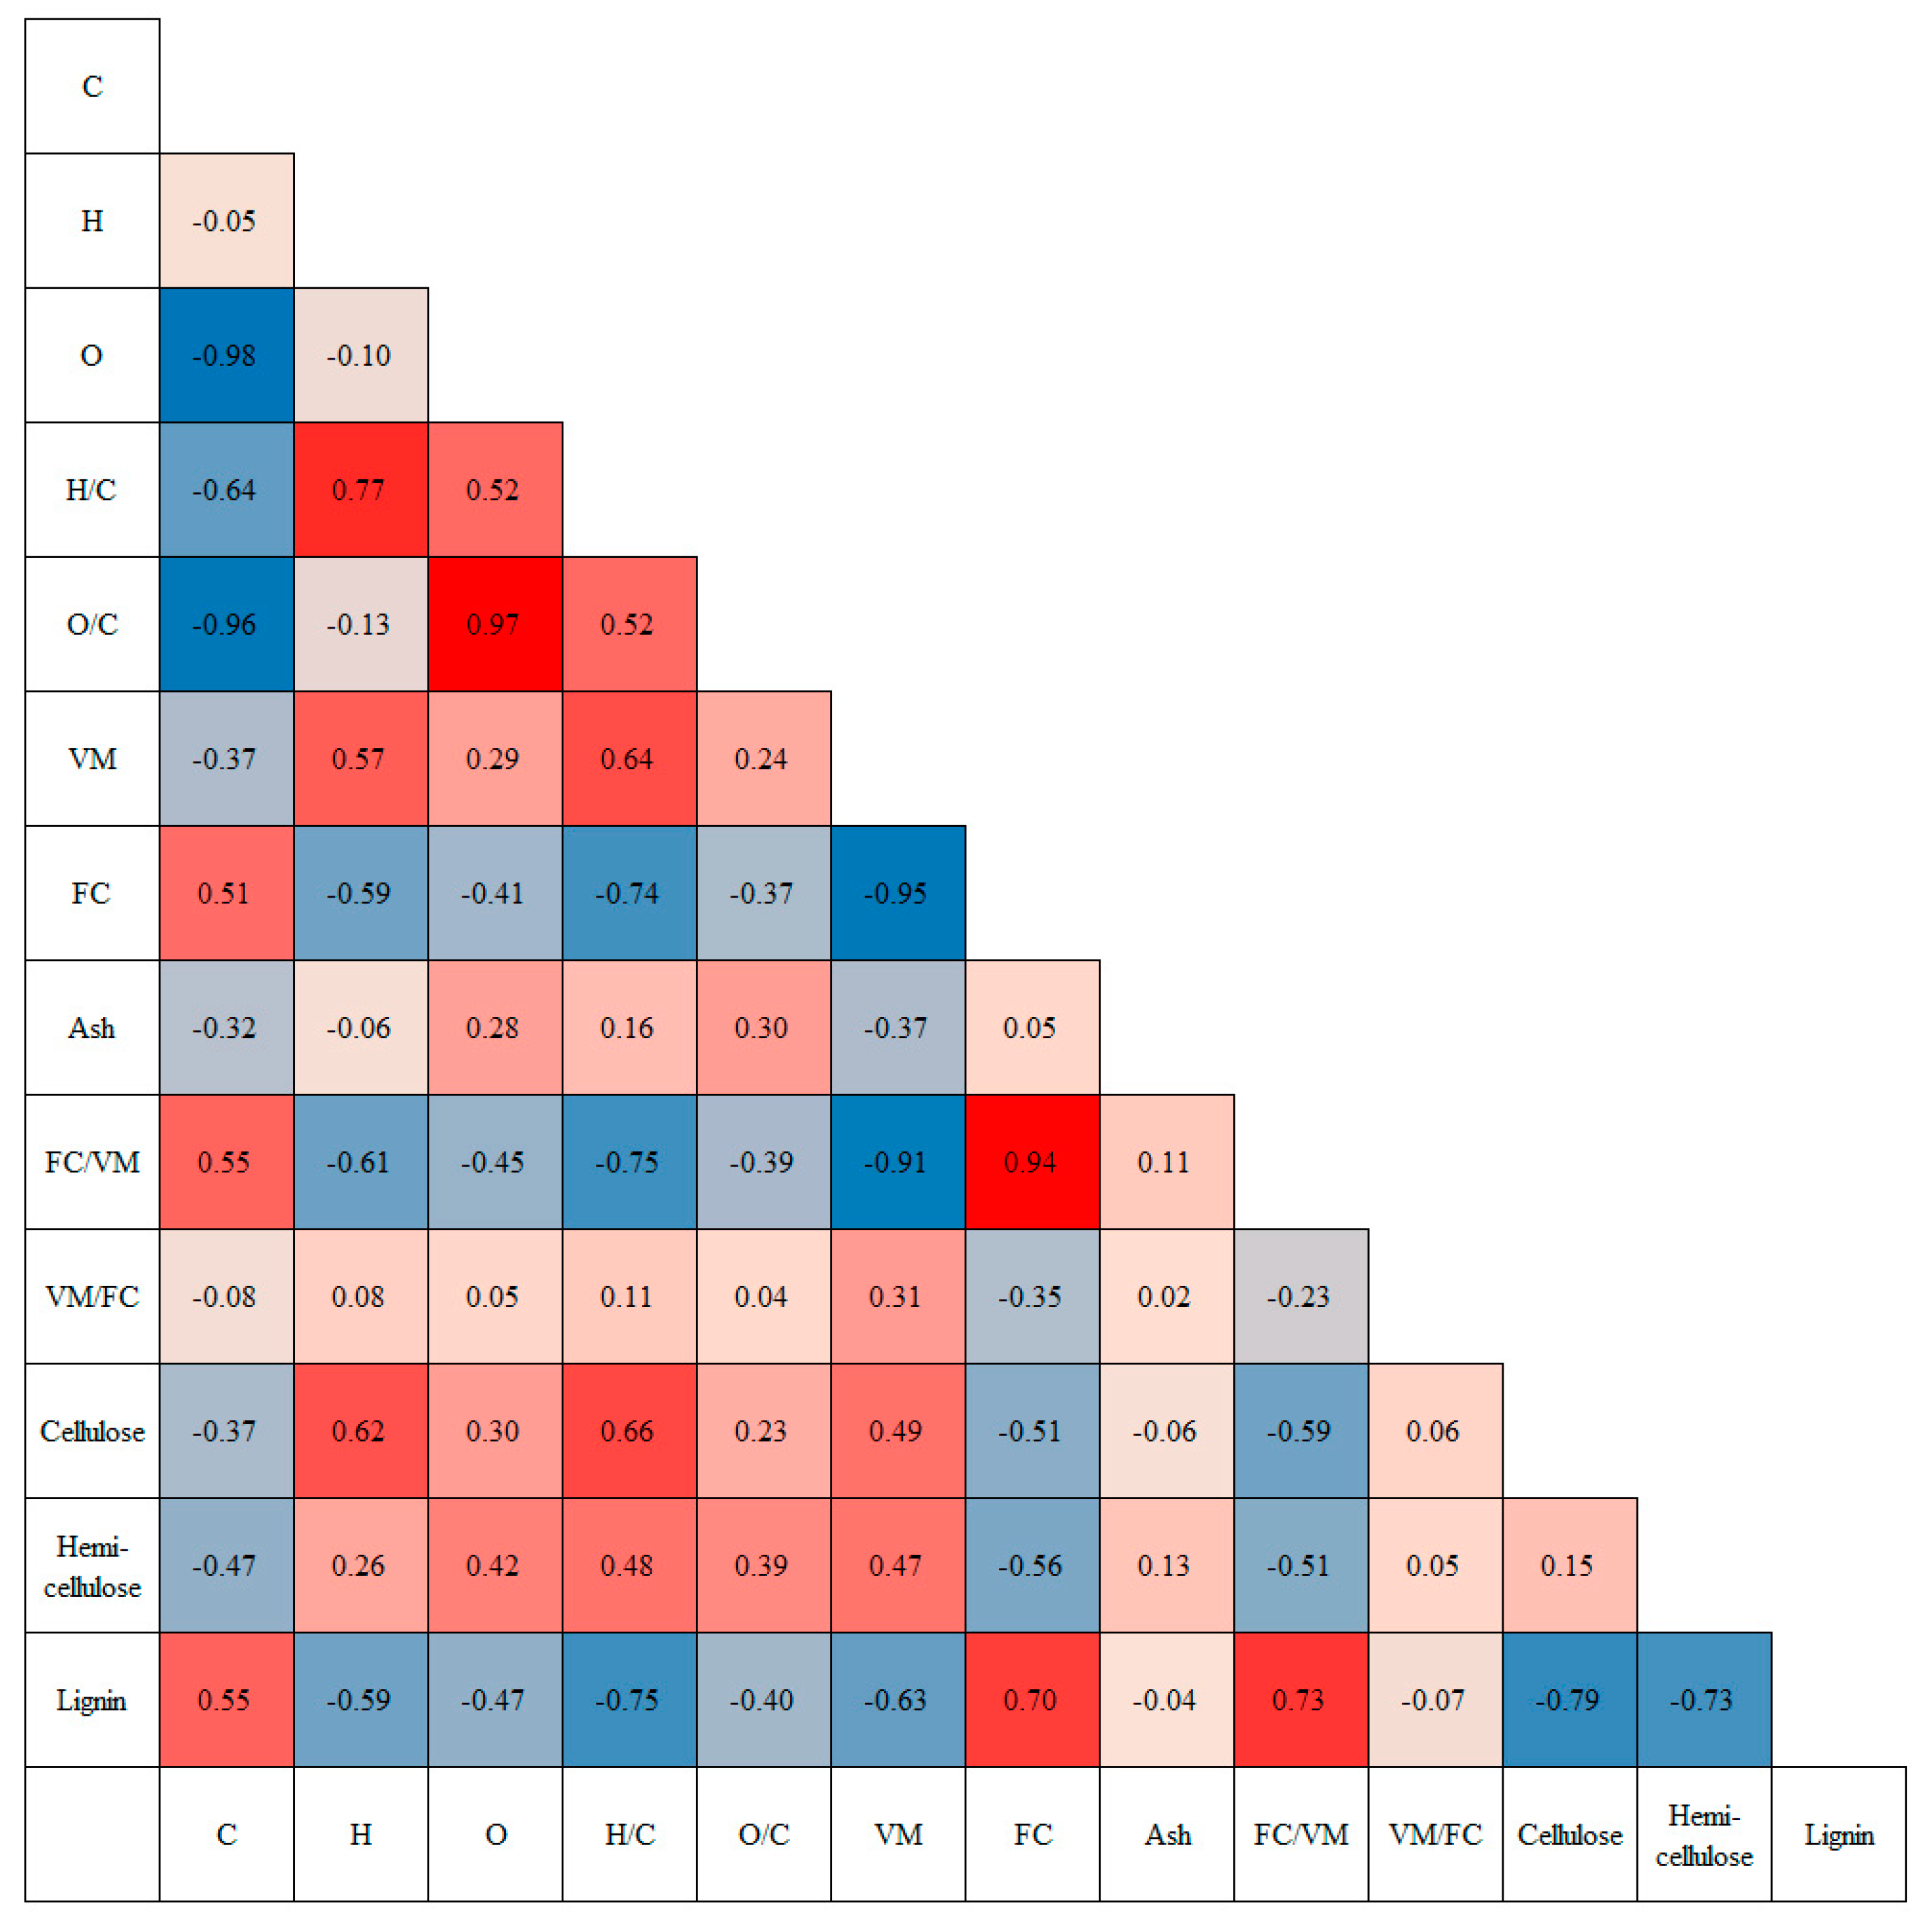
The results of Pearson’s correlation coefficient are summarized in Figure 5. Cellulose showed a negative correlation with C, but a positive correlation with H and O. Despite the negative correlation between C and cellulose, both H/C and O/C showed positive correlations. In particular, the H/C ratio exhibited a strong positive correlation (0.658). The VM showed a positive correlation, whereas the FC showed a negative correlation. FC/VM showed a strong negative correlation, which was attributed to the low FC content of cellulose. The correlation between the VM/FC ratios was low. Hemicellulose showed a stronger negative correlation with C than cellulose. H, O, H/C, and O/C showed positive correlations, but there was a slight difference compared to their relationship with cellulose. The correlation between H and hemicellulose showed a weaker positive correlation (0.26) than that between cellulose and H. On the other hand, the correlation between O and hemicellulose was higher (0.42) than that between cellulose and O (0.30). As a result, there was a slight difference between the H/C and O/C ratios. In the case of lignin and each element, there were many cases in which their correlations were opposite to those of cellulose and hemicellulose. Lignin was positively correlated with C and negatively correlated with H, O, H/C, and O/C, which were positively correlated with cellulose and hemicellulose. Lignin levels showed a strong negative correlation with VM and a strong positive correlation with FC. These results were based on the fact that cellulose and hemicellulose are composed of linear carbon structures, whereas lignin has a ring structure that forms stronger bonds, making it less volatile. In addition, there was a strong positive correlation in the case of FC/VM due to its relationship with cellulose, such as FC. However, there was no strong correlation in the case of the VM/FC. Based on these results, the basic prediction model that was suggested is as follows:
C e l l = f ( C ,   H ,   O ,   V M ,   F C )
H e m i = g ( C ,   H ,   O ,   V M ,   F C )
L i g = h ( C ,   H ,   O ,   V M ,   F C )

3.2. Prediction Model for Cellulose

The equations with the highest R2P for predicting cellulose content are summarized in Table 2. Differences were observed between C1 and C2 when the second-order terms C, H, O, and FC/VM were added to the equation. Due to the increase in the number of factors involved in the equation, C2 showed an increased R2P of 0.6342, whereas C1 had an R2P of 0.6104. Additionally, lower RMSEP, MAEP, and AAEP values were observed. When comparing C2 and C3, the impact of the second-order terms on VM, FC, and FC/VM was considered. The R2P value for C3 increased slightly to 0.6362. However, the RMSEP, MAEP, and AAEP increased for C3, with values of 7.3263, 5.8115, and 43.1320, respectively, compared with C2 values of 7.3013, 5.4302, and 32.7348. This indicates that C3 had larger errors, as shown in Figure 6. The red trend line in Figure 6 was used as a reference for significance at the level of 0.01. As expected, there was little difference in the trends between C2 and C3; however, some data points from C3 deviated further from the trend line compared to those from C2.

3.3. Prediction Model for Hemicellulose

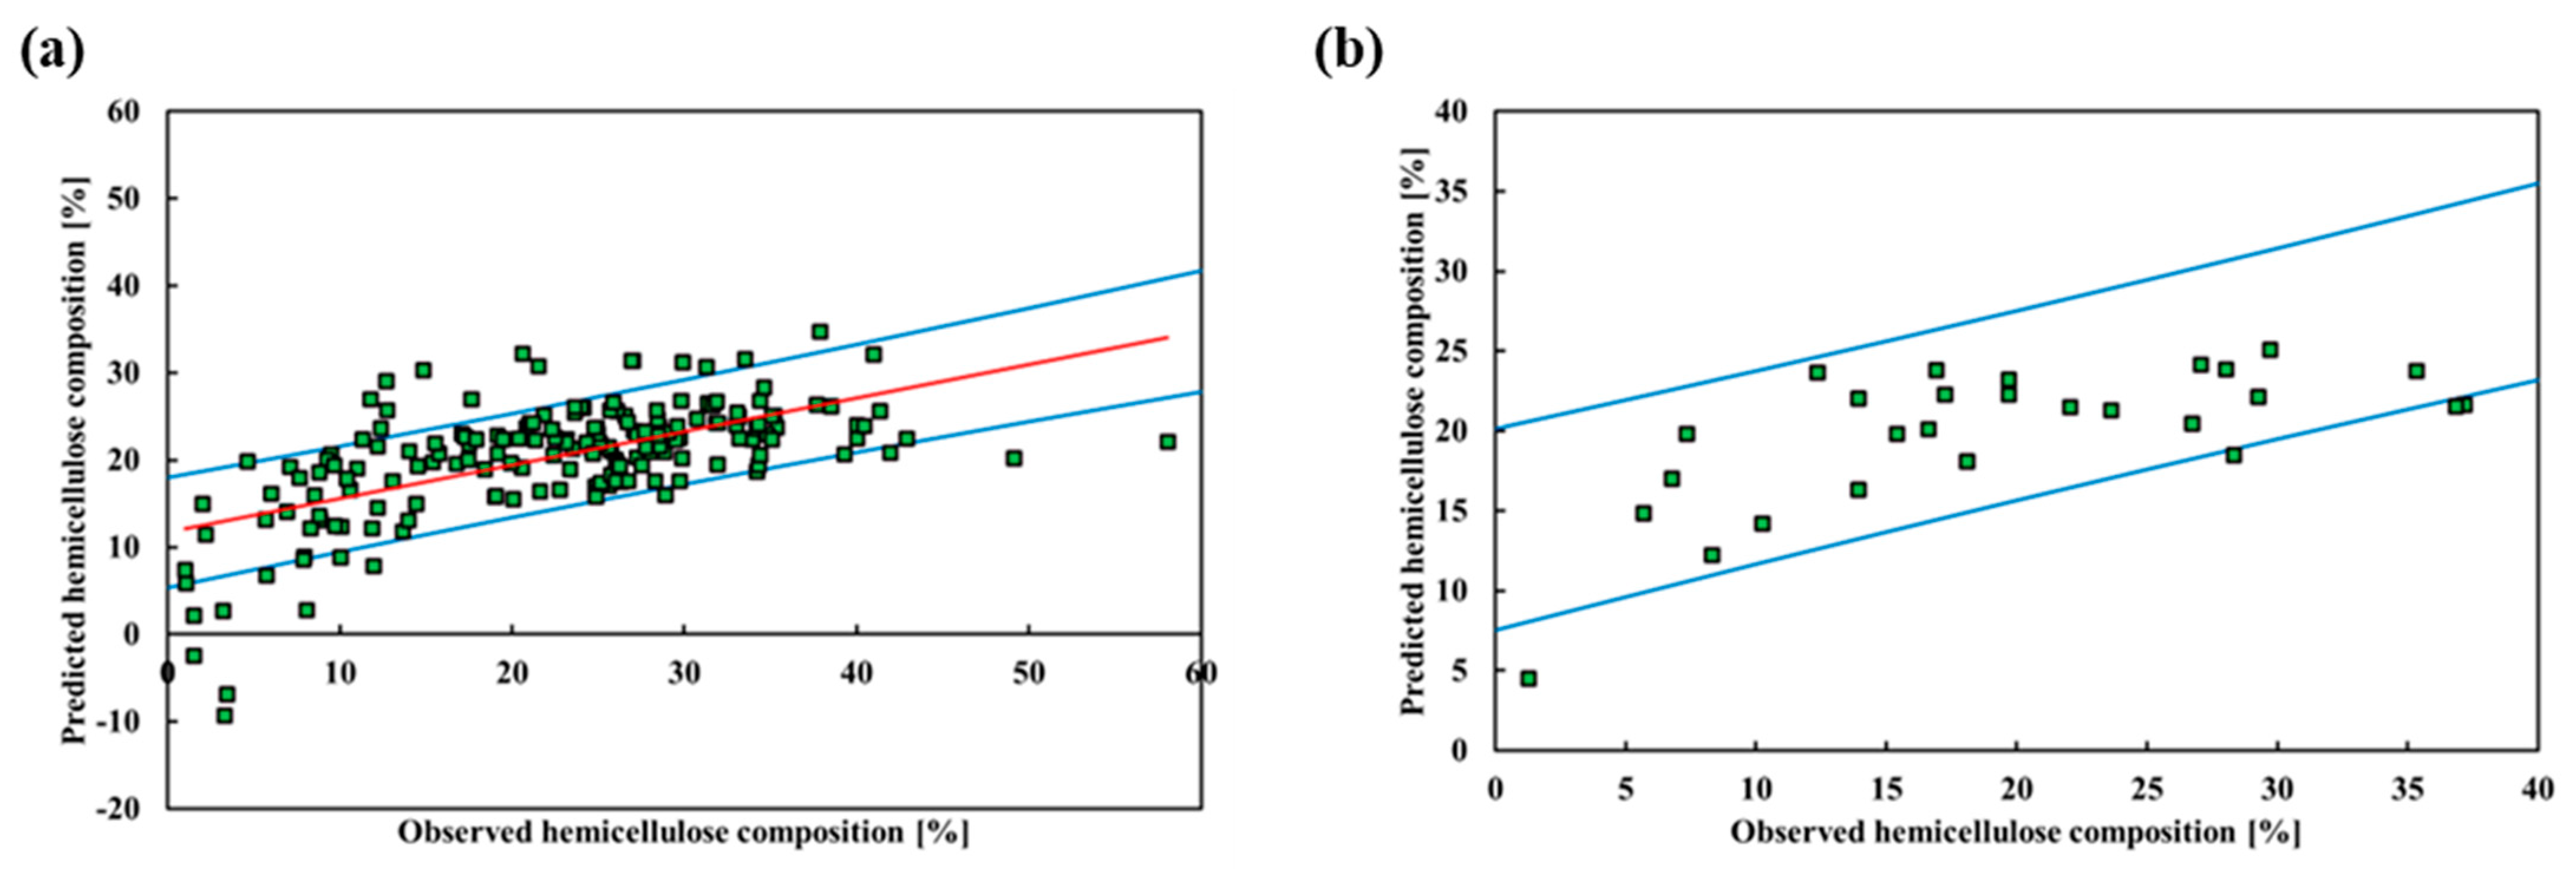
Various factors were added to predict the hemicellulose content. However, the R2P of the model was lower than that of cellulose and lignin. The equations with the highest prediction accuracies are listed in Table 3. When comparing H1 and H2, adding factors related to FC/VM resulted in a higher R2P value than adding the square terms C, H, and O. This suggested that the relationship between hemicellulose and FC/VM has a stronger correlation than that with C, H, and O, based on the Pearson correlation coefficients. The R2P values for H1 and H2 were 0.4901 and 0.4803, respectively, showing no significant differences. However, H1 exhibited a slightly higher trend. Additionally, the MAEP for H2 was lower (5.6556) than that for H1 (6.1396). When comparing H1 and H3, there was a difference when considering the squared terms of C, H, and O. H3 showed a higher R2P (0.5112) than H1, but the RMSEP was higher for H3 (7.7173) compared to H1 (7.4899). However, MAEP and AAEP were lower for H3 (5.7038 and 48.7658, respectively). The results for each prediction equation are presented in Figure 7. The red line represents the trend line, and the blue line is the confidence interval with a 0.01 significance level. The lowest overshoot was observed for H2. For H1 and H2, relatively significant deviations from the trend line were observed in the prediction results, which contributed to the higher RMSE values.

3.4. Prediction Model for Lignin

The optimal lignin contents are listed in Table 4. Lignin exhibited higher R2P values than cellulose and hemicellulose. In the case of L1, the least number of factors was considered. However, the R2P value was 0.7247, which was higher than that observed for cellulose and hemicellulose. L1 and L2 were determined based on whether the second-order VM and FC were considered. L2, which was considered the second-order VM and FC, showed a higher R2P (0.7348). However, the RMSEP, MAEP, and AAEP were lower for L1. L3 exhibited the highest R2P value (0.7914). The RMSEP, MAEP, and AAEP were also lower, with values of 7.9857, 5.9868, and 26.3036, respectively. As shown in Figure 8, which graphically represents the results, L1 and L2 exhibited excessive predictions when the observed values were between 90 and 100%. However, for L3, excessive predictions were not observed, although the confidence interval was exceeded.

3.5. Cross-Validation Results for Cellulose

The cross-validation results for the cellulose prediction are presented in Table 5 and Figure 9. R2CV was higher than R2P. The R2P values for C1, C2, and C3 were 0.6104, 0.6342, and 0.6362, respectively. The R2CV values were 0.7837, 0.7428, and 0.7387, respectively. In particular, C1, which had the lowest R2P value, also had the highest R2CV value. The RMSECV for C1 is 3.8149. Based on the validation results, C1 was identified as the optimal prediction equation.

3.6. Cross-Validation Results for Hemicellulose

The cross-validation results for hemicellulose prediction showed lower performance than that of the prediction model. The results are summarized in Table 6. The R2P values for H1, H2, and H3 were approximately 0.5, with values of 0.4901, 0.4803, and 0.5112, respectively. However, the R2CV values were lower at 0.3292, 0.4004, and 0.3280 for H1, H2, and H3, respectively. This low performance was also reflected in the RMSECV values, which ranged from 8.2683 to 9.8534. The validation results are illustrated in Figure 10, which shows that they fall within the 99% confidence interval. In Figure 10a,b, the results are skewed towards the upper end of the confidence interval. Thus, H2 was selected as the optimal concentration.

3.7. Cross-Validation Results for Lignin

Similar to R2P, lignin exhibited a higher R2CV compared to cellulose and hemicellulose. The results are summarized in Table 7 and Figure 11. The R2P values for L1, L2, and L3 were 0.7247, 0.7348, and 0.7914, respectively, The corresponding R2CV values are 0.7728, 0.7757, and 0.7427, respectively. The R2CV for L3 was lower than its R2P but increased in L1 and L2. The RMSECV values ranged from 7.2735 to 7.7483. Based on the validation results, L2 was considered optimal.

3.8. Prediction and Cross-Validation of Hemicellulose Using Cellulose and Lignin

Based on the relatively stronger correlation between lignin and cellulose than with hemicellulose, the decision was made to predict hemicellulose content based on lignin and cellulose using the selected optimal conditions of C1 and L2. The results are summarized in Table 8 and Figure 12. The prediction results showed an R2P value of 0.3770, which was lower than that of the hemicellulose prediction for H1, H2, and H3. Consequently, the RMSEP, MAEP, and AAEP were higher, with values of 8.5612, 6.7581, and 50.3295, respectively, compared with the results of the previous prediction equations. In Figure 12a, there were cases where the hemicellulose contents were negative, which was attributed to the overprediction of the cellulose and lignin contents. The CV results differed from the predicted results. The R2CV showed a higher value (0.4292) than the R2CV of the other prediction equations. Similarly, the RMSECV was lower (7.5979) when C1 and L2 were used for prediction compared to H1, H2, and H3, which had values ranging from 8.2683 to 9.8534. Based on these results, it was determined that using H2 or predicting hemicellulose based on cellulose and lignin yielded optimal predictions.

3.9. Application Performance

To thoroughly assess the performance of the developed models, the models are utilized to make predictions on the chemical constituents of the application database. It is important to note that all the samples in this database are different from those present in the training database. Since the mass fraction of volatile matter is provided in the application database, it is possible to directly compare the currently developed model with the previous correlation proposed by Sheng and Azevedo [70]. These correlations can be expressed using the following equations:
C e l l u l o s e = 1019.07 + 293.810 ( O C ) 187.639 ( O C ) 2 + 65.1426 ( H C ) 19.3025 ( H C ) 2 + 21.7448 V M 0.132123 V M 2
l i g n i n = 612.099 + 195.366 ( O C ) 156.535 ( O C ) 2 + 511.357 ( H C ) 177.025 ( H C ) 2 + 21.7448 V M + 0.145306 V M 2  
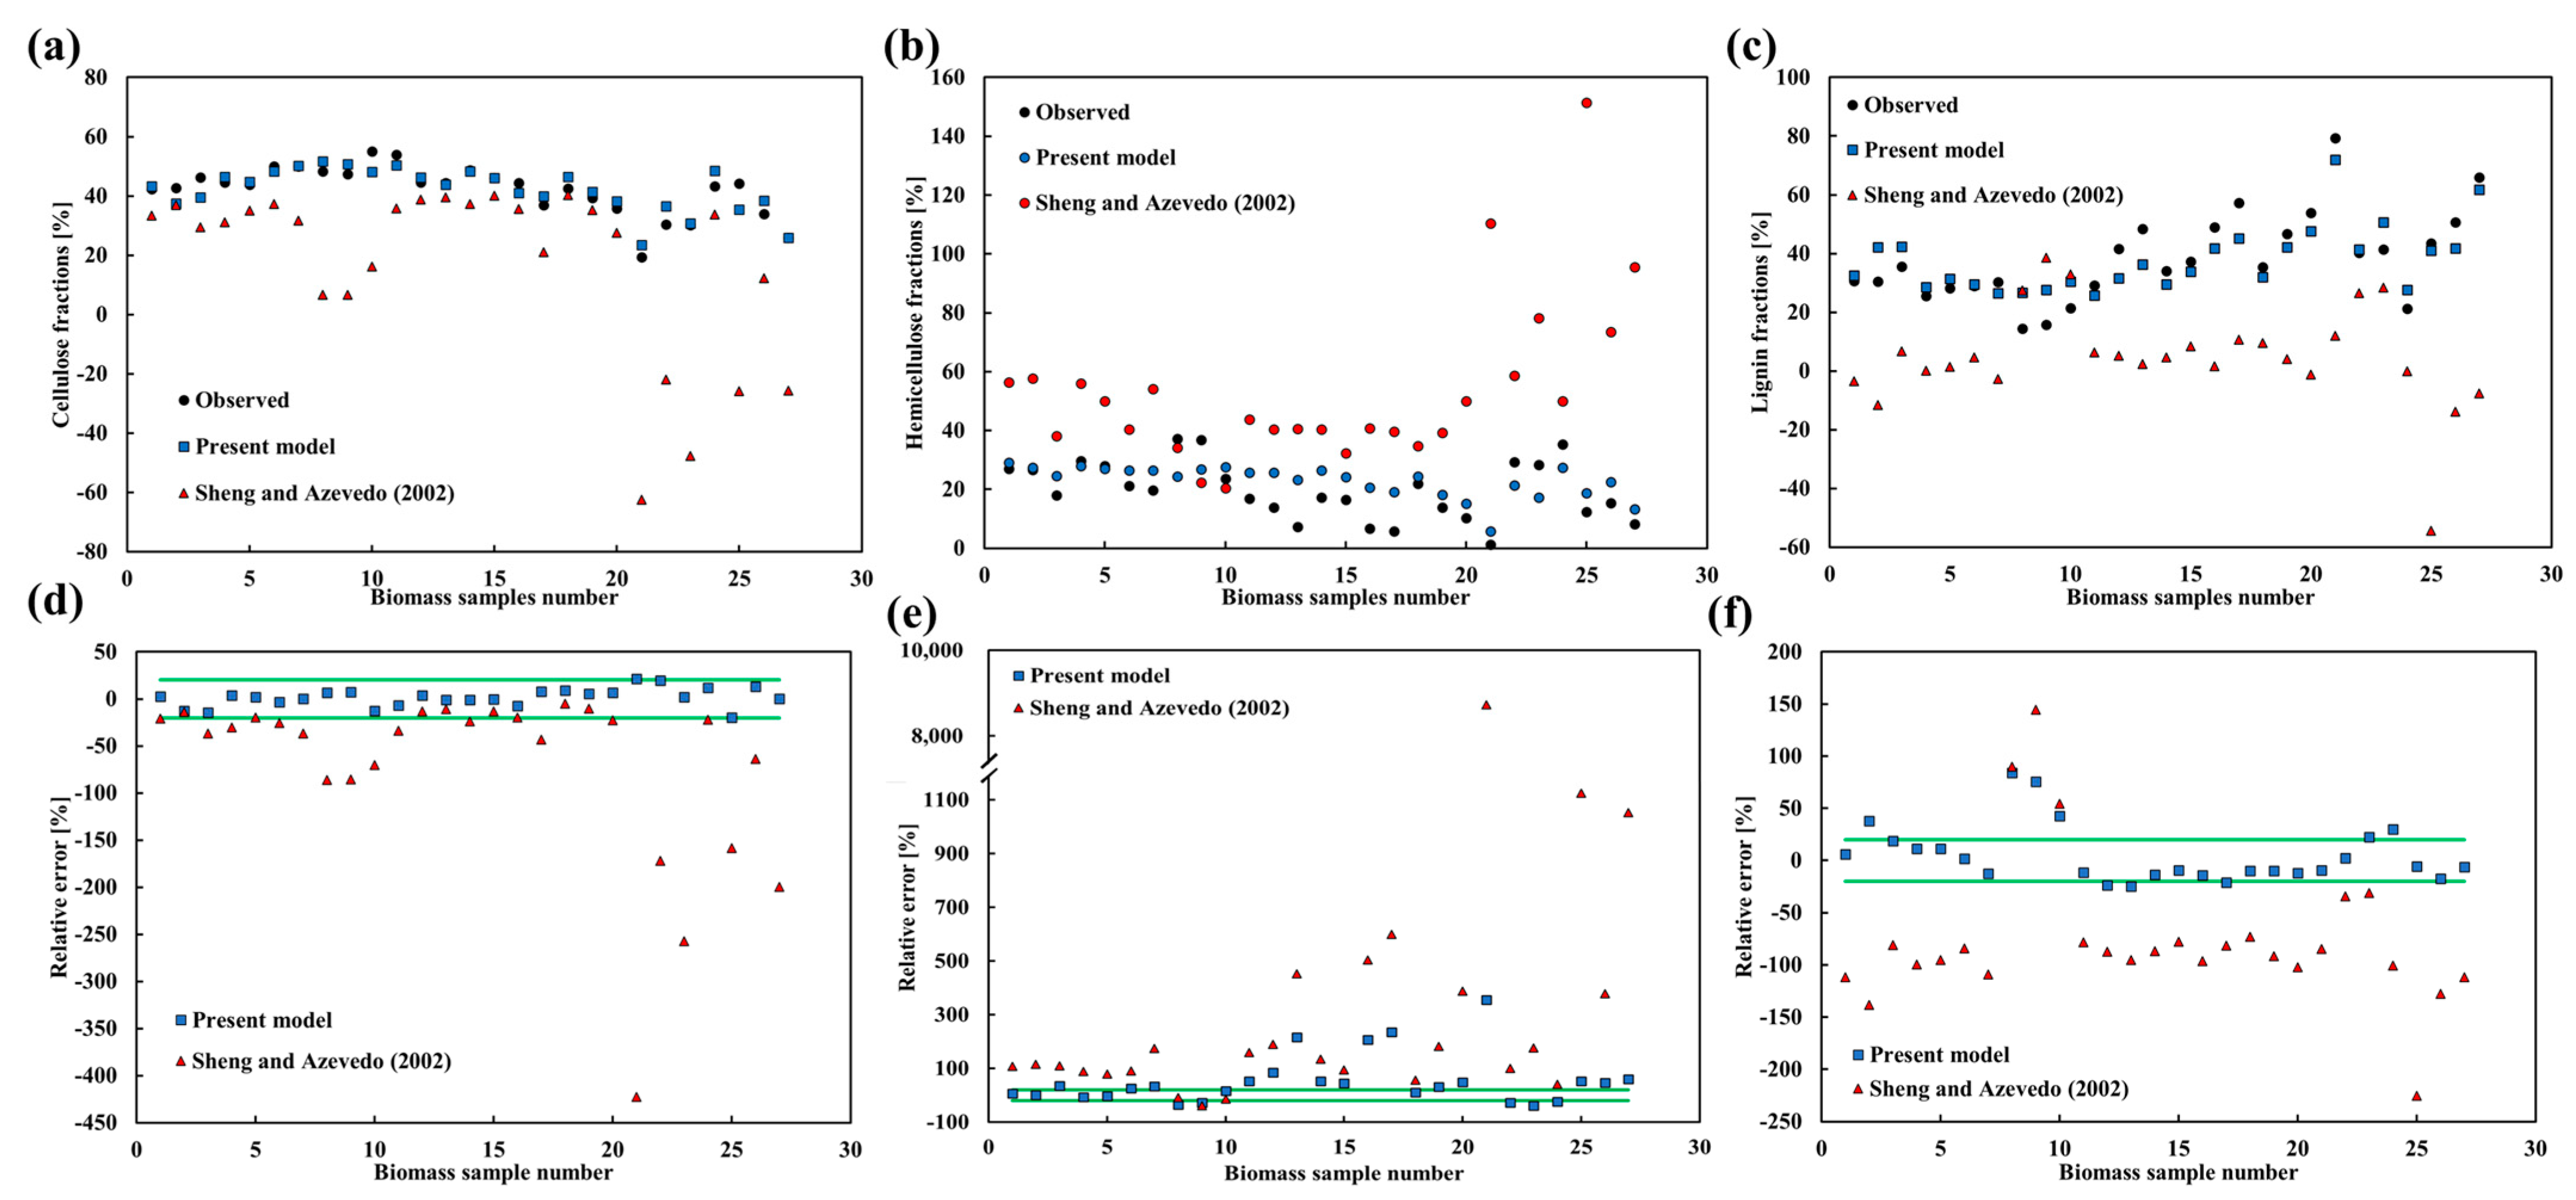
According to Sheng and Azevedo (2002), the correlation they developed was based on samples with the following ranges of parameters: O/C ratio: 0.56 to 0.83, H/C ratio: 1.26 to 1.69, and volatile matter (VM): 73% to 86%. These ranges were used to establish the correlation between the mass fraction of the volatile matter and other chemical constituents in their model. Figure 13 shows the direct comparison of the chemical composition predicted with the present model and the correlation developed by Sheng and Azevedo. Figure 13 also illustrates the direct comparisons of the chemical composition predicted using the current model, the previous correlation proposed by Sheng and Azevedo, and the experimental data. In the figure, the green lines represent the data distribution, where the relative error is ±20%. This provided a visual representation of the agreement between the predicted values and the experimental data for each model. In the case of Sheng and Azevedo’s model, the prediction performance for torrefied samples was low. Values in the ranges of −422.80–−5.20%, −225.21–144.62%, and −39.32–8731.05% were obtained for cellulose, hemicellulose, and lignin, respectively. The models in this study showed −19.96–21.59%, −24.77–84.08%, and −39.23–355.61%, respectively.

4. Conclusions

This study aimed to predict the cellulose, hemicellulose, and lignin contents based on elemental and industrial analyses, instead of using conventional methods such as HPLC or infrared spectroscopy. Herein, various models were proposed to obtain regression prediction equations using linear regression. The R2P values for cellulose, hemicellulose, and lignin using linear regression were between 0.6104 and 0.6362, 0.4803 and 0.5112, and 0.7247 and 0.7914, respectively. Prediction for hemicellulose exhibited the lowest performance. Based on this, the optimal equation was used for cross-validating the same. The optimal conditions for cellulose and lignin were selected as C1 and L2 due to their highest R2CV and lowest RMSECV, MAECV, and AAECV. To address the low accuracy of the hemicellulose prediction model, it was predicted based on the cellulose and lignin prediction models, which were validated as optimal. Despite the lower R2 and higher RMSE values compared to those of the hemicellulose prediction equations, the cross-validation results were higher than those of the other prediction equations. Despite the lower performance in terms of R2 and higher RMSE compared to those of lignin and cellulose, the prediction and cross-validation results were deemed optimal when both prediction and cross-validation results were considered. Therefore, using both cellulose and lignin for the prediction and the H2 equation was deemed to be the optimal approach.
This study had some limitations. Although we considered data from a wide range of samples, including torrefied samples, predictions were only made using data for woody and herbaceous biomasses. Therefore, the predictions may be inaccurate for food waste or sewage sludge. In the case of hemicellulose, low prediction accuracy was observed due to its low content compared to cellulose and lignin. In addition, it was shown to represent a low prediction due to a decrease in various ranges, depending on the process conditions. Therefore, future research should provide models for a wider range of biomasses and improve prediction equations based on more data pertaining to woody and herbaceous biomass.

Supplementary Materials

The following supporting information can be downloaded at: https://www.mdpi.com/article/10.3390/en16145341/s1, Table S1: Data for model prediction. Reference [70] is cited in supplementary materals.

Author Contributions

Conceptualization, S.Y.P., S.J.K., K.C.O. and D.K.; methodology, S.Y.P. and K.C.O.; validation, S.Y.P. and K.C.O.; investigation, S.Y.P., K.C.O., Y.K.J. and L.H.C.; formal analysis, S.Y.P., S.J.K. and K.C.O.; writing—original draft, S.Y.P. and D.K.; writing—review and editing, S.Y.P., K.C.O. and D.K.; data curation, S.Y.P. and K.C.O.; writing—review and editing, D.K.; supervision, D.K. All authors have read and agreed to the published version of the manuscript.

Funding

This study was conducted with the support of the R&D Program for Forest Science Technology (Project No. “FTIS 2021352B10-2223-AC03”) provided by the Korea Forest Service (Korea Forestry Promotion Institute) and supported by the Korea Institute of Planning and Evaluation for Technology in Food, Agriculture and Forestry (IPET) through the Agriculture, Food and Rural Affairs Convergence Technologies Program for Educating Creative Global Leader, funded by the Ministry of Agriculture, Food and Rural Affairs (MAFRA) (Project No. 320001-4), Republic of Korea.

Data Availability Statement

The data used to support the findings of this study are included within the article.

Conflicts of Interest

The authors declare no conflict of interest.

References

  1. O’sullivan, A.C. Cellulose: The Structure Slowly Unravels. Cellulose 1997, 4, 173–207. [Google Scholar] [CrossRef]
  2. Rao, J.; Lv, Z.; Chen, G.; Peng, F. Hemicellulose: Structure, Chemical Modification, and Application. Prog. Polym. Sci. 2023, 140, 101675. [Google Scholar] [CrossRef]
  3. Li, M.; Pu, Y.; Ragauskas, A.J. Current Understanding of the Correlation of Lignin Structure with Biomass Recalcitrance. Front. Chem. 2016, 4, 45. [Google Scholar] [CrossRef] [PubMed] [Green Version]
  4. Smoot, L.D.; Baxter, L.L. Fossil Fuel Power Stations—Coal Utilization. In Encyclopedia of Physical Science and Technology, 3rd ed.; Meyers, R.A., Ed.; Academic Press: New York, NY, USA, 2003; pp. 121–144. ISBN 9780122274107. [Google Scholar]
  5. Basu, P. Chapter 13—Analytical Techniques. In Biomass Gasification, Pyrolysis and Torrefaction: Practical Design and Theory; Basu, P., Ed.; Biomass Gasification, Pyrolysis and Torrefaction (Second Edition); Academic Press: Boston, MA, USA, 2013; pp. 439–455. ISBN 9780123964885. [Google Scholar]
  6. Ozbayoglu, G. 3.19 Energy Production From Coal. In Comprehensive Energy Systems; Dincer, I., Ed.; Elsevier: Oxford, UK, 2018; pp. 788–821. ISBN 9780128149256. [Google Scholar]
  7. Qu, T.; Guo, W.; Shen, L.; Xiao, J.; Zhao, K. Experimental Study of Biomass Pyrolysis Based on Three Major Components: Hemicellulose, Cellulose, and Lignin. Ind. Eng. Chem. Res. 2011, 50, 10424–10433. [Google Scholar] [CrossRef]
  8. Zhao, C.; Jiang, E.; Chen, A. Volatile Production from Pyrolysis of Cellulose, Hemicellulose and Lignin. J. Energy Inst. 2017, 90, 902–913. [Google Scholar] [CrossRef]
  9. Kim, D.; Lee, K.; Park, K.Y. Upgrading the Characteristics of Biochar from Cellulose, Lignin, and Xylan for Solid Biofuel Production from Biomass by Hydrothermal Carbonization. J. Ind. Eng. Chem. 2016, 42, 95–100. [Google Scholar] [CrossRef]
  10. Technical Association of the Pulp and Paper Industry (TAPPI). Solvent Extractives of Wood and Pulp, Test Method T 204 Cm-97. 2007. Available online: https://www.astm.org/d1106-96r01.html (accessed on 1 July 2023).
  11. Technical Association of the Pulp and Paper Industry (TAPPI). Standard Test Method for Acid-Insoluble Lignin in Wood. 2007. [Google Scholar]
  12. Technical Association of the Pulp and Paper Industry (TAPPI). Alpha-, Beta- and Gamma-Cellulose in Pulp, Test Method T 203 Cm-22. 1999. Available online: https://imisrise.tappi.org/TAPPI/Products/01/T/0104T203.aspx (accessed on 1 July 2023).
  13. Sluiter, A.; Ruiz, R.; Scarlata, C.; Sluiter, J.; Templeton, D. Determination of Extractives in Biomass: Laboratory Analytical Procedure (LAP); National Renewable Energy Laboratory: Golden, CO, USA, 2008. [Google Scholar]
  14. Sluiter, A.; Hames, B.; Ruiz, R.; Scarlata, C.; Sluiter, J.; Templeton, D. Determination of Ash in Biomass: Laboratory Analytical Procedure (LAP); National Renewable Energy Laboratory: Golden, CO, USA, 2008. [Google Scholar]
  15. Sluiter, A.; Hames, B.; Ruiz, R.; Scarlata, C.; Sluiter, J.; Templeton, D.; Crocker, D. Determination of Structural Carbohydrates and Lignin in Biomass: Laboratory Analytical Procedure (LAP); National Renewable Energy Laboratory: Golden, CO, USA, 2008. [Google Scholar]
  16. Sheng, C.; Azevedo, J.L.T. Modeling Biomass Devolatilization Using the Chemical Percolation Devolatilization Model for the Main Components. Proc. Combust. Inst. 2002, 29, 407–414. [Google Scholar] [CrossRef]
  17. Burhenne, L.; Messmer, J.; Aicher, T.; Laborie, M.P. The Effect of the Biomass Components Lignin, Cellulose and Hemicellulose on TGA and Fixed Bed Pyrolysis. J. Anal. Appl. Pyrolysis 2013, 101, 177–184. [Google Scholar] [CrossRef]
  18. Díez, D.; Urueña, A.; Piñero, R.; Barrio, A.; Tamminen, T. Determination of Hemicellulose, Cellulose, and Lignin Content in Different Types of Biomasses by Thermogravimetric Analysis and Pseudocomponent Kinetic Model (TGA-PKM Method). Processes 2020, 8, 1048. [Google Scholar] [CrossRef]
  19. Xing, J.; Luo, K.; Wang, H.; Fan, J. Estimating Biomass Major Chemical Constituents from Ultimate Analysis Using a Random Forest Model. Bioresour. Technol. 2019, 288, 121541. [Google Scholar] [CrossRef]
  20. Peng, J.; Bi, X.T.; Lim, J.; Sokhansanj, S. Development of Torrefaction Kinetics for British Columbia Softwoods. Int. J. Chem. React. Eng. 2012, 10, 1–40. [Google Scholar] [CrossRef]
  21. Chen, W.H.; Kuo, P.C. A Study on Torrefaction of Various Biomass Materials and Its Impact on Lignocellulosic Structure Simulated by a Thermogravimetry. Energy 2010, 35, 2580–2586. [Google Scholar] [CrossRef]
  22. Rousset, P.; Aguiar, C.; Labbé, N.; Commandré, J.M. Enhancing the Combustible Properties of Bamboo by Torrefaction. Bioresour. Technol. 2011, 102, 8225–8231. [Google Scholar] [CrossRef]
  23. Granados, D.A.; Ruiz, R.A.; Vega, L.Y.; Chejne, F. Study of Reactivity Reduction in Sugarcane Bagasse as Consequence of a Torrefaction Process. Energy 2017, 139, 818–827. [Google Scholar] [CrossRef]
  24. Cahyanti, M.N.; Doddapaneni, T.R.K.C.; Madissoo, M.; Pärn, L.; Virro, I.; Kikas, T. Torrefaction of Agricultural and Wood Waste: Comparative Analysis of Selected Fuel Characteristics. Energies 2021, 14, 2774. [Google Scholar] [CrossRef]
  25. Chen, W.H.; Hsu, H.C.; Lu, K.M.; Lee, W.J.; Lin, T.C. Thermal Pretreatment of Wood (Lauan) Block by Torrefaction and Its Influence on the Properties of the Biomass. Energy 2011, 36, 3012–3021. [Google Scholar] [CrossRef]
  26. Chen, W.H.; Cheng, W.Y.; Lu, K.M.; Huang, Y.P. An Evaluation on Improvement of Pulverized Biomass Property for Solid Fuel through Torrefaction. Appl. Energy 2011, 88, 3636–3644. [Google Scholar] [CrossRef]
  27. Ma, Z.; Zhang, Y.; Shen, Y.; Wang, J.; Yang, Y.; Zhang, W.; Wang, S. Oxygen Migration Characteristics during Bamboo Torrefaction Process Based on the Properties of Torrefied Solid, Gaseous, and Liquid Products. Biomas. Bioenergy 2019, 128, 105300. [Google Scholar] [CrossRef]
  28. Kanwal, S.; Chaudhry, N.; Munir, S.; Sana, H. Effect of Torrefaction Conditions on the Physicochemical Characterization of Agricultural Waste (Sugarcane Bagasse). Waste Manag. 2019, 88, 280–290. [Google Scholar] [CrossRef]
  29. Jiang, H.; Ye, Y.; Lu, P.; Zhao, M.; Xu, G.; Chen, D.; Song, T. Effects of Torrefaction Conditions on the Hygroscopicity of Biochars. J. Energy Inst. 2021, 96, 260–268. [Google Scholar] [CrossRef]
  30. Li, M.F.; Chen, C.Z.; Li, X.; Shen, Y.; Bian, J.; Sun, R.C. Torrefaction of Bamboo under Nitrogen Atmosphere: Influence of Temperature and Time on the Structure and Properties of the Solid Product. Fuel 2015, 161, 193–196. [Google Scholar] [CrossRef]
  31. Rodriguez Alonso, E.; Dupont, C.; Heux, L.; Da Silva Perez, D.; Commandre, J.M.; Gourdon, C. Study of Solid Chemical Evolution in Torrefaction of Different Biomasses through Solid-State 13C Cross-Polarization/Magic Angle Spinning NMR (Nuclear Magnetic Resonance) and TGA (Thermogravimetric Analysis). Energy 2016, 97, 381–390. [Google Scholar] [CrossRef]
  32. Saffe, A.; Fernandez, A.; Mazza, G.; Rodriguez, R. Prediction of Regional Agro-Industrial Wastes Characteristics by Thermogravimetric Analysis to Obtain Bioenergy Using Thermal Process. Energy Explor. Exploit. 2019, 37, 544–557. [Google Scholar] [CrossRef] [Green Version]
  33. Zhou, H.; Long, Y.; Meng, A.; Li, Q.; Zhang, Y. The Pyrolysis Simulation of Five Biomass Species by Hemi-Cellulose, Cellulose and Lignin Based on Thermogravimetric Curves. Thermochim. Acta 2013, 566, 36–43. [Google Scholar] [CrossRef]
  34. Wang, H.; Wang, X.; Cui, Y.; Xue, Z.; Ba, Y. Slow Pyrolysis Polygeneration of Bamboo (Phyllostachys Pubescens): Product Yield Prediction and Biochar Formation Mechanism. Bioresour. Technol. 2018, 263, 444–449. [Google Scholar] [CrossRef]
  35. Naik, S.; Goud, V.V.; Rout, P.K.; Jacobson, K.; Dalai, A.K. Characterization of Canadian Biomass for Alternative Renewable Biofuel. Renew Energy 2010, 35, 1624–1631. [Google Scholar] [CrossRef]
  36. Wang, S.; Zou, C.; Yang, H.; Lou, C.; Cheng, S.; Peng, C.; Wang, C.; Zou, H. Effects of Cellulose, Hemicellulose, and Lignin on the Combustion Behaviours of Biomass under Various Oxygen Concentrations. Bioresour. Technol. 2021, 320, 124375. [Google Scholar] [CrossRef]
  37. Pasangulapati, V.; Ramachandriya, K.D.; Kumar, A.; Wilkins, M.R.; Jones, C.L.; Huhnke, R.L. Effects of Cellulose, Hemicellulose and Lignin on Thermochemical Conversion Characteristics of the Selected Biomass. Bioresour. Technol. 2012, 114, 663–669. [Google Scholar] [CrossRef]
  38. Sengupta, D.; Pike, R.W. Chemicals from Biomass: Integrating Bioprocesses into Chemical Production Complexes for Sustainable Development; CRC Press: Boca Raton, FL, USA, 2012. [Google Scholar]
  39. Krerkkaiwan, S.; Buranatrevedhya, S.; Sanduang, J.; Fukuda, S. Combustion Characteristics and Fouling Tendency of Co-Combustion between Sub-Bituminous Coal and Thai Biomass. In Proceedings of the Combustion Charazcteristics and Fouling Tendency of Co-Combustion between Sub-Bituminous Coal and Thai Biomass, 9th i-CIPEC, Kyoto, Japan, 21–23 September 2016. [Google Scholar]
  40. Raj, T.; Kapoor, M.; Gaur, R.; Christopher, J.; Lamba, B.; Tuli, D.K.; Kumar, R. Physical and Chemical Characterization of Various Indian Agriculture Residues for Biofuels Production. Energy Fuels 2015, 29, 3111–3118. [Google Scholar] [CrossRef]
  41. Dhyani, V.; Bhaskar, T. A Comprehensive Review on the Pyrolysis of Lignocellulosic Biomass. Renew Energy 2018, 129, 695–716. [Google Scholar] [CrossRef]
  42. Mohammed, I.Y.; Abakr, Y.A.; Kazi, F.K.; Yusup, S.; Alshareef, I.; Chin, S.A. Comprehensive Characterization of Napier Grass as a Feedstock for Thermochemical Conversion. Energies 2015, 8, 3403–3417. [Google Scholar] [CrossRef] [Green Version]
  43. Singh, Y.D.; Mahanta, P.; Bora, U. Comprehensive Characterization of Lignocellulosic Biomass through Proximate, Ultimate and Compositional Analysis for Bioenergy Production. Renew Energy 2017, 103, 490–500. [Google Scholar] [CrossRef]
  44. Wannapeera, J.; Worasuwannarak, N.; Pipatmanomai, S. Product Yields and Characteristics of Rice Husk, Rice Straw and Corncob during Fast Pyrolysis in a Drop-Tube/Fixed-Bed Reactor. Songklanakarin J. Sci. Technol. 2007, 30, 393–404. [Google Scholar]
  45. Nanda, S. Conversion of Lignocellulosic Feedstocks to Renewable Fuels; York University: Toronto, ON, Canada, 2013. [Google Scholar]
  46. Hernandez-Mena, L.E.; Pecora, A.A.B.; Beraldo, A.L. Slow Pyrolysis of Bamboo Biomass: Analysis of Biochar Properties. Chem. Eng. Trans. 2014, 37, 115–120. [Google Scholar] [CrossRef]
  47. Greenhalf, C.E.; Nowakowski, D.J.; Bridgwater, A.V.; Titiloye, J.; Yates, N.; Riche, A.; Shield, I. Thermochemical Characterisation of Straws and High Yielding Perennial Grasses. Ind. Crops Prod. 2012, 36, 449–459. [Google Scholar] [CrossRef]
  48. Halder, P.; Kundu, S.; Patel, S.; Parthasarathy, R.; Pramanik, B.; Paz-Ferreiro, J.; Shah, K. TGA-FTIR Study on the Slow Pyrolysis of Lignin and Cellulose-Rich Fractions Derived from Imidazolium-Based Ionic Liquid Pre-Treatment of Sugarcane Straw. Energy Convers. Manag. 2019, 200, 112067. [Google Scholar] [CrossRef]
  49. Guida, M.Y.; Lanaya, S.; Rbihi, Z.; Hannioui, A. Thermal Degradation Behaviors of Sawdust Wood Waste: Pyrolysis Kinetic and Mechanism. J. Mater. Environ. Sci. 2019, 10, 742–755. [Google Scholar]
  50. Rahardjo, B.S. Effect of gasifiyng agent (air+steam) injection towards syngas quality from rice husk gasification. Int. J. Eng. 2013, 4, 8269. [Google Scholar]
  51. Aydinli, B.; Caglar, A. The Catalytic Effects of Potassium Dichromate on the Pyrolysis of Polymeric Mixtures Part II: Hazelnut Shell and Ultra-High Molecular Weight Polyethylene and Their Blend Cases. World Acad. Sci. Eng. Technol. Int. J. Mater. Metall. Eng. 2010, 4, 462–466. [Google Scholar]
  52. Villegas, J.M.; Avila, H. Quick-Scan Estimating Model of Higher Heating Value of Oil Palm Empty Fruit Bunches Based on Ash from Proximate Analysis Data. Ing. Investig. 2014, 34, 33–38. [Google Scholar] [CrossRef]
  53. Camacho, Y.M.; Bensaid, S.; Ruggeri, B.; Restuccia, L.; Ferro, G.; Mancini, G.; Fino, D. Valorisation of By-Products/Waste of Agro-Food Industry by the Pyrolysis Process. J. Adv. Catal. Sci. Technol. 2016, 3, 1–11. [Google Scholar]
  54. Guida, M.Y.; Hannioui, A. Properties of Bio-Oil and Bio-Char Produced by Sugar Cane Bagasse Pyrolysis in a Stainless Steel Tubular Reactor. Prog. Agric. Eng. Sci. 2017, 13, 13–33. [Google Scholar] [CrossRef]
  55. Lyu, G.; Wu, S.; Zhang, H. Estimation and Comparison of Bio-Oil Components from Different Pyrolysis Conditions. Front. Energy Res. 2015, 3, 28. [Google Scholar] [CrossRef] [Green Version]
  56. Ramos-Carmona, S.; Martínez, J.D.; Pérez, J.F. Torrefaction of Patula Pine under Air Conditions: A Chemical and Structural Characterization. Ind. Crops Prod. 2018, 118, 302–310. [Google Scholar] [CrossRef]
  57. Park, S.; Kim, S.J.; Oh, K.C.; Cho, L.H.; Kim, D.H. Developing a Proximate Component Prediction Model of Biomass Based on Element Analysis. Energies 2023, 16, 509. [Google Scholar] [CrossRef]
  58. Majumder, A.K.; Jain, R.; Banerjee, P.; Barnwal, J.P. Development of a New Proximate Analysis Based Correlation to Predict Calorific Value of Coal. Fuel 2008, 87, 3077–3081. [Google Scholar] [CrossRef]
  59. Elmaz, F.; Yücel, Ö.; Mutlu, A.Y. Makine Öğrenmesi Ile Kısa ve Elemental Analiz Kullanarak Katı Yakıtların Üst Isı Değerinin Tahmin Edilmesi. Int. J. Adv. Eng. Pure Sci. 2020, 32, 145–151. [Google Scholar] [CrossRef]
  60. Zhang, T.; Zhang, Q.; Wang, Q. Model Detection for Functional Polynomial Regression. Comput. Stat. Data Anal. 2014, 70, 183–197. [Google Scholar] [CrossRef]
  61. Gendy, T.S.; El-Shiekh, T.M.; Zakhary, A.S. A Polynomial Regression Model for Stabilized Turbulent Confined Jet Diffusion Flames Using Bluff Body Burners. Egypt. J. Pet. 2015, 24, 445–453. [Google Scholar] [CrossRef] [Green Version]
  62. Ivanovski, M.; Goricanec, D.; Krope, J.; Urbancl, D. Torrefaction Pretreatment of Lignocellulosic Biomass for Sustainable Solid Biofuel Production. Energy 2022, 240, 122483. [Google Scholar] [CrossRef]
  63. Feng, Y.; Qiu, K.; Zhang, Z.; Li, C.; Rahman, M.M.; Cai, J. Distributed Activation Energy Model for Lignocellulosic Biomass Torrefaction Kinetics with Combined Heating Program. Energy 2022, 239, 122228. [Google Scholar] [CrossRef]
  64. Zhang, Z.; Duan, H.; Zhang, Y.; Guo, X.; Yu, X.; Zhang, X.; Rahman, M.M.; Cai, J. Investigation of Kinetic Compensation Effect in Lignocellulosic Biomass Torrefaction: Kinetic and Thermodynamic Analyses. Energy 2020, 207, 118290. [Google Scholar] [CrossRef]
  65. Garba, M.U.; Gambo, S.U.; Musa, U.; Tauheed, K.; Alhassan, M.; Adeniyi, O.D. Impact of Torrefaction on Fuel Property of Tropical Biomass Feedstocks. Biofuels 2018, 9, 369–377. [Google Scholar] [CrossRef]
  66. Phanphanich, M.; Mani, S. Impact of Torrefaction on the Grindability and Fuel Characteristics of Forest Biomass. Bioresour. Technol. 2011, 102, 1246–1253. [Google Scholar] [CrossRef]
  67. Meng, J.; Park, J.; Tilotta, D.; Park, S. The Effect of Torrefaction on the Chemistry of Fast-Pyrolysis Bio-Oil. Bioresour. Technol. 2012, 111, 439–446. [Google Scholar] [CrossRef]
  68. Chan, Y.H.; Yusup, S.; Quitain, A.T.; Uemura, Y.; Sasaki, M. Bio-Oil Production from Oil Palm Biomass via Subcritical and Supercritical Hydrothermal Liquefaction. J. Supercrit. Fluids 2014, 95, 407–412. [Google Scholar] [CrossRef]
  69. Manatura, K. Inert Torrefaction of Sugarcane Bagasse to Improve Its Fuel Properties. Case Stud. Therm. Eng. 2020, 19, 100623. [Google Scholar] [CrossRef]
  70. Yang, W.; Shimanouchi, T.; Iwamura, M.; Takahashi, Y.; Mano, R.; Takashima, K.; Tanifuji, T.; Kimura, Y. Elevating the Fuel Properties of Humulus Lupulus, Plumeria Alba and Calophyllum inophyllum L. through Wet Torrefaction. Fuel 2015, 146, 88–94. [Google Scholar] [CrossRef]
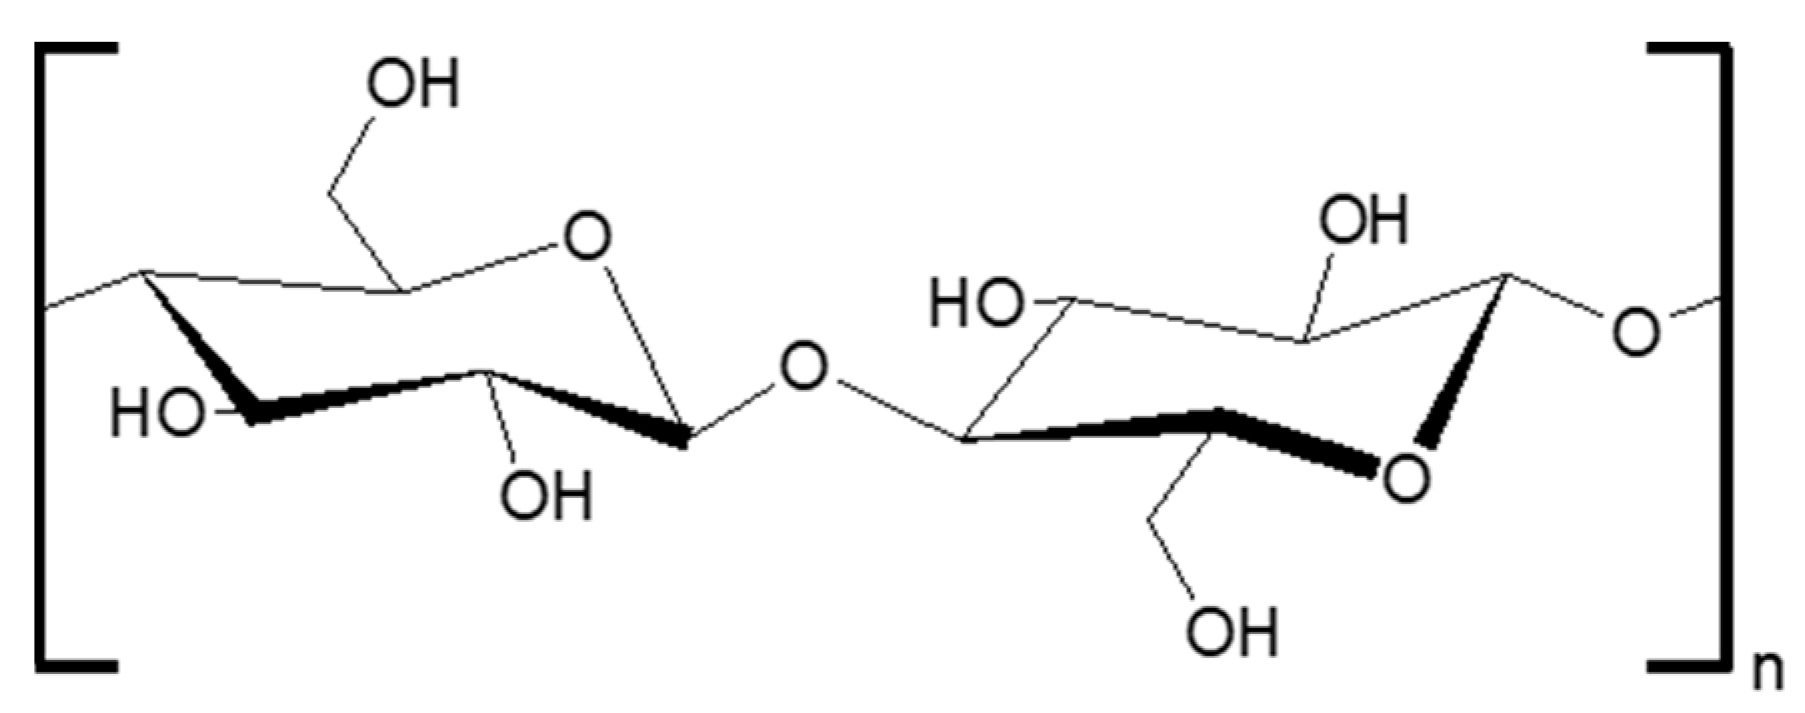
Figure 1. Structure of cellulose.
Energies 16 05341 g001
Figure 2. Structure of hemicellulose consisting of a xylopyranose backbone with glucuronic acid (1→2) and arabinofuranose (1→3) side branch.
Energies 16 05341 g002
Figure 3. Basic lignin units: (a) p-counmaryl, (b) coniferyl, and (c) sinapyl alcohols.
Energies 16 05341 g003
Figure 4. Distribution of the collected data according to chemical structure. Each square means the biomass composition of hemicellulos, cellulose and lignin.
Energies 16 05341 g004
Figure 5. Result of Pearson correlation coefficient.
Energies 16 05341 g005
Figure 6. Prediction results plotted using linear regression for cellulose: (a) C1; (b) C2; (c) C3. Green square means predicted and measured cellulose composition of biomass. Blue line means 99% confidence interval and red line means trend line.
Energies 16 05341 g006
Figure 7. Prediction results plotted using linear regression for hemicellulose: (a) H1; (b) H2; (c) H3. Green square means predicted and measured hemicellulose composition of biomass. Blue line means 99% confidence interval and red line means trend line.
Energies 16 05341 g007
Figure 8. Prediction results plotted using linear regression for lignin: (a) L1; (b) L2; (c) L3. Green square means predicted and measured lignin composition of biomass. Blue line means 99% confidence interval and red line means trend line.
Energies 16 05341 g008
Figure 9. Cross-validation results of the predicted model plotted using linear regression for cellulose: (a) C1; (b) C2; (c) C3. Green square means predicted and measured cellulose composition of biomass. Blue line means 99% confidence interval.
Energies 16 05341 g009
Figure 10. Cross-validation results of the predicted model plotted using linear regression and algorithm for hemicellulose: (a) H1; (b) H2; (c) H3. Green square means predicted and measured hemicellulose composition of biomass. Blue line means 99% confidence interval.
Energies 16 05341 g010
Figure 11. Cross-validation results of the predicted model plotted using linear regression and algorithm for lignin: (a) L1; (b) L2; (c) L3. Green square means predicted and measured lignin composition of biomass. Blue line means 99% confidence interval.
Energies 16 05341 g011
Figure 12. Hemicellulose prediction results: (a) cross-validation results; (b) results plotted using C1 and L2. Green square means predicted and measured hemicellulose composition of biomass. Blue line means 99% confidence interval and red line means trend line.
Energies 16 05341 g012
Figure 13. Comparison of the chemical composition predicted using the correlation developed by Sheng and Azevdo and the composition predicted using the present models with the data for the application database: (a) cellulose fractions; (b) hemicellulose fractions; (c) lignin fractions; (d) cellulose relative error; (e) hemicellulose relative error; (f) lignin relative error. Green line indicates relative ±20% [16].
Energies 16 05341 g013
Table 1. Data for cross-validation.
Element AnalysisProximate AnalysisComposition AnalysisRef
CHOVMFCAshCellHemiLig
Mixed waste wood48.085.6945.886.1510.443.4142.2727.0530.68[62]
Torrefied mixed waste wood
(200 °C)
51.765.3442.4783.0310.66.3642.7826.7130.51
Torrefied mixed waste wood
(250 °C)
52.465.5541.4674.2418.826.9446.3218.0735.61
Oak waste wood47.265.9546.4687.312.050.6544.6429.7225.64
Torrefied Oak waste wood
(200 °C)
48.785.8644.9486.5212.620.8643.7728.0128.22
Logging residue47.726.2645.682.1816.071.7549.9421.1228.94[63]
pine wood45.836.3547.5183.116.30.65019.6730.33[64]
Rice husk44.916.9347.2168.5522.958.548.3237.1714.52[65]
Corn cob46.296.6946.6967.6822.2910.0347.3736.8415.79
Groundnut shell47.516.3245.6469.6921.119.255.0623.621.35
Pine chip47.316.6545.8685.9713.760.2754.0116.8929.09[66]
Torrefied pine chip (225 °C)49.616.0944.1584.4214.890.744.5613.9141.53
Torrefied pine chip (250 °C)51.735.8942.2482.5117.240.2544.327.3348.34
Logging residue chip47.726.2645.682.1616.071.7748.7517.2434.01
Torrefied logging
residue chip (225 °C)
50.516.1443.0580.7317.91.3746.1116.5937.30
Torrefied logging
residue chip (250 °C)
53.815.7540.1478.1420.371.4944.376.7548.88
Torrefied logging
residue chip (275 °C)
53.755.4440.571.4326.691.88375.6857.32
Loblolly pine50.786.2942.8484.614.80.642.5222.0335.45[67]
Torrefied loblolly pine
(270 °C 2.5 min)
55.365.9838.5578.620.80.639.2913.9246.79
Torrefied loblolly pine
(300 °C 2.5 min)
57.745.8336.2876.422.80.835.8510.2253.93
Torrefied loblolly pine
(330 °C 2.5 min)
66.774.9428.0159.9638.641.419.331.2579.42
Palm mesocarp fiber46.294.6747.3763.2929.497.2230.4329.2540.32[68]
Palm kernel shell47.774.0647.5559.0734.366.5730.2828.3141.41
Sugarcane bagasse sample46.326.2846.7483.5514.282.1743.3535.3321.32[69]
Torrefied sugarcane bagasse
(200 °C)
41.884.2153.5971.2626.971.7744.1912.3543.46
Torrefied sugarcane bagasse
(225 °C)
47.14.7247.7971.9525.552.4934.0315.3950.58
Torrefied sugarcane bagasse
(250 °C)
52.633.7943.1662.2734.53.2225.828.2965.89
Table 2. Results of predicted model for cellulose.
No.Proposed ModelsR2P
[-]
RMSEP
[%]
MAEP
[%]
AAEP
[%]
C1 C e l l = 152.237 + 0.838 C 10.405 H + 3.3091 O 37.061 ( H C ) 2 +   177.211 ( H C ) + 20.086 ( O C ) 2 136.126 ( O C ) +   0.151 V M + 0.391 F C 4.52   ( F C V M ) 0.61047.36665.683949.2202
C2 C e l l = 678.363 + 0.270 C 2 0.632 H 2 0.166 O 2 34.026 C +   24.548 H + 22.108 O 15.474 ( H C ) 2 10.580 ( H C ) +   94.988 ( O C ) 2 510.643 ( O C ) + 0.250 V M +   0.290 F C 3.866   ( F C V M ) 2 + 10.266   ( F C V M ) 0.63427.30135.430232.7348
C3 C e l l = 810.611 + 0.311 C 2 0.657 H 2 0.165 O 2 39.014 C +   23.282 H + 23.513 O 14.962 ( H C ) 2 4.252 ( H C ) +   104.943 ( O C ) 2 595.105 ( O C ) 0.001 V M 2 +   0.551 V M 0.012 F C 2 + 0.116 F C   12.486   ( F C V M ) 2 + 59.697 ( F C V M ) 0.63627.32635.811543.1320
Table 3. Results of predicted model for hemicellulose.
No.Proposed ModelsR2P
[-]
RMSEP
[%]
MAEP
[%]
AAEP
[%]
H1 H e m i = 398.274 0.118 C 36.749 H + 3.886 O 51.759 ( H C ) 2 +   300.624 ( H C ) + 48.091 ( O C ) 2 286.902 ( O C ) +   0.055 V M 2 0.003 F C 2 9.205 V M + 3.077 F C +   50.49 ( F C V M ) 2 275.401 ( F C V M ) 0.49017.48996.139653.1694
H2 H e m i = 1465.909 + 0.212 C 2 + 0.66 H 2 + 0.101 O 2 33.374 C   49.249 H + 10.983 O 66.583 ( H C ) 2 +   363.635 ( H C ) + 209.649 ( O C ) 2 1329.208 ( O C )   0.376 V M 0.673 F C 0.48037.56345.655645.8770
H3 H e m i = 1481.552 + 0.152 C 2 + 1.823 H 2 + 0.093 O 2 24.536 C   75.775 H + 9.712 O 94.539 ( H C ) 2 + 494.635 ( H C ) +   195.349 ( O C ) 2 1215.865 ( O C ) + 0.052 V M 2   8.651 V M 0.008 F C 2 + 2.644 F C +   42.716   ( F C V M ) 2 231.488   ( F C V M ) 0.51127.71735.703848.7658
Table 4. Results of predicted model for lignin.
No.Proposed ModelsR2P
[-]
RMSEP
[%]
MAEP
[%]
AAEP
[%]
L1 L i g = 165.252 + 40.196 ( H C ) 2 130.961 ( H C ) + 21.354 ( O C ) 2   50.265 ( O C ) 0.11 V M + 0.164 F C 4.561 ( F C V M ) 0.72479.04267.042428.6080
L2 L i g = 121.824 + 39.757 ( H C ) 2 128.192 ( H C ) + 23.719 ( O C ) 2   56.877 ( O C ) 0.042 V M 2 + 6.932 V M +   0.000473 F C 2 2.954 F C 45.172   ( F C V M ) 2 +   239.132   ( F C V M ) 0.73489.15327.178131.1764
L3 L i g = 2192.163 0.463 C 2 1.165 H 2 + 0.072 O 2 + 63.550 C +   52.493 H 33.225 O + 109.501 ( H C ) 2   490.382 ( H C ) 300.292 ( O C ) 2 + 180.969 ( O C )   0.050 V M 2 + 8.100 V M + 0.020 F C 2 2.760 F C   30.230 ( F C V M ) 2 + 171.791 ( F C V M ) 0.79147.98575.986826.3036
Table 5. Cross-validation results of the predicted model using linear regression and algorithm for cellulose.
R2CV
[-]
RMSECV
[%]
MAECV
[%]
AAECV
[%]
C10.78373.81493.02917.5647
C20.74584.31323.20237.7781
C30.73874.81254.13796.9634
Table 6. Cross-validation results of the predicted model using linear regression and algorithm for hemicellulose.
R2CV
[-]
RMSECV
[%]
MAECV
[%]
AAECV
[%]
H10.32928.60987.267161.0694
H20.40048.26837.208466.4448
H30.32809.85348.703266.0180
Table 7. Cross-validation results of the predicted model using linear regression and algorithm for lignin.
R2CV
[-]
RMSECV
[%]
MAECV
[%]
AAECV
[%]
L10.77287.74836.772619.8385
L20.77577.27356.305420.2150
L30.74277.71336.611219.7636
Table 8. Prediction and cross-validation results of hemicellulose based on C1 and L1.
R2P
[-]
RMSEP
[%]
MAEP
[%]
AAEP
[%]
R2CV
[-]
RMSECV
[%]
MAECV
[%]
AAECV
[%]
0.37708.56126.758150.32950.42927.59796.334651.9966
Disclaimer/Publisher’s Note: The statements, opinions and data contained in all publications are solely those of the individual author(s) and contributor(s) and not of MDPI and/or the editor(s). MDPI and/or the editor(s) disclaim responsibility for any injury to people or property resulting from any ideas, methods, instructions or products referred to in the content.