Article

Effect of Hydrothermal Carbonization on Fuel and Combustion Properties of Shrimp Shell Waste

Department of Biomedical and Chemical Engineering and Sciences, Florida Institute of Technology, Melbourne, FL 32901, USA
*
Author to whom correspondence should be addressed.
Energies 2023, 16(14), 5534; https://doi.org/10.3390/en16145534
Submission received: 28 June 2023 / Revised: 15 July 2023 / Accepted: 18 July 2023 / Published: 21 July 2023
(This article belongs to the Special Issue Thermochemical Conversions of Biomass and Its Safety Evaluation)

Abstract

:
Shrimp shell is a popularly consumed seafood around the globe which generates a substantial quantity of solid wet waste. Hydrothermal carbonization (HTC) could be a viable pathway to convert wet shrimp shell waste into energy-dense hydrochar. The present study aims to assess the fuel properties, physicochemical attributes, and combustion properties of shrimp shell hydrochar generated with a wide range of HTC temperatures (110–290 °C). Results showed that a rise in carbonization rate results in a decline in mass yield to as low as 25.7% with the increase in HTC temperature. Thermogravimetric analysis indicates shrimp shell hydrochars to be more thermally stable than raw dried feedstock. Results from the bomb calorimeter report a maximum HHV of 27.9 MJ/kg for SS-290, showing a 13% increase in energy densification compared to raw shrimp shell. The slagging and fouling indices determined for the hydrochars further assisted in addressing the concern regarding increasing ash content changing from 17.0% to 36.6%. Lower ratings of the slagging index, fouling index, alkali index, and chlorine content for hydrochars at higher temperature indicate the reduced probability of reactor fouling during combustion. The findings of the analysis demonstrate that HTC is a promising approach for transforming shrimp shell waste into a potential fuel replacement.

1. Introduction

According to the Food and Agricultural Organization (FAO), annual production of crustaceans, including lobsters, prawns, and shrimp in the US, was about 9.3 billion tons in 2020, among which shrimp alone accounted for almost 5.03 million tons [1,2]. During the processing of shrimp, residues, including the head, viscera, shell, and other parts, generate between 50 and 60% of the total solid as wet solid waste, often called shrimp shell waste [3]. Despite a small fraction of the shrimp shell waste being reused as animal and aquaculture meal [4], a vast majority of the shrimp shell waste is either burned or disposed of in landfills or in the open ocean, which emits greenhouse gases and causes nutrient pollution and foul odors [5]. Moreover, given its high moisture and ash content, direct combustion of shrimp shell waste has not proven to be a financially viable option as an energy source [6]. Therefore, processing this waste into solid char, which could be an effective alternative to produce an energy-dense fuel is of an imminent need for society.
In recent years, hydrothermal carbonization (HTC) has been practiced, transforming wastes with high moisture content into carbonaceous hydrochars with improved fuel properties compared to pristine feedstocks. HTC is proven to be beneficial due to its ability to improve conversion efficiency at lower temperatures without the need for dry feedstock like pyrolysis or gasification [6]. To date, HTC has been extensively incorporated in lignocellulosic feedstocks because of their high concentration of cellulose, lignin, and other carbohydrates [6,7,8,9,10,11,12]. Recently, HTC of non-lignocellulosic feedstocks including municipal solid wastes and sewage sludge is also being recognized as a useful waste mitigation pathway [13,14,15,16,17,18]. However, HTC is not largely explored for non-lignocellulosic material that contains different amounts of protein, lipids, and carbohydrates in comparison to lignocellulosic biomass. In terms of shrimp shell waste, proximate analysis shows that it contains 80% moisture, 15% protein, 8% fat, and 1.2% carbohydrates, but no lignin nor cellulose was detected in shrimp shell waste [19]. The research on repurposing shrimp shell waste has so far concentrated on recovering bioactive elements, but it still produces effluents such waste sludge or wastewater that require additional treatment, whereas HTC attempts to minimize effluent by utilizing even the inherent moisture content of shrimp shell [20]. Despite the presence of poor carbohydrate content and high moisture content, the literature shows activated shrimp shell hydrochars are used in cathode materials, microbial fuel cells as a catalyst, dye adsorption, fertilizer, and as alternative fuel [21,22,23,24,25,26]. Exploring the mitigation path of shrimp shell waste through the HTC process and generating a new fuel alternative can simultaneously address the adverse issues of waste management and the energy crisis. Although not the scope of this specific study, the process liquid generated after the HTC process is rich in ammonium ions, which gives another research scope for its recovery.
Previously, Kannan et al. have characterized shrimp shell hydrochar and optimized the HTC conditions for maximizing mass yield [23]. However, the studies were conducted for only three different HTC temperatures, and the purpose was to characterize the hydrochars. To the best of authors’ knowledge, no elaborate combustion characterization or fouling and slagging indices analysis has been conducted on shrimp shell hydrochar to evaluate its potential as an alternative fuel. In addition, it has not yet been thoroughly explored how degradation of a non-lignocellulosic feedstock may be distinct from conventional lignocellulosic ones at HTC temperatures lower than 180 °C, above which lignin decomposition begins. It is well recognized that HTC conditions have a considerable impact on mass yield and hydrochar quality, including its elemental composition, ash concentration, surface functions, and calorific value. In this study, properties of hydrochars were investigated across an extensive range of HTC temperatures (varying from 110 °C to 290 °C) by performing physicochemical, fuel, and combustion characterization. Finally, evaluation of slagging, fouling, and alkali indices was performed to enable a comprehensive understanding of the combustion quality of the hydrochars to be implemented as an alternative energy source.

2. Materials and Methods

2.1. Materials and Chemicals

Whole white shrimps were purchased from a local grocery store in Palm Bay, Florida. The heads and shells of each shrimp were manually separated and dried for 24 h in the oven at 105 °C. The shrimp shell waste (SS) was then crushed into a consistency of powder (particle size ranging from 500 μm to 63 μm) using a food processor and stored in sealed containers for HTC and corresponding characterization. For elemental and combustion analysis of hydrochars, ultra-high purity nitrogen and ultra-zero air, respectively, were obtained from NexAir (Melbourne, FL, USA). Vanadium oxide and 5-tert-butyl-benzoxazol-2-yl thiophene (BBOT) standard employed for elemental analysis were provided by CE Elantech (Lakewood, NJ, USA).

2.2. Hydrothermal Carbonization

The dried powdered SS was hydrothermally carbonized in a 300 mL Parr reactor (Moline, IL, USA). The thorough procedure for hydrothermal treatment is accessible elsewhere [27]. Briefly, the reactor was loaded with a 1:10 ratio of SS to deionized water (DI) (15 g of SS and 150 g of DI water). Seven temperatures were evaluated with a 30 °C increment from 110 °C to 290 °C and a 30 min residence time. Typically, for any lignocellulosic material, HTC starts strengthening at a temperature of around 180 °C. However, this study sought to evaluate the impact of HTC temperature on a non-lignocellulosic feedstock for a wide spectrum of temperatures ranging from the boiling point of water to as high as 290 °C. Each HTC reaction was followed by the venting of the product gases in the fume hood. The separation of the solid hydrochar from the process liquid was accomplished by vacuum filtration using Whatman 41 filter paper (Cytiva, Tonglu, China) and solid hydrochar was rinsed with DI water during the filtration process to remove residual process liquid in the pores. The pH of the process liquid was assessed. The hydrochar was oven-dried at 105 °C for 24 h before being transferred to a sealed plastic tube for storage. The samples were labeled as SS-T, where T denotes HTC temperature. Mass yield for each temperature increment was estimated using Equation (1) [15].
M a s s   Y i e l d   % = M a s s   o f   d r i e d   h y d r o c h a r   ( g ) M a s s   o f   d r y   f e e d s t o c k   ( g ) × 100 %

2.3. Physicochemical Characterization of Hydrochars

The elemental analysis (wt.%) containing carbon, nitrogen, hydrogen, and sulfur in raw SS hydrochars at seven different temperatures was performed using a CHNS-O analyzer from FLASH EA 1112 Series (Thermo Scientific, Grand Island, NY, USA) with a reliability limit of 0.64, 0.16, and 0.11 for carbon, hydrogen, and nitrogen, respectively, in accordance with ASTM D5373 [28]. As per the ASTM approach, vanadium oxide (V2O5) as a conditioner and 5-tert-butyl-benzoxazol-2-yl thiophene (BBOT) as a standard for calibration were employed. The samples were subjected to combustion at a temperature of 950 °C in presence of ultra-high purity oxygen, while helium was used as a carrier gas to flow through the sample over pellets made of copper oxide and then electric electrodes of copper.
By employing a muffle furnace (Thermo Scientific, Model # FB1415M, Waltham, MA, USA) with a temperature accuracy of ±0.5 °C [29] set at 575 °C temperature for a span of 5 h and 30 min, the ash in the dry solid samples was estimated by using the ASTM D1102 technique and following Equation (2), respectively. For the purpose of confirming reproducibility, replicates of each sample were run. Finally, by using a difference method (100%-carbon%-nitrogen%-sulfur%-hydrogen%-ash%), oxygen content was calculated.
A s h   % = w e i g h t   o f   a s h   ( g ) i n i t i a l   w i g h t   o f   s a m p l e   ( g ) × 100 %
Proximate analysis of SS and hydrochars was performed to determine their moisture content (MC), volatile matter (VM), and fixed carbon (FC) through thermogravimetric analysis, known as TGA, using a PerkinElmer TGA 4000 (Waltham, MA, USA) with a ±1 °C temperature accuracy and ±0.02% balance accuracy [30]. To prevent oxidation and consistently purge the VM, 20 mL/min of nitrogen gas was circulated during each TGA run to maintain an inert environment. The samples were heated isothermally for 5 min from a starting temperature of 35 °C to 105 °C at a rate of 50 °C/min. Moisture content was the cause of any observed mass loss during this time. The samples were then heated at the same pace to 900 °C and kept isothermal at 900 °C for an additional 5 min. The mass loss from 105 °C to 900 °C was attributable to volatile matter. The percentage of fixed carbon present in the samples was determined by deducting the moisture percentage, volatile matter, and ash percentages from 100%. With the accumulated value of volatile matter and fixed carbon percentage, Equation (3) was used to determine the fuel ratio to evaluate the quality of coal, where low fuel ratios indicate high ignition behavior that could result in spontaneous ignition [10]:
F u e l   R a t i o = F i x e d   c a r b o n   ( w t % ) V o l a t i l e   m a t t e r   ( w t % )
The functionalities present in raw dry SS and corresponding hydrochars were detected utilizing Thermo Scientific Attenuated Total Reflector (ATR) FTIR (Model: Nicolet iS5, Madison, WI, USA). The selected working conditions were 64 scans per second, an 8 cm−1 resolution, and a wavenumber range of 500 cm−1 to 4000 cm−1.

2.4. Fuel Characterization

For each sample, the higher heating value (HHV) was estimated using an IKA C 200 Bomb Calorimeter (Staufen, BW, Germany) with a dynamic reproducibility of 0.1% [31] by strictly adhering to the ASTM D240 method. The energy densification ratio (EDR) and energy yield (EY) were determined using the following Equations (4) and (5), respectively [32,33]:
E D R = H H V   o f   S S   h y d r o c h a r   ( M J k g ) H H V   o f   r a w   S S   ( M J k g )
E Y = E D R   ×   m a s s   y i e l d

2.5. Combustion and Combustion Indices

The combustion thermogram was performed in the same TGA as the proximate analysis. The samples were subjected to heating at a rate of 20 °C/min in presence of 20 mL/min air flow from 35 °C to 900 °C. This approach was adopted from Zhang et al. [34]. The combustion thermogram for mass loss (TG) and rate of mass loss (DTG) were plotted. This DTG thermogram was used to determine the temperature at which maximum mass loss occurred, the burnout temperature, and the ignition temperature. The following Equations (6)–(8) were used to compute combustion time and indices [15,34,35,36]:
D i = d w d t m a x t m a x × t i
D b = d w d t m a x t 1 2 × t m a x × t b
S i = d w d t m a x × d w d t m e a n T i 2 × T b
where tb and ti represent the time at the burnout and ignition temperatures, respectively. Di = ignition index (high Di means easier and faster ignition); d w d t m a x = maximum rate of mass loss which occurs at temperature, Tm (a lower Tm value means a more reactive sample); tmax = time at maximum rate of mass loss. Db = burnout index (a lower value means better combustion), Δt1/2 = time at halfway of reaching DTGmax. Si = comprehensive combustibility index (a higher value means more intense burning reaction); Ti = ignition temperature, the temperature at which the sample ignites where the DTG is 1%/min after the moisture content has dissipated (a higher Ti means a more stability in sample). Tb = burnout temperature, the temperature where combustion has stopped and the DTG decreases to less than 1%/min (a higher Tb means more thermal persistency); ( d w d t ) mean is the overall average rate of combustion.
An energy-dispersive spectrometry (EDX) unit (Genesis, EDAX, Los Angeles, CA, USA) was used to identify primary inorganic elementals in hydrochar ashes at different temperatures to calculate slagging and fouling indices for each sample. Hence, the residual ash content from the muffle furnace run was subjected to the EDX for each hydrochar at different temperatures. The most widely used indicators for coal to assess slagging and fouling tendencies include the fouling index, slag viscosity index, alkali index, and chlorine content [37]. In general, the components of ash can be separated into two primary groups (groups A and B) based on their melting points, where compounds in B groups are of lower melting points (CaO + MgO+ Fe2O3 + Na2O + K2O) and compounds in A groups are of high melting points (SiO2 + TiO2 + Al2O3) [38]. As the onset of phases in the fly ash having lower melting point is facilitated by phosphorus (P) concentration, P2O5 content should be added to group B. Generally, the correlations are calculated in the form of B/A. The scale formation in the incinerator by these two groups of metal components in the presence of sulfur is measured by the slagging index, although the fouling index is nearly equivalent to the contribution of included sodium and potassium oxides. The number of kilograms of sodium and potassium oxides per GJ of solid fuel is known as the alkali index. Finally, the proportion of silica in the metal oxides is measured by the slag viscosity index [39]. Table S1 contains the most recognized correlations and ratings to define the indices for bituminous and brown coals [38]. Every single index for raw SS and hydrochars was assessed based on the elemental analysis of ash from EDAX. The slagging factor and fouling index is considered without P amount in ash.

2.6. Characterization of HTC Process Liquid

Residual process liquid from each HTC was thoroughly filtered out of the solid hydrochar. After HTC was run at various temperatures, these process liquids for each sample were run on a Dionex Aquion IC (ion chromatography) system (Thermo Scientific, Sunnyvale, CA, USA) with a <0.1% flow accuracy and ±0.5 °C temperature accuracy [40] to estimate the ammonium concentration. A sample volume of 5000 µL was injected into the dionex ionpac CS12A cation exchange column (4 × 250 mm). A 1 mL/min flow rate, 20 mM methanesulfonic acid diluted with deionized water was used as the eluent of the process to achieve ammonium ion separation. For each sample, the column was kept at a temperature of 25 °C for a 15 min run time. A Dionex Cation Self-Regenerating Suppressor (Dionex CSRSTM 300 4 mm) unit was utilized to suppress the MSA eluent conductance before detecting ammonium ion with a conductivity detector. The amount of ammonium in the process liquid was stored in the Chromeleon version 6.8 software connected to the IC.

3. Result and Discussion

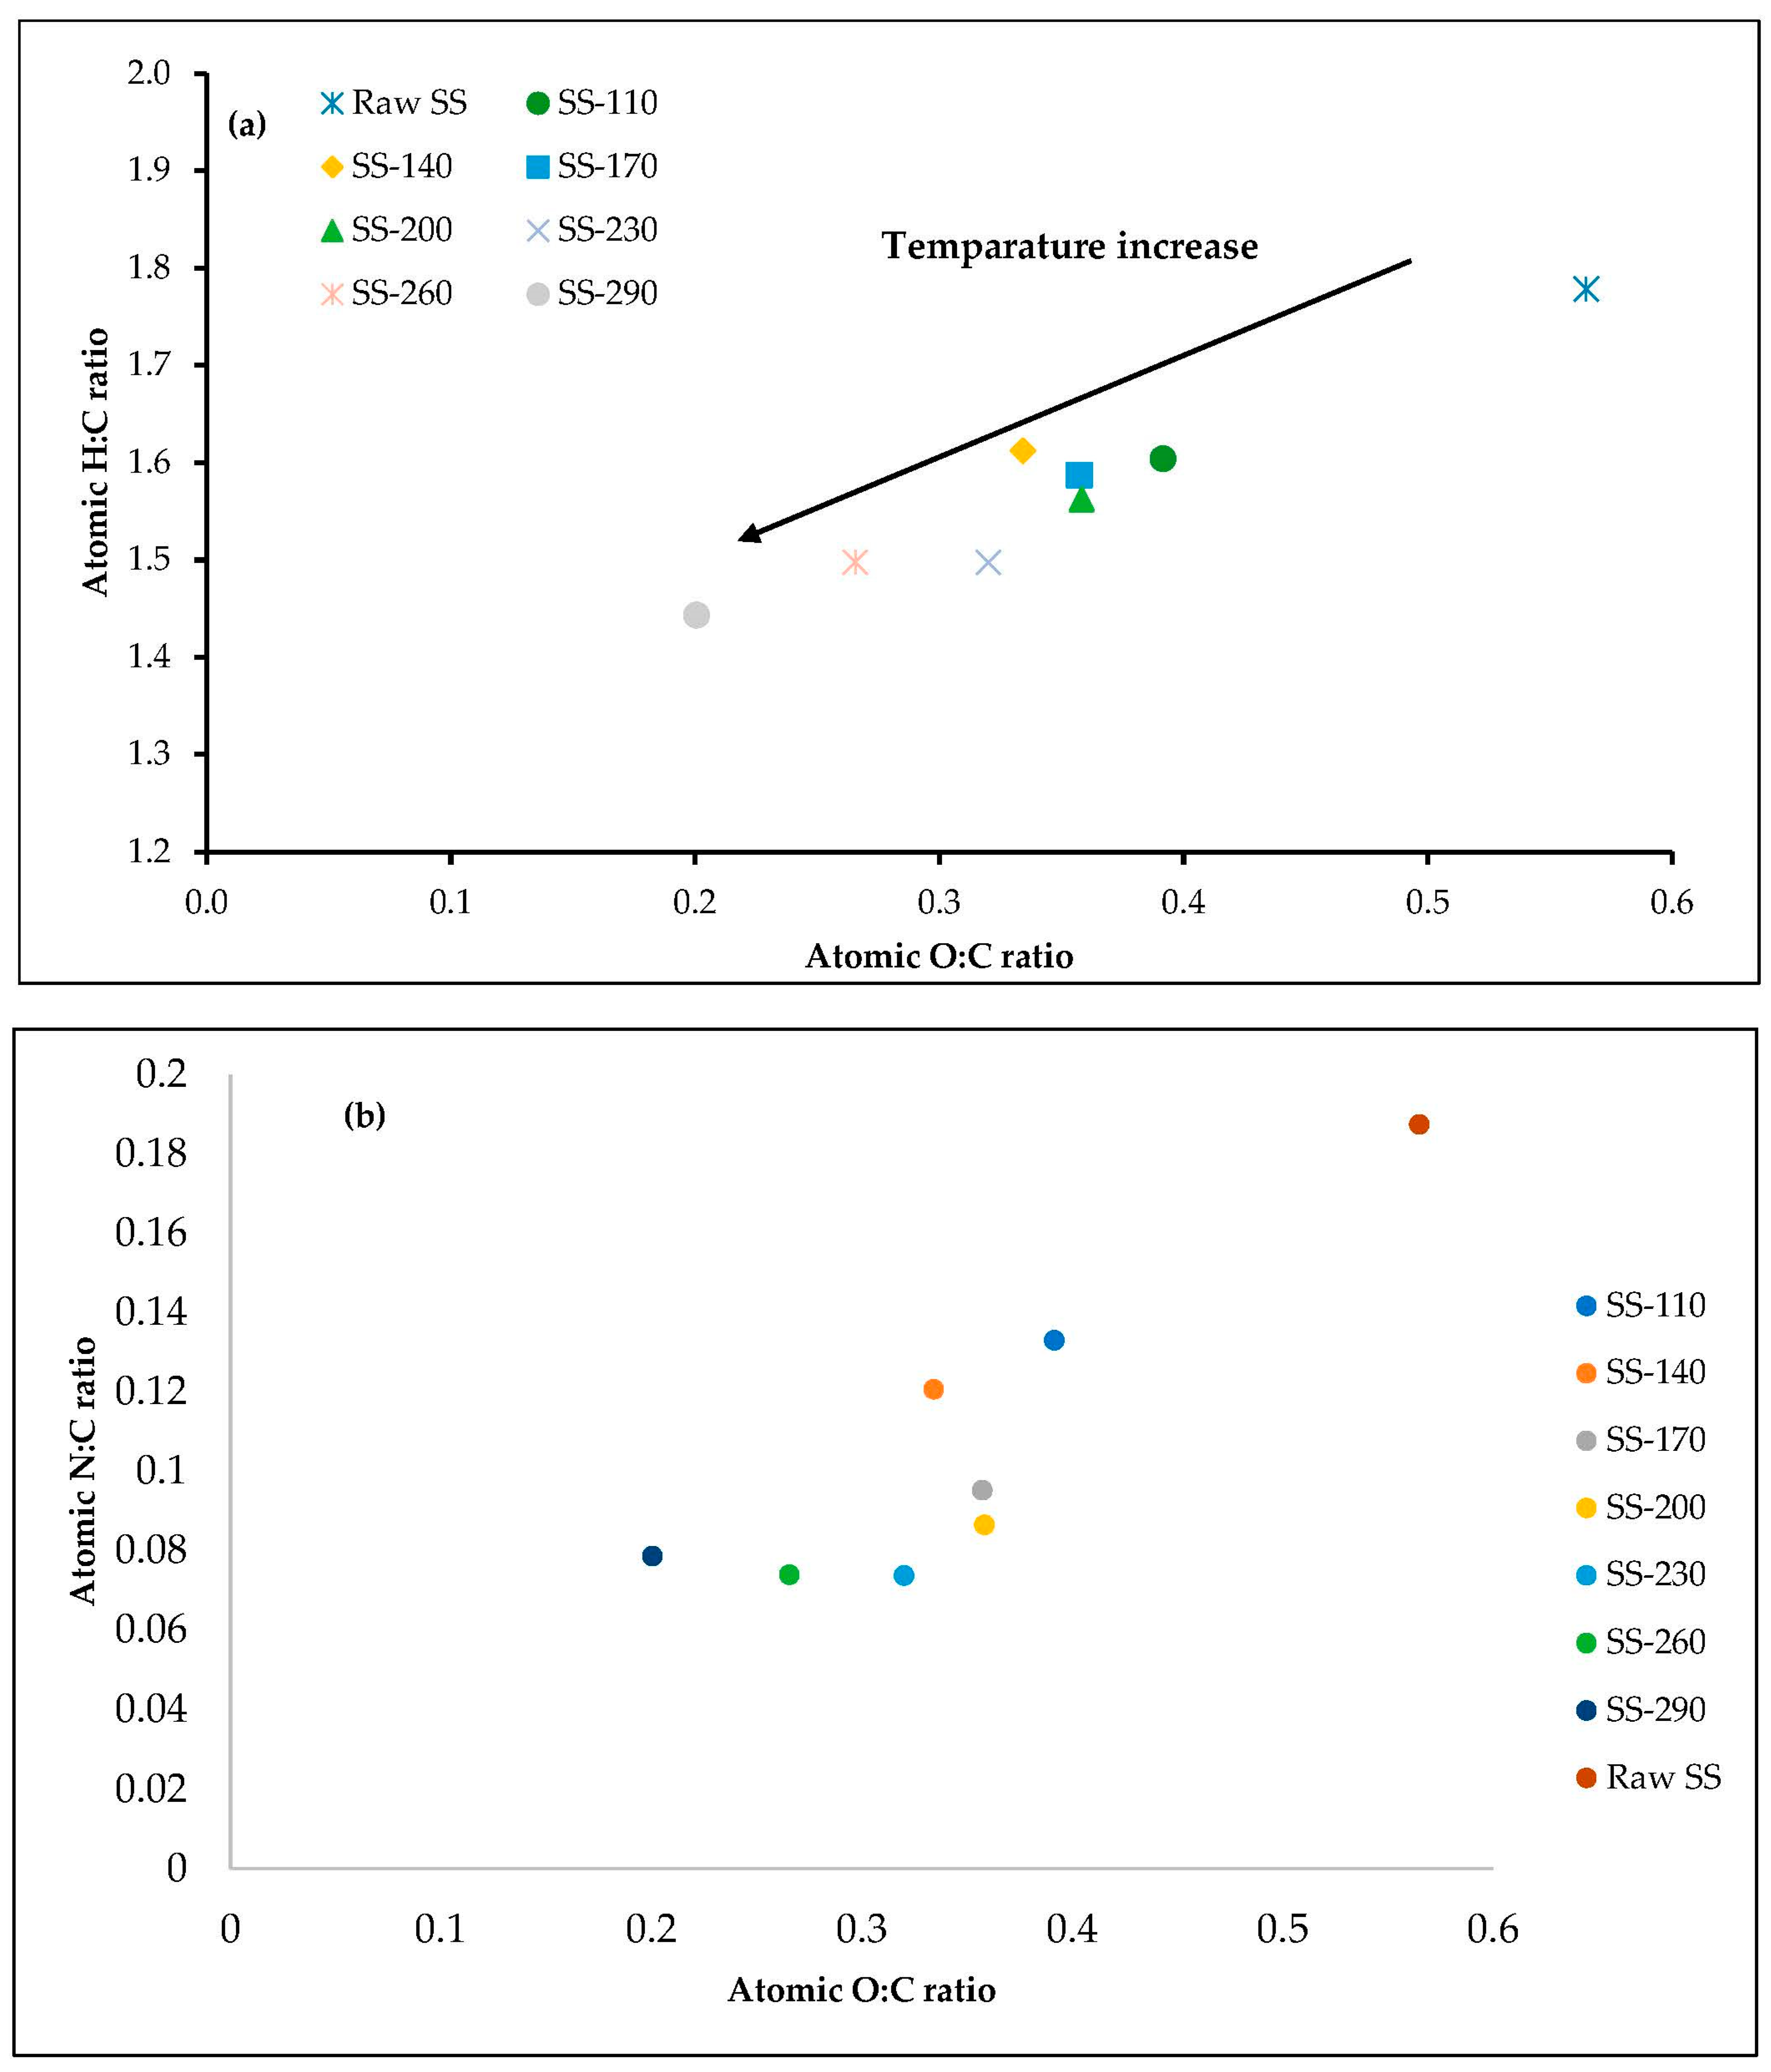
3.1. Effect of HTC Temperature on Product Distribution and Properties of Hydrochars

Mass yield, ultimate analysis, proximate analysis, bomb calorimetry analysis, and process liquid characterization results for raw SS along with the hydrochars at different temperatures are shown in Table 1. The corresponding solid fraction generated through the HTC process is demonstrated as mass yield. Mass yield from HTC varies at different temperatures due to the conversion process. Mass yield for SS-110 to SS-290 decreased from 54.3 ± 9.4% to 25.7 ± 5.6%. However, a significant mass loss during HTC was observed from SS-140 to SS-180 where the yield decreased from 53.4% to 32.0% and continued to decrease up to SS-260. A notable decreasing mass yield with the rise in HTC temperature may be a consequence of increased reaction severity [41]. Several studies have reported a decreasing mass yield trend for different feedstock at higher HTC temperatures and noted that as an indication of a higher rate of carbonization [42,43,44,45]. The decreasing mass yield can be attributed to the increasing organic matter loss during HTC in the form of volatile matter at increased reaction temperature [46,47]. In a particular study on SS conducted by Kannan et al. [23], a maximum hydrochar mass yield of 29% at 186 °C and 2 h of residence time was reported, which is comparable to the mass yield recorded at that temperature range of 170 °C to 200 °C in this study. The same study reports an initial increase in mass yield from 150 °C to 180 °C then a decrease in yield for 210 °C [23]. This reported result suggests a possible hydrolysis from 150 °C to 180 °C, which leads to an increase in mass yield, whereas at higher HTC temperature above 180 °C the degradation of carbohydrates and/or proteins results in decrease in mass yield up to 210 °C. Given that the HTC retention time and feedstock composition have varied in the two cases, which has a substantial impact on the mass yield, the result nevertheless adheres to the usual trend that yield declines at a higher temperature rage [23].
Table 1 includes the ultimate analysis of raw SS and hydrochars. The reported concentrations of carbon, hydrogen, nitrogen, sulfur, and and oxygen for raw SS are 38.6%, 6.2%, 8.4%, 0.7%, and 29.1%, respectively, which are comparable to the literature [23,48]. As SS undergoes HTC, the carbon content experiences an increase from 38.6% in raw SS to as high as 43.7% in hydrochars. The rising trend indicates elemental carbon enrichment in hydrochars from raw SS via the carbonization reaction, resulting in a decrease in hydrogen, nitrogen, and oxygen content. This trend can also be explained by the lower mass yield found at higher HTC temperature due to increasing carbonization reaction rate. However, for hydrochars at various temperatures, the results in Table 1 indicate decreasing trend in carbon and nitrogen up to SS-230 and then an increase from SS-230 to SS-290. A probable explanation for this pattern is that at higher temperatures, the amino acid breakdown that results in a reduction in nitrogen condenses back in hydrochars, resulting in an increase in carbon and nitrogen content for SS-260 and SS-290. Furthermore, HTC of SS introduced a reduction in sulfur content in hydrochar from 0.71% in raw SS to as low as 0.55%, improving the fuel quality through in production of SOx gas during combustion.
To better understand the reason behind the increase in carbon content and decrease in hydrogen and oxygen content, a van Krevelen diagram plotting the atomic O/C vs. atomic H/C ratios in Figure 1a and a modified van Krevelen diagram of atomic O/C vs. atomic N/C ratios in Figure 1b were drawn [49]. The prominent decrease in oxygen can be explained by deoxygenation reactions such as dehydration and decarboxylation reactions evident in the van Krevelen diagram in Figure 1a. The van Krevelen diagram additionally explains fuel quality, showing that lower H/C and O/C ratios denote better fuel quality [50]. Figure 1a demonstrates that for hydrochars at higher HTC temperatures, the data points shift towards the origin, exhibiting a decline in the H/C and O/C ratio, indicating a better carbonization reaction and improved fuel quality. Further, the modified van Krevelen diagram in Figure 1b explains the reduction in nitrogen and oxygen content through deamination and nitrification reaction occurring during the HTC process. The reduction in nitrogen content with the increase in HTC temperature improves the quality of fuel in hydrochars, ensuring reduced emission of NOx gas during combustion. The evident amination reaction can be visualized through the ion chromatography analysis of process liquid at each temperature. A significant amount of amino acid present as protein in SS decomposes to ammonia through deamination and decarboxylation reaction [51,52] and releases NH4+ in the process liquid. Again, with the increase in HTC temperature, the reaction severity increases and results in higher accumulation of NH4+ in the process liquid (Table 1). The increasing concentration of basic NH4+ ion is also reflected in the pH of process liquid in Table 1 as it increases from 7.5 to 9.1 for SS-110 to SS-290. Furthermore, the FTIR results shown in Figure S1 in the Supplementary Section of the study contribute to clarifying the transformation in functionalities and degradation of components with the rise in HTC temperature.
The ash content calculated from muffle furnace, which reports the metal and metalloids, exhibits an increase from 17.0% to 36.6% for raw SS to hydrochar at 290 °C (Table 1). The literature indicated that the ash content for raw SS alone ranged from 32.0% to 38.0% where different methods were used for calculation [53,54]. Since SS often contains high levels of calcium and other minerals [48,53,54], an increase in ash content upon further application of the HTC process is an expected consequence. The exact scenario is evident in this study as well, where, with an increase in HTC temperature, the ash percentage in hydrochar increased from 21.8% to 36.6%. The proximate analysis of raw SS and hydrochars at different temperatures to calculate fixed carbon (FC) and volatile matter (VM) were performed by TGA. The results indicated the amount of FC in hydrochar varied insignificantly with the rise in HTC temperature, which was also reported in the literature, where increasing holding time and HTC temperature both showed insignificant impact [23]. In this study, the FC content varied from 4.9% to 2.9% with the increase in HTC temperature. A similar decreasing trend emerged for the VM content with the increase in temperature, which ranges from 73.0% to as low as 60.6%. Based on the literature, lower VM results in steady flame formation throughout combustion, which ultimately leads to reduced heat loss [55]. The decline in FC and VM percentage can be explained by the consistent rise in ash content of hydrochars with the rise in temperature due to the presence of high mineral content in SS, which is a non-lignocellulosic biomass. The reported fuel ratio in Table 1 also reflects this decreasing tendency in FC and VM.
The HHV of raw SS and hydrochars for the dry ash free basis are shown in Table 1. The HTC temperature appears to have a negligible effect on the higher heating value. The range of HHV undergoes a slight increase with the increase in HTC temperature where it rose to 27.9 MJ/kg for SS-290 compared to 24.6 MJ/kg found for raw SS. It is obvious that rising reaction temperature has a beneficial effect on HHV. This may be correlated with the increase in elemental carbon content found in the CHNS result in Table 1 and the shift in Figure 1a, with the increase in HTC temperature indicating a better fuel quality. The maximum HHV for SS hydrochar reported to date was 24.0 MJ/kg at 210 °C for a 2 h HTC retention time, which is lower than the value reported in this study [23]. A reason behind this could be that, with the increase in temperature up to 290 °C, hydrochars experience more complete carbonization, showing a greater HHV.
Table 1 also contains the values of energy yield (EY), energy densification (ED), and energy densification ratio (EDR) of raw SS and hydrochars. The EY of hydrochars varied from 54.5% to 28.3%. EY is known as a balance between mass loss and HHV. The decreasing trend in EY reflects the decreasing mass yield and insignificant rise in HHV described earlier. At higher HTC temperature, the elemental C in hydrochars and solid yield both decrease due to increasing reaction intensity. At 290 °C HTC temperature, the EDR for the hydrochar reached a maximum of 1.13, showing a 13% increase compared to raw SS. This increase in EDR is mostly the result of carbon densification in hydrochars following HTC. In this study, the lack of impact of HTC temperature on EDR and ED could have the same explanation as that of the minor change found in the HHV. A negligible difference in HHV, ED, and EDR for non-lignocellulosic SS hydrochars was found compared to other lignocellulosic feedstocks [56]. However, SS waste exhibits the possibility of use as solid fuel when compared to other lignocellulosic biomass [57,58,59,60,61], sewage sludge [62], and food waste [63] in terms of heating value. From a study reported by Jelena Petrovic et al., hydrochar from corn cob, paulownia leaf, and olive pomace showed the highest HHV of 27.33 MJ/kg, 28.06 MJ/kg, and 30.55 MJ/kg, respectively, at the HTC temperature of 260 °C [59]. Another study on hydrochar from sweet potato waste at 280 °C for a retention time of 1 h reported a HHV of 26.17 MJ/kg [58]. Hydrochar of SS at a higher HTC temperature exhibits the potential to be implemented as an alternative energy source with a comparable HHV to several other waste feedstocks.

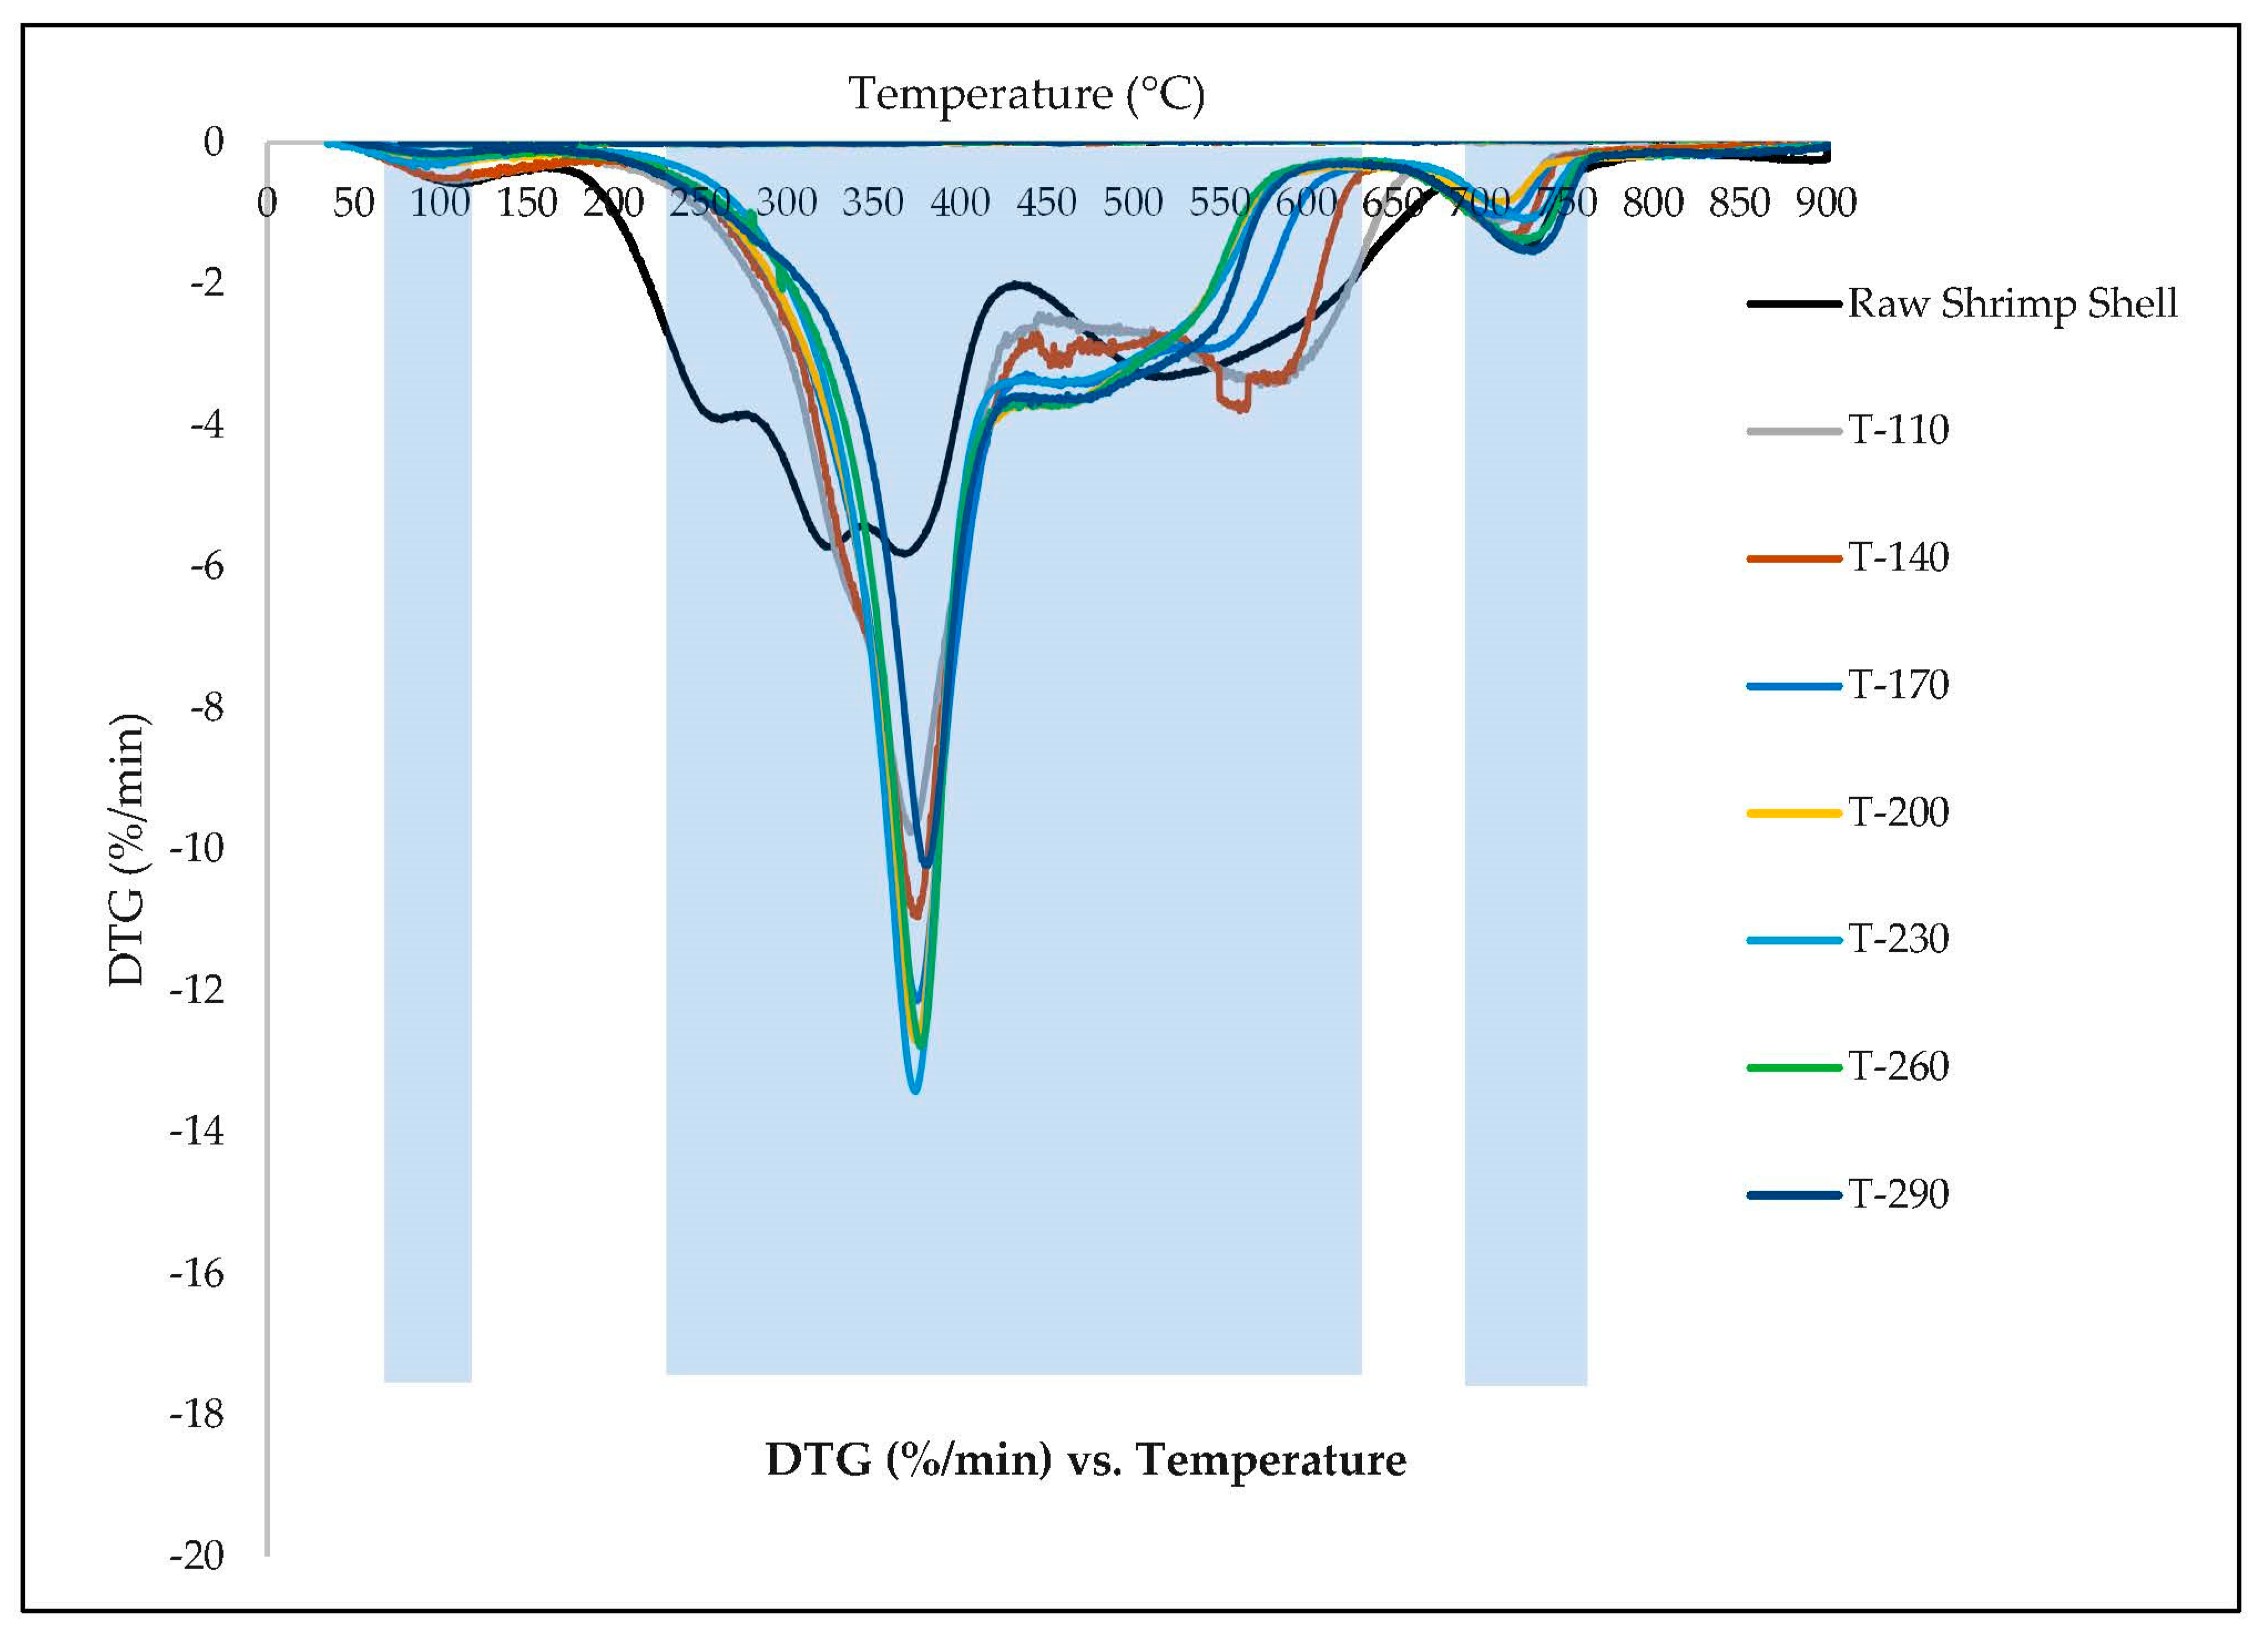
3.2. Combustion Characteristics

Table 2 illustrates the combustion characteristics of raw SS and its hydrochar samples. The combustion properties were found from Figure S2 and Figure 2. According to Figure 2, three distinct major peaks were observed for each sample at three different temperatures throughout the entire combustion zone, indicating all the components were not oxidized at the same time. A similar occurrence was also reported in previous studies of SS hydrochars [64,65,66]. Every sample displayed a first DTG peak between 110 and 150 °C, indicating removal of moisture or organic molecules with low boiling point [65]. The second major peak identified in all hydrochars, and raw SS emerged in the temperature between 200 °C to 600 °C, which contributes to the degradation of chitosan and other organic substances such as polysaccharides and proteins [65,66]. From Table 2, all the samples showed a maximum degradation temperature (Tm) in the range of 367–381 °C, which could indicate chitin degradation as found in other studies [64,65,67]. The raw SS degradation peak varies significantly in the region of 250 °C–650 °C from the hydrochars. For raw SS, several peaks could be an indication of the gradual breakdown of greater quantity of organic components than in hydrochars. Organic content in hydrochars has already undergone a carbonization reaction at higher temperature and is degraded during HTC. Additionally, the DTG curves for hydrochar in the second degradation range reveal nearly comparable peaks in the 450 °C–650 °C region for SS-110 and SS-140. However, hydrochars at higher temperatures exhibit a different progressive shift from SS-200 to SS-290. A possible reason behind this is the rigorous carbonization reaction of organic matter in the HTC process at higher temperature, which is evident in the lower mass yield as well (Table 1).
The Tm reported in Table 2 also suggests that higher HTC temperature shows higher Tm, an indication of more stable organic content presence in the hydrochars. In the third stage of the analysis, the remaining high calcium percentage in SS degrades since the majority of the organic components are already decomposed during the second degradation peak. As per the literature, the degradation peak caused by the transition of commercial calcium into calcite typically occurs at 729 °C [64], while the final weight loss for SS hydrochars was found to be about 700–720 °C. The prior studies by Kaewtatip et al. [64] on SS and Poompradub et al. [68] on cuttlebone’s decomposition temperature both reflect the final stage of SS weight loss, and they both attribute this stage of degradation to the release of CO2 to produce CaO.
The increasing burnout temperature reported in Table 2 indicated that with higher HTC temperature, more thermally stable hydrochars were produced. This phenomenon is explained by Poomsawat et al. [69], who explained that less homogeneity at higher temperature hydrochars could extend the reaction time for complete combustion, and in this case the decrease in homogeneity of the hydrochar could be attributed to the increase in incombustible ash content in hydrochars at higher HTC temperature (as observed in Table 1). This trend is also reflected in the rise of Tm found in Table 2, which indicates a reduction in reactivity rate a result of the synthesis of more thermally stable hydrochar at higher HTC temperatures. Hydrochars displayed a bell-curve behavior in terms of ignition temperature, with the Ti maintaining an upward trend up to a maximum of 290 °C for SS-200, then displaying a decreasing trend from SS-230 to SS-290. The greater ignition temperature denotes a more thermally stable hydrochar that is difficult to combust, fire up, and detonate [15,70].
The burnout time tb presented in Table 2 demonstrates that raw SS to hydrochars requires approximately the same retention time to burn out completely, which is reflected by all the hydrochars having a DTGmax peak of similar magnitude in Figure 2. However, SS-260 and SS-290 with higher burnout temperature also experiences prolonged combustion. In addition, it is apparent from the stated ∆t1/2 in Table 2 that the duration at which the DTG of combustion is half of the DTGmax is substantially shorter for hydrochars than for raw SS, indicating that a faster reaction occurs in hydrochars to reach the DTG peak than in raw SS. From the analysis of Di, raw SS with the lowest Di is less likely to ignite (a lower Di signifies tougher to ignite). A similar trend is visible through the combustibility index, where the hydrochars have a greater Si value than raw SS, which indicates a rigorous combustion reaction and less stable flame formation. Among other hydrochars at various temperatures, SS-230 may be regarded as the most effective performer in terms of thermal stability, lower ignition temperature, highest ignition index, and higher combustibility index.
It is evident that despite containing considerable ash content (Table 1), the SS hydrochars show a 2–13% increase in energy densification ratio, leading to further investigation into slagging and fouling indices listed in Table 3. Therefore, several fouling and slagging indices were estimated to determine whether the higher ash level would be damaging to incinerators during combustion as a fuel. The evaluated slagging index (SI), fouling index (FI), slagging viscosity (SV), alkali index (AI) and chlorine content (Cl) are reported with respect to their limits for coal in Table 3 [38]. The results demonstrate that the slagging and fouling factor reduced with the increase in HTC temperature, changing from being extremely high to low, which is reflected in the alkali index as well. Raw SS and SS-110 hydrochar both have an exceptionally high probability of fouling and slagging. Also, high chlorine amount and alkali index suggest that slagging and fouling likely occur in the reactor. Despite the high possibility of slagging viscosity reported for all the cases, other indices for higher-temperature HTC hydrochars appear to be promising. The high calcium content naturally present in SS, which was also identified in earlier studies, could be the primary cause of slagging viscosity index being a predominant factor in all the cases [48,53,71]. Between SS-110 and SS-140, there was a considerable drop in chlorine levels. Even from indices analysis, SS-230 outperforms other hydrochars, with a lower risk of threatening incinerators.

4. Conclusions

This study demonstrates the prospect of using SS waste to produce hydrochar, which has the potential to eventually be utilized as an alternative fuel source. Converting SS waste with high moisture content into hydrochars through HTC without drying is a promising method. This study conducted ultimate, proximate, fuel, and combustion characterization for a wide range of hydrochars at varying HTC temperatures. With the 1.13 times rise in carbon, 58% decline in nitrogen, and 22% decline in sulfur content, HTC of SS results in a cleaner fuel. Despite the 17% decrease in VM and 1.8 times higher ash content, the hydrochar is comparable to other lignocellulosic biomass in terms of HHV, with a maximum of 27.9 MJ/kg, 1.13 times higher than the raw SS. The results of combustion parameters analyzed through DTG suggested the SS-230 to be ideal as a fuel with considerably lower ignition temperature (Ti) of 275 °C, faster ignition indicating a low ∆t1/2 of 15.6 min, and the highest ignition index (Si) of 3.5 × 10⁻⁷ %2/°C3.min2. Finally, the reasonable concern of higher ash content was further analyzed with respect to different slagging and fouling indices, indicating that, for hydrochars, with the increase in HTC temperature, the possibility of fouling in the incinerators is reduced. Therefore, converting SS waste into hydrochars through HTC has the potential to be utilized as an alternative fuel production method.

Supplementary Materials

The following supporting information can be downloaded at: https://www.mdpi.com/article/10.3390/en16145534/s1, Table S1: Slagging, fouling, sagging viscosity, and alkali indices, Cl content equation and limit for detection; Figure S1: FTIR spectra for raw SS and hydrochar at different temperatures; Figure S2: TG thermogram results for raw SS and hydrochars at different temperatures. References [22,23,24,38,66,72,73,74,75,76,77,78] are cited in the Supplementary Materials.

Author Contributions

Conceptualization, S.S., M.T.I. and T.R.; methodology, M.T.I., S.S. and T.R.; formal analysis, S.S. and M.T.I.; investigation, S.S.; resources, T.R.; data curation, T.R.; writing—original draft preparation, S.S. and J.C.; writing—review and editing, T.R. and M.T.I.; supervision, T.R.; funding acquisition, T.R. All authors have read and agreed to the published version of the manuscript.

Funding

The material is based upon work partially supported by National Science Foundation under Grant No. 2123495.

Data Availability Statement

Data will be available upon request.

Acknowledgments

The authors would like to thank Robert Cheatham for his contributions during the experimental work of the study.

Conflicts of Interest

The authors declare no conflict of interest.

References

  1. FAO. The State of World Fisheries and Aquaculture. Opportunities and challenges. Food and Agriculture Organization of the United Nations. 2012. Available online: https://www.fao.org/3/i2727e/i2727e.pdf (accessed on 7 May 2023).
  2. Nirmal, N.P.; Santivarangkna, C.; Rajput, M.S.; Benjakul, S. Trends in shrimp processing waste utilization: An industrial prospective. Trends Food Sci. Technol. 2020, 103, 20–35. [Google Scholar] [CrossRef]
  3. Senphan, T.; Benjakul, S. Compositions and yield of lipids extracted from hepatopancreas of Pacific white shrimp (Litopenaeus vannamei) as affected by prior autolysis. Food Chem. 2012, 134, 829–835. [Google Scholar] [CrossRef]
  4. Endo Mahat, M. The Effect of Shrimp Waste Hydrolysate on Broiler’s Tibia Weight, Calcium and Phosphorous Content. Pak. J. Nutr. 2012, 11, 375–378. [Google Scholar] [CrossRef] [Green Version]
  5. Mathew, G.M.; Mathew, D.C.; Sukumaran, R.K.; Sindhu, R.; Huang, C.C.; Binod, P.; Sirohi, R.; Kim, S.H.; Pandey, A. Sustainable and eco-friendly strategies for shrimp shell valorization. Environ. Pollut. 2020, 267, 115656. [Google Scholar] [CrossRef] [PubMed]
  6. Liu, Z.; Balasubramanian, R. Hydrothermal Carbonization of Waste Biomass for Energy Generation. Procedia Environ. Sci. 2012, 16, 159–166. [Google Scholar] [CrossRef] [Green Version]
  7. Cordero, T.; Marquez, F.; Rodríguez-Mirasol, J.; Rodriguez, J.J. Predicting heating values of lignocellulosics and carbonaceous materials from proximate analysis. Fuel 2001, 80, 1567–1571. [Google Scholar] [CrossRef]
  8. Elaigwu, S.E.; Greenway, G.M. Microwave-assisted and conventional hydrothermal carbonization of lignocellulosic waste material: Comparison of the chemical and structural properties of the hydrochars. J. Anal. Appl. Pyrolysis 2016, 118, 1–8. [Google Scholar] [CrossRef]
  9. Sultana, A.I.; Chambers, C.; Ahmed, M.M.N.; Pathirathna, P.; Reza, T. Multifunctional Loblolly Pine-Derived Superactivated Hydrochar: Effect of Hydrothermal Carbonization on Hydrogen and Electron Storage with Carbon Dioxide and Dye Removal. Nanomaterials 2022, 12, 3575. [Google Scholar] [CrossRef]
  10. Tahmid Islam, M.; Klinger, J.L.; Toufiq Reza, M. Evaluating combustion characteristics and combustion kinetics of corn stover-derived hydrochars by cone calorimeter. Chem. Eng. J. 2023, 452, 139419. [Google Scholar] [CrossRef]
  11. Kambo, H.S.; Dutta, A. Strength, storage, and combustion characteristics of densified lignocellulosic biomass produced via torrefaction and hydrothermal carbonization. Appl. Energy 2014, 135, 182–191. [Google Scholar] [CrossRef]
  12. Lynam, J.G.; Reza, M.T.; Yan, W.; Vásquez, V.R.; Coronella, C.J. Hydrothermal carbonization of various lignocellulosic biomass. Biomass Convers. Biorefinery 2015, 5, 173–181. [Google Scholar] [CrossRef]
  13. Danso-Boateng, E.; Shama, G.; Wheatley, A.D.; Martin, S.J.; Holdich, R.G. Hydrothermal carbonisation of sewage sludge: Effect of process conditions on product characteristics and methane production. Bioresour. Technol. 2015, 177, 318–327. [Google Scholar] [CrossRef] [PubMed] [Green Version]
  14. Sultana, A.I.; Reza, M.T. Techno-economic assessment of superactivated hydrochar production by KOH impregnation compared to direct chemical activation. Biomass Convers. Biorefinery 2022, 1–13. [Google Scholar] [CrossRef]
  15. He, C.; Giannis, A.; Wang, J.-Y. Conversion of sewage sludge to clean solid fuel using hydrothermal carbonization: Hydrochar fuel characteristics and combustion behavior. Appl. Energy 2013, 111, 257–266. [Google Scholar] [CrossRef]
  16. Basso, D.; Weiss-Hortala, E.; Patuzzi, F.; Castello, D.; Baratieri, M.; Fiori, L. Hydrothermal carbonization of off-specification compost: A byproduct of the organic municipal solid waste treatment. Bioresour. Technol. 2015, 182, 217–224. [Google Scholar] [CrossRef] [Green Version]
  17. Reza, M.T.; Coronella, C.; Holtman, K.M.; Franqui-Villanueva, D.; Poulson, S.R. Hydrothermal Carbonization of Autoclaved Municipal Solid Waste Pulp and Anaerobically Treated Pulp Digestate. ACS Sustain. Chem. Eng. 2016, 4, 3649–3658. [Google Scholar] [CrossRef]
  18. Zhang, J.-H.; Lin, Q.-M.; Zhao, X.-R. The Hydrochar Characters of Municipal Sewage Sludge Under Different Hydrothermal Temperatures and Durations. J. Integr. Agric. 2014, 13, 471–482. [Google Scholar] [CrossRef]
  19. Mandeville, S.; Yaylayan, V.; Simpson, B.; Ramaswamy, H. Isolation and identification of carotenoid pigments, lipids and flavor active components from raw commercial shrimp waste. Food Biotechnol. 1991, 5, 185–195. [Google Scholar] [CrossRef]
  20. Mao, X.; Guo, N.; Sun, J.; Xue, C. Comprehensive utilization of shrimp waste based on biotechnological methods: A review. J. Clean. Prod. 2017, 143, 814–823. [Google Scholar] [CrossRef]
  21. Mondal, A.K.; Kretschmer, K.; Zhao, Y.; Liu, H.; Fan, H.; Wang, G. Naturally nitrogen doped porous carbon derived from waste shrimp shells for high-performance lithium ion batteries and supercapacitors. Microporous Mesoporous Mater. 2017, 246, 72–80. [Google Scholar] [CrossRef]
  22. He, C.; Lin, H.; Dai, L.; Qiu, R.; Tang, Y.; Wang, Y.; Duan, P.G.; Ok, Y.S. Waste shrimp shell-derived hydrochar as an emergent material for methyl orange removal in aqueous solutions. Environ. Int. 2020, 134, 105340. [Google Scholar] [CrossRef] [PubMed]
  23. Kannan, S.; Gariepy, Y.; Raghavan, G.S.V. Conventional Hydrothermal Carbonization of Shrimp Waste. Energy Fuels 2018, 32, 3532–3542. [Google Scholar] [CrossRef]
  24. Kannan, S.; Gariepy, Y.; Raghavan, G.S.V. Optimization and Characterization of Hydrochar Derived from Shrimp Waste. Energy Fuels 2017, 31, 4068–4077. [Google Scholar] [CrossRef]
  25. Wu, R.; Li, Y.; Pang, X.; Hu, Z.; Jian, X. Insight into evolution of chemical structure and mineralogy to reveal the mechanism of temperature-dependent phosphorus release from hydrochars. Ind. Crops Prod. 2022, 185, 115101. [Google Scholar] [CrossRef]
  26. Zheng, F.-Y.; Li, R.; Ge, S.; Xu, W.-R.; Zhang, Y. Nitrogen and phosphorus co-doped carbon networks derived from shrimp shells as an efficient oxygen reduction catalyst for microbial fuel cells. J. Power Sources 2020, 446, 227356. [Google Scholar] [CrossRef]
  27. Islam, M.T.; Chambers, C.; Klinger, J.L.; Reza, M.T. Blending hydrochar improves hydrophobic properties of corn stover pellets. Biomass Convers. Biorefinery 2022. [Google Scholar] [CrossRef]
  28. Liliana Krotz, D.F.L.; Giazzi, A.D.G.; Thermo Scientific FlashSmart. Elemental Analyzer: Fully Automated Double Channel Analysis for Petrochemical Applications. 2016. Available online: https://assets.thermofisher.com/TFS-Assets/CMD/Application-Notes/AN-42263-OEA-Petrochemical-FlashSmart-AN42263-EN.pdf (accessed on 12 July 2023).
  29. Thermo Scientific Furnaces Datasheet. 2017. Available online: https://assets.thermofisher.com/TFS-Assets/LED/brochures/LED-FurnacesBrochure-BRFURNACE0316-EN.pdf (accessed on 12 July 2023).
  30. PerkinElmer, I. Technical Specifications for the TGA 4000 Thermogravimetric Analyzer. 2009. Available online: https://resources.perkinelmer.com/corporate/cmsresources/images/46-74807spc_tga4000.pdf (accessed on 12 July 2023).
  31. Data Sheet of IKA C 200 Bomb Calorimeter. Available online: https://www.ika.com/en/Products-LabEq/Calorimeters-pg330/C-200-8802500/Downloads-cpdl.html (accessed on 12 July 2023).
  32. Lin, Y.; Ma, X.; Peng, X.; Hu, S.; Yu, Z.; Fang, S. Effect of hydrothermal carbonization temperature on combustion behavior of hydrochar fuel from paper sludge. Appl. Therm. Eng. 2015, 91, 574–582. [Google Scholar] [CrossRef]
  33. Mohammed, I.S.; Na, R.; Kushima, K.; Shimizu, N. Investigating the Effect of Processing Parameters on the Products of Hydrothermal Carbonization of Corn Stover. Sustainability 2020, 12, 5100. [Google Scholar] [CrossRef]
  34. Zhang, X.; Zhang, L.; Li, A. Co-hydrothermal carbonization of lignocellulosic biomass and waste polyvinyl chloride for high-quality solid fuel production: Hydrochar properties and its combustion and pyrolysis behaviors. Bioresour. Technol. 2019, 294, 122113. [Google Scholar] [CrossRef]
  35. Zhang, S.; Chen, T.; Li, W.; Dong, Q.; Xiong, Y. Physicochemical properties and combustion behavior of duckweed during wet torrefaction. Bioresour. Technol. 2016, 218, 1157–1162. [Google Scholar] [CrossRef]
  36. Jiang, L.-B.; Yuan, X.-Z.; Li, H.; Chen, X.-H.; Xiao, Z.-H.; Liang, J.; Leng, L.-J.; Guo, Z.; Zeng, G.-M. Co-pelletization of sewage sludge and biomass: Thermogravimetric analysis and ash deposits. Fuel Process. Technol. 2016, 145, 109–115. [Google Scholar] [CrossRef]
  37. Pronobis, M. Evaluation of the influence of biomass co-combustion on boiler furnace slagging by means of fusibility correlations. Biomass Bioenergy 2005, 28, 375–383. [Google Scholar] [CrossRef]
  38. Tortosa Masiá, A.A.; Buhre, B.J.P.; Gupta, R.P.; Wall, T.F. Characterising ash of biomass and waste. Fuel Process. Technol. 2007, 88, 1071–1081. [Google Scholar] [CrossRef]
  39. Reza, M.T.; Lynam, J.G.; Uddin, M.H.; Coronella, C.J. Hydrothermal carbonization: Fate of inorganics. Biomass Bioenergy 2013, 49, 86–94. [Google Scholar] [CrossRef]
  40. Website for Specification Sheet of Thermo Scientific Dionex Aquion Ion Chromatography System. 2022. Available online: https://www.thermofisher.cn/cn/zh/home/industrial/chromatography/ion-chromatography-ic/ion-chromatography-systems/instrument-selection/aquion.html (accessed on 12 July 2023).
  41. Shrestha, A.; Acharya, B.; Farooque, A.A. Study of hydrochar and process water from hydrothermal carbonization of sea lettuce. Renew. Energy 2021, 163, 589–598. [Google Scholar] [CrossRef]
  42. Zhu, G.; Yang, L.; Gao, Y.; Xu, J.; Chen, H.; Zhu, Y.; Wang, Y.; Liao, C.; Lu, C.; Zhu, C. Characterization and pelletization of cotton stalk hydrochar from HTC and combustion kinetics of hydrochar pellets by TGA. Fuel 2019, 244, 479–491. [Google Scholar] [CrossRef]
  43. Yan, W.; Hastings, J.T.; Acharjee, T.C.; Coronella, C.J.; Vásquez, V.R. Mass and Energy Balances of Wet Torrefaction of Lignocellulosic Biomass. Energy Fuels 2010, 24, 4738–4742. [Google Scholar] [CrossRef]
  44. Hoekman, S.K.; Broch, A.; Robbins, C.; Zielinska, B.; Felix, L. Hydrothermal carbonization (HTC) of selected woody and herbaceous biomass feedstocks. Biomass Convers. Biorefinery 2013, 3, 113–126. [Google Scholar] [CrossRef]
  45. Sermyagina, E.; Saari, J.; Kaikko, J.; Vakkilainen, E. Hydrothermal carbonization of coniferous biomass: Effect of process parameters on mass and energy yields. J. Anal. Appl. Pyrolysis 2015, 113, 551–556. [Google Scholar] [CrossRef]
  46. Uzun, B.B.; Apaydin-Varol, E.; Ateş, F.; Özbay, N.; Pütün, A.E. Synthetic fuel production from tea waste: Characterisation of bio-oil and bio-char. Fuel 2010, 89, 176–184. [Google Scholar] [CrossRef]
  47. Nizamuddin, S.; Mubarak, N.M.; Tiripathi, M.; Jayakumar, N.S.; Sahu, J.N.; Ganesan, P. Chemical, dielectric and structural characterization of optimized hydrochar produced from hydrothermal carbonization of palm shell. Fuel 2016, 163, 88–97. [Google Scholar] [CrossRef]
  48. Yang, L.; Zhang, A.; Zheng, X. Shrimp Shell Catalyst for Biodiesel Production. Energy Fuels 2009, 23, 3859–3865. [Google Scholar] [CrossRef]
  49. Burnham, A.K. Van Krevelen Diagrams. In Encyclopedia of Petroleum Geoscience; Sorkhabi, R., Ed.; Springer International Publishing: Cham, Switzerlands, 2018; pp. 1–5. [Google Scholar] [CrossRef]
  50. Zulkornain, M.F.; Shamsuddin, A.H.; Normanbhay, S.; Md Saad, J.; Ahmad Zamri, M.F.M. Optimization of rice husk hydrochar via microwave-assisted hydrothermal carbonization: Fuel properties and combustion kinetics. Bioresour. Technol. Rep. 2022, 17, 100888. [Google Scholar] [CrossRef]
  51. Quitain, A.T.; Sato, N.; Daimon, H.; Fujie, K. Production of Valuable Materials by Hydrothermal Treatment of Shrimp Shells. Ind. Eng. Chem. Res. 2001, 40, 5885–5888. [Google Scholar] [CrossRef]
  52. Liu, Z.; Matouri, M.; Zahid, U.; Saldaña, M.D.A. Value-added compounds obtained from shrimp shells using subcritical water with carboxylic acids. J. Supercrit. Fluids 2023, 197, 105902. [Google Scholar] [CrossRef]
  53. Percot, A.; Viton, C.; Domard, A. Optimization of Chitin Extraction from Shrimp Shells. Biomacromolecules 2003, 4, 12–18. [Google Scholar] [CrossRef]
  54. Rødde, R.H.; Einbu, A.; Vårum, K.M. A seasonal study of the chemical composition and chitin quality of shrimp shells obtained from northern shrimp (Pandalus borealis). Carbohydr. Polym. 2008, 71, 388–393. [Google Scholar] [CrossRef]
  55. Lin, Y.; Ma, X.; Peng, X.; Yu, Z.; Fang, S.; Lin, Y.; Fan, Y. Combustion, pyrolysis and char CO2-gasification characteristics of hydrothermal carbonization solid fuel from municipal solid wastes. Fuel 2016, 181, 905–915. [Google Scholar] [CrossRef]
  56. Pahla, G.; Mamvura, T.A.; Ntuli, F.; Muzenda, E. Energy densification of animal waste lignocellulose biomass and raw biomass. S. Afr. J. Chem. Eng. 2017, 24, 168–175. [Google Scholar] [CrossRef]
  57. McKendry, P. Energy production from biomass (part 1): Overview of biomass. Bioresour. Technol. 2002, 83, 37–46. [Google Scholar] [CrossRef]
  58. Chen, X.; Ma, X.; Peng, X.; Lin, Y.; Yao, Z. Conversion of sweet potato waste to solid fuel via hydrothermal carbonization. Bioresour. Technol. 2018, 249, 900–907. [Google Scholar] [CrossRef]
  59. Petrovic, J.; Simic, M.; Mihajlovic, M.; Koprivica, M.; Kojic, M.; Nuic, I. Upgrading fuel potentials of waste biomass via hydrothermal carbonization. Hem. Ind. 2021, 75, 297–305. [Google Scholar] [CrossRef]
  60. Koprivica, M.; Petrović, J.; Ercegović, M.; Simić, M.; Milojković, J.; Šoštarić, T.; Dimitrijević, J. Improvement of combustible characteristics of Paulownia leaves via hydrothermal carbonization. Biomass Convers. Biorefinery 2022. [Google Scholar] [CrossRef]
  61. Sharma, H.B.; Sarmah, A.K.; Dubey, B. Hydrothermal carbonization of renewable waste biomass for solid biofuel production: A discussion on process mechanism, the influence of process parameters, environmental performance and fuel properties of hydrochar. Renew. Sustain. Energy Rev. 2020, 123, 109761. [Google Scholar] [CrossRef]
  62. Afolabi, O.O.D.; Sohail, M.; Thomas, C.P.L. Microwave Hydrothermal Carbonization of Human Biowastes. Waste Biomass Valoriz. 2015, 6, 147–157. [Google Scholar] [CrossRef]
  63. Kaushik, R.; Parshetti, G.K.; Liu, Z.; Balasubramanian, R. Enzyme-assisted hydrothermal treatment of food waste for co-production of hydrochar and bio-oil. Bioresour. Technol. 2014, 168, 267–274. [Google Scholar] [CrossRef] [PubMed]
  64. Kaewtatip, K.; Chiarathanakrit, C.; Riyajan, S.-A. The effects of egg shell and shrimp shell on the properties of baked starch foam. Powder Technol. 2018, 335, 354–359. [Google Scholar] [CrossRef]
  65. Kaya, M.; Baran, T.; Karaarslan, M. A new method for fast chitin extraction from shells of crab, crayfish and shrimp. Nat Prod Res 2015, 29, 1477–1480. [Google Scholar] [CrossRef] [PubMed]
  66. Hong, P.-Z.; Li, S.-D.; Ou, C.-Y.; Li, C.-P.; Yang, L.; Zhang, C.-H. Thermogravimetric analysis of chitosan. J. Appl. Polym. Sci. 2007, 105, 547–551. [Google Scholar] [CrossRef]
  67. Jang, M.-K.; Kong, B.-G.; Jeong, Y.-I.; Lee, C.H.; Nah, J.-W. Physicochemical characterization of α-chitin, β-chitin, and γ-chitin separated from natural resources. J. Polym. Sci. Part A Polym. Chem. 2004, 42, 3423–3432. [Google Scholar] [CrossRef]
  68. Poompradub, S.; Ikeda, Y.; Kokubo, Y.; Shiono, T. Cuttlebone as reinforcing filler for natural rubber. Eur. Polym. J. 2008, 44, 4157–4164. [Google Scholar] [CrossRef]
  69. Poomsawat, S.; Poomsawat, W. Analysis of hydrochar fuel characterization and combustion behavior derived from aquatic biomass via hydrothermal carbonization process. Case Stud. Therm. Eng. 2021, 27, 101255. [Google Scholar] [CrossRef]
  70. Xu, C.D.; Cheng, K.W.E. Examination of bifurcation of the non-linear dynamics in buck-boost converters with input capacitor rectifier. In IET Power Electronics; Institution of Engineering and Technology: London, UK, 2011; Volume 4, pp. 209–217. [Google Scholar]
  71. Healy, M.; Green, A.; Healy, A. Bioprocessing of Marine Crustacean Shell Waste. Acta Biotechnol. 2003, 23, 151–160. [Google Scholar] [CrossRef]
  72. Coates, J. Interpretation of Infrared Spectra, A Practical Approach. In Encyclopedia of Analytical Chemistry; John Wiley & Sons, Inc.: Hoboken, NJ, USA, 2006. [Google Scholar]
  73. Zhang, Y.; Chen, B.; Zhang, L.; Huang, J.; Chen, F.; Yang, Z.; Yao, J.; Zhang, Z. Controlled assembly of Fe3O4 magnetic nanoparticles on graphene oxide. Nanoscale 2011, 3, 1446–1450. [Google Scholar] [CrossRef] [PubMed]
  74. Allison, G.G.; Morris, C.; Hodgson, E.; Jones, J.; Kubacki, M.; Barraclough, T.; Yates, N.; Shield, I.; Bridgwater, A.V.; Donnison, I.S. Measurement of key compositional parameters in two species of energy grass by Fourier transform infrared spectroscopy. Bioresour. Technol. 2009, 100, 6428–6433. [Google Scholar] [CrossRef]
  75. Pavia, D.L.; Lampman, G.M.; Kriz, G.S.; Vyvyan, J.A. Introduction to Spectroscopy; Cengage Learning: Boston, MA, USA, 2014. [Google Scholar]
  76. El Ichi, S.; Zebda, A.; Laaroussi, A.; Reverdy-Bruas, N.; Chaussy, D.; Naceur Belgacem, M.; Cinquin, P.; Martin, D.K. Chitosan improves stability of carbon nanotube biocathodes for glucose biofuel cells. Chem. Commun. 2014, 50, 14535–14538. [Google Scholar] [CrossRef] [PubMed]
  77. Wysokowski, M.; Klapiszewski, Ł.; Moszyński, D.; Bartczak, P.; Szatkowski, T.; Majchrzak, I.; Siwińska-Stefańska, K.; Bazhenov, V.V.; Jesionowski, T. Modification of chitin with kraft lignin and development of new biosorbents for removal of cadmium(II) and nickel(II) ions. Mar. Drugs 2014, 12, 2245–2268. [Google Scholar] [CrossRef] [Green Version]
  78. Chen, B.; Zhou, D.; Zhu, L. Transitional Adsorption and Partition of Nonpolar and Polar Aromatic Contaminants by Biochars of Pine Needles with Different Pyrolytic Temperatures. Environ. Sci. Technol. 2008, 42, 5137–5143. [Google Scholar] [CrossRef] [PubMed]
Figure 1. (a) Van Krevelen diagram; (b) modified van Krevelen diagram of raw SS and hydrochar samples.
Energies 16 05534 g001
Figure 2. DTG thermograms results for raw SS and hydrochar at different temperatures.
Energies 16 05534 g002
Table 1. Ultimate, proximate analysis, and energy characterization for SS hydrochar samples along with process liquid (PL) characterization.
Sample IDMass Yield (%)Elemental AnalysisBomb Calorimetry AnalysisPL Characterization
C (%)H (%)N (%)S (%)O (%)Ash (%)Fuel RatioHHVdaf (MJ/kg)EYED (GJ/m3)EDRpHNH4+
(mg/L)
Raw-SS10038.60 ± 0.376.17 ± 0.088.44 ± 0.310.71 ± 0.0329.07 ± 0.016.99 ± 0.390.08224.6 ± 0.2100 ± 0.022.1 ± 0.51.0 ± 0.0--
SS-11054.3 ± 9.442.60 ± 0.326.15 ± 0.106.61 ± 0.310.61 ± 0.0122.24 ± 0.021.79 ± 0.320.06724.5 ± 0.154.19 ± 0.0325.1 ± 0.20.998 ± 0.007.54.6
SS-14053.4 ± 9.643.70 ± 0.296.34 ± 0.086.15 ± 0.230.55 ± 0.0119.47 ± 0.023.79 ± 0.440.06625.1 ± 0.154.46 ± 0.0224.0 ± 0.21.02 ± 0.008.46.2
SS-17032.0 ± 0.341.86 ± 1.395.98 ± 0.194.65 ± 0.010.60 ± 0.0219.94 ± 0.026.97 ± 0.260.04226.9 ± 0.434.88 ± 0.521.4 ± 0.41.09 ± 0.027.813.4
SS-20031.3 ± 4.441.32 ± 0.405.81 ± 0.114.17 ± 0.050.59 ± 0.0319.74 ± 0.028.37 ± 0.430.0526.0 ± 0.733.17 ± 0.0421.4 ± 0.41.06 ± 0.037.812.3
SS-23031.3 ± 4.440.35 ± 0.975.65 ± 0.113.47 ± 0.080.74 ± 0.0217.22 ± 0.032.57 ± 0.370.04426.2 ± 0.433.18 ± 0.0220.2 ± 0.31.06 ± 0.208.912.3
SS-26025.7 ± 5.641.26 ± 0.445.56 ± 0.103.56 ± 0.010.73 ± 0.0714.61 ± 0.034.28 ± 0.900.02827.2 ± 0.428.27 ± 0.0519.4 ± 0.11.10 ± 0.209.217.1
SS-29036.0 ± 4.242.19 ± 1.365.48 ± 0.223.87 ± 0.140.61 ± 0.0511.28 ± 0.036.57 ± 0.560.01727.9 ± 0.440.68 ± 0.0719.7 ± 0.11.13 ± 0.029.119.1
HHVdaf: HHV in dry ash fraction.
Table 2. Combustion characteristics of raw SS and hydrochar samples.
Sample IDTi (°C)Tm (°C)Tb (°C)ti (min)tmax (min)tb
(min)
Δt1/2
(min)
Di (%/min3)Db × 10−3 (%/min3)Si × 10−7 (%2/°C3.min2)
Raw SS2253677629.516.636.426.70.040.182.67
SS-1102303707459.816.835.514.20.060.584.2
SS-14025037574810.817.035.718.50.060.493.9
SS-17028037575212.317.035.918.40.060.543.26
SS-20029037576012.817.036.318.10.060.573.02
SS-23027537475512.017.036.015.60.070.703.48
SS-26027537777512.017.137.018.10.060.563.22
SS-29026038177511.317.337.018.50.050.432.73
Table 3. Slagging (s) and fouling (f) indices of raw SS and hydrochar samples.
Sample IDSIFISVAlCl
Raw SSextremely highextremely highhighs and f occurextremely high
SS-110extremely highextremely highhighs and f occurextremely high
SS-140lowlowhighlowlow
SS-170extremely highlowhighs or f probablelow
SS-200extremely highlowhighs or f probablelow
SS-230lowlowhighlowlow
SS-260lowlowhighlowlow
SS-290extremely highlowhighs or f probablelow
Disclaimer/Publisher’s Note: The statements, opinions and data contained in all publications are solely those of the individual author(s) and contributor(s) and not of MDPI and/or the editor(s). MDPI and/or the editor(s) disclaim responsibility for any injury to people or property resulting from any ideas, methods, instructions or products referred to in the content.

