Article

Techno-Economic Potential of V2B in a Neighborhood, Considering Tariff Models and Battery Cycle Limits

by
Yannick Pohlmann
* and
Carl-Friedrich Klinck
Fraunhofer Institute for Manufacturing Technology and Advanced Materials IFAM, Wiener Straße 12, 28359 Bremen, Germany
*
Author to whom correspondence should be addressed.
Energies 2023, 16(11), 4387; https://doi.org/10.3390/en16114387
Submission received: 12 April 2023 / Revised: 19 May 2023 / Accepted: 23 May 2023 / Published: 29 May 2023

Abstract

:
To limit climate change, decarbonization of the transportation sector is necessary. The change from conventional combustion vehicles to vehicles with electric drives is already taking place. In the long term, it can be assumed that a large proportion of passenger cars will be battery–electric. On the one hand, this conversion will result in higher energy and power requirements for the electricity network; on the other hand, it also offers the potential for vehicles to provide energy for various systems in the future. Battery–electric vehicles can be used to shift grid purchases, optimize the operation of other components and increase the self-consumption rate of photovoltaic systems. An LP model for the optimal energy management of the neighborhood consisting of buildings with electricity and heat demand, a PV system, a BEV fleet, a heat pump and thermal storage was formulated. The potential of the BEV fleet to provide energy via V2B in the neighborhood was investigated, considering electricity tariff models and individual charging/discharging efficiencies of vehicles and stochastic mobility profiles. The vehicle fleet provides between 4.8 kWh −1 sqm −1 a (flat-fee) and 25.3 kWh −1 sqm −1 a (dynamic tariff) per year, corresponding to 6.7, 9.5% and 35.7% of the annual energy demand of the neighborhood. All tariff models lead to optimization of self-consumption in summer. Dynamic pricing also leads to arbitrage during winter, and a power price tariff avoids peaks in grid draw. Due to individual charging efficiencies, the power supplied by the fleet is distributed unevenly among the vehicles, and setting limits for additional equivalent full cycles distributes the energy more evenly across the fleet. The limits affect the V2B potential, especially below the limits of 20 yearly cycles for flat and power tariffs and below 80 cycles for a dynamic tariff.

1. Introduction

To halt man-made climate change, it is necessary to reduce global greenhouse gas emissions to net zero in the coming years. Since more than 80% of emissions are energy-related [1], this results in an immense need for the expansion of renewable energies. In Germany alone, only one of many industrialized nations, wind energy and photovoltaic (PV) plants with an installed capacity of between 500 and 750 GWel must be built [2] to reduce emissions by 95% by 2050 [2]. Furthermore, to balance load fluctuations, there is a need for 100 to 160 GWel of controllable electric power plant capacity and stationary battery storage totaling 50 to 400 GWhel [2]. This illustrates the scale of the challenge of decarbonizing the energy system.
As part of the decarbonization of the transport sector, battery–electric vehicles are accounting for steadily higher market shares and could reach a market volume of 50 to 75 million vehicles worldwide by 2025 according to analyses by the International Energy Agency [3]. However, this expansion can have a negative impact on the stability of the power grid if many vehicles charge at the same time [4]. Because cars are not moving for more than 23 h a day on average [5], it is possible to integrate battery–electric vehicles as distributed energy storage in a future energy system. Technologies to provide energy or power to the power grid or other consumers using battery electric vehicles are called vehicle-to-home (V2H), vehicle-to-building (V2B) or vehicle-to-grid (V2G) systems [6]. Providing electrical energy to multiple buildings via electric cars can help to shift and shave peaks and increase self-consumption of renewable energies in microgrids, helping to balance the fluctuating energy supply of renewable energies [7]. Therefore, electric vehicles could also reduce the amount of stationary batteries required to decarbonize the energy system.
One challenge of energy provision using vehicles is that electric vehicles are not always available for the on-site energy exchange. If several vehicles are used to provide energy for different consumers, the problem can be offset by differing consumption and mobility behavior, thus increasing the potential of feedback-capable vehicles. For this reason, sharing multiple vehicle batteries for multiple buildings, i.e., a V2B implementation in a neighborhood, is of particular interest. However, according to a literature review by [7], V2B is less studied than V2G. Therefore, focused our study on a small neighborhood with mixed commercial and residential buildings with a heat pump, a photovoltaic system and an electric vehicle fleet in which the optimal operating strategy is determined for the whole neighborhood.

1.1. Related Work

Within the framework of a literature review, existing literature was examined for the following similarities in this study. Studies investigating several vehicles with different driving profiles, several buildings with different load profiles, different pricing models, an annual potential and joint optimization of heat and electricity were considered. The most relevant studies with regard to these questions are presented below.
Kobashi et al. [8] presented the SolarEV City concept, in which photovoltaic systems (PV) and electric vehicles (EVs) are used to supply the energy needs of a city, with EVs used as storage. The study was carried out for nine urban areas of Japan. The concept can increase self-sufficiency from between 20% and 30% to between 50% and 90%, depending on the district (if a feed-in tariff is considered). The self-consumption rate can also be increased from between 20% and 60% to between 55% and 95%. It can also decrease cost and CO 2 emissions. Based on their SolarEV City concept, Kobashi et al. [9] showed how much which districts of Japanese cities could benefit from integrated “PV + EV” systems. Aggregated energy demand profiles were created for heating and electricity of the simulated districts. Systems with PV and stationary batteries and systems with PV with bidirectional charging were evaluated. The EVs were not modeled individually but as stationary storage with time-dependent capacity due to vehicle driving patterns. The authors assumed that EV availability is mitigated in a system with more than 40 EVs. Tariffs for residential and industrial customers with and without feed-in tariffs were applied. The NPV for different system configurations was calculated, and the optimal system was analyzed. The authors concluded that utilizing EVs as storage is more economical for households than for commercial buildings. Chang et al. [10] applied the aforementioned concept of “PV + EV” to five areas in the Republic of Korea. The concept was found to achieve self-consumption rates of up to 95% and self-sufficiency rates of up to 75%. Ginigeme and Wang [11] studied the impact of the pricing model (minimizing the maximum grid purchase power, as well as minimizing the variance of the grid purchase) for one day, taking into account battery degradation and a real-time electricity price. The peak grid demand was reduced by 7.8%, and the variance of the grid demand was reduced by 81.9%. EVs can fully offset the battery degradation costs when feeding back energy. Nguyen and Le [12], on the contrary, investigated the simultaneous optimization of charging (and discharging) an electric vehicle and thermal systems. A thermodynamic model of a building and a temperature comfort range were used to calculate the thermal load. The cooling load in the optimization model was controlled by penalty costs for deviating from the comfort zone. The model was found to be able to reduce the electric energy demand during peak hours. Biroon et al. [13] presented two optimization models for charging and discharging electric vehicles. A maximum price model was used, and it was found that the electricity price model and the connection time of the electric vehicles at the charging point have a key influence on the grid load. Das et al. [14] conducted a multiobjective technoeconomic environmental optimization study to schedule the charging and discharging of an electric vehicle. Energy cost, battery degradation, grid interaction, CO 2 emissions, frequency regulation services and a real-time price were considered. Eight days from four seasons were investigated in the study. One scenario also included peak demand charges. The framework was able to optimize the grid operation while also minimizing battery degradation. Zenginis et al. [15] presented a model for optimal sizing and power management of a microgrid, utilizing the Nash bargain method. They took into account different building demands, PV, charging and discharging of EVs and stationary energy storage. The presented approach was found to reduce the operational cost by up to 34.6% for the studied microgrid in Barcelona. Borge-Diez et al. [16] presented a case study proposing a V2B operating strategy whereby cars are charged during the night at private homes and discharged during the day at the workplace. The authors evaluated energy cost savings and battery degradation. The method was found to reduce peak demand and energy costs; furthermore, the V2B can repay between 55% and 103% of the energy cost. Quddus et al. [17] proposed a collaborative decision model to optimize the operation strategy of an energy system consisting of multiple commercial buildings and EV charging stations, taking into account demand uncertainties. Heating and cooling loads of the building were also taken into account, with buildings operating on photovoltaic systems, combined heat and power units, stationary batteries and thermal energy storage. A case study (in the City of San Francisco) was conducted to show that collaborative optimization can lead to a decrease in operating costs. Buonomano [18] proposed a concept whereby electric energy is exchanged between buildings, utilizing electric vehicles as energy vectors. The goal was to reduce the energy demands of buildings to near zero on a microgrid level. A case study of an energy system was presented, consisting of two buildings (residential and office), PV systems, one electric vehicle and stationary battery storage. While the energy supply from the grid can be significantly reduced, the scheme is not yet profitable under the assumed energy and battery costs. Wang et al. [19] presented a vehicle-to-microgrid system in which the power demands of an off-electricity-grid building are supplied by a combination of PV, wind energy and a CHP unit/fuel cell. EVs, fuel-cell EVs and thermal units are used as storage. The EVs are charged with 487 MWh annually, supplying 166 MWh to the building, considering a building electricity load of 189.5   MWh . Cardoso et al. [20] proposed an aggregator model for an EV fleet that can handle investment and operation problems of distributed energy resources. The authors presented a case study in which the energy demands of a medium-sized office building in San Francisco are fulfilled by several energy resources, including heat resources, electricity resources and EVs. A time-of-use tariff and driving schedules from a US commuting survey were utilized. In the case study, investment in EV energy storage was preferred over stationary energy storage. The peak shaving ability of EV energy storage during a summer week was reported. Zhou et al. [21] presented a multicriteria optimization method of energy management in an energy-sharing network consisting of buildings and vehicles. The energy system features building-integrated PV, nearby wind turbines and static batteries; the vehicle comprise electric shuttle buses and electric passenger cars. A special emphasis was placed on the battery degradation model due to the charging and discharging of the battery. A high-rise office building and a high-rise hotel located in Hong Kong with corresponding electricity demand, cooling demand and heating demand were considered. The energy supplied by stationary and mobile batteries ranged between 27.9   kWh −1 sqm −1 a and 33.4   kWh −1 sqm −1 a , while mobile batteries supplied between 85.6% and 94.1% of this energy. In [22], the author presented a similar study but additionally considered commercial and residential buildings with rooftop and building-integrated PV and wind turbines. It was reported that V2B can reduce the annual import of electricity by 1.3% and electricity export by 2.0%. Guo et al. [23] presented a model-predictive control approach for a multienergy system consisting of an electric vehicle fleet connected to offices in one scenario and residential buildings in a different scenario, as well as electric and thermal loads of buildings. In addition, CHP units supply electricity and heat locally. Moura et al. [24] developed an optimization model to manage the power flows in larger building complexes, taking into account feedback-capable electric vehicles (B2V and V2B) and current legal regulations in Portugal. The authors showed that the approach leads to a maximization of the matching between local electricity production and electricity consumption, which is associated with an average reduction in total costs of 22.3% in the considered scenarios compared to the so-called baseline scenarios. Schreck et al. [25] studied the effects of grid tariff designs in a local energy market with photovoltaics, electric vehicles, heat pumps and stationary storage. They took into account energy-based fees, topology-based fees and time-variable fees. They concluded that power fees can reduce the demand peaks by 30% to 60% and feed-in peaks by 46% to 64%. Furthermore, they concluded that time-variable fees might increase demand peaks compared to flat fees. Ahsan et al. [26] proposed a framework that optimizes the profits of an energy system consisting of a main building with PV systems, stationary battery storage and 15 EVs, with other buildings also served by the main building. The profits of the main building were increased by up to 62%, while the two secondary buildings can achieve cost decreases of up to 20%. Furthermore, EVs save between 35% and 65% in charging costs. It was shown that bilateral contracts for prosumers and consumers can lead to benefits for both. Kern et al. [27] analyzed the potential of vehicle-to-home and vehicle-to-grid arbitrage trading for a single-family household and a single EV complemented by a PV system, stationary battery storage and a heat pump. They concluded that V2H is mostly conducted during summer months (over 90%) and that V2G arbitrage trading is more profitable during winter months. It was also concluded that non-linear (dis)charging efficiencies lead to a 30% decrease in V2H potential. Singh and Singh [28] developed an MINLP model to optimize welfare in two different microgrids consisting of active users, inactive users and two types of prosumers. Welfare takes into account personal, societal and environmental benefits. The introduction of prosumers can increase welfare; furthermore, they can also achieve grid independence during peak price hours. Higashitani et al. [29] analyzed the profitability and energy provision potential of V2H. Different electricity demand profiles, PV system sizes and vehicle driving patterns were taken into account. It was concluded that V2H is economically preferred over stationary storage. In addition, a larger PV size and shorter EV absence are economically beneficial for V2H. Moura et al. [30] analyzed energy sharing in microgrids through local energy markets. A university campus in Portugal was considered in simulation scenarios. The energy system consisted of campus buildings, PV systems, stationary battery storage and EV energy storage (workplace charging). Optimization led to an increase in the self-consumption of the PV system, as well as lower electricity costs. Shen et al. [31] presented an algorithm to optimize the energy management of a microgrid in real time. The microgrid consisted of buildings with electricity and heat demands, a CHP unit, a water tank and a boiler. The microgrid was connected to the public power grid, with local renewable energy and an EV charging station serving as a storage. It was shown that the proposed algorithm can find an asymptotically optimal solution with limited information. For a broader review of V2B, the reader is referred to [7].

1.2. Scope and Contribution

In the course of the literature analysis, it became clear that few studies consider all aspects described above at the same time, including limiting yearly feedback cycles, different electric vehicle types with different driving patterns and showing the annualized potential of combined V2B in a neighborhood while also showing the contributions of individual vehicles.
In some of the presented studies, a battery degradation model was utilized. However, it was recently reported that an OEM plans to limit simply the amount of energy that can be applied by an electric vehicle to 10,000 kWh (and 4000 h) per battery lifetime or about 130 battery-equivalent full cycles if a 77 kWh battery is considered [32]. In this context, it would be of interest to conduct V2B studies from the perspective of limited additional equivalent full battery cycles per vehicle battery to answer the questions of how many cycles would be needed in practice and how the limitation influences the potential.
To fill the analyzed gap in the reviewed literature, in this paper, we evaluate the potential of V2B in a small neighborhood in Germany with a focus on the aforementioned aspects.
In this paper, the optimal operating strategy for the neighborhood is presented considering seasonal demand variability of different residential and commercial load profiles, economic incentives through tariff designs, individual driving patterns, technical properties of EVs and combined optimization of power and heat. The individual annual contribution of EVs is analyzed; instead of applying a battery degradation model, we show the effects of limiting the yearly energy fed back (equivalent full cycles) by individual EVs. Limiting the annual amount of energy that can be supplied by each vehicle could be more easily implemented in practice.

2. Modeling

The energy system, which is shown in Figure 1, is modeled in the form of an optimization problem. For this purpose, a linear problem is set up with OR-Tools (version 9.0.9048) and solved with the GLOP solver [33]. It is assumed that all information for a year regarding energy demands, weather, solar radiation and mobility behavior is known to the model in advance so that the theoretically possible technoeconomic potential of optimizing the operation strategy can be determined. The time-step length of the model is ten minutes.

2.1. Objective Function

According to Equation (1), the objective function minimizes the energy costs of the entire neighborhood, including the costs of charging the electric vehicles. These consist of the sums of the energy purchase costs, the feed-in tariffs and a battery usage fee summed up over the simulation periods:
m i n K e = t T c e l e c , t × E g n , t t T c e l e c , f e e d i n , t × E n g , t + t T b e v C c v 2 h × E b e v n , t
The energy purchase cost in time unit t is calculated as the product of the electricity price ( c e l e c , t ) and the energy flow ( E g n , t ) from the grid (g) to the node (n). In turn, the feed-in tariffs are composed of the product of the feed-in tariff ( c e l e c , f e e d i n , t ) and the energy flow ( E n g , t ) from the node (n) into the grid (g). The compensation for the energy provided by the vehicles is given by the price per amount of energy provided ( c v 2 h ) and the corresponding energy flow ( E b e v n , t ) from the vehicle ( b e v ) into the node (n).
Provided that the power price is used, the objective function is extended according to Equation (2) by the term of the cost for the maximum grid procurement ( K p ):
m i n K e + K p = K e + i = 1 12 E m a x , g n , i × c m a x , p o w e r
The power price is calculated for each month of the calculation period and summed up over all months (i) of the year. The price of a month (i) results from the product of the maximum energy flow of the month ( E m a x , g n , i ) and the price per maximum energy flow ( c m a x , p o w e r ).

2.2. Constraints

In the following, the constraints are presented component by component. First, in inequality Equation (3), the condition used to determine the maximum power flow of each month is established. The auxiliary variable for the maximum power drawn ( E m a x , g n , i ) must be greater than all grid power draws ( E g n , t ) in month i.
E m a x , g n , i = 1 12 E g n , t t s t a r t , i = 1 , , 12 t t e n d , i = 1 , , 12
Furthermore, the conservation of electrical energy represented by Equation (4) must be satisfied for each time step. Since the energy of each energy type is exchanged through nodes, the sum of the in-flowing and out-flowing energy of each node must be zero in each time unit (t).
0 = t T ( b e v C ( η b e v × E b e v n , t + E n b e v , t ) + E n h p , t + E n i w h , t + E g n , t + E n g , t + p v P E p v n , t + b u i l d B E n b u i l d , t )
where E b e v n , t describes the energy flow from vehicle b e v into node n, and C is the set of all vehicles, where for each vehicle, the associated discharge efficiency ( η b e v ) is considered. E n b e v , t is the energy flowing into the vehicle ( b e v ). Furthermore, E n h p t represents the energy flow from node n into the air-to-water heat pump ( h p ), and E n i w h , t represents the energy flow from node n into the water heater ( i w h ). The energy provided by the PV system ( p v ) is represented by E p v n , t , where P is the set of all PV systems. In addition, the energy flow ( E n b u i l d , t ) from node n into each building ( b u i l d ) from the set of buildings ( B ) is considered. The grid power draw is represented by E g n , t , and the grid feed-in is represented by E n g , t . PV feed-in, as well as V2G, is permitted.
Equation (5) describes the conservation of energy for thermal energy in the neighborhood.
0 = t T η t h × Q t h n , t + Q n t h , t + Q h p n , t + Q i w h n , t + b u i l d B Q n b u i l d , t
where Q t h n , t is the energy flow from the thermal storage ( t h ) into the node (n), considering the charging efficiency ( η t h ). The energy flow into the thermal storage is represented by the variable Q n t h , t . Q h p n , t describes the energy flow from the heat pump ( h p ) into node n, and Q i w h n , t describes the energy flow from the instantaneous water heater ( i w h ) into node n. Additional constraints are imposed on a component-by-component basis.
Two conditions arise for the PV system. First, according to inequality Equation (6), the energy supplied to the node ( E p v n , t ) must not be larger than the product of the solar radiation on the tilted surface ( Q r a d p v , t ), the efficiency of the PV panels at time t η p v , t and the efficiency of the inverter ( η i n v ).
E p v n , t η i n v × η p v , t × Q r a d p v , t t T
Second, according to inequality (7), the energy supply must not exceed the capacity of the inverter at any time.
E p v n , t E m a x , i n v
For the buildings, it must be specified that the energy flowing from the node into the buildings must always be equal to the energy demand calculated in advance—for the electricity and heat flows (see Equations (8) and (9)):
E n b u i l d , t = E b u i l d , r e q , t t T
Q n b u i l d , t = Q b u i l d , r e q , t t T
As specified in the constraints of Equations (10) and (11), the maximum thermal charging and discharging power ( Q t h , m a x ) of the thermal storage must not be exceeded when charging ( Q n t h , t ) and discharging ( Q t h n , t ) the storage.
Q n t h , t Q t h , m a x t T
Q t h n , t Q t h , m a x t T
At the same time, the storage temperature ( T t h , t ) must be within maximum and minimum temperatures ( T m a x , t h and T m i n , t h , respectively) at all times (inequality Equation (12)), and an initial storage level ( T t h , i n i t ) must be defined for time step t = 0 (Equation (13)).
T m i n , t h T t h , t T m a x , t h t T
T t h , t = 0 = T t h , i n i t
Furthermore, in the constraint of Equation (14), the energy balance of the thermal storage is set.
c p × m t h × ( T t h , t T t 1 , t h ) = η t h × Q n t h , t 1 Q t h n , t 1 α × A × ( T t 1 , t h T e n v ) t T { 0 } { | T | }
The product of the change of the storage temperature ( T t T t 1 ) and the heat capacity of the thermal storage ( c p × m t h ) is equal to the product of the charging efficiency of the storage ( η t h ) and the energy supplied to the storage ( Q n t h , t 1 ) minus the energy extracted from the storage ( Q t h n , t 1 ) and the energy loss of the storage. The cooling of the thermal storage is defined according to Newton’s cooling law as the product of heat transfer coefficient ( α ), the storage tank surface (A) and the temperature difference relative to the environment ( T t 1 T e n v ). Since this balance equation is formulated recursively, this storage balance equation must additionally be introduced for the time step after the end of the simulation period ( T ) to limit the energy flows of the storage in the last time step.
For electric vehicles, it must also be ensured that the maximum charging and discharging powers ( E b e v , m a x ) are not violated (constraints of Equations (15) and (16)). Furthermore, it is necessary to ensure that the minimum and maximum states of energy are not exceeded (constraint of Equations (17)) and that the initial states of energy ( S o E b e v , m a x ) are defined (constraint of Equation (18)).
E n b e v , t E b e v , m a x t T
E b e v n , t E b e v , m a x t T
0 S o E b e v , t S o E b e v , m a x t T
S o E b e v , t = 0 = S o E b e v , i n i t
In addition, a balance equation for the storage level of the b e v is introduced in Equation (19).
0 = S o E b e v , t S o E b e v , t 1 × ζ b e v + E b e v n , t 1 + η b e v × E n b e v , t 1 d b e v × D b e v , t t T \ { 0 } { | T | }
Equivalent to thermal storage, the storage level of the previous time step ( S o E b e v , t 1 ) is multiplied by the storage efficiency ( ζ b e v ) to represent the self-discharge of the storage. Furthermore, the energy demand of the vehicle ( b e v ) during trips is represented by the product of energy demand per distance traveled ( d b e v ) and distance traveled ( D b e v , t ) in time unit t. The set of driving profiles (D) is determined in advance of the simulation based on assumptions about mobility behavior.
Vehicle loading is only allowed based on the constraint of Equation (20) if the vehicle is at home ( λ b e v , a t h o m e = 1 ). Furthermore, if the vehicle is capable of feeding back power ( λ b e v , V 2 H = 1 ), discharging the vehicle is only allowed if the vehicle is at home (constraint of Equation (21)).
E b e v , m a x × λ b e v , a t h o m e E n b e v , t t T
E b e v n , t E b e v , m a x × λ b e v , a t h o m e × λ b e v , V 2 H t T
Further constraints are introduced for the air–water heat pump. According to the constraint of Equation (22), the ratio of provided thermal energy to received electrical energy must always correspond to the C o P .
Q h p n , t = C o P t × E n h p , t t T
where the parameter C o P t is calculated in advance of the simulation depending on the source and supply temperature. Furthermore, as shown in the constraint of Equation (23), the maximum power of the heat pump ( Q h p , m a x , t ) must not be exceeded. This also depends on the source and supply temperature and is calculated in advance of the simulation.
Q h p n , t Q h p , m a x , t t T
For the flow heater, similar constraints of Equations (24) and (25) for the efficiency and maximum power can be formulated.
Q i w h n , t = η i w h × E n i w h , t t T
Q i w h n , t Q i w h , m a x t T

3. Parameterization of the Model

The weather dataused in the model are taken from the test reference years of the German Weather Service (Deutscher Wetterdienst, DWD) [34]. Here, the calculated average year 2045 was used, which already includes climate change forecasts. A location at the center of Germany was assumed (latitude, 51.53; longitude, 9.92).
A mixed residential and commercial neighborhood is assumed, and the building loads for electrical energy and thermal energy were modeled based on standard load profiles from the German Federal Association of Energy and Water Industries (BDEW). Detailed descriptions of the profiles can be found in [35,36,37]. The composition of the neighborhood, including electricity and heat demands, is shown in Table 1, as well as the assumed floor areas and the standard load profiles. The size of the neighborhood was chosen with the goal of maximizing the number of battery–electric vehicles under the condition that the solver still achieves a reasonable solving time. These assumptions result in a total annual electricity demand of 187 MWh and a heat demand of 154 MWh per year.
To model the PV system, the global radiation taken from the test reference years must be converted to the radiation on the tilted plane of the PV modules. For this purpose, an algorithm proposed in [38] was used. It was assumed that the floor area of the neighborhood of 3997 m 2 extends over three floors, resulting in a building footprint of 1332 m 2. Together with an assumed utilization rate of the flat roof area of 50% and a PV module size of 1.84   m 2, this results in a maximum possible module number of 362. It is further assumed that 162 of these modules are oriented toward the south and with a tilt of 35°, whereas 100 modules with a module tilt of 15° are oriented toward the east and west. The other module properties were taken from a manufacturer’s data sheet and are shown in Table A1. A model proposed in [39] was used to calculate the temperature-dependent efficiency. Combined with the above radiation data, this results in an annual energy supply of 154 MWh , where 48% corresponds to fields with southern orientation, 27% to the fields have a western orientation and 25% of the fields have an eastern orientation.
A vehicle fleet of 26 battery–electric vehicles was determined by random selection based on registration figures from the German Federal Motor Transport Authority (see [40]). The technical characteristics of the vehicles relevant for the calculations (battery size, energy requirement and maximum charging power) were determined based on the results of the ADAC eco-Test (see [41]) and manufacturer data sheets. Furthermore, the maximum possible AC charging power and efficiencies of the vehicles were taken into account for both charging and discharging. The driving profiles of the vehicles were determined randomly based on data from the study Mobility in Germany (Mobilität in Deutschland, MiD) [5]. However, the maximum trip length was limited to 100 km , and for longer trips it was assumed that additional charging facilities outside the neighborhood are used. Hence, the average annual driving length was limited to 8785 km . The vehicles are at home between 69.5% and 88.3% of the time. With this he combination of vehicles and the assigned mobility profiles, all vehicles have a combined charging demand of about 44 MWh /a. For the air-to-water heat pump, the C o P , electrical power consumption and heat output were modeled based on manufacturer catalog data [42]. Accordingly, a regression calculation was performed. For the C o P as a function of outside temperature ( T outside ) and supply temperature ( T supply ), the formula shown in Equation (26) was obtained. Similarly, the formula for the maximum heat power was obtained, which is shown in Appendix B.
C o P = 8.404 + 5.257 × 10 5 × T outside 2 + 1.446 × 10 3 × T supply 2 1.730 × 10 3 × T outside × T supply + 1.482 × 10 1 × T outside 1.902 × 10 1 × T supply
Furthermore, the characteristics of the heat pump were scaled to the required heating power output of the neighborhood. The heat pump was sized with the aim of covering 95% of the heating load requirements over time of the neighborhood in a bivalent monoenergetic operation. This resulted in a heating load of 50 kWth at an outdoor temperature of 2 °C. As the supply temperature also depends on the outside temperature, a relation between these two parameters was obtained with data from ([43], p. 59); the formula is shown in Appendix C.
Additionally, an electrically operated instantaneous water heater with an efficiency of is 98% was assumed to supply the remaining heating load.
The thermal storage for buffering the generated heat was sized to a volume of 10,000 L. The heat retention losses were assumed to be such that the storage tank meets the European Energy Efficiency Class A for thermal storage tanks (see [44]), resulting in retention losses of 131.1   W at a storage tank temperature of 60 °C. Therefore, the term α × A from constraint of Equation (14), i.e., the product of the heat transfer coefficient and storage surface, results in 0.547091.
To model the energy tariff, three alternative models were considered for the electricity price: a flat tariff, a dynamic tariff and a peak power tariff. The flat tariff was assumed to be constant at 0.35 kWh −1. For the full dynamic tariff, a mean price of 0.35 kWh −1 was also chosen, but because dynamic tariffs in Germany are not yet widely established, the behavior for the time variation was assumed to be similar to that of a standard load profile [36] so that there is a high price at times of high electricity demand (and vice versa) and one arbitrage opportunity with a high enough price spread per day. The dynamic price is also always above the feed-in tariff in order to discourage V2G.
For the peak power tariff, the electricity price was divided into an energy price component and a maximum power component. The energy price was determined according to data from the BDEW electricity price analysis [45]. In the period from 2012 to 2021, for example, network charges amounted to approx. 25% of the total price. By subtracting this share from the total price, the work price is 0.263 kWh −1. The power price share for the maximum grid power demand was determined based on monthly power prices of German grid operators and converted to an effective electricity price of 0.35 kWh −1, which amounts to 14.65 kW −1 in the simulation. The monthly power price provides an ongoing incentive to reduce the maximum power drawn from the grid.
For the feed-in tariff of the PV system, a tariff at the power market level was assumed. Based on the electricity price analysis, the electricity market prices in Germany averaged 24.27% of the retail electricity price from 2012 to 2021. In combination with the aforementioned electricity price of 0.35 kWh −1, this results in a feed-in tariff at the power market level of 0.085 kWh −1.

4. Scenarios

To determine both the potential of V2B in the neighborhood and the optimal operating strategy, three so-called baseline scenarios were established based on the three tariff models already presented. Each of these baseline scenarios was also combined with both unidirectional and bidirectional electric vehicles, resulting in the following six scenarios that form the basis of the simulation calculations carried out in the following section. An overview of the scenarios is given in Table 2. The number stands for the price model the letters a and b describe the feed-back capability.
These baseline scenarios also allow for comparison of the effects of V2B with those reported in other studies. In further scenarios, yearly limits on additional full equivalent battery cycles are applied.

5. Results

In the following, the calculated sums of the energy flows in the neighborhood during one year are analyzed for the six individual scenarios, depending on the price models and the ability to feed back energy. Furthermore, the grid power demand of the neighborhood resulting from the scenarios is analyzed, and the distribution of the fed-back energy to the vehicle fleet is investigated. Finally, the energy flows in the neighborhood over a week in both summer and winter are brought into focus, and the optimal operating strategy, as well as the temporal course of the feedback, is examined. Furthermore, the limitation of battery cycles in the case of regenerative power supplied by the vehicle fleet is analyzed.

5.1. Yearly Energy Flows in the Six Scenarios

As mentioned earlier, the building electricity demand in all six scenarios is about 154 MWh /a, and the building heat demand is about 187 MWh /a. In addition, the PV system always provides about 154 MWh of energy.
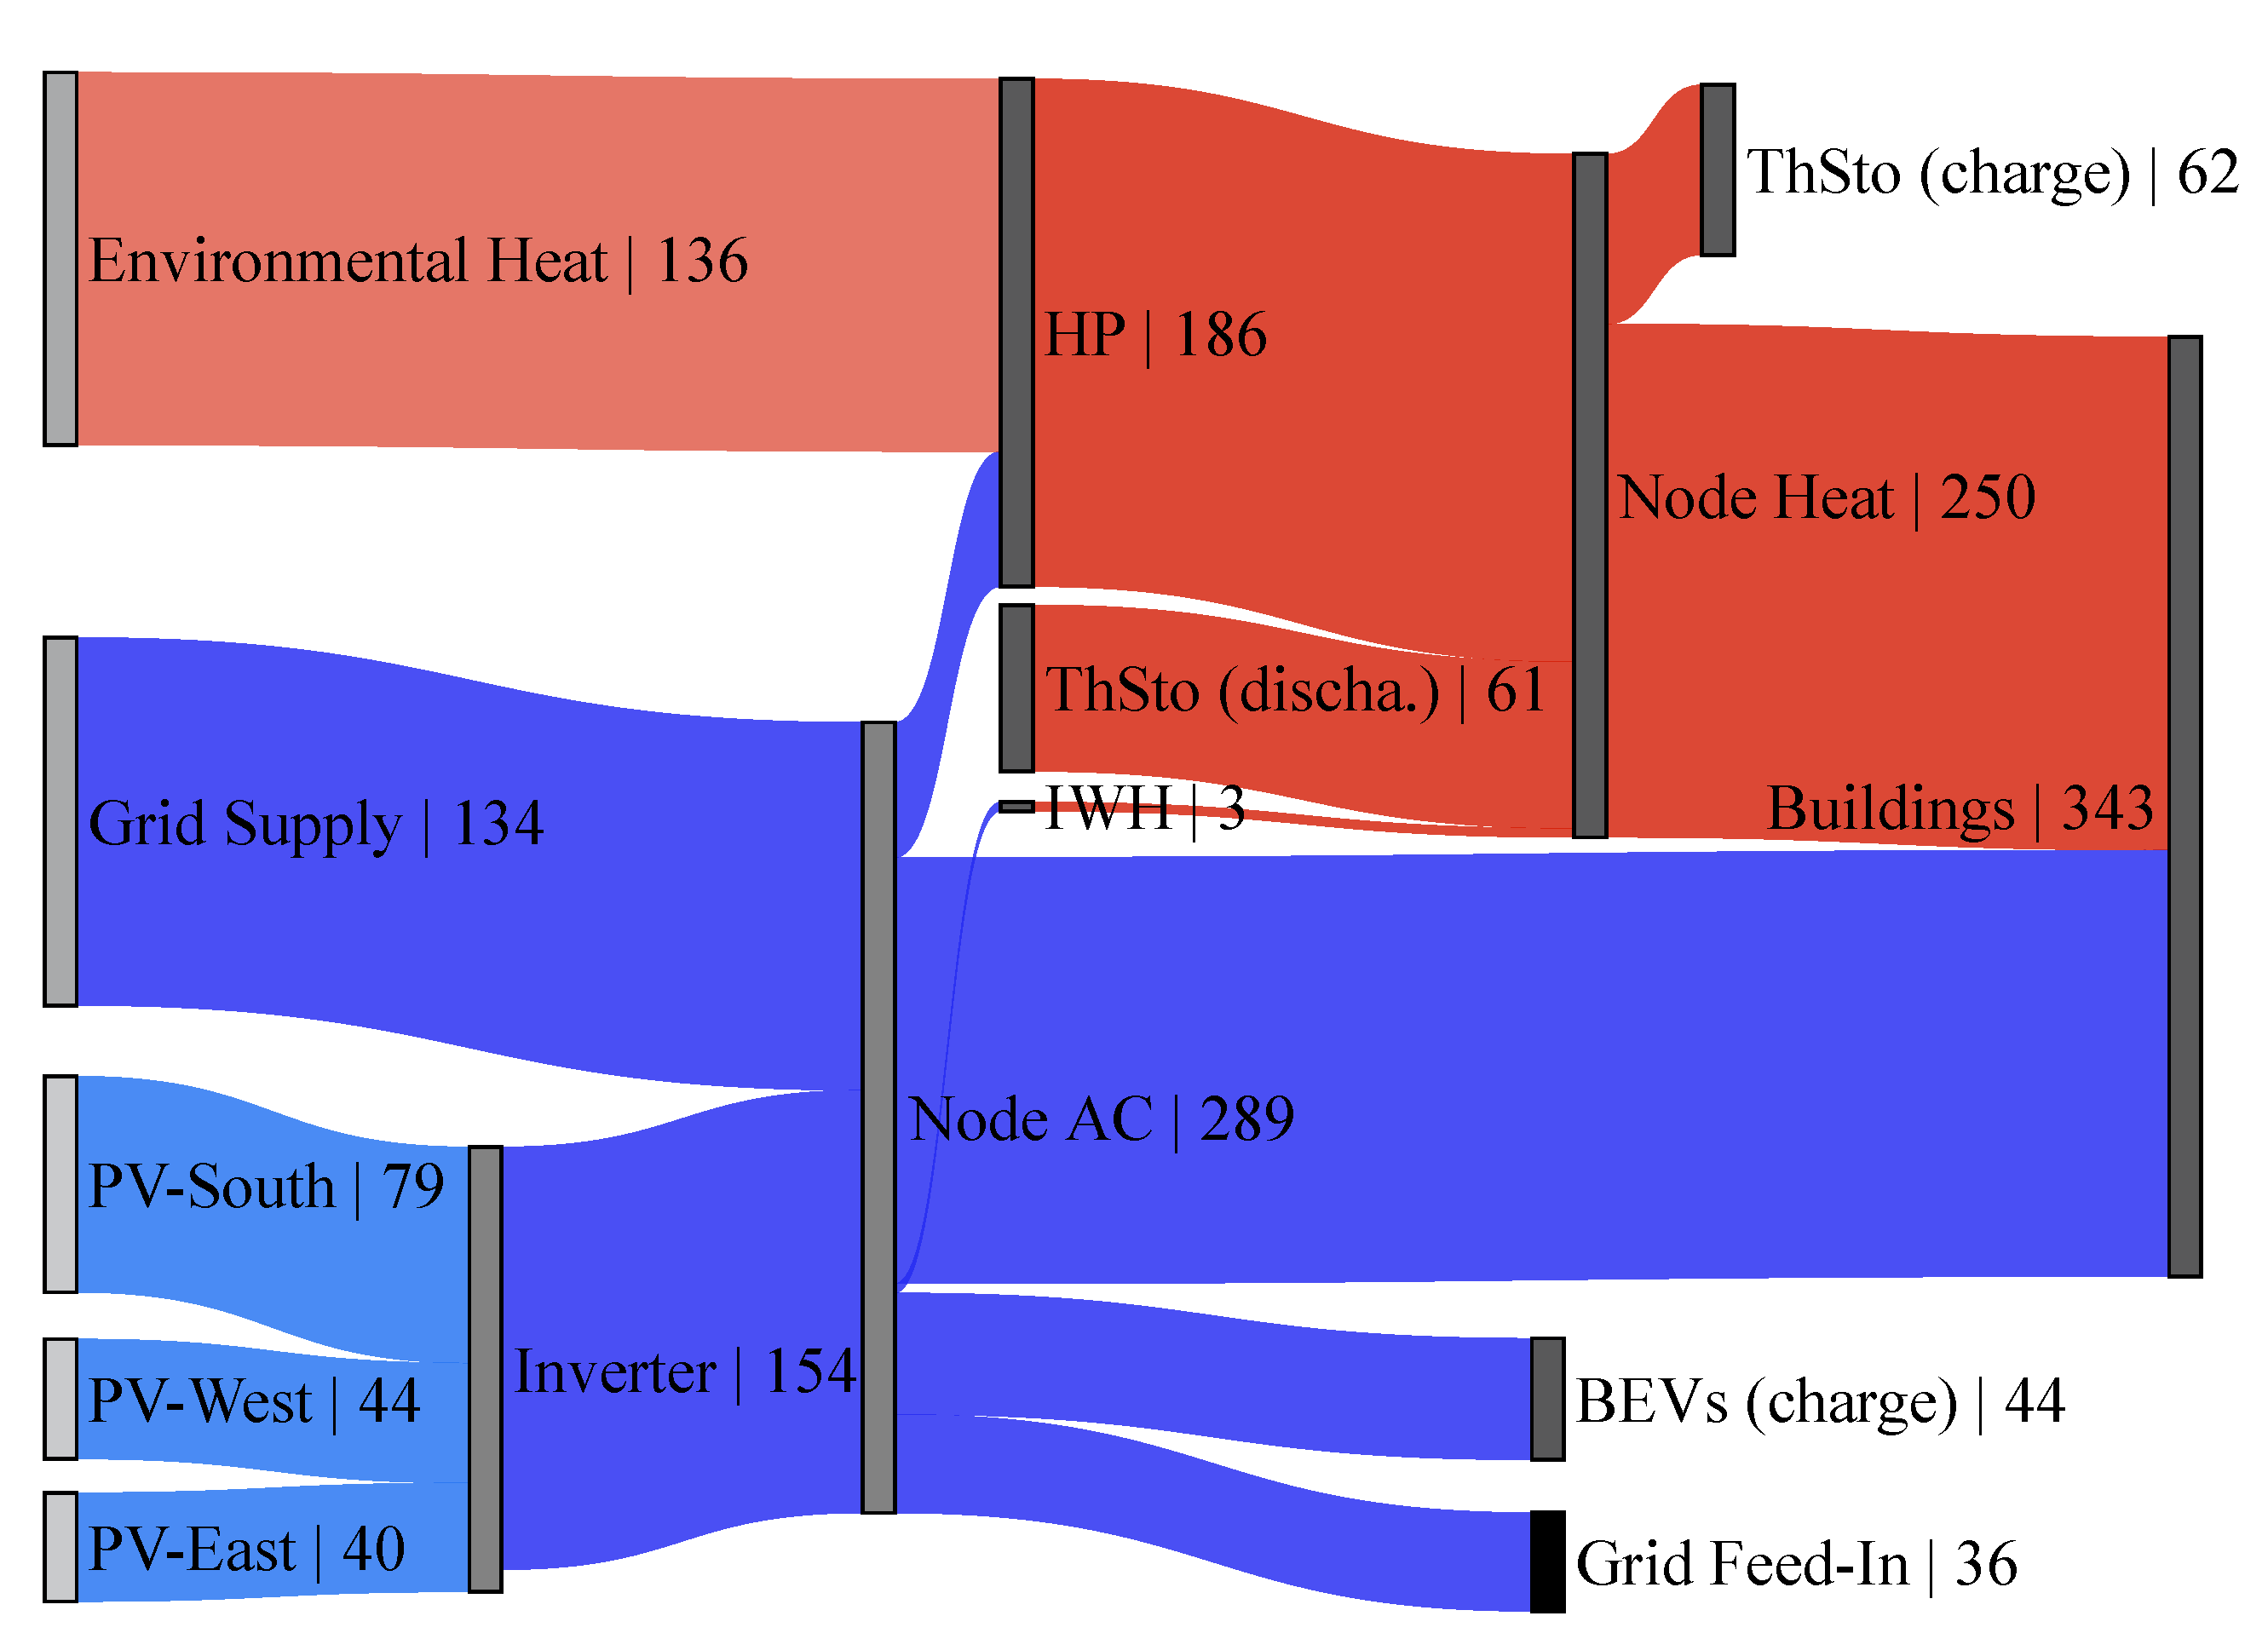
The energy flows for the scenario with a flat price and unidirectional electric vehicles (Scenario 1a) are shown in Figure 2. Here, 134   MWh of electrical energy is drawn from the power grid annually. The highest electrical energy demand occurs in the buildings, amounting to 156   MWh annually. Furthermore, the heat pump accounts for 49.3   MWh , the electric vehicles account for 44   MWh and the electric instantaneous water heater for 3.4   MWh . Furthermore, 36   MWh is fed into the power grid by the PV system. The heat pump provides 186   MWh of heat energy annually, resulting in a C o P of 3.77. The thermal storage reaches an annual energy turnover of 62   MWh .
If the feedback capability of the electric vehicles is considered (Scenario 1b), the electric vehicles are charged with 65 MWh instead of 44 MWh ( + 47 % ). This allows the vehicles to provide 17 MWh to the overall energy system annually, which is equivalent to 6.7% of the total electrical energy required. The heat supply, on the contrary, remains almost unchanged: 49.5   MWh is provided by the heat pump and 2.9   MWh by the electric instantaneous water heater. In total, the introduction of the feedback capability leads to a decrease in the grid power draw of 13.4% to 116 MWh and a decrease in the feed-in of the PV system into the public grid of as much as 55.6% to 16 MWh . Particularly relevant parameters are shown in Table 3. The dynamic pricing model in the unidirectional scenario leads to a higher yearly energy draw from the grid, while the energy fed into the grid remains at the same level. The maximum self-sufficiency degrees achieved with V 2 B are 54% for the flat and maximum power fees and 50% for the dynamic tariff. The smallest V 2 B potential exists in the scenario with the flat tariff, in which only maximization of self-consumption is conducted, leading to a yearly sum of 17 MWh of energy provided by the vehicles. The highest potential exists in the case of the dynamic pricing model, in which a yearly sum of 90 MWh is fed back due to the daily arbitrage opportunities. The feedback potential of the max power price tariff is between that the other two tariff models: 24 MWh . Self-consumption rates in the range of 7(6% unidirectional scenario) to 90% (bidirectional scenario) are achieved.

5.2. Energy Supply by Electric Vehicle Fleet

The following section shows more detail about how energy is provided by the electric vehicles. For this purpose, the time series of power flows in the neighborhood are presented for one exemplary summer and winter week each depending on the three different tariff models.
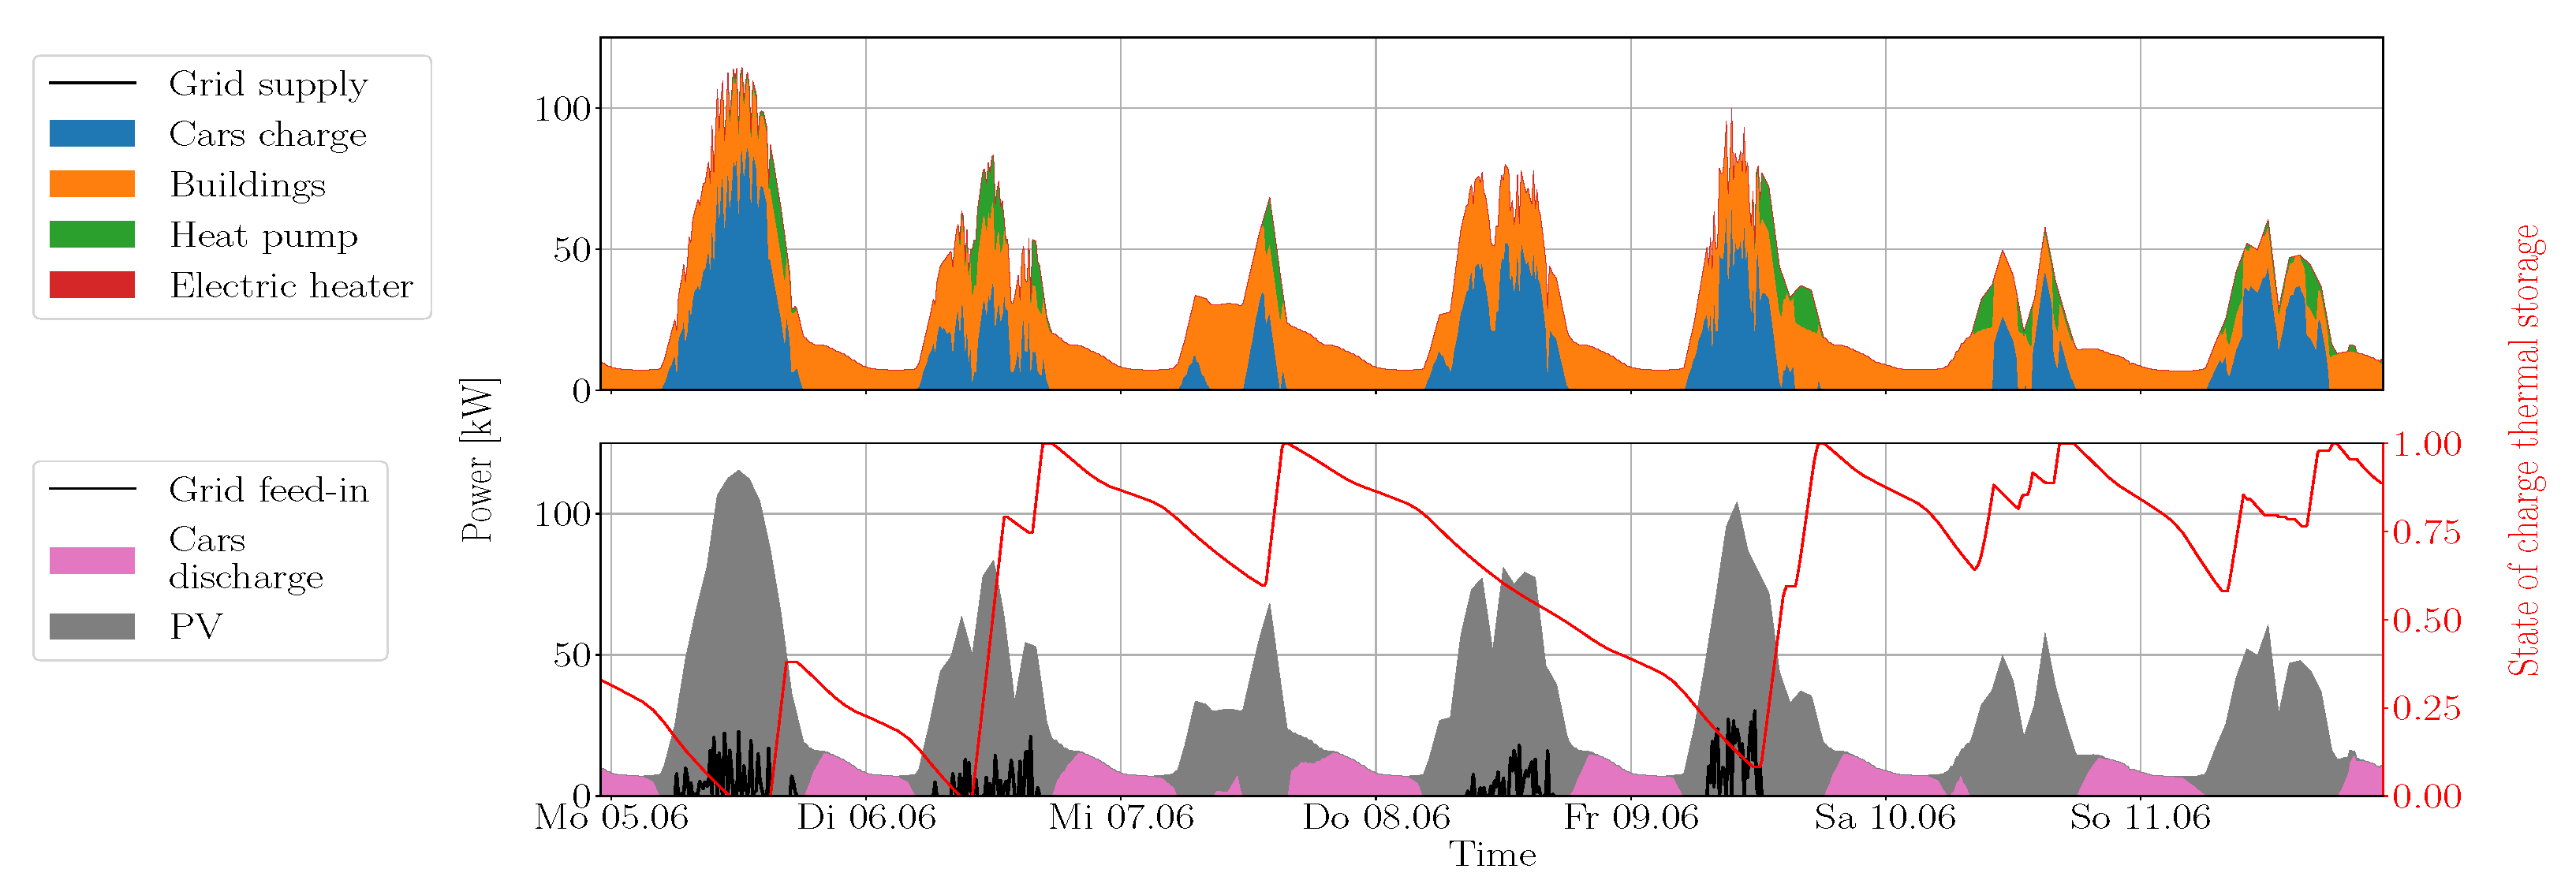
For the scenario with a flat price in summer (see Figure 3), the vehicles and the thermal storage are charged in the considered week mainly when there is a surplus of PV energy. On four of the seven days of the week, the heat pump is also operated when there is a surplus of PV energy so that the generated heat both covers the heating demands of the neighborhood and charges the thermal storage. As soon as the output of the PV system is no longer sufficient to supply the neighborhood with energy, the vehicle batteries are discharged. The summer week under consideration shows that no grid supply is necessary, and even a portion of the excess PV power can be fed into the power grid. In winter, the operating behavior is different. The heat pump is operated continuously due to the significantly higher heat demand, with the support of the instantaneous water heater on four out of seven days. For electric vehicle charging, on the contrary, no particular pattern is apparent due to low PV production and lack of pricing incentives. No V2B is observed during this week.
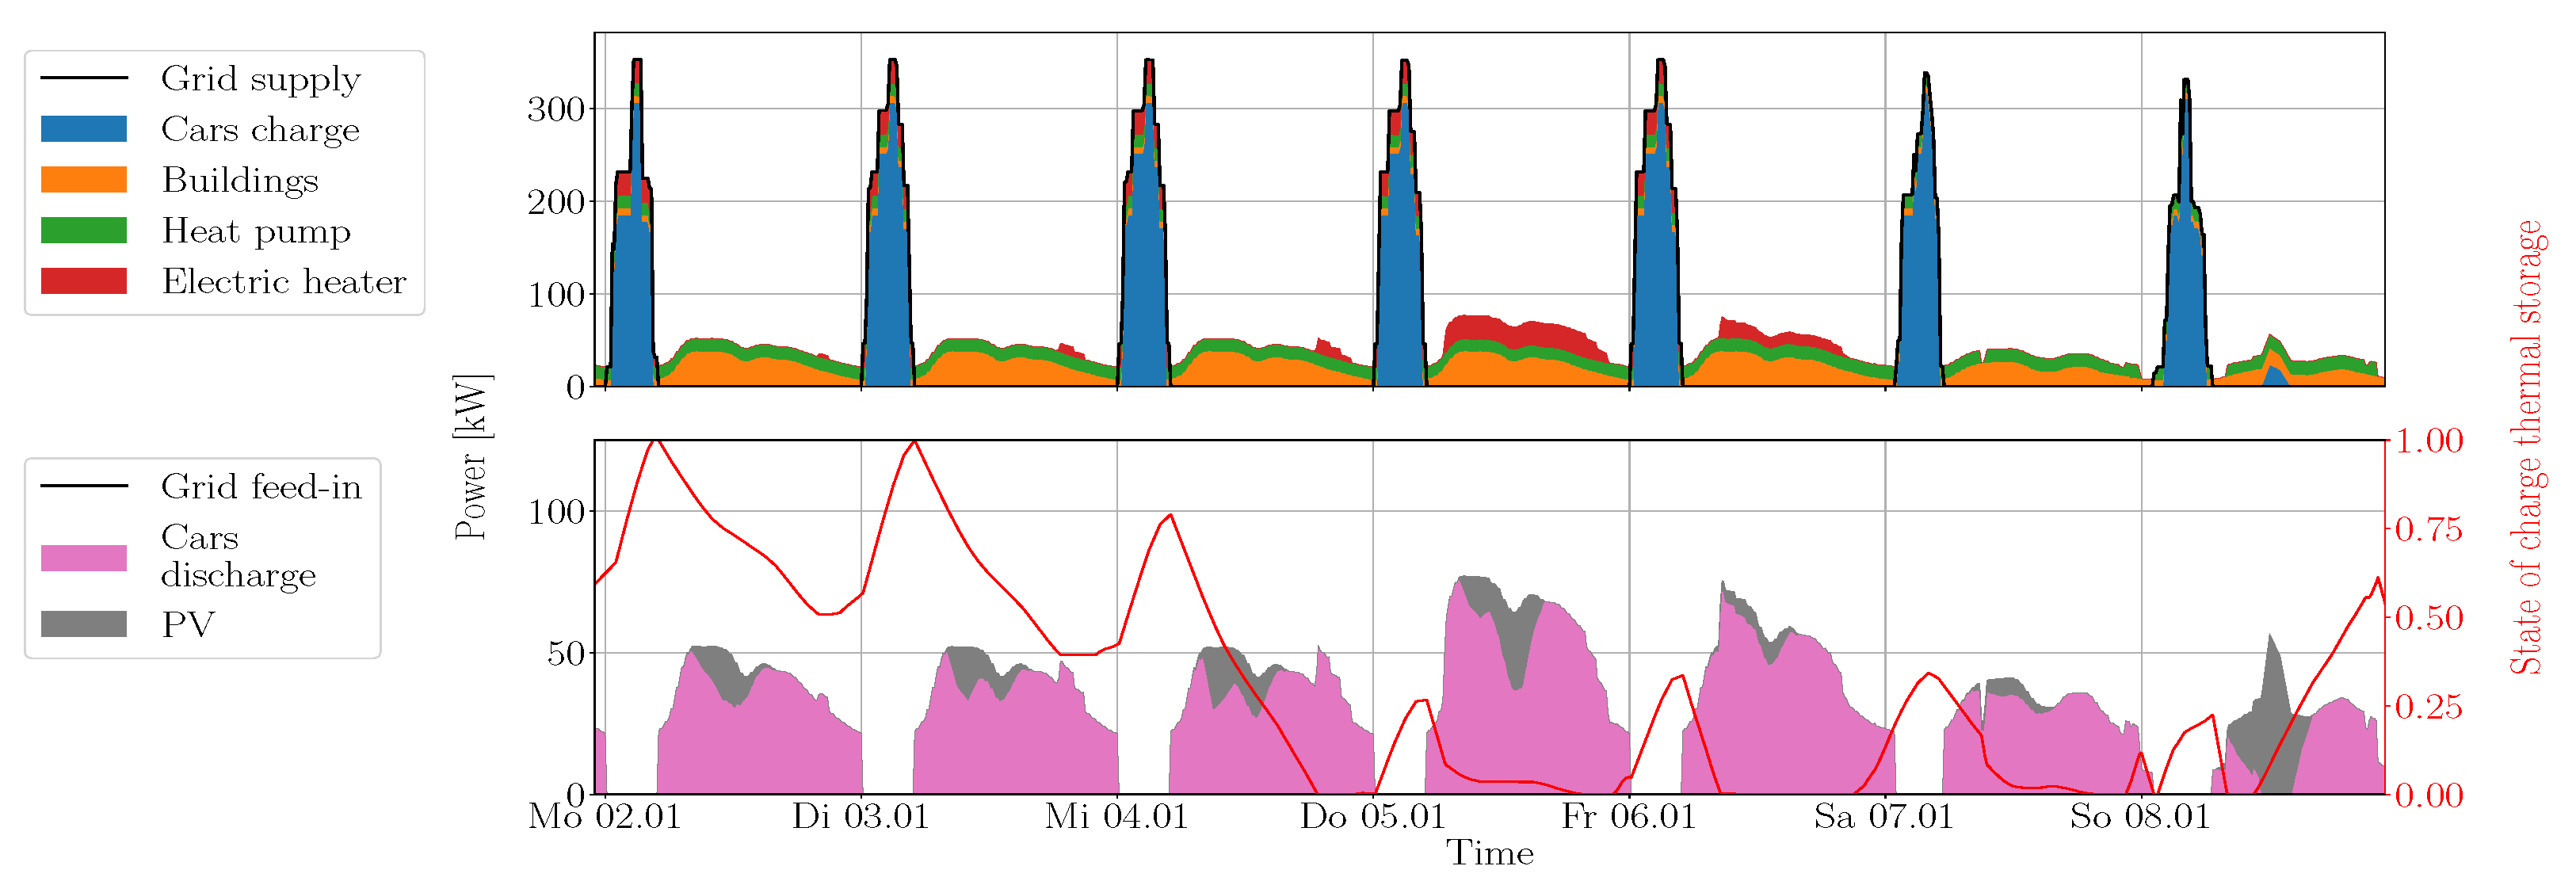
In the case of a dynamic price, a qualitatively similar operating strategy as in the case of the flat-rate price model is observed. In contrast to the summer week of the scenario with the flat-rate pricing model, however, it can be seen that there is a significantly higher grid feed-in. In winter (see Figure 4), on on the contrary, the operating behavior is different. The vehicles are charged at full power at night because, according to the assumptions made for the pricing model, there is a low electricity price due to the generally low electricity demand at night. Additionally, during these time units, as well as due to the low price of electricity, the heat pump and the instantaneous water heater are both operated. The water heater is also operated during the day in addition to the heat pump when the thermal storage has a low level of charge. When the vehicles are no longer being charged due to a lack of PV power, they are immediately discharged to provide energy to power the buildings and operate the heat pump, as they can temporarily replace the grid purchase of electrical energy.
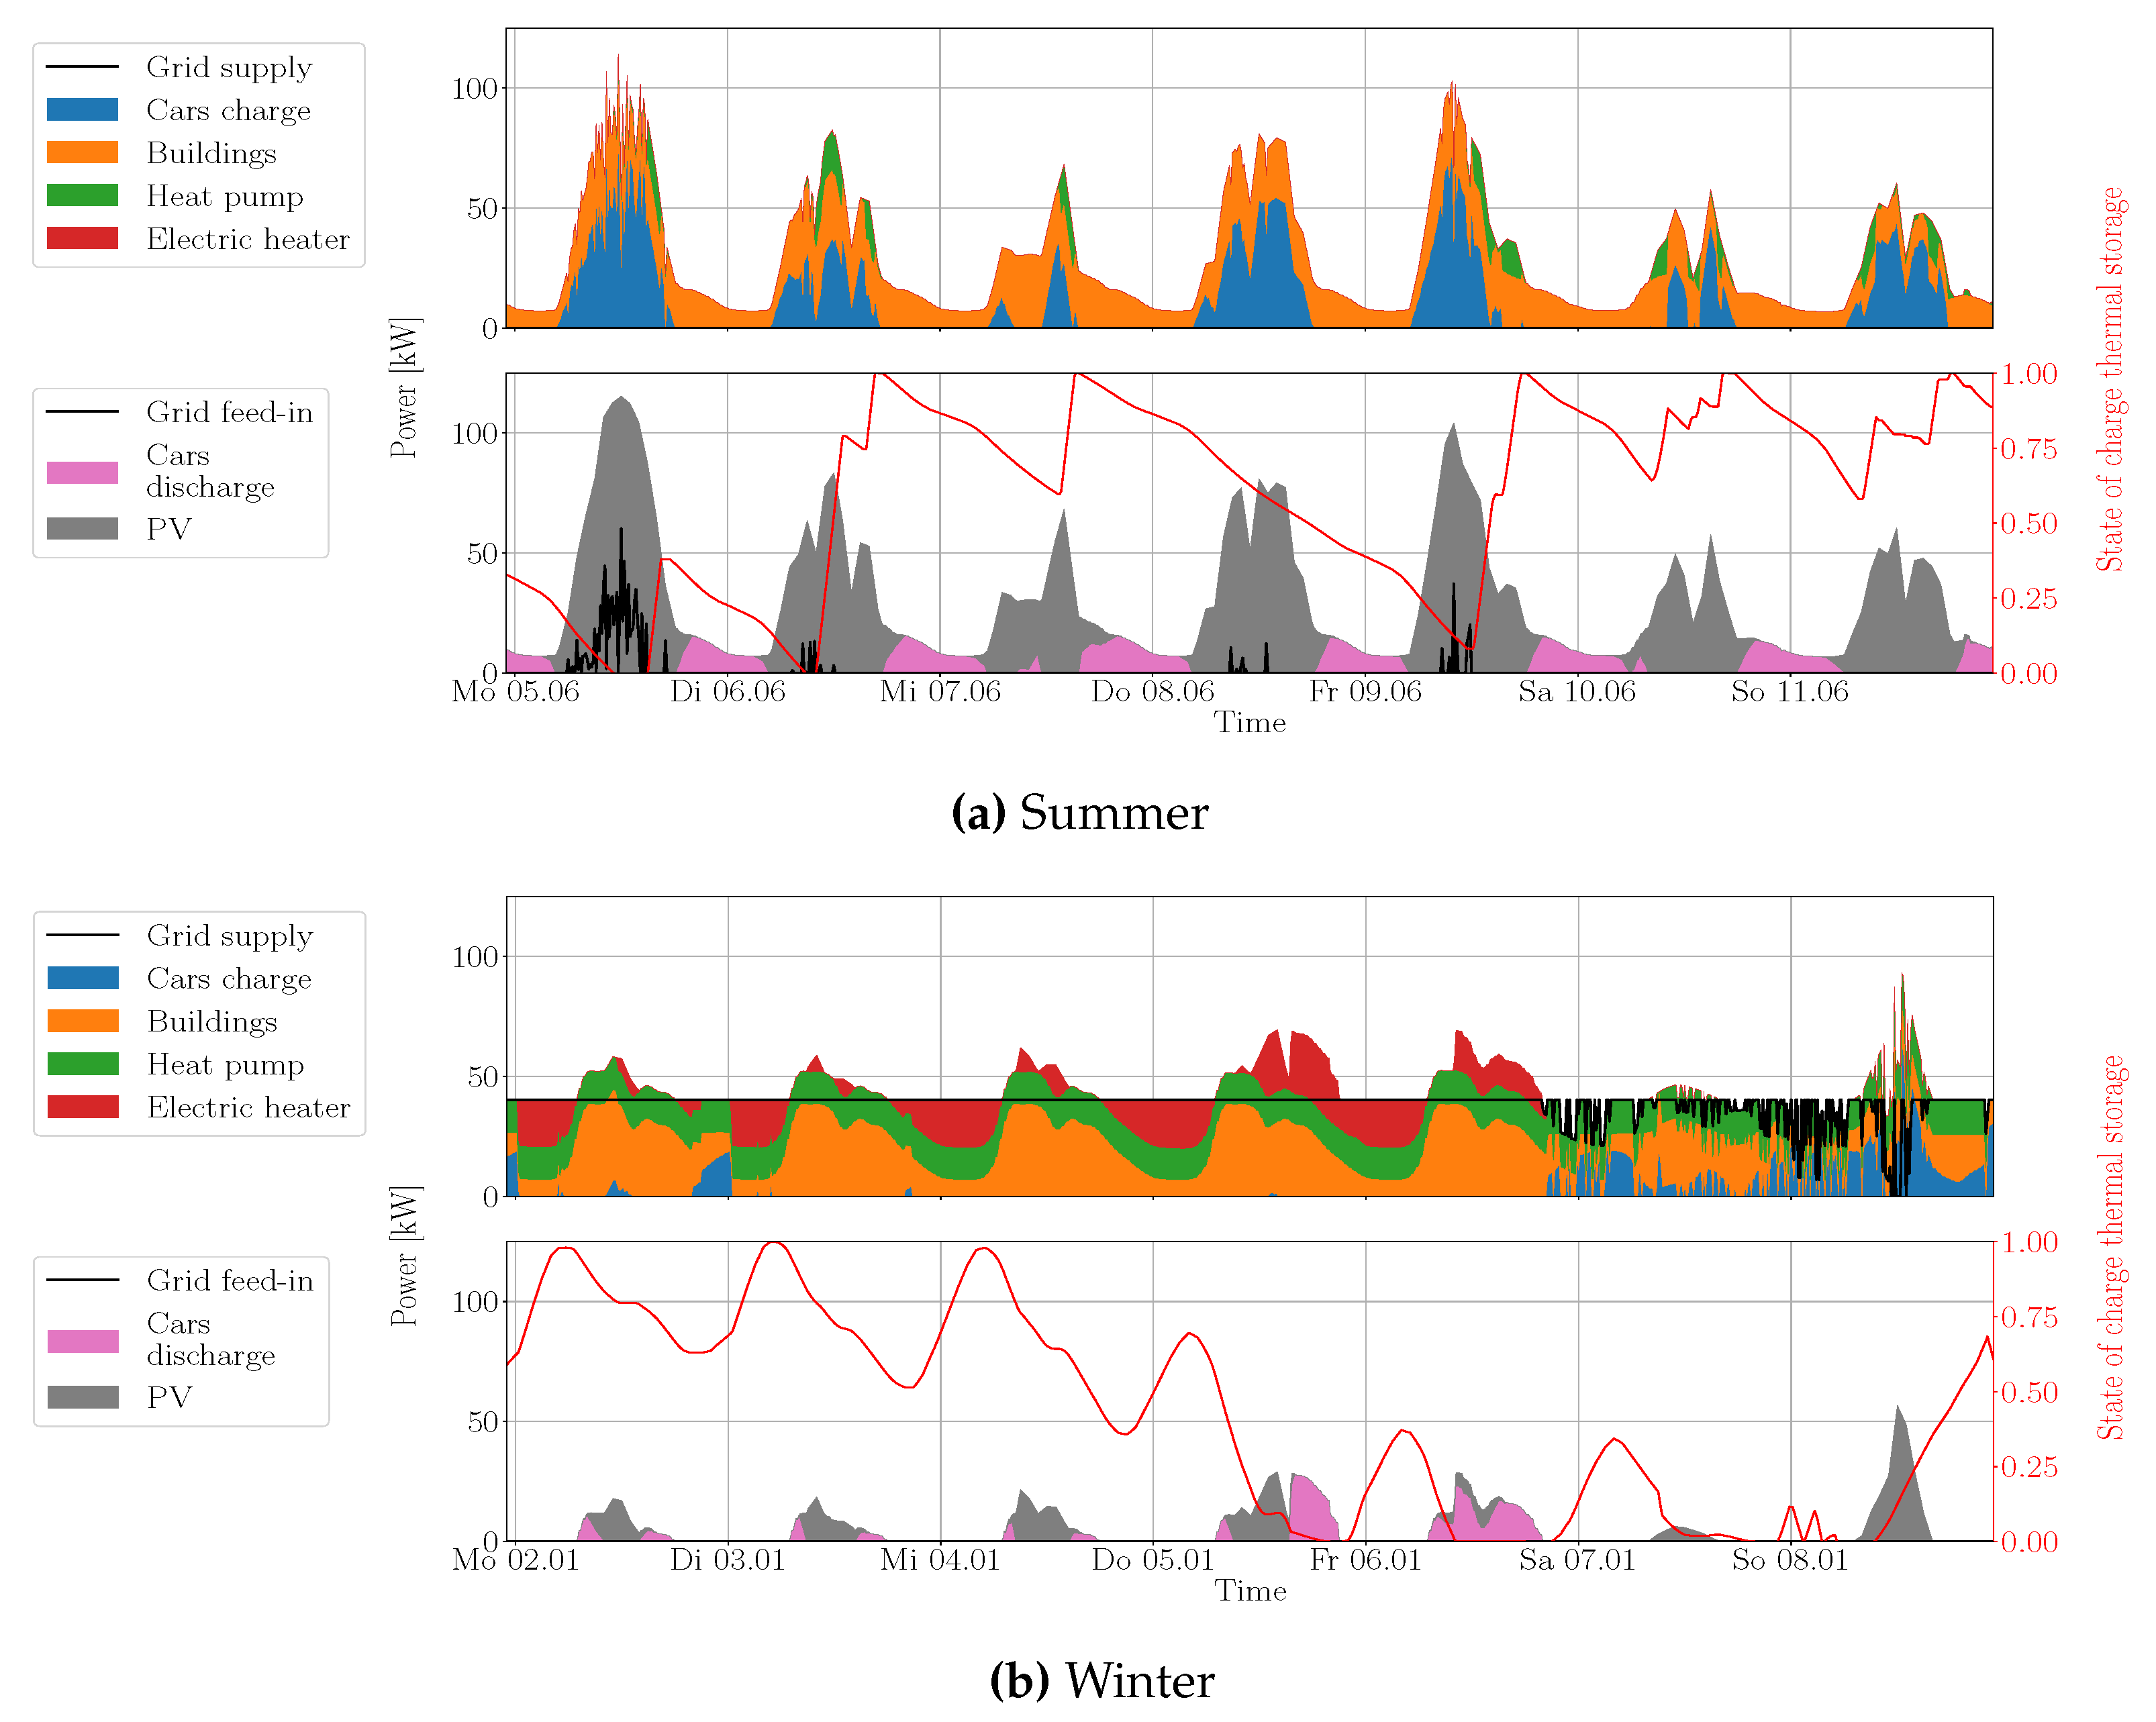
Another optimal operating strategy can be observed for the scenarios with power price. However, during the considered summer week (see Figure 5a), a largely similar operating strategy as in the other scenarios can be observed. A difference relative to the summer week with a flat price model is particularly evident in the pattern of electrical energy fed into the power grid. On the contrary, when looking at the exemplary winter week (see Figure 5b), it becomes apparent that the control of the instantaneous water heater and the charging of the vehicles differs significantly from the other tariff scenarios. In particular, it can be observed on several days how both the energy of the PV system and the energy supplied by the electric vehicles are used to operate the electric heater, in addition to the heat pump, to achieve a constant grid power draw. In addition, feedback of vehicles can be observed on several days at the beginning of the week. The vehicles provide energy mainly when the building load increases to keep the grid power draw constant. This can be explained by the fact that the total costs in a month depend strongly on the peak power drawn in that month and that the more constant and therefore the lower the peak load of the electrical grid power draw, the more favorable it is to use power already paid for as often as possible.

5.3. Grid Power Draw

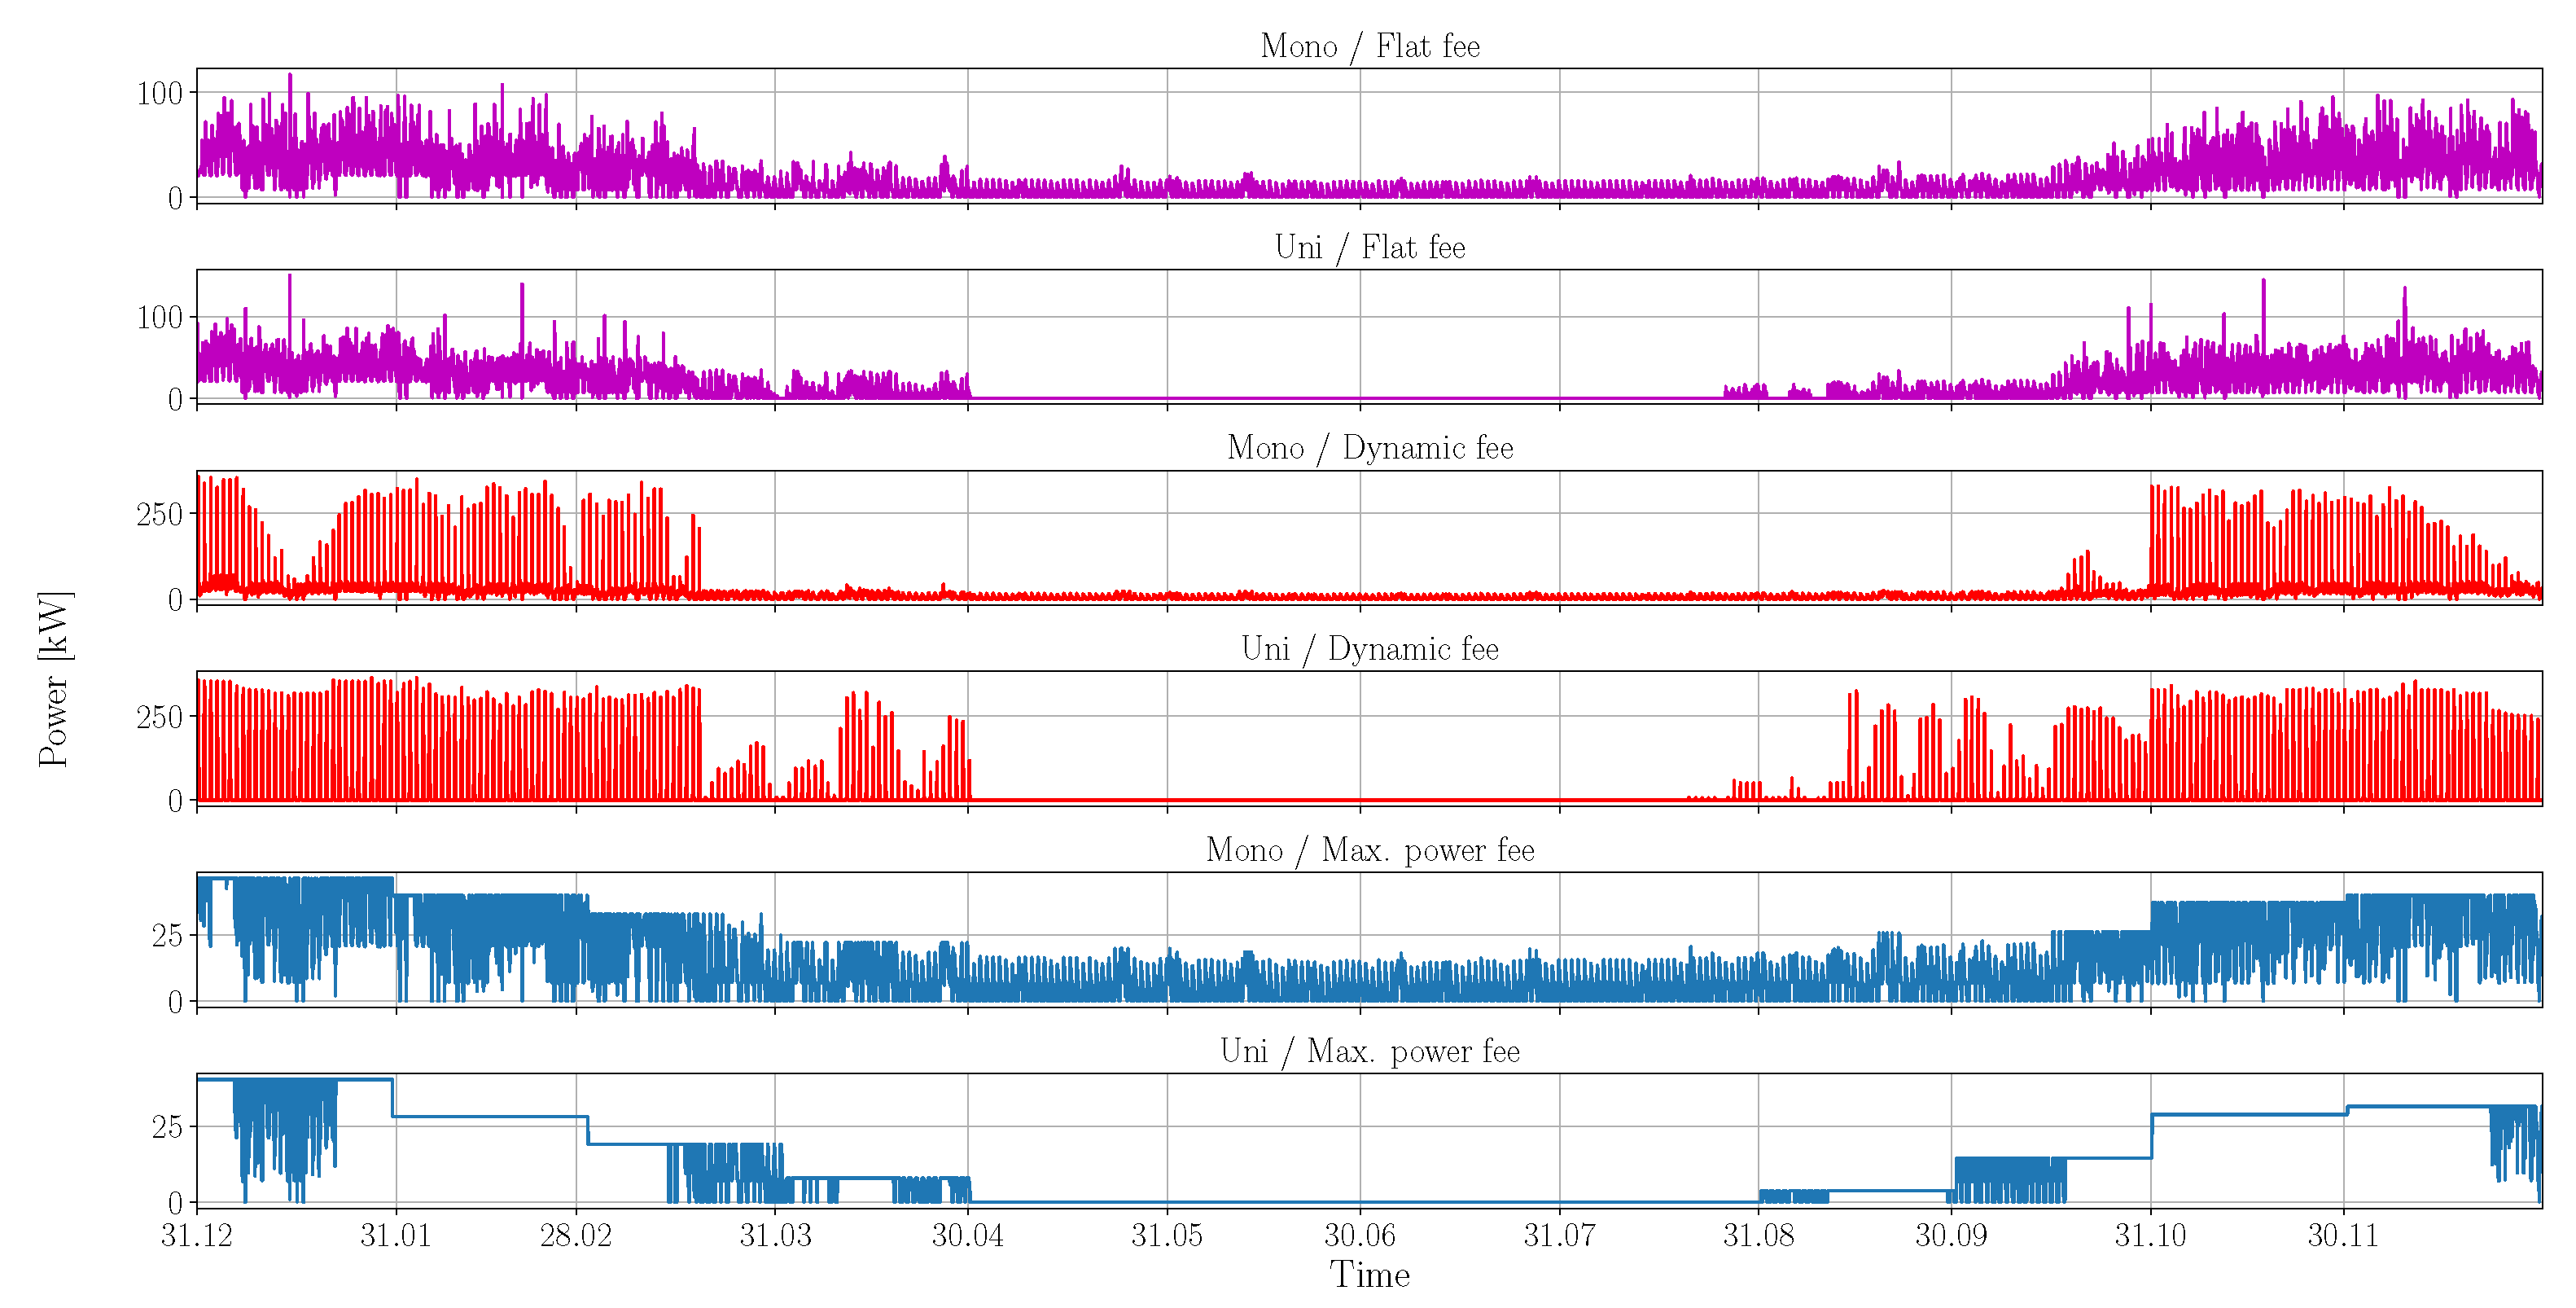
If the grid purchases are considered over the course of the year (see Figure 6), there are significant differences depending on the price model and the feedback capability. As expected, for all pricing models, grid purchases are higher in the winter than in the summer months, which can be attributed to both reduced solar radiation levels and higher heating and electricity demands in the winter months.
In the scenarios with a flat-rate pricing model (Scenarios 1a and 1b), irregular peaks in grid consumption are evident, especially from October to March. Furthermore, the peak of power draw can be reduced by V2B, especially during summer and in the case of the peak power tariff model.
The energy flows in Scenarios 2a and 2b with dynamic pricing show that grid purchases occur primarily at times of low electricity prices, which (according to the assumptions) are usually at night. This results in a pattern in the winter months that can be described as a comb: a short period of high network consumption at night followed by a period of significantly lower or no network consumption during the day. Moreover, this pattern extends further into the fall/winter and winter/spring transition periods in the scenario with V2B (Scenario 2b). The maximum grid power draw was not limited, and a high price spread was assumed, thus maximizing this pattern. If a limit was to be imposed, the vehicles would have to be charged over a longer period, leading to lower maximum grid power draws.
The peak power tariff model, on the contrary, leads to a significantly lower grid power draw, and at the same time, the variance of the grid power draw is less pronounced. This could be due to the fact that the pricing model provides an economic incentive to use the maximum capacity that has already been paid for each month. Furthermore, the variance of the grid purchase can be further reduced by the use of V2B (Scenario 3b).
Finally, it should be emphasized that regardless of the choice of pricing model (Scenarios 1b, 2b and 3b), the use of feedback-capable vehicles results in a period during the summer months during which no energy needs to be drawn from the power grid.

5.4. Limiting Battery Cycles per Vehicle

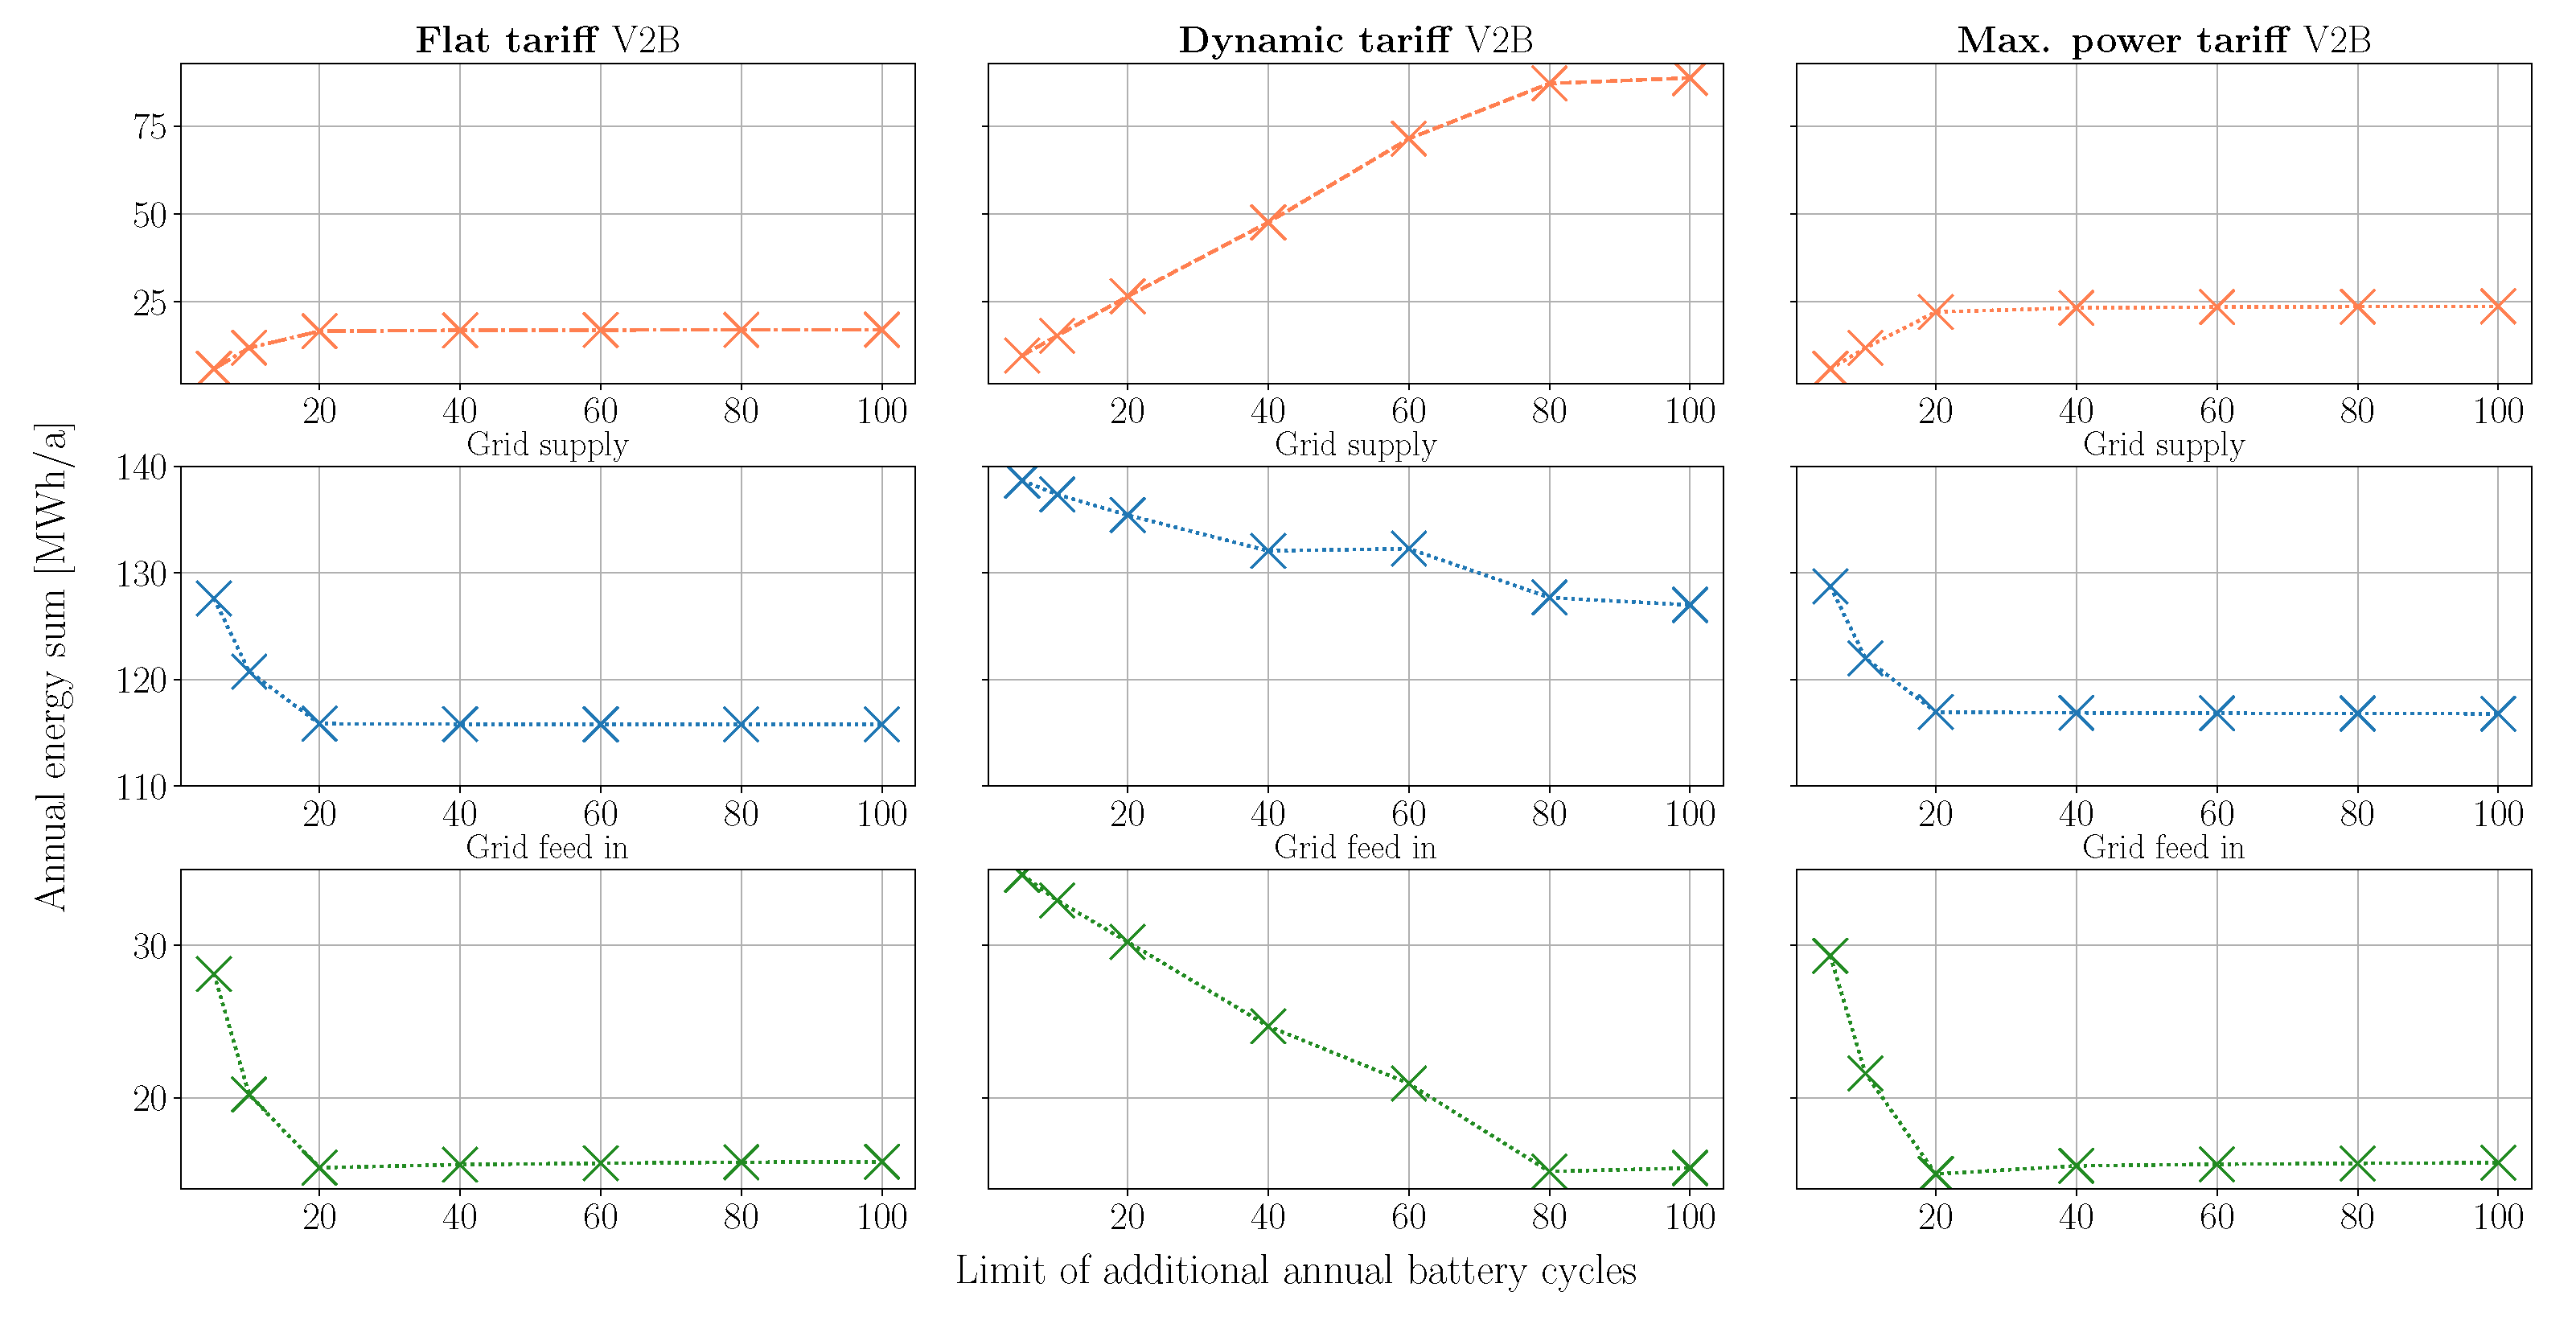
Because some vehicles of the fleet experience a significant number of additional battery cycles due to high charging efficiencies, in the next step, the maximum allowed additional cycles per year and vehicle are limited. Yearly limits of 5, 10, 20, 40, 60, 80 and 100 cycles were simulated for each tariff model. The results for the yearly energy sum provided by the vehicle fleet are shown in Figure 7.
For the flat tariff, the potential is only significantly limited when a cycle limit of 20 or less is applied. Between a cycle limit of 100 and 20, the V2B potential is reduced by 1.8% from 17 MWh to 16.7   MWh , and at the same time, the grid feed-in is reduced by 2.5%. This change is due to less efficient cars being used to provide energy. Moreover, the grid supply sees no significant changes. If the limit is reduced further, the possibility of using different cars diminishes, leading to significant reductions in V2B potential and significantly higher grid supply and feed-in.
For the maximum power tariff, a qualitatively similar behavior can be seen, with potential reduced by 6.6% if a cycle limit of 20 is applied. The same behavior for grid supply and feed-in is also observed.
If the dynamic tariff is considered, the minimal cycle number at which significant decreases in feedback potential begin is significantly higher. Between a cycle limit of 80 and 100, the feedback potential is reduced by 1.8   MWh , and a reduction in grid feed-in similar to the previous tariff models can be observed. Further reductions below 80 lead to a significant decrease in feedback potential and increases in grid supply and feed-in. It is important to note that by applying the same cycle limit to the different tariff models, the dynamic tariff model always achieves the highest potential. At a limit of 10 cycles, for example, the flat tariff achieves 11.9   MWh , the max power tariff achieves 11.9   MWh and the dynamic tariff achieves 15.3   MWh .

5.5. Distribution of the Power Supply across the Fleet

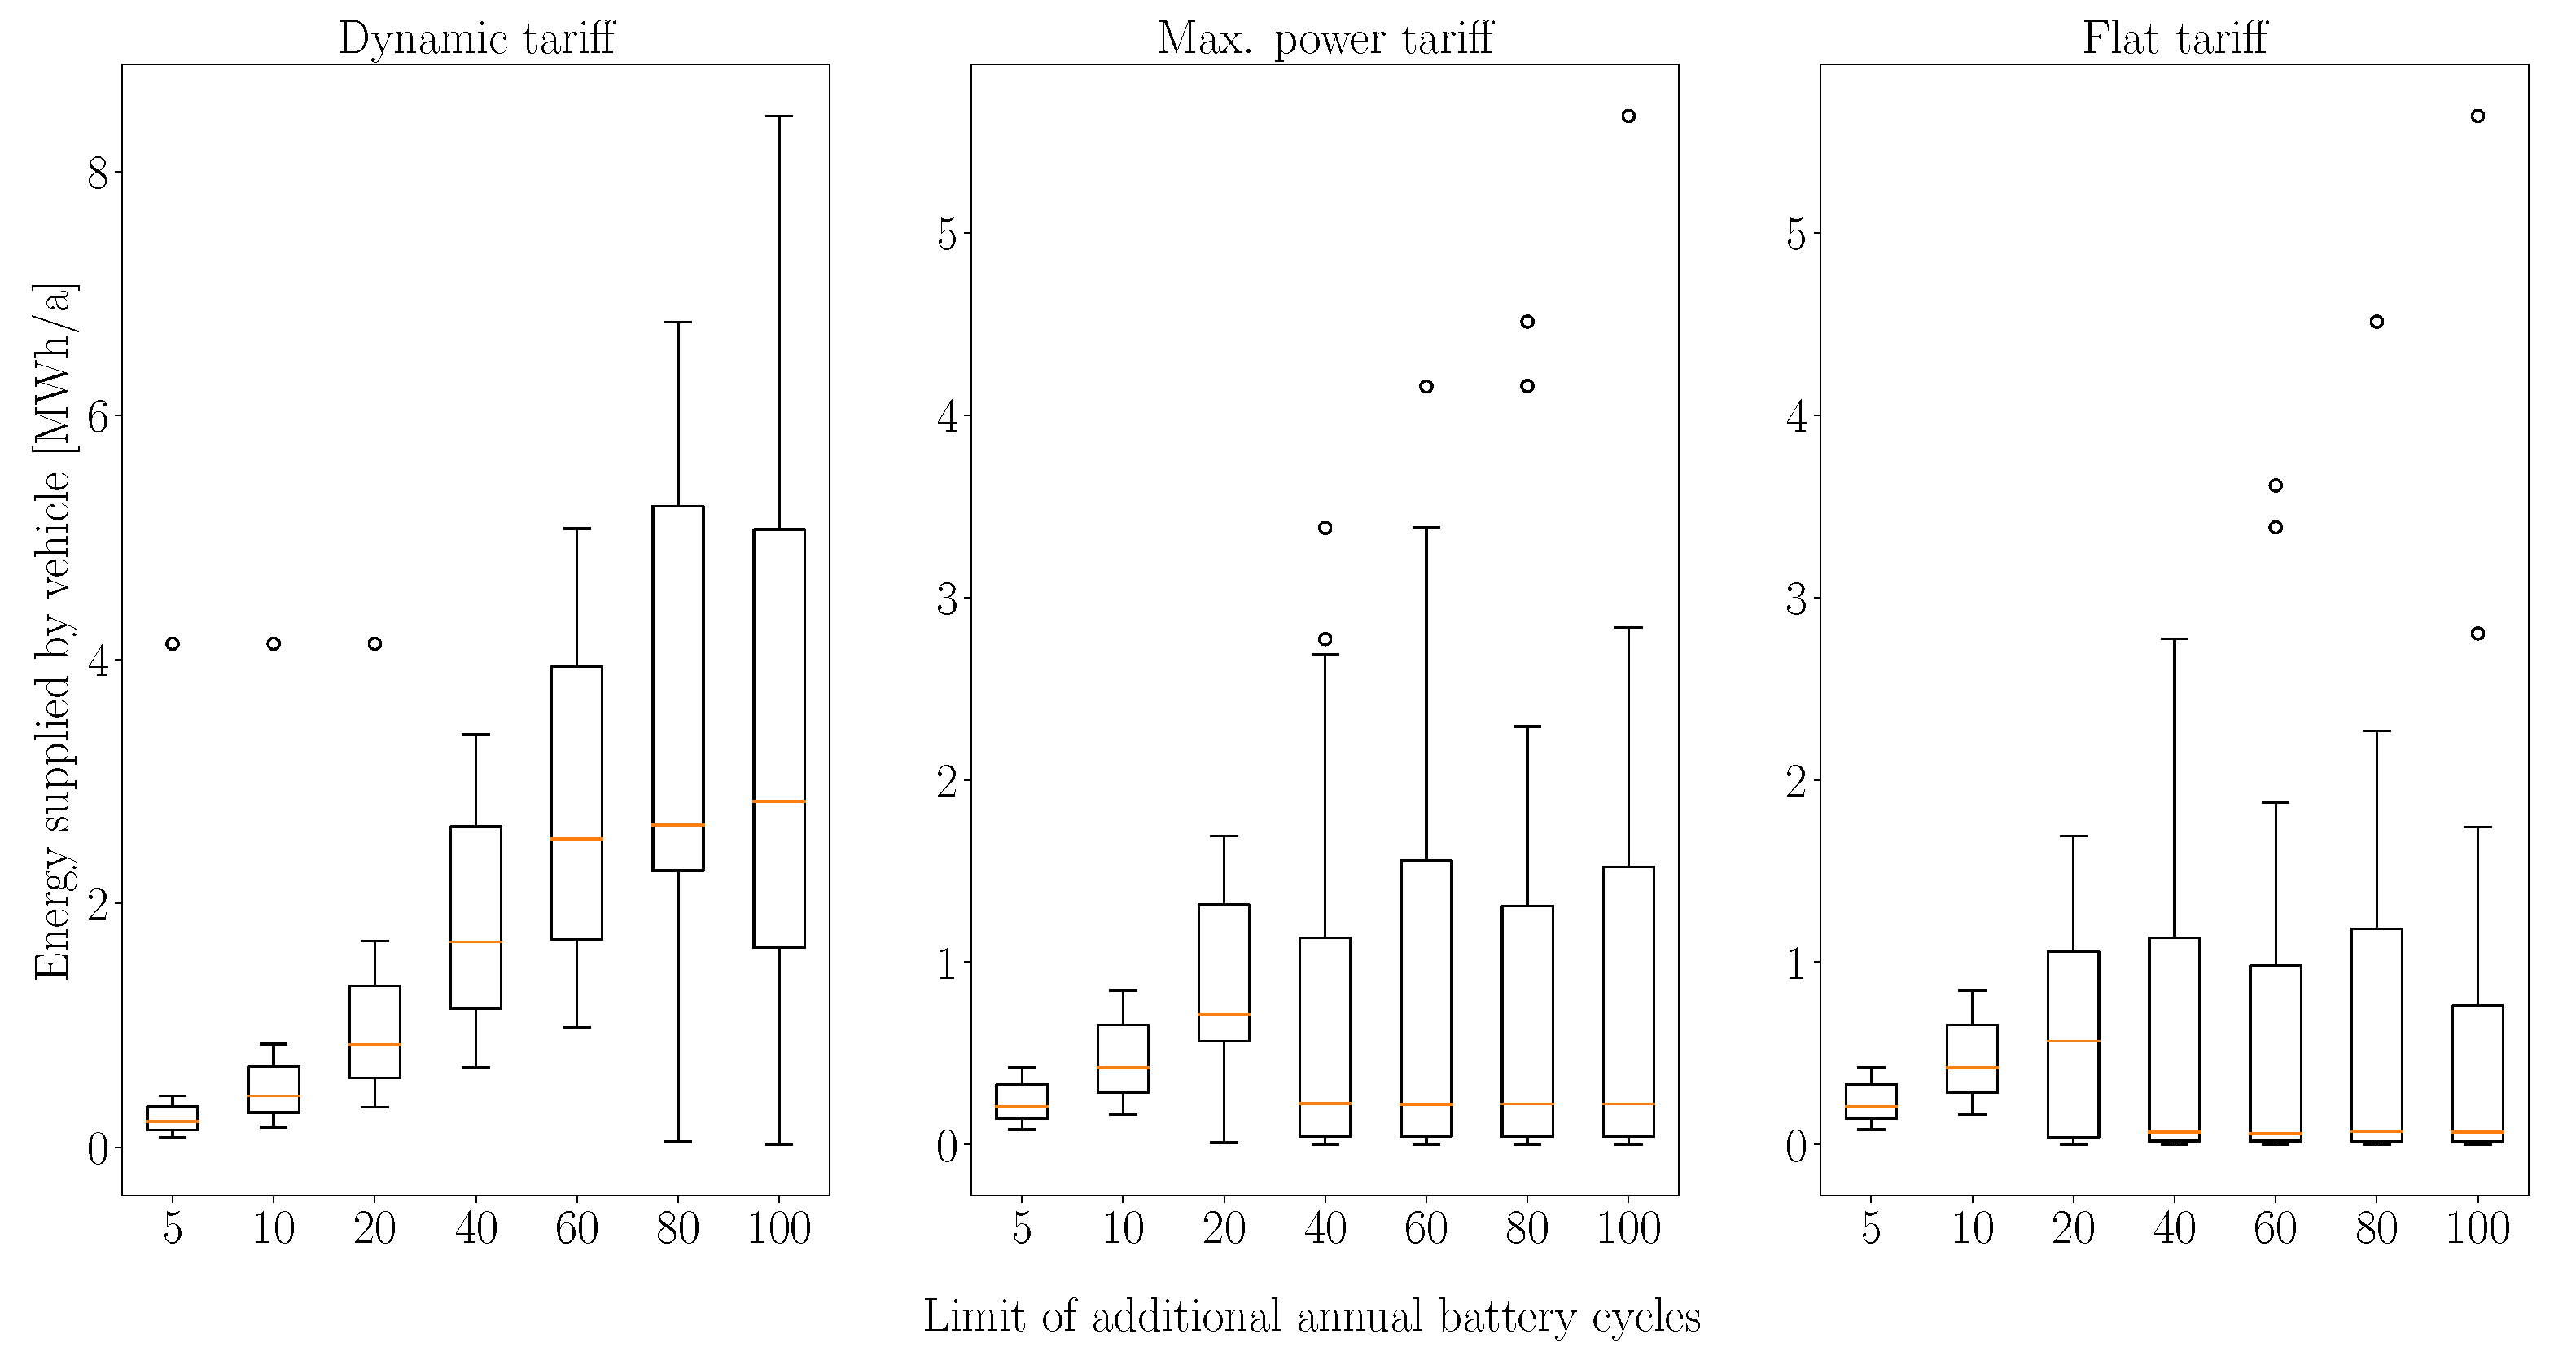
Figure 8 shows the distribution of the amount of energy fed back by vehicles in the fleet for the three different tariff models in the form of a box plot, with one plot presented for each cycle limit.
In the case of the dynamic pricing model, it can be observed that the median value of the energy provided by the vehicles decreases continuously when the maximum allowable cycle number is reduced. The steepest decrease can be observed between 60 (median 2.5   MWh ) and 20 (median 0.8   MWh ) cycles. At a limit of 100 cycles, half of the fleet provides between 1.6   MWh and 5 MWh ; however, at 80 cycles, this range is increased to between 2.3   MWh and 5.3   MWh . Below this level, the range of energy provided by the vehicles continuously decreases.
For the maximum power tariff, the median value of provided energy does not change until the cycle limit is reduced to 40 cycles. Above this limit, the highest outlier is decreased from 5.6   MWh to 3.4   MWh . At a limit of 20 cycles, an increase in the median value to 0.7   MWh can be seen, with a further shift of energy across the fleet not possible, so all vehicles need to provide more energy to maximize the energy supply.
As for the flat tariff, the same dynamics can be observed. Between 20 and 40 cycles, the median value of energy provision is increased from 0.07   MWh to 0.57   MWh . Above 40 cycles, a decrease in the limit leads to a decrease in outliers.
One reason for the observed behavior is that the charging and discharging efficiencies of the vehicles create an economic incentive to preferentially use vehicles with high efficiency for V2B, leading to a few cars providing significantly more energy than others. This can be compensated for by limiting the allowable battery cycles per vehicle.

6. Discussion

In the context of the presented scenarios, the potential of a feedback-capable electric vehicle fleet (V2H + V2B) in a neighborhood was determined with combined optimization of the energy provision of electricity and heat. For this purpose, first, a linear optimization problem was formulated; three different scenarios were presented with a flat tariff, dynamic tariff and power tariff; and the resulting problems were solved with GLOP the solver.
During the analysis, it was shown that depending on different economic incentives, different optimal operating strategies emerge, although they also have common features. For example, the optimal operating strategy in summer for all tariff models is to charge the vehicles with energy from the PV system during the day whenever possible and to release parts of the temporarily stored energy again at night, thus reducing or even avoiding the need to purchase energy from the grid and increasing the self-consumption rate.
The differences in operating strategies are most apparent during the winter months. While no significant vehicle charging pattern is evident in the flat price scenarios, the dynamic pricing model scenarios primarily use vehicles to shift grid purchases to times with high energy prices. For this purpose, the vehicles are charged at night when the assumed electricity price is low. At the same time, however, this also encourages heavy use of the local distribution network in the short term, while at other times, no energy is drawn. This results in fewer full-load hours for the local infrastructure compared to the other two pricing models. However, this effect could be partly compensated for by specifying a maximum permissible grid power draw. The power price model creates the opposite incentive. Here, the electric vehicles are charged or discharged, and the heat pump and the instantaneous water heater are operated in such a way that, in total, they achieve the lowest possible and most uniform grid consumption during the individual months. It became apparent that this economic incentive allows the lowest maximum network power draw to be realized, as also supported by the findings of Schreck et al. [25]. In this pricing model, the feedback from electric vehicles in the winter primarily results in a reduction in the variance of the grid power draw, as well as an overall reduction in the grid power draw. This means that a less powerful distribution network is required locally, which could be utilized in a comparatively more predictable manner. Unlike in the scenarios with a dynamic pricing model, however, there is no incentive for the energy management system to respond to power surpluses in the electricity market.
As a result of the energy provided by the vehicles, an import reduction in electricity in the range of 8.6% to 13.4%, as well as an export reduction of about 43% to 44%, was observed. Ref. [22] also reported a reduction in electricity imports and exports due to V2B, although significantly lower. These differences could be due to different pricing incentives and different energy system structures. Self-consumption and self-sufficiency degrees calculated in this work are in the range of those calculated in previous studies, for example, those conducted by Kobashi et al. [8] and Chang et al. [10].
The specific energy supplied by the vehicles calculated in this study is between 4.8   kWh −1 sqm −1 a (flat fee) and 25.3   kWh −1 sqm −1 a (dynamic tariff). In case of dynamic tariffs, it is in the same range as that calculated in Zhou et al. [21] ( 23.9   kWh −1 sqm −1 a and 31.4   kWh −1 sqm −1 a ) using peak/off-peak pricing. The differences in potential could be due to different pricing models, building composition, cooling loads and energy supplied by wind turbines.
To work as economically advantageous as possible, the vehicles in a fleet with the highest charging and discharging efficiency should be used. We also showed that, especially when using a dynamic pricing model, there is a risk that individual vehicle batteries will be used very intensively, while others are not, which could lead to undesirable battery aging of specific vehicles in a fleet. The effects of implementing a yearly limit of additional permissible battery cycles per vehicle were investigated.
It was shown that this leads to a more even distribution of energy provision across the fleet. There are two ranges when limiting the cycle number. In the first range, less efficient vehicles of the fleet are used to provide energy. This leads to a decrease in the potential in the single-digit percentage range and a slight reduction in grid feed-in. If the cycles are decreased further, a significant reduction in the feedback potential, as well as a significant increase in grid supply and feed-in, is observed.
In a possible implementation of V2B, it might therefore be beneficial to implement a combination of dynamic prices and power prices. In this way, both the supply and demand situation in the electricity market and the use of local infrastructure were taken into account. The question of how to weigh both factors depends on the local infrastructure and the situation in the electricity market and could also be the subject of further studies. Based on the results of this study, a yearly cycle limit per vehicle between 20 and 100 seems plausible for a possible future implementation without significantly restricting the feedback potential.
Compared to the value of about 130 cycles mentioned in [32], this would lead to between 6.5 years in the case of optimization of self-consumption and 1.3 years in the case of arbitrage in which a car could provide energy to a small neighborhood via V2B (not regarding a restriction on operation time).
However, this statement is only valid for the assumed neighborhood, and further studies need to be conducted to generalize this statement. A sensitivity analysis of the energy demand of the neighborhood, energy supplied by photovoltaic sources and the number and driving pattern of electric vehicles needs to be conducted.

7. Conclusions

In this work, an LP optimization problem was formulated for the optimal energy management of a neighborhood that consists of private and commercial buildings with corresponding electricity and heat demands. The heat is supplied by an air–water heat pump and stored in thermal storage. Electricity is supplied by a PV system, and EVs are used as mobile storage. Three different tariff models, as well as stochastic mobility patterns and individual charging and discharging efficiencies of the EVs, were taken into account. If V 2 B is introduced in the neighborhood, self-sufficiency in the range of 50% to 54% degrees is achieved, the self-consumption rate is increased from 76% to 90%, the energy feed-in to the grid is reduced by 55.6% and the energy supplied by the grid is reduced by 13.4%. V 2 B is conducted differently, depending on the tariff model. All tariff models lead to optimization of self-consumption in summer, dynamic pricing leads to arbitrage during winter and power price tariffs avoid a peak in grid draw. The dynamic price model leads to regular peaks in grid consumption. If V2B is introduced, there are also periods during which no energy is drawn from the grid. The power price model avoids peaks in the power supply and has a lower variability than the other price models. If V2B is introduced, the maximum power drawn from the grid and the variability are reduced. The specific energy supplied by the vehicle per area is between 4.8   kWh −1 sqm −1 a (flat-fee) and 25.3   kWh −1 sqm −1 a (dynamic tariff). This corresponds to between 6.7% (flat tariff) and 35.7% (dynamic tariff) relative to the energy demands of the neighborhood, depending on the tariff model. Limiting the number of cycles results in a more even distribution of regenerated energy across the vehicle fleet while also allowing less efficient vehicles to be used. Especially when the number of cycles is limited to 20 for the flat-rate and performance price models and to 80 for the dynamic price model, there is a considerable decrease in the amount of energy fed back into the grid.

Supplementary Materials

The following supporting information can be downloaded at: https://www.mdpi.com/article/10.3390/en16114387/s1.

Author Contributions

Conceptualization, Y.P.; methodology, Y.P. and C.-F.K.; software, Y.P.; validation, Y.P. and C.-F.K.; formal analysis, Y.P.; investigation, Y.P.; data curation, Y.P.; writing—original draft preparation, Y.P.; writing—review and editing, C.-F.K.; visualization, Y.P. and C.-F.K.; supervision, C.-F.K.; project administration, Y.P. All authors have read and agreed to the published version of the manuscript.

Funding

This work received no external funding.

Data Availability Statement

The preprocessed time-series input data can be accessed in a public repository [46] (Supplementary Material).

Conflicts of Interest

The authors declare no conflict of interest.

Nomenclature

Abbreviations
BBuilding
B E V Battery electric vehicle
C o P Coefficient of performance
E F Energy flow
GElectrical grid
H P Heat pump
I W H Instantaneous water heater
NNode
P V PV plant
S o E State of energy ( kWh )
T H Thermal storage
V 2 H Vehicle-to-Home
V 2 B Vehicle-to-Building
Indices
e l e c Electrical
gGrid
nNode
f e e d i n Grid feed-in
v 2 h Vehicle-to-Home
b e v Battery electric vehicle
r a d Solar radiation
r e q Energy requirement
p v Photovoltaic
b u i l d Building
h p Heat pump
i w h Instantaneous water heater
i n i t Initial
m a x Maximum
t h Thermal storage
iIndex of the Month ( 1 12 )
tIndex of the time period, t T
Sets
B Set of all buildings
C Set of all BEVs
P Set of all PVs
T Set of all time periods
Variables
E g n , t EF from G to central N
E n g , t EF from N to G
E b e v n , t EF from b e v to N
E m a x , g n , i max. EF from G to N
in month i
E n b e v , t EF from N to B E V
E n h p , t EF from N to H P
E n i w h , t EF from N to I W H
E p v n , t EF from P V to N
E n b u i l d , t EF from N to B
Q t h n , t EF from T H to N
Q n t h , t EF from N to T H
Q h p n , t EF from H P to N
Q i w h n , t EF from I W H to N
Q n b u i l d , t EF from N to B
T t h , t Temp. of T H
S o E b e v , t S o E of BEV
Parameters
α Cooling coefficient of thermal storage
ASurface area of thermal storage
c e l e c , t Electricity price in time period t
c f e e d i n Electricity grid feed-in compensation
c v 2 h Compensation for energy provided by BEV
c m a x , p o w e r Price for maximum grid power
c p Thermal capacity of water
C o P t Coefficient of performance of heat pump
dEnergy consumption of BEV per distance
D t Driven distance of BEV in t
η b e v (Dis-)Charging efficiency of BEV
η t h (Dis-)Charging efficiency of thermal storage
η i n v Efficiency of inverter
η i w h Efficiency of water heater
η p v Efficiency of PV system in t
E b e v , m a x Max. energy flow to/from bev
E i n v , m a x Max. energy flow to/from inverter
E b u i l d , r e q , t Energy flow required by building in t
λ b e v , a t h o m e , t Is bev home in t
λ b e v , v 2 h Is bev capable of v 2 h
S o E b e v , m a x Max. S o E of BEV
S o E b e v , i n i t Initial S o E of BEV
T m i n Min. temp. of th. storage
T m a x Max. temp. of th. storage
T i n i t Initial temp. of th. storage
Q t h , m a x Max. energy flow from/to th.
storage
Q b u i l d , r e q , t Heat energy flow required by building in t
Q r a d p v , t Radiation energy to PV system
ζ b e v Efficiency of BEV battery

Appendix A

Table A1. Technical data of the PV modules, taken from [47].
PropertyValueUnit
Module nameMeyer Burger White
Module area1.84 m 2
Max. power400 W
Efficiency21.7%
Temp.-coefficient P M P P −0.259 % / K

Appendix B

P m a x , h e a t = 2.396 × 10 2 4.061 × 10 2 × T outside 2 + 8.500 × 10 3 × T supply 2 + 1.114 × 10 1 × T outside × T supply 1.095 × T outside 42 + 1.337 × T supply

Appendix C

T s u p p l y = 40.0 if   T s u p p l y 15 0.3579 × T o u t s i d e + 41.975 otherwise

Appendix D

Table A2. Technical data of the electric vehicle fleet.
Sim. IDModel NameQuantityBat. Capacity [kWh]Travelling Distance [km/a]Charging Efficiency [%]Max. Charging Power [kw]Energy Need [Wh/km]
20VW eup1328591883.614.7
21Mercedes EQC1808286861119.7
22Porsche Taycan1846779881120.8
23, 36, 37Renault Zoe3528242, 6778
18,516812217.9
24, 39Kia Soul16411,764, 5241877.216.5
25Seat Mii1327712857.214.8
26, 28BMW i32429417, 4478781114.0
27, 38, 43VW eGolf3329856, 12,931
4968907.216.1
29, 31Audi eTron2957654, 8654892222.9
30Opel Corsa1508147851117
32Smart forfour1188786932217.1
33, 42VW iD32779176, 9805901117.3
34Smart fortwo11810,293932217.1
35Tesla Model 31799007881117.5
40Nissan Leaf1628264916.620.6
41, 44Hyundai Ioniq2385912, 10,949877.414.2
45Skoda Citigo1328197887.214.7

References

  1. Günther, D.; Gniffke, P. Berichterstattung unter der Klimarahmenkonvention der Vereinten Nationen und dem Kyoto-Protokoll 2021; Technical Report; Umweltbundesamt: Dessau-Roßlau, Germany, 2021. [Google Scholar]
  2. Sterchele, P.; Brandes, J.; Heilig, J.; Wrede, D.; Kost, C.; Schlegl, T.; Bett, A.; Henning, H.M. Wege zu Einem Klimaneutralen Energiesystem; Technical Report; Fraunhofer Institute for Solar Energy Systems ISE: Freiburg, Germany, 2020. [Google Scholar]
  3. Bibra, E.M.; Connelly, E.; Gorner, M.; Lowans, C.; Paoli, L.; Tattini, J.; Teter, J.; LeCroy, C.; MacDonnell, O.; Welch, D.; et al. Global EV Outlook 2021—Accelerating Ambitions Despite the Pandemic; Technical Report; International Energy Agency: Paris, France, 2021. [Google Scholar]
  4. Rizvi, S.A.A.; Xin, A.; Masood, A.; Iqbal, S.; Jan, M.U.; ur Rehman, H. Electric Vehicles and their Impacts on Integration into Power Grid: A Review. In Proceedings of the 2nd IEEE Conference on Energy Internet and Energy System Integration (EI2), Beijing, China, 20–22 October 2018. [Google Scholar] [CrossRef]
  5. Nobis, C.; Kuhnimhof, T. Mobilität in Deutschland—MiD Ergebnisbericht (im Auftrag des BMVI); Technical Report; Federal Ministry for Transport, Building and Urban Development: Berlin, Germany, 2018. [Google Scholar]
  6. Liu, C.; Chau, K.T.; Wu, D.; Gao, S. Opportunities and Challenges of Vehicle-to-Home, Vehicle-to-Vehicle, and Vehicle-to-Grid Technologies. Proc. IEEE 2013, 101, 2409–2427. [Google Scholar] [CrossRef]
  7. Nazari, S.; Borrelli, F.; Stefanopoulou, A. Electric Vehicles for Smart Buildings: A Survey on Applications, Energy Management Methods, and Battery Degradation. Proc. IEEE 2021, 109, 1128–1144. [Google Scholar] [CrossRef]
  8. Kobashi, T.; Jittrapirom, P.; Yoshida, T.; Hirano, Y.; Yamagata, Y. SolarEV City concept: Building the next urban power and mobility systems. Environ. Res. Lett. 2021, 16, 024042. [Google Scholar] [CrossRef]
  9. Kobashi, T.; Choi, Y.; Hirano, Y.; Yamagata, Y.; Say, K. Rapid rise of decarbonization potentials of photovoltaics plus electric vehicles in residential houses over commercial districts. Appl. Energy 2022, 306, 118142. [Google Scholar] [CrossRef]
  10. Chang, S.; Cho, J.; Heo, J.; Kang, J.; Kobashi, T. Energy infrastructure transitions with PV and EV combined systems using techno-economic analyses for decarbonization in cities. Appl. Energy 2022, 319, 119254. [Google Scholar] [CrossRef]
  11. Ginigeme, K.; Wang, Z. Distributed Optimal Vehicle-To-Grid Approaches with Consideration of Battery Degradation Cost under Real-Time Pricing. IEEE Access 2020, 8, 5225–5235. [Google Scholar] [CrossRef]
  12. Nguyen, D.T.; Le, L.B. Joint Optimization of Electric Vehicle and Home Energy Scheduling Considering User Comfort Preference. IEEE Trans. Smart Grid 2014, 5, 188–199. [Google Scholar] [CrossRef]
  13. Biroon, R.A.; Abdollahi, Z.; Hadidi, R. Fast and Regular Electric Vehicle Charging Impacts on the Distribution Feeders. In Proceedings of the IEEE Industry Applications Society Annual Meeting, Baltimore, MD, USA, 29 September–3 October 2019; pp. 1–7. [Google Scholar] [CrossRef]
  14. Das, R.; Wang, Y.; Putrus, G.; Kotter, R.; Marzband, M.; Herteleer, B.; Warmerdam, J. Multi-objective techno-economic-environmental optimisation of electric vehicle for energy services. Appl. Energy 2020, 257, 113965. [Google Scholar] [CrossRef]
  15. Zenginis, I.; Vardakas, J.S.; Echave, C.; Morató, M.; Abadal, J.; Verikoukis, C.V. Cooperation in microgrids through power exchange: An optimal sizing and operation approach. Appl. Energy 2017, 203, 972–981. [Google Scholar] [CrossRef]
  16. Borge-Diez, D.; Icaza, D.; Açıkkalp, E.; Amaris, H. Combined vehicle to building (V2B) and vehicle to home (V2H) strategy to increase electric vehicle market share. Energy 2021, 237, 121608. [Google Scholar] [CrossRef]
  17. Quddus, M.A.; Shahvari, O.; Marufuzzaman, M.; Usher, J.M.; Jaradat, R. A collaborative energy sharing optimization model among electric vehiclecharging stations, commercial buildings, and power grid. Appl. Energy 2018, 229, 841–857. [Google Scholar] [CrossRef]
  18. Buonomano, A. Building to Vehicle to Building concept: A comprehensive parametric andsensitivity analysis for decision making aims. Appl. Energy 2020, 261, 114077. [Google Scholar] [CrossRef]
  19. Wang, B.; Yu, X.; Xu, H.; Wu, Q.; Wang, L.; Huang, R.; Li, Z.; Zhou, Q. Scenario analysis, management, and optimization of a new Vehicle-to-Micro-Grid (V2µG) network based on off-grid renewable building energy systems. Appl. Energy 2022, 325, 119873. [Google Scholar] [CrossRef]
  20. Cardoso, G.; Stadler, M.; Bozchalui, M.C.; Sharma, R.; Marnay, C.; Barbosa-Póvoa, A.; Ferrão, P. Stochastic Programming of Vehicle to Building Interactions with Uncertainty in PEVs Driving for a Medium Office Building. In Proceedings of the IECON 2013—39th Annual Conference of the IEEE Industrial Electronics Society, Vienna, Austria, 10–13 November 2013. [Google Scholar]
  21. Zhou, Y.; Cao, S.; Hensen, J.L.M.; Hasan, A. Heuristic battery-protective strategy for energy management of an interactive renewables–buildings–vehicles energy sharing network with high energy flexibility. Energy Convers. Manag. 2020, 214, 112891. [Google Scholar] [CrossRef]
  22. Zhou, Y. Energy sharing and trading on a novel spatiotemporal energy network in Guangdong-Hong Kong-Macao Greater Bay Area. Appl. Energy 2020, 318, 119131. [Google Scholar] [CrossRef]
  23. Guo, X.; Bao, Z.; Yan, W. Stochastic model predictive control based scheduling optimization of multi-energy system considering hybrid CHPs and EVs. Appl. Sci. 2019, 9, 356. [Google Scholar] [CrossRef]
  24. Moura, P.; Yu, G.K.W.; Mohammadi, J. Management of electric vehicles as flexibility resource for optimized integration of renewable energy with large buildings. In Proceedings of the 2020 IEEE PES Innovative Smart Grid Technologies Europe (ISGT-Europe), The Hague, The Netherlands, 26–28 October 2020; Volume 2020, pp. 474–478. [Google Scholar] [CrossRef]
  25. Schreck, S.; Sudhoff, R.; Thiem, S.; Niessen, S. On the Importance of Grid Tariff Designs in Local Energy Markets. Energies 2022, 15, 6209. [Google Scholar] [CrossRef]
  26. Ahsan, S.M.; Khan, H.A.; ul Hassan, N. Optimized power dispatch for smart building(s) and electric vehicles with V2X operation. Energy Rep. 2022, 8, 10849–10867. [Google Scholar] [CrossRef]
  27. Kern, T.; Dossow, P.; Morlock, E. Revenue opportunities by integrating combined vehicle-to-home and vehicle-to-grid applications in smart homes. Appl. Energy 2022, 307, 118187. [Google Scholar] [CrossRef]
  28. Singh, K.; Singh, A. Behavioural modelling for personal and societal benefits of V2G/V2H integration on EV adoption. Appl. Energy 2022, 319, 119265. [Google Scholar] [CrossRef]
  29. Higashitani, T.; Ikegami, T.; Uemichi, A.; Akisawa, A. Evaluation of residential power supply by photovoltaics and electric vehicles. Renew. Energy 2021, 178, 745–756. [Google Scholar] [CrossRef]
  30. Moura, P.; Sriram, U.; Mohammadi, J. Sharing Mobile and Stationary Energy Storage Resources in Transactive Energy Communities. In Proceedings of the 2021 IEEE Madrid PowerTech, Madrid, Spain, 28 June–2 July 2021. [Google Scholar] [CrossRef]
  31. Shen, Z.; Wu, C.; Wang, L.; Zhang, G. Real-Time Energy Management for Microgrid with EV Station and CHP Generation. IEEE Trans. Netw. Sci. Eng. 2021, 8, 1492–1501. [Google Scholar] [CrossRef]
  32. Reitberger, S. E-Auto von VW kann nun Strom in Netz speisen: Doch die Technik stößt an Grenzen. Available online: https://efahrer.chip.de/news/e-auto-von-vw-kann-nun-strom-in-netz-speisen-doch-die-technik-stoesst-an-grenzen_108599 (accessed on 22 May 2023).
  33. Perron, L.; Furnon, V. OR-Tools. Available online: https://developers.google.com/optimization/ (accessed on 22 May 2023).
  34. Deutscher Wetterdienst. Ortsgenaue Testreferenzjahre von Deutschland für Mittlere, Extreme und Zukünftige Witterungsverhältnisse; Research Report; Deutscher Wetterdienst: Offenbach, Germany, 2017.
  35. BDEW; VKU; GEODE. Leitfaden Abwicklung von Standardlastprofilen; Technical Report; BDEW; VKU; GEODE: Berlin, Germany, 2016. [Google Scholar]
  36. Bitterer, R.; Schieferdecker, B. Repräsentative VDEW-Lastprofile; Technical Report; Verband der Elektrizitätswirtschaft e. V. (VDEW): Frankfurt, Germany, 1999. [Google Scholar]
  37. Fünfgeld, C.; Tiedemann, R. Anwendung der Repräsentativen VDEW-Lastprofile; Technical Report; Verband der Elektrizitätswirtschaft e. V. (VDEW): Frankfurt, Germany, 2000. [Google Scholar]
  38. Quaschning, V. Simulation der Abschattungsverluste bei Solarelektrischen Systemen. Ph.D. Dissertation, Fachbereich Elektrotechnik der Technischen Universität, Berlin, Germany, 1996. [Google Scholar]
  39. Mattei, M.; Notton, G.; Cristofari, C.; Muselli, M.; Poggi, P. Calculation of the polycrystalline PV module temperature using a simple method of energy balance. Renew. Energy 2006, 31, 553–567. [Google Scholar] [CrossRef]
  40. Neuzulassungen. Available online: https://www.kba.de/DE/Statistik/Fahrzeuge/Neuzulassungen/neuzulassungen_node.html (accessed on 22 May 2023).
  41. ADAC Ecotest. Available online: https://www.adac.de/rund-ums-fahrzeug/tests/ecotest/ (accessed on 22 May 2023).
  42. Dimplex. Geräteinformationen Wärmepumpe. 2011. Available online: https://www.dimplex-partner.de/fileadmin/dimplex/downloads/projektierungshandbuecher/de/496-geraeteinformationen-wp-08-2012.pdf (accessed on 22 May 2023).
  43. Günther, D.; Wapler, J.; Langner, R.; Helmling, S.; Miara, M.; Fischer, D.; Zimmermann, D.; Wolf, T.; Wille-Hausmann, B. Wärmepumpen in Bestandsgebäuden—Ergebnisse aus dem Forschungsprojekt ´´WPsmart im Bestand”; Technical Report; Fraunhofer ISE: Greiburg, Germany, 2020. [Google Scholar]
  44. Europäische Kommission. Delegierte Verordnung (EU) Nr. 812/2013 der Kommission vom 18 Februar 2013 zur Ergänzung der Richtlinie 2010/30/EU des Europäischen Parlaments und des Rates im Hinblick auf die Energieeffizienzkennzeichnung von Warmwasserbereitern, Warmwasserspeichern und Verbundanlagen aus Warmwasserbereitern und Solareinrichtungen; Europäische Kommission: Brussels, Belgium, 2013; pp. 83–139. [Google Scholar]
  45. Schwencke, T.; Bantle, C. BDEW-Strompreisanalyse November 2021 Haushalte und Industrie; Technical Report; Bundesverband der Energie- und Wasserwirtschaft e.V. (BDEW): Berlin, Germany, 2021. [Google Scholar]
  46. Pohlmann, Y. Supplementary Data. 2022. Available online: https://gitlab.cc-asp.fraunhofer.de/smart-systems/open-data/7153 (accessed on 22 May 2023).
  47. Datenblatt—Meyer Burger White. Available online: https://www.meyerburger.com/fileadmin/user_upload/PDFs/Produktdatenblaetter/DE/Meyer-Burger_2022-06_Datasheet_Glass_DE_V02.pdf (accessed on 27 October 2022).
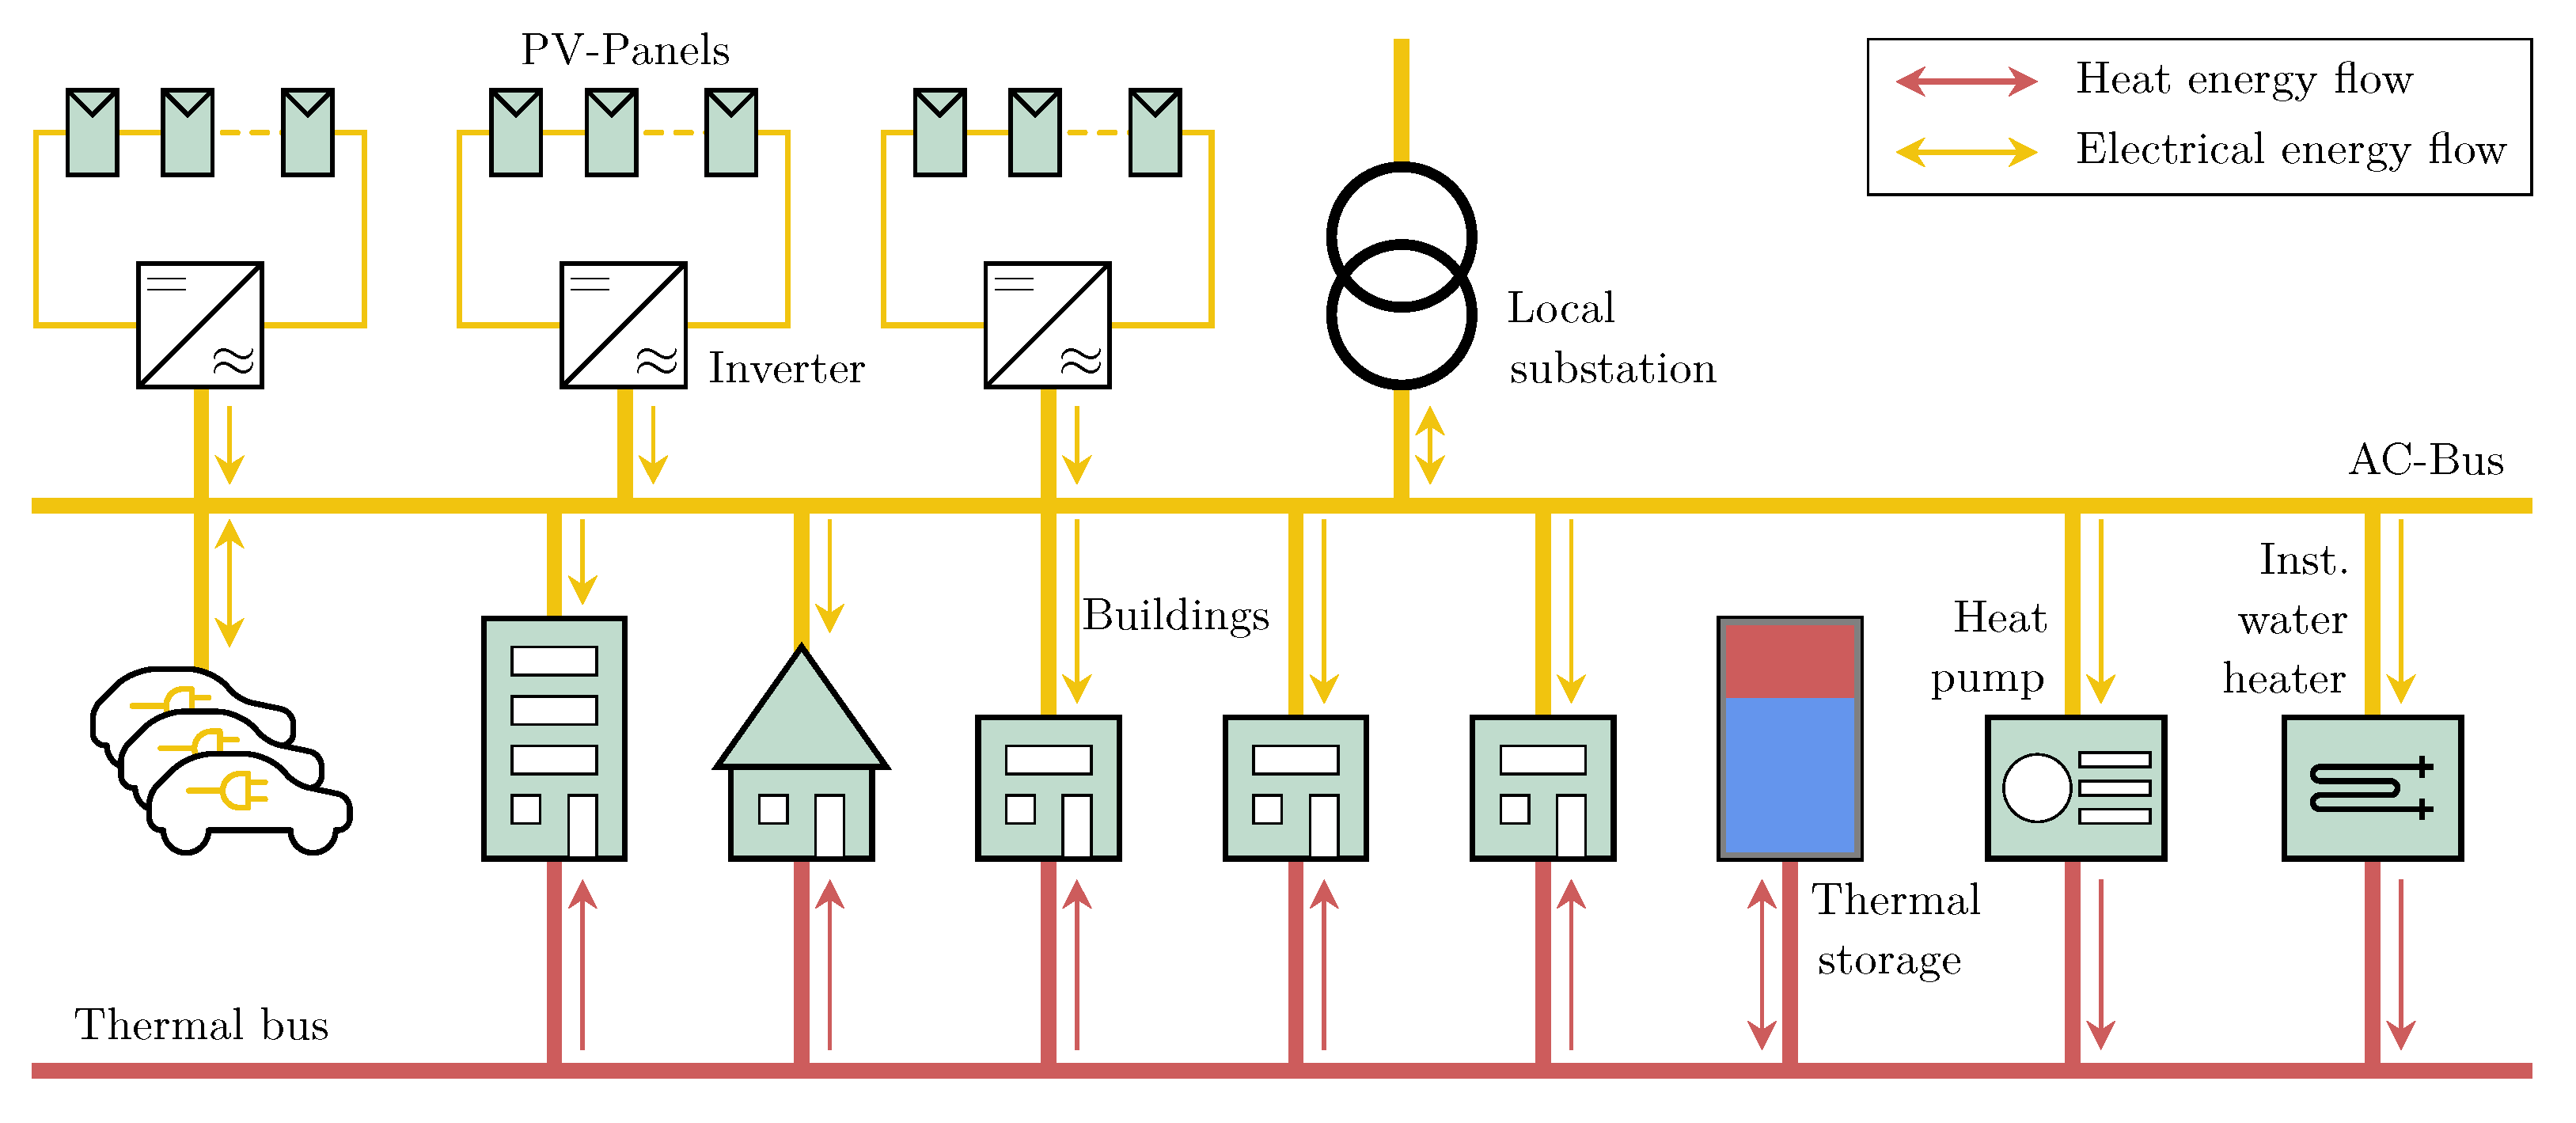
Figure 1. Overview of the energy system. Source: Own illustration.
Energies 16 04387 g001
Figure 2. Energy flows over the course of the year in MWh . Scenario 1a: flat rate, unidirectional. Source: own illustration.
Energies 16 04387 g002
Figure 3. Energy flows in scenarios with a flat price over the course of one summer week. Source: own illustration.
Energies 16 04387 g003
Figure 4. Course of energy flows in scenarios with dynamic price for one summer week and one winter week. Source: own illustration.
Energies 16 04387 g004
Figure 5. Course of energy flows in scenarios with power price for one summer week and one winter week. Source: own illustration.
Energies 16 04387 g005
Figure 6. Grid power draw over the course of the year as a function of pricing models and feedback capability. Source: own illustration.
Energies 16 04387 g006
Figure 7. Yearly V2B potential, grid supply and feed-in depending on the tariff structure and maximum permissible number of additional battery cycles. Cross signs = Simulation results. Source: own illustration.
Energies 16 04387 g007
Figure 8. Distribution of the energy supplied per vehicle depending on the tariff model and the cycle limit. Circles = Outliers. Source: own illustration.
Energies 16 04387 g008
Table 1. Structure and annual energy requirements of the assumed neighborhood.
TypeFloor Area [m 2 ]Heat Demand [kWh/m 2 a]Electricity Demand [kWh/m 2 a]Profile Type (Heat/Electricity)
SFH60053.316 HB HEF 03 /H0
MFH24003816 HB HMF 03 /H0
Gastronomy1004784GGA/G2
Retail20041323GHA/G4
Health20010873GBD/G1
Daycare507631GKO/G1
Office4475638GKO/G1
Sums3997186.5 [ MWh / m 2 a ]154.15 [ MWh / m 2 a ]
Table 2. Structure and nomenclature of the simulation scenarios.
Tariff ModelUnidirectional
Electric Vehicles
Bidirectional
Electric Vehicles
Flat tariff1 a1 b
Dynamic tariff2 a2 b
Power tariff3 a3 b
Table 3. Sums of selected energy flows over the course of a year, considering a yearly electricity demand of 156 MWh , heat demand of 187 MWh and energy provision by the PV system of 154 MWh . Source: own illustration.
No.Electricity Price ModelCharging BehaviorGrid Supply (MWh/a)Feed in (MWh/a)Charging BEV (MWh/a)Feedback BEV (MWh/a)
1aflatuni13436440
1bflatbi116166517
2adynamicuni13936440
2bdynamicbi1271615890
3apoweruni13537440
3bpowerbi117167424
Disclaimer/Publisher’s Note: The statements, opinions and data contained in all publications are solely those of the individual author(s) and contributor(s) and not of MDPI and/or the editor(s). MDPI and/or the editor(s) disclaim responsibility for any injury to people or property resulting from any ideas, methods, instructions or products referred to in the content.