Abstract
The present work aims at optimizing the geometry of curved trapezoidal winglets to enhance heat transfer rates (expressed as Colburn factor, j) and minimize pressure losses (expressed as friction factor, f). A fin-and-tube heat exchanger was analyzed with winglets mounted on the alternate tube and on either side of the fins. Multi-objective optimization was performed using the genetic algorithm (GA) to maximize j and minimize f. Two surrogate models, viz. response surface methodology (RSM) and artificial neural network (ANN), were considered as inputs to GA. To reduce the number of runs, a sensitivity analysis was first performed to select the most influential geometrical parameters for optimization. The values of j and f in the design of the experiments table were computed using CFD. The Pareto front points elucidated a significant improvement compared with the reference model along with a broad choice for the designers, not only for the design condition but also for the off-design inlet condition.
1. Introduction
Fin-and-tube heat exchangers (FTHEs) find numerous applications such as in automobile radiators, air conditioning, petrochemical industries, and many more. Conventional heat exchangers suffer a major drawback of high space requirements and low airside heat transfer coefficient. Several heat transfer enhancement techniques, viz. the use of nanoparticles, corrugated surfaces, elliptical tubes, wavy fin, and vortex generators in the flow field, have been reported in the last few years to overcome these setbacks and increase the overall thermo-hydraulic performance of heat exchangers.
Recently, the application of vortex generators (VGs) to increase the heat transfer coefficient on the airside has become popular to enhance HEs’ efficiency [1,2]—these VGs produce intense longitudinal vortices without many frictional losses [3]. Actually, VGs installed on the airside increase heat transfer by redirecting the main fluid flow toward the recirculation zone. However, the increase in heat transfer is accompanied by enhanced pressure losses and this sets the foundation for the optimization of vortex generator geometry (in our case, curved trapezoidal winglets). VGs can be arranged in common flow-up and flow-down configurations; the former is known to be more efficient in accelerating the flow and delaying flow separation [3,4,5,6,7,8]. The tubes can be arranged in an inline or staggered array arrangement in an FTHE [9,10]. The shape of the tubes in an FTHE is generally circular, but elliptical tubes have also been reported in the open literature [5].
The geometry of the VG plays a major role in heat transfer by creating additional turbulence in the flowing fluid downstream. A comparative study was performed by [11] between curved rectangular winglets, sinusoidal wavy rectangular winglets, and rectangular winglets in an FTHE, and the authors reported that wavy rectangular VGs provided the highest heat transfer enhancement. In an FTHE, the fin pitch, longitudinal tube pitch, transverse tube pitch, length of vortex generator, the height of vortex generator, and attack angle of the delta winglet type VG were found to be the most important geometric entities in the view of thermal performance [12].
Apart from the straight profiles of the winglet, curved profiles have also gained popularity [13,14]. An experimental investigation was reported on the comparison of the shapes of the VG, viz. rectangular, delta, and trapezoidal with straight as well as curved profiles, by Zhou et al. [15] and via numerical simulation by Lu et al. [16] and Esmailzadeh et al. [17]. They reported that curved profiles are more promising to increase the thermal performance of the HE. In addition, a similar study was reported with punched holes near the base in VGs, wherein the pressure losses were reduced with a punched hole configuration [18,19,20]. The effect of the position and geometry of a curved VG in an FTHE was studied by Oh et al. [21]. A CFD study on an FTHE having a curved rectangular VG and staggered tube arrangement was reported by Gong et al. [19], with an aim of predicting the optimum design parameters, viz. circumferential position, radial position, base length, edge height, and fin spacing. Apart from a surface-mounted VG, some modified fin structures such as brazed plate HE [22], double-pipe HE [23], finned tube [24], and microchannel heat sink [25] have also been reported. One such surface modification in the form of arc-shaped baffles, studied and optimized by Promvenge et al. [26], reported that a 90° angle of arc-shaped baffles and a pitch ratio of 8 offered the highest heat transfer enhancement. The impact of tube diameter and fin pitch on the Nusselt number (Nu) in an FTHE with a punched delta winglet VG and punched rectangular VG was investigated by Wu et al. [27] and Tian et al. [28]. The experimental results revealed that the fin pitch had a more prominent effect on Nu compared to the tube diameter.
Apart from analyzing the impact of variations in an individual design parameter, multi-objective optimization studies have also been reported in the open literature. The latter is advantageous to achieve the global optimized value(s) of the design parameters to enhance the overall thermal performance of the HE. Different optimization techniques have been proposed and used by various researchers to achieve the goal, viz. RSM (response surface methodology) [29], ANN (artificial neural network), and GA (genetic algorithm). An optimization study utilizing RSM was reported by [30] for the optimization of the Ranque-Hilsch vortex tube refrigerator and found that the number of intake nozzles and orifice diameter largely influenced the rate of heat transfer. Hosseinirad et al. [31] performed a CFD investigation for the analysis of wavy VG and used RSM for its optimization. Kanaris et al. [32] employed RSM and developed a correlation between the design parameters and response variables based on the CFD results, and later on predicted the optimal design for the plate HE. Khaljzadeh et al. [33] performed a similar study using RSM on vertical ground HE.
A comparative study between the RSM- and ANN-based optimization techniques applied in a V-down rectangular channel was reported by Chamoli et al. [34]. It was further stated that RSM is more accurate in predicting, with a maximum deviation of 5%. Apart from RSM, several researchers performed combined analyses using CFD, RSM, and GA. For instance, Lemouedda et al. [35] optimized delta winglet VGs in a fin-and-tube HE for an optimum VG shape and attack angle. A similar investigation was performed by Sun et al. [36] but for elliptical tubes instead of circular ones. Gholap et al. [37] optimized the energy consumption and material cost in an HE for refrigerators. The effect of fin spacing, the ratio of longitudinal to transverse tube pitch, and the attack angle of the delta winglet in an FTHE were studied by Wu et al. [38] using RSM, and optimized using GA. Similar optimization techniques have been used by several authors, for instance, for the analysis and optimization of a novel helical coil tube in a tube HE by Liu et al. [39], and in a conical strip VG by Zheng et al. [40]. A comparative study between RSM and direct optimization (DO) was performed by Salviano et al. [41] to optimize the VG angle and position in an FTHE and they also studied the influence of VG roll angle on heat transfer. They reported that the DO approach delivered better results than the RSM approach.
The artificial neural network (ANN) approach has gained immense popularity in the last few decades due to its capability to tackle non-linearity with great accuracy [42,43]. The work of Haykin [44] and Eeckman [45] provides a detailed history and mathematical background of neural networks. Berber et al. [46] used ANN for the prediction of heat transfer in a circular tube. A double-pipe HE with delta-wing-type inserts was studied by Kocyigit et al. [47] and Khan et al. [48] and they used ANN to validate the results with experimental data. Several authors used ANN as a surrogate model and GA for optimization. For instance, CFD, ANN, and GA have been clubbed together for the optimization of wavy fin-and-tube HE by Li et al. [6], who reported that an increase in corrugation height and angle of attack have a positive impact on the heat transfer. Additionally, a wavy fin height of 1.8 mm and an attack angle of 60° produced a maximum heat transfer effect. In a similar study, Abdollahi et al. [3] optimized the winglet geometry. Khan et al. [49] studied the trapezoidal and rectangular VG, attack, and attach angle in a plate-fin channel and concluded that an attack angle between 45 and 60° and an attached angle of 60° are the most suitable for maximum heat transfer and minimum pressure losses. Song et al. [8] studied a wavy fin with a circular tube HE equipped with a curved VG, and a maximum enhancement in heat transfer of 30.6% was achieved. Instead of surface modifications, some researchers opted for an active heat transfer enhancement method, introduced nanofluid for increasing the heat transfer performance [50], and achieved a maximum enhancement of 82%. Ke et al. [51] considered winglet attack angle for optimization to enhance the performance of the HE.
From the literature, it can be confirmed that numerous experimental and numerical studies have been performed to analyze and ultimately enhance the heat transfer performance of heat exchangers equipped with vortex generators. The experimental and numerical studies on curved winglets [52,53] are limited and the scope for multi-objective optimization is vast. Thus, the present focus is on a multi-objective genetic algorithm (MOGA) with an intention of increasing the heat transfer capability and minimizing the pressure losses, and thus generating a set of optimal data points (Pareto fronts) that best satisfies the objective.
Although RSM/ANN has been used in some of the multi-objective studies, the present work incorporates both of these approaches (separately) for establishing a relation between design parameters and objective function and then applying MOGA to compute Pareto fronts. Although Sarangi et al. [54] performed multi-objective optimization of the curved trapezoidal winglets, they considered only three parameters for optimization, viz. trailing edge height, arc radius, and the angle subtended on the tube center. Apart from these parameters, the present work accounts for the winglet front edge height and the eccentricity of winglets for analysis. Furthermore, the most sensitive parameters are considered for optimization.
To summarize, the theme of the present study is to enhance the overall thermal performance of the FTHE by optimizing the curved trapezoidal winglet geometry. To achieve this, the work is planned as follows: first, the flow domain is modeled using curved trapezoidal winglets on alternate fin walls placed on either side. Second, different levels of mesh are generated and tested to ensure the results are grid-independent, followed by a validation study to justify the solver settings and boundary conditions used. Third, before proceeding with optimization, the critical parameters having a significant effect on the performance of the HE are identified. Fourth, based on these parameters, the design of the experiment (DoE) is prepared using the factorial design method. Fifth, we make use of response surface methodology as well as the Bayesian-regularized ANN surrogate model as the two separate surrogate models. Sixth, a multi-objective optimization study is performed using GA to maximize the heat transfer and minimize the pressure losses, and two separate Pareto fronts are generated using RSM and ANN surrogate models. Finally, a few Pareto fronts, selected from both of the surrogate models, are selected and compared with the CFD results to measure the relative error and explore the flow physics of the optimized models.
2. Model Description
2.1. Geometry of Fin-and-Tube Heat Exchanger
In the present work, we used the HE geometry proposed by Joardar and Jacobi [55] as the reference model—the same was also used for validation. Different experiments were carried out by Joardar and Jacobi [55] on HEs, having seven inline rows of tubes. The first HE did not incorporate any winglets and this model was taken as the baseline model (BLM) here. They also considered one and three pairs of the delta winglets mounted on one and three (alternate) tubes, respectively, and these models were compared to the optimized models. Regarding the geometrical details, the tubes have a diameter (D) of 10.67 mm, transverse pitch (Pt), and longitudinal pitch (Pl) of 25.4 mm each. The length (L) of the FTHE was 177.8 mm, the fin pitch (Fp) was 3.63 mm, and the fin thickness (t) and winglet thickness were 0.18 mm each. Instead of delta winglets—as taken by Joardar and Jacobi [55]—we considered curved trapezoidal winglets mounted alternately on either side of the fin surface as well as on the alternate tubes. A detailed view of the geometry is presented in Figure 1.

Figure 1.
Detailed schematic view of the heat exchanger (a) entire model; (b) side view of the fin and tube heat exchanger; (c) computational domain.
Figure 1a represents the geometry of the entire model. Owing to its symmetrical nature, we considered a small part of the entire domain (marked by the enclosure). Due to the repetitive nature of the geometry about the plane containing the fin surface (cf. Figure 1b), a periodic boundary condition was applied to these plates (with half the thickness of the original fin plate). The implementation of the two approaches largely reduced the size of the geometry, and hence the computational overheads. As mentioned earlier, the winglets were mounted on either side of the fin plate (cf. Figure 1b) and the alternate tubes (cf. Figure 1c).
2.2. Equations Used for Calculating the Performance of HE
The performance of an HE is expressed in a dimensionless form and computed based upon several parameters, in accordance with Joardar and Jacobi [55], as follows:
Here, is the mass flow rate in kg/s, is the specific heat capacity in J/kgK, and are the area-weighted average temperature at the outlet and inlet, respectively, in Kelvin (K), is the wall temperature, is the density of air in kg/m3, is the inlet velocity in m/s, is the kinematic viscosity in Pa·s, and are the pressure at the inlet and outlet, respectively, in Pascal (Pa), and is the Prandtl number defined as the ratio of kinematic viscosity (μ) and thermal diffusivity (α). B is the width of the computational domain and is equal to 25.4 mm. The Colburn factor (j) was used to calculate the heat transfer and the friction factor (f) was used to represent the pressure drop. The enhancement factor, given by Equation (11), was adopted from Webb and Kim [56], where j and f are calculated based on the selected Reynolds number (Re), and jo and fo are reference values taken from the baseline model under similar operating conditions. Using these reference values in the equation makes it a non-dimensional parameter, useful for calculating the rating.
2.3. Description of Numerical Simulation
Across the last few decades, computational fluid dynamics (CFDs) have gained tremendous popularity and have been widely used as a robust tool for thermal and fluid flow analysis [57]. CFD is a well-proven numerical technique and the best alternative to experimentations due to significantly fewer capital investments, higher accuracy, and lesser time requirement. If performed carefully, the CFD calculations are as good as the experimental results. Furthermore, with CFD, we have the advantage to visualize and extract the flow field details at any time. It also provides the flexibility to make changes in the geometry during design optimization with no additional cost factor involved, other than the power consumption by the hardware.
The present study makes use of Menter’s transition shear stress transport (SST) model—a four-equation model—together with curvature correction for modeling turbulence. This transition model utilizes the two equations of the SST turbulence model along with two additional transport equations, viz. gamma (γ) for determining intermittency and Reθ for determining laminar–turbulent transition process determination [58].
The following governing equations are solved for the fluid zone:
Continuity equation:
Momentum equation:
Energy equation:
Here, E signifies the total energy, and the effective thermal conductivity is given by = + , where is the turbulent thermal conductivity.
The transition SST model uses the standard SST model as the base, given in terms of the turbulent kinetic energy (k) and specific rate of turbulence dissipation (ω), as follows:
The two transport equations relating to the intermittency and transition momentum thickness Reynolds number, coupled with the original SST model, i.e., Equations (15) and (16), respectively, are given as follows:
The energy equation in the solid regime reads as follows:
Here, refers to the conductivity matrix.
For further details on the production term (Pk), destruction term (blending function (F1), the turbulent viscosity (µt), and all of the other terms, including the details of the model constants, we referred to [59,60].
2.4. Discretization of the Solution Domain and Solver Settings
The first step in CFD is to discretize the entire domain into small control volumes (cells) over which governing equations are solved to generate a flow field. In the present work, we used hexahedral cells to discretize both fluids as well as solid domains. Ansys workbench was used to generate the Cartesian mesh over the entire volume and prism layers were provided over the cold tube walls to accurately capture the temperature gradients. The Cartesian cells were orthogonal, and hence, of high quality—they quickly filled up the entire domain and were trimmed off to conform to the solid boundaries. Furthermore, these cells are less diffusive in nature compared to the tetrahedral cells. Local grid refinement was conducted on the winglet walls using the octree method. Figure 2 shows the mesh details over the fins, cooling tubes, and VGs. The fin walls were made separately in ICEM CFD and appended as a case file in FLUENT, and interfaces were made between the solid and fluid domains manually so that conjugate heat transfer could take place.
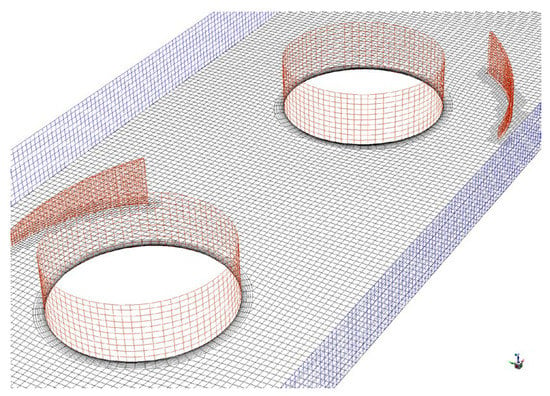
Figure 2.
A detailed view of the surface mesh.
Next, we performed a detailed study on the dependency of grid count on the performance parameters of the HE. Seven different levels of mesh were considered for analysis, and the percentage deviation from the experimental results is shown in Table 1. It becomes apparent that after the fourth level of mesh, the deviation is less than 3%—the closest agreement is observed with the finer mesh consisting of more than 1 million cells. To obtain a good balance between the accuracy and the computational time, the grid topology corresponding to 332 K cells was selected for all future work.

Table 1.
Effect of cell counts on the performance, and deviation from the experimental data.
Air was taken as a working medium with a density of 1.225 kg/m3 and viscosity of 1.885 × 10⁻⁵ kg/ms. At the inlet, the velocity inlet boundary condition was used, and a uniform velocity profile was prescribed with a mean velocity of 2.14 m/s, corresponding to a Reynolds number of Re = 634.5 at a temperature of 310.6 K. On the outlet plane, a pressure outlet boundary condition was used with the gauge pressure amounting to zero, and for backflow, a normal to boundary method was quoted. The temperature of the cold tubes was kept constant at 291.77 K. For aiding the conjugate heat transfer between fluid, fin walls, and winglets, the coupled boundary condition was implied. A no-slip boundary condition (u⸱ = 0) was applied for the tube walls, fin surface, and winglets.
Referring to the schematic diagram of the HE (Figure 1), and as discussed earlier, a symmetry boundary condition was applied to the fluid zone over the plane described in Figure 1a—no flow takes place across these surfaces. Owing to the repeatability across the fin walls (cf. Figure 1b), a periodic boundary condition was applied. The application of these boundary conditions together reduces the size of the computational domain significantly with no loss in accuracy. The SIMPLEC (semi-implicit method for pressure-linked equation consistent) method was applied for the pressure velocity coupling. Standard discretization was implied for pressure. The QUICK scheme was implied for the discretization of turbulent kinetic energy, intermittency, momentum, specific dissipation rate, and momentum thickness Re and energy equations [61,62].
2.5. Validation and Methodology
The numerical model was validated against the experimental data of Joardar and Jacobi [55], consisting of a 3 VG pair array (cf. Figure 1, p. 1158). Figure 3 shows the variations in the heat transfer coefficient with different Re against the experimental data. A close agreement exists between the numerical calculations and the reference data—a maximum deviation of 8.94% (only at the highest Re) and a minimum deviation of 0.46% are observed.
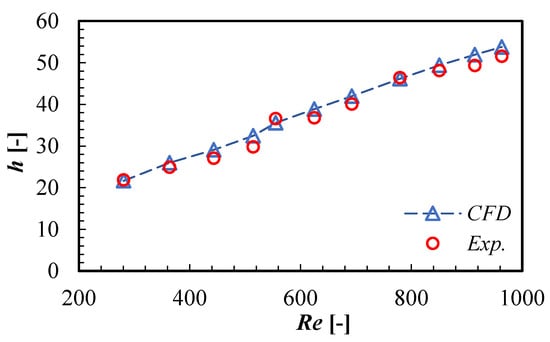
Figure 3.
Comparison of numerical simulation results with the experimental results from Joardar and Jacobi [55].
2.6. Selection Criteria of Geometric Entities for Optimization
The effect of radius, the angle subtended by the winglet on tubes, the winglet leading as well as trailing edge heights, and eccentricity provided to the winglets upon heat transfer and pressure drop were studied. Here, one parameter is varied at a time while imposing three different values (to all of the other geometrical entities), namely, lower, middle, and upper bounds (also, cf. Table 2), as shown in Figure 4. The conclusive results indicate the following:
- With an increase in radius (r), both j and f values increase for the upper bound values of other parameters and this change is significant. For the middle bound values, the change in both j and f values is mild. At the lower bound, the j as well as f values decrease moderately until r = 9.5 mm and then increase with a further increase in r. This indicates the prominent impact of r at the upper bound values.
- The j and f values both increase with an increase in θ at the upper bound until θ = 60°, followed by nearly no change in the j value while the f value still increases. A similar trend is seen for the j value at the middle bound—initially, it increases until θ = 60° and then decreases by a small amount, while the f value increases consistently. At the lower bound, the j value decreases until θ = 45° and then increases mildly with θ, whereas the f value first undergoes reduction up until θ = 45° and thereafter it is nearly a constant.
- With an increase in the leading edge height (h1), at the upper bound both the j and f values increase. At the middle bound, the j values first increase until h1 = 2 mm and then remain constant while the f value continues to increase mildly. At the lower bound, the j value undergoes a more significant reduction than the f values do.
- The values of j and f increase with an increase in trailing edge height (h2) at the upper bound and middle bound while this increase is significant at the upper bound. At the lower bound, the variations are quite small.
The effect of eccentricity on the j and f values is as follows: At the upper bound, the variations in the j values resemble a sinusoidal pattern of very low amplitude, while the f values elucidate a mild but continuous increment. At the middle bound for the j value, there is a slight increase up to e = 5 mm, followed by a decreasing pattern, and again a mild increase beyond e = 7 mm. The f values increase slightly with the eccentricity at the upper bound, while beyond e = 7 mm, a slight reduction is observed. However, in contrast to the upper bound results, at the lower bound, the f value (although small) reduces continuously with an increase in eccentricity values.
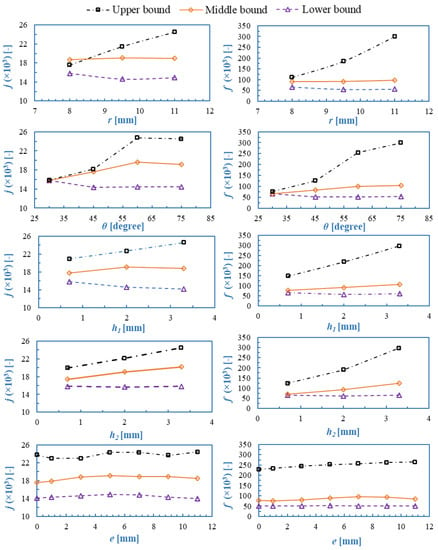
Figure 4.
Variation in j and f values with changes made in the design parameters.

Table 2.
Settings for the DoE.
Table 2.
Settings for the DoE.
| Variable | Quantity | Lower Bound | Upper Bound |
|---|---|---|---|
| r | Winglet radius (in mm) | 8 | 11 |
| The angle subtended by winglet (in degrees) | 30 | 75 | |
| h1 | Winglet leading edge height (in mm) | 0.7 | 3.3 |
| h2 | Winglet trailing edge height (in mm) | 0.7 | 3.3 |
A general trend shows that with an increase in the values of the design parameters, the heat transfer and pressure drop both increase, particularly at the upper bounds. This is due to the fact that for the upper bound values of the geometrical parameters, a large amount of fluid from the mainstream is directed toward the wake region and helps in improving the mixing of the fluid. At the lower bound values, there is a slight decrease in heat transfer since the smaller geometrical values may not be able to influence the flow field to the extent of the upper bound. Interestingly, with the middle bound option, the performance undergoes a change after a certain value (as discussed earlier in detail).
The conclusive results indicate that the eccentricity does not contribute significantly to the heat transfer process, whereas the other geometrical entities demonstrate a remarkable effect on the performance of the HE (particularly at the upper bounds and to a certain value in the middle bounds). Hence, we consider four geometrical entities, viz. the winglet radius, the angle subtended by the winglet, and the height of the leading edge and trailing edge of the winglets. The range of values considered for optimization has been represented in Table 2.
2.7. Design of Experiments
Numerous researchers have performed optimization studies taking into consideration the effect of single design parameters while keeping the others fixed. This is a time-consuming and local approach, and the results obtained may not reach a globally optimized value. Therefore, the most widely accepted and adopted technique is to design the experiments in accordance with some standard methods. This approach ensures the participation of all of the chosen design parameters, and hence, is interactive in nature. The values of the dependent variables for each combination of independent variables are calculated by making use of either experimentations, numerical simulations, or (semi-)empirical relations. The next step is to fit the surface over these data to generate the equations, which are then subjected to optimization; hence, this step (to generate equation(s) prior to optimization) is often called a surrogate method. The accuracy of the results is highly dependent on the way that the experiment is designed and calculated, the method used for surface fitting, and the approach used for optimization.
Since the design space is large, a three-level factorial design—that divides each factor into three levels, viz. lower, middle, and upper levels—was used in the present study to analyze the non-linear interaction of the design variables. Considering the design parameters, a sample space consisting of 34 = 81 design points was utilized to capture the quadratic relationship for each design variable. As mentioned earlier, four design parameters were chosen for optimization, and the extent of their variation is listed in Table 2. The chosen scheme fills the entire design space uniformly. The values of the Colburn factor (j) and friction factor (f) computed using CFD are listed for all of the design points in Table 3—since there are a large number of runs, only the first nine and last nine points are shown.

Table 3.
Input data for surrogate model.
3. Results and Discussion
3.1. Surrogate Modeling with RSM
The RSM is an accurate method for the prediction of the relationship between input, output, and optimization of the design. It involves a set of mathematical and statistical tools that are used to model and analyze the relationship between input variables and output responses. The methodology involves a variety of experiments that are designed to evaluate the effects of different input variables on the output responses of interest and to identify the optimal combination of input variables that produce the desired response. RSM typically involves the use of statistical models such as regression models and analysis of variance (ANOVA) to analyze the data and identify the significant factors that affect the response variables.
The responses are graphically represented in the three-dimensional space via a surface plot. The response variable R for the second-order model is expressed as the sum of a constant term, a linear term (of input variables), the interactive terms (between the two variables), quadric terms, and an error term. It is represented as follows:
where R is the response variable, and , ,, and are the regression coefficients for constant, linear, quadratic, and interactive terms, respectively. and are the independent variables and is the error term [29].
The main effect plot shows the impact of individual design variables on the objective function and helps to identify the most influential parameters. The effect of design parameters r, θ, h1, and h2 on j and f, respectively, has been shown in Figure 5. The slope and length of the curves signify the impact of the entity in concern. The direction represents the positive or negative influence on the performance [29]. With an increase in r, θ, and h2, the heat transfer increases sharply, while with an increase in h1, the heat transfer first increases and then flattens. The f values increase with an increase in design parameters and the trend is, somewhat, consistent for all of the independent variables.
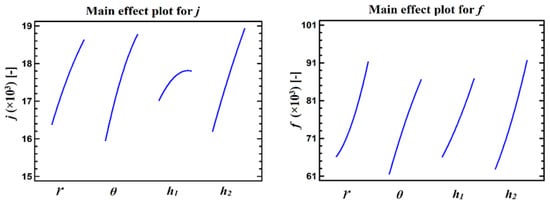
Figure 5.
Main effect plot for j and f.
Figure 6 and Figure 7 show the standardized effect of variables and their interactions on heat transfer and pressure drop, respectively, via the Pareto chart. Here, the vertical line (in red) corresponds to a 95% confidence level and the horizontal (bar) lines that cross this vertical line signify the most important terms (be it an individual term or interactive terms)—the length of the bar extending to the right from the vertical line represents its impact. From Figure 6 and the p-values in Table 4, twelve significant terms at a 95% confidence level are observed. Interestingly, θ and h2 are the most significant parameters, followed by r, and there is a comparatively lesser impact of h1 on heat transfer—all four of them represent the individual terms and have a positive impact on the j values. Among the interactive terms, θ − h2, θ − h1, and r − h2 are almost equally important, whereas r − θ and r − h1 have a moderate positive impact on j; however, h1 − h2 has a negative impact on the j value. The quadric terms are less influential, and all bear a negative impact on j—for instance, θ − θ and h1 − h1 bear the lowest significance, whereas r-r and h2 − h2 do not contribute much.
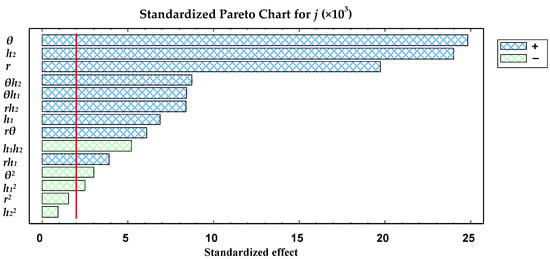
Figure 6.
Standardized Pareto chart for j showing the individual and interactive effects of design parameters.
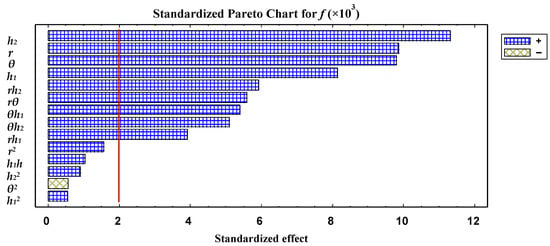
Figure 7.
Standardized Pareto chart for f showing individual and interactive effects of design p-rameters.

Table 4.
The p-values for j.
For the case of pressure drop, all of the individual terms have a positive impact; the Pareto chart in Figure 7 and p-values in Table 5 illustrate nine significant terms at the 95% confidence level. For instance, h2 is the most significant parameter, followed by r and θ, having an equal impact and comparatively lesser impact of h1. The interactive terms r − h2, r − θ, θ − h1, θ − h2, and r − h1 have a positive impact on f with r − h2 being the most influential and r-h1 being the least influential, with h1 − h2 as an insignificant term. The quadric terms are non-influential and bear a positive impact except for θ-θ, which has a negative impact.

Table 5.
The p-values for f.
h2, r, and θ again have the most effect on pressure drop compared with the leading edge height h1, in descending order. The obstruction in the flow field is the major cause of pressure drop and these three variables are mainly responsible for this. The leading edge is somewhat aligned with the fluid flow and thus does not play a significant role in the context to the pressure drop. Equations (21) and (22) represent the regression equation for j and f; the insignificant terms are not included in the equation.
Figure 8a shows the 3D response surface plot for j and the effect of θ − h2 is plotted when the other two variables r and h1 are at their mean value of 10.5 mm and 2 mm, respectively. The effect of h2 is more prominent than θ. Figure 8b shows the effect of f—here, again, h2 has a significant impact on f and θ obeys a linear relationship and has a minimal effect. Figure 8c shows the non-linear variation in j against r-h1 when the other two parameters θ and h2 are at their mean values of 52.5° and 2 mm, respectively. Here, h1 has a more significant effect than r on the heat transfer. Similarly, Figure 8d shows the impact on f—h1 has a linear relationship, while r has a non-linear relationship. Here, again, h1 is highly sensitive to pressure losses. To summarize, the impact of θ − h2 is more significant than r − h1 on j as well as f.
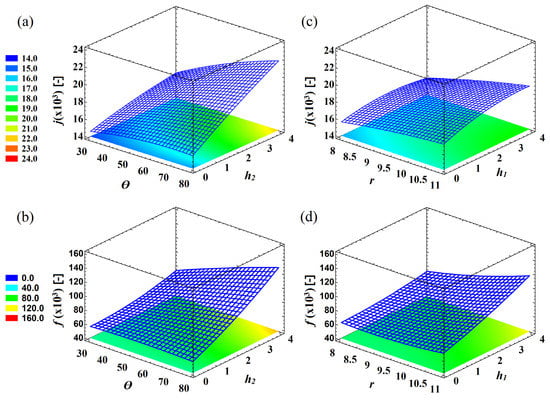
Figure 8.
Response surface plot for (a) effect of θ − h2 on j (b) effect of θ − h2 on f (c) effect of r − h1 on j (d) effect of r − h1 on f.
3.2. Surrogate Modeling with ANN
The ANN consists of neurons imitating the human brain, input layers, output layers (objective function), and hidden layers. It gives weights and biases to the parameters and develops a relationship between the responses without actually digging into the physical mechanism. Thus, it becomes a rapid surrogate model for obtaining the objective function [63]. Figure 9 and Figure 10 show the correlation coefficients (R) of training, testing, and total values as being 0.994, 0.985, and 0.992 for j and 0.999, 0.981, and 0.998 for f, respectively, which are fair figures to indicate a well-trained ANN. In addition, the target-predictor points accumulated near the backward diagonal of the graph, which means that the developed model is quite reliable in predicting the output for different sets of input variables within the test domain. An error histogram is plotted in Figure 11 for j as well as for f training data against the network output; the percentage error lies within a range of ±3% for both j as well as f. The maximum frequency around the zero-error line (highlighted in the red line in Figure 11) ensures an accurate and precise prediction.
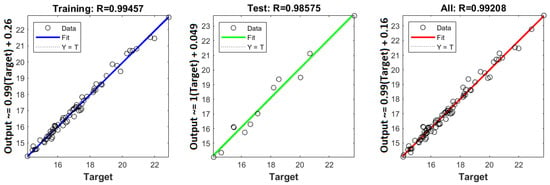
Figure 9.
Training, test, and target data for j.

Figure 10.
Training, test, and target data for f.
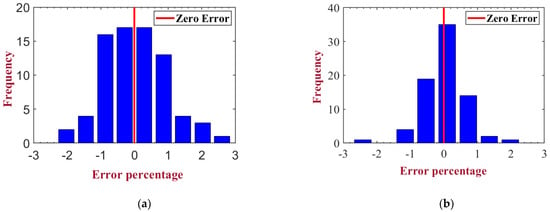
Figure 11.
Error histogram plot for (a) j and (b) f training data.
3.3. Genetic Algorithm for Multi-Objective Optimization
The genetic algorithm (GA), first introduced by John Holland [64], is a search algorithm based on natural selection and genetics. It has three operators, namely reproduction, crossover, and mutation. Reproduction is based on natural selection based on Darwin’s approach to survival of the fittest. Crossover takes place for the fittest individual in a randomized way followed by mutation, taking into account some of the distinct and important genetic qualities/notions which are again highly randomized. It has the advantage of a random choice for exploitative searches in the design space. The cycle continues until the stopping criteria are reached or the solution is achieved iteratively. The GA is widely used across various research areas; being a stochastic search tool, it allows us to find the global optimal solutions (maxima or minima) based on the objective function. In the present scenario, a multi-objective genetic algorithm (MOGA) was used to maximize the heat transfer and minimize the pressure drop, which are the two objectives of the present study. The MOGA is performed on two surrogate models, viz. RSM and ANN, which use the same DoE. The settings applied for the MOGA are mentioned in Table 6. The flow chart presented in Figure 12 summarizes all of the steps used in the optimization process. The generated Pareto fronts for RSM-GA (Variant R) and ANN-GA (Variant A) are listed in Table 7 and Table 8, respectively. The Pareto fronts from both of the surrogate models have a common trait of smaller winglets’ front edge height in comparison to the trailing edge height. The front edge of the winglet is the primary point where the fluid comes into contact with the winglet and it plays a vital role in trapping the flow and redirecting it toward the thermal isolation zone; a larger height would contribute to a higher pressure drop by creating an obstacle in the flow path without much increase in the heat transfer.

Table 6.
Genetic operators and parameters for multi-objective optimization.
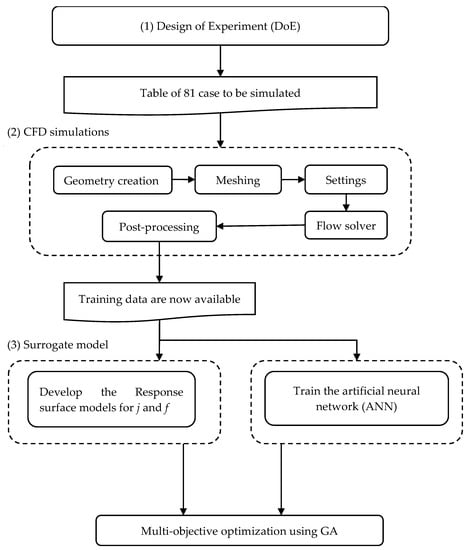
Figure 12.
Flow chart for the optimization framework.

Table 7.
Pareto front solution points using RSM and multi-objective genetic algorithm.

Table 8.
Pareto front solution points using ANN and multi-objective genetic algorithm.
3.4. Numerical Investigation of the Selected Models
Figure 13 shows the Pareto fronts obtained from the MOGA using two surrogate models, viz. RSM and ANN. To validate the optimized datasets, a few pareto front points were selected from both datasets—based upon a nearly similar j value—to perform CFD analysis. These points on the Pareto fronts were selected at a regular interval of j values and were further simulated using CFD. Here, Variant A represents the combination of ANN and GA, whereas Variant R represents the optimization based on the RSM and GA. It becomes apparent from the Pareto fronts that Variant A has a higher pressure drop than Variant R until point A21, and beyond that, Variant R has a higher pressure drop. The difference in pressure drop between Variant A and R until point A21 or R16 is quite less than the pressure drop observed beyond these points. Thus, we can say that Variant A has better heat transfer than Variant R for a wider range of design variables. This is because ANN has a better ability to capture the complex relationship between input variables and objective functions.
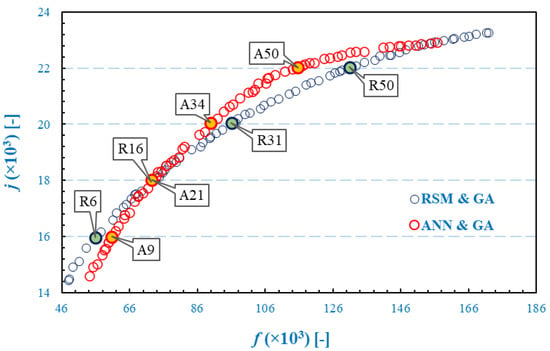
Figure 13.
Pareto front points for multi-objective optimization with RSM and ANN.
3.4.1. Flow Field Description
To validate the optimization results, we selected a few pareto front points in a way that the selected points from both variants had nearly similar heat transfer capability. Figure 14 shows velocity streamlines normalized with the inlet velocity (Uin) for the selected models from Variant R and Variant A Pareto fronts and then simulated using CFD at Re = 634.49. Due to constriction in the flow path near the cold tubes, the velocity of the fluid undergoes a substantial increase of approximately three times the inlet velocity. This increase in velocity is caused by flow acceleration, which occurs when the cross-sectional area of the flow path decreases, resulting in a rise in fluid velocity.
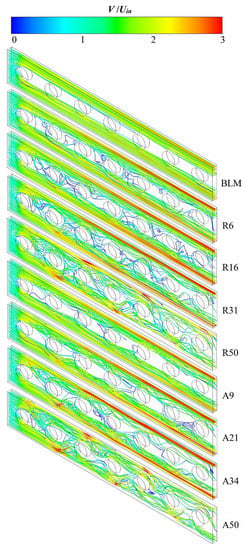
Figure 14.
Representation of velocity streamlines for the selected models at Re = 634.49.
The streamlines for the baseline model without winglets follow a straight line without significant mixing (or deflection toward the wake region). As the winglets are attached in the vicinity of the cold tubes, a part of the mainstream flow is diverted toward the recirculation zone. The size of winglets is increased from R6 to R50 and A9 to A50, and with this increase, more of the fluid is redirected toward the recirculation zone. This phenomenon takes place because the winglets’ increasing surface area comes into contact with a large amount of fluid stream and is able to give it a direction.
For a better understanding of the velocity distribution in the flow regime, a normalized velocity contour plot on the z = 0 plane is represented in Figure 15. For the baseline model, an unrestricted high-velocity flow can be observed between the cold tubes and the sidewalls. With the installation of winglets, the flow is directed toward the low-velocity recirculation zones and a better mixing of the fluid stream takes place in the wake region. For the models R50 and A50, the wake region formed is smaller compared to all of the other models due to the larger winglet size.
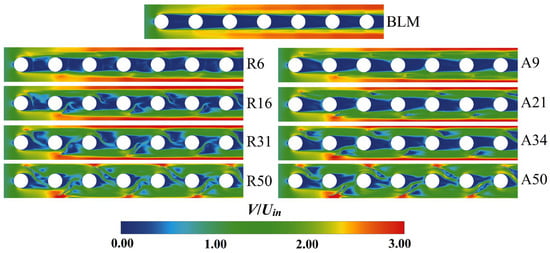
Figure 15.
Contour plots of normalized velocity at z = 0 plane for the selected models at Re = 634.49.
Figure 16 shows the plots of static temperature normalized with the inlet temperature. The plots show the low-temperature isolation zones formed between the cold tubes for the BLM. Furthermore, for the selected models, the size of these zones decreases with the increase in the winglet size due to the intermixing of the fluid streams. The reduction in temperature is quite evident after the fifth cold tube for models R31, R50, A34, and A50.
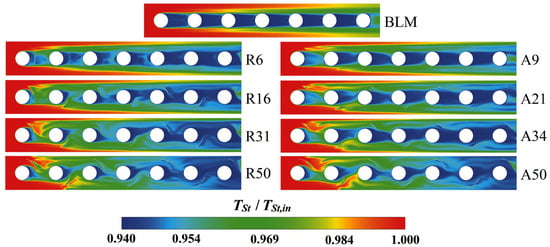
Figure 16.
Contour plots of normalized static temperature at z = 0 plane for the selected models at Re = 634.49.
Figure 17 shows the turbulence intensity (TI) plots to visualize the velocity fluctuations in the flow regime. It is defined as the ratio of the root mean square (RMS) velocity fluctuations to the mean velocity of the flow—a higher TI refers to higher levels of velocity and fluctuations and it promotes better mixing of fluids. For the BLM, the TI is insignificant, and some fluctuations are observed only in the region downstream of the cold tube walls due to the flow separation taking place past these tubes. In the models selected for analysis, the level of fluctuations increases with an increase in the winglet size and results in a higher heat transfer rate. The wake region is compressed behind the cold tubes for the case of model A9 and is narrower in comparison to R6. For model R16, the spots representing high TI values are formed behind the winglet front edge, while for model A21, high TI spots are formed only near the first cold tube and moderate TI is observed for the successive tube walls. Model R31 experiences higher fluctuations compared to A34, and high TI spots are formed behind the winglets for both of the models—model R31 turbulence is slightly higher behind each cold tube and the wake regions formed are also smaller compared to A34. Similarly, the high TI zones formed for R50 are larger than A50. The higher the TI in the flow regime, the more the disturbance in the flow field, and as a result of this there is better mixing of the hot and cold fluid, and low-temperature zones formed behind the cold tubes are suppressed (cf. Figure 15) by paying the penalty of higher-pressure losses shown in terms of friction factor f in Figure 13.
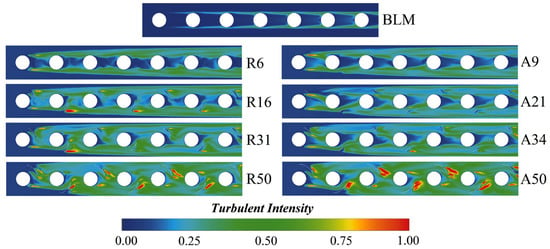
Figure 17.
Contour plots of turbulent intensity at z = 0 plane for the selected models at Re = 634.49.
3.4.2. Performance Analysis of GA and Validation of GA Prediction
Figure 18 shows the percentage deviation in the Pareto fronts of Variant R and Variant A with respect to the simulated values. The deviation in the j values is higher for the design points R6 and R16 compared to A9 and A21, while the deviation in A34 and A50 is on the higher side than in R31 and R50. The maximum deviation is 3.7% for Variant R and 1.7% for Variant A. With the increase in the values of the design parameters, the value of deviation shows a gradually increasing pattern for Variant R while Variant A first shows an increase in the deviation, and then it decreases after attaining the peak value. Now, the deviation in the f values for Variant R is higher for all of the designs than for Variant A.
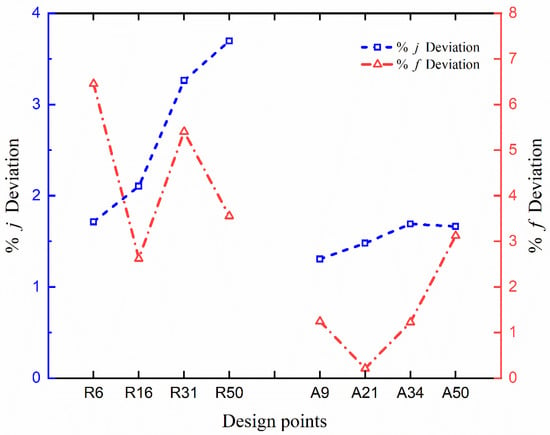
Figure 18.
Deviation in j and f predicted values from CFD.
The maximum deviation is 6.45% for Variant R and 3.12% for Variant A. The deviation in Variant R shows a fluctuating pattern while Variant A first shows a decreasing and then an increasing pattern. Variant A’s overall deviation in j and f is in the acceptable range and shows a better and more precise prediction. This is because the ANN approach has better flexibility and ability to handle complex (non-linear) relationships between input variables and response compared to RSM.
Table 9 provides a quantitative comparison between the enhancement factor obtained in the present optimization study for the selected model’s CFD simulation and that obtained from the recent contributions by some of the researchers. The present optimization study offers an enhancement by almost 100% compared to its BLM. The enhancement for Variant A is observed to be greater than for Variant R. Table 10 shows the numerically simulated values of j and f for the selected models and three reference models (BLM, 1VG, 3VG) from Joardar and Jacobi [55] with different Reynolds numbers. The results seem quite interesting. For instance, in the A21 model, with a decrease of 6.7% in the f-value, j increases by more than 42% compared to the 3VG model for the off-design condition. As another example, in the R31 model, with merely an increase of 7.44% in the f-value, there is a significant increase in the j value compared to the 1VG model for the on-design condition. Figure 19 gives a graphical representation of the variation in j values (to the left) and f values (to the right) with different Re. Interestingly, Variant A has f values that are significantly less for all of the Re while the j values are only slightly lesser than for Variant R for models A34 and A50 when compared to models R31 and R50, while model A21 has higher j values and lower f values compared to R16. Model A9 has both j and f values that are higher than model R6. It becomes apparent that Variant A is better than Variant R for on-design conditions as well as off-design conditions. Conclusive results have yielded that the present optimization study holds relevance for both industrial and academic applications. The present study offers a wide spectrum of options to the designers based on their specific requirements and suitability.

Table 9.
Performance comparison of the optimized designs with recent contributions from various researchers.

Table 10.
Performance comparison of the optimized points with the models used in Joardar and Jacobi [55] with different Re.

Figure 19.
Performance evaluation of the selected optimized model for on- and off-design conditions.
4. Conclusions
The present study was undertaken to optimize the performance of the FTHE with curved trapezoidal winglets installed on alternate tubes to maximize j and minimize f. The critical design parameters were first identified before proceeding to DoE using CFD simulation. The radius (r), the angle subtended on cold tubes (θ), the front edge height (h1), and the trailing edge height (h2) emerged as the most influential geometric entities for optimization. Considering these parameters, the DoE was prepared using a three-level factorial design which cumulated to a total of 81 design points. The resulting data were used to train RSM and ANN. The R2 values for the j and f values were 97% and 90 %, respectively. The deviation in the ANN prediction from the target data was limited to ±3% of the target data. The RSM and ANN data acted as surrogate models for the genetic algorithm (GA) for optimizing the four independent design variables. GA provided two separate Pareto fronts for both surrogate models in a wide prospect.
Some Pareto fronts were selected from the models to evaluate the accuracy of Pareto with respect to the CFD simulations. The maximum deviation in j for Variant R and Variant A was 3.7 and 1.7%, respectively. Similarly, the maximum deviation in f for Variant R and Variant A was 6.45 and 3.12%, respectively. The percentage deviation for Variant A was less than Variant R and hence Variant A is more accurate than Variant R. Additionally, the enhancement factor of Variant A is higher than Variant R.
It was observed that with the increase in the winglet’s size, a larger amount of mainstream flow was diverted toward the thermal isolation zone, enhancing the thermal intermixing, and suppressing the large eddies in that zone. The winglet’s front edge height is always smaller than the trailing edge height.
The CFD study based on the selected models from Pareto fronts confirmed that the heat transfer increased significantly along with the reasonable expense of pressure losses. Thus, the Pareto fronts obtained in this study would be beneficial to academicians as well as researchers across industries. The optimized models were also tested under the off-design fluid flow conditions, wherein their performance was still better for all values of Re.
Author Contributions
R.S.: methodology, software, formal analysis, investigation, validation, visualization, writing—original draft. D.P.M.: formal analysis, visualization, writing—original draft, writing—review and editing, supervision. L.S.B.: conceptualization, methodology, software, formal analysis, visualization, validation, writing—original draft, writing—review and editing, supervision. M.W.: methodology, software, writing—review and editing. All authors have read and agreed to the published version of the manuscript.
Funding
This research received no external funding.
Data Availability Statement
Not applicable.
Conflicts of Interest
The authors declare no conflict of interest.
Nomenclature
| r | Arc radius (mm) |
| θ | Angle subtended on tube center () |
| h1 | Winglet front edge height (mm) |
| h2 | Winglet trailing edge height (mm) |
| e | Eccentricity of winglets (mm) |
| h | Heat transfer coefficient (W/m2K) |
| j | Colburn factor |
| f | Friction factor |
| Inlet pressure (Pa) | |
| Outlet pressure (Pa) | |
| Area-weighted average temperature at the inlet (K) | |
| Area-weighted average temperature at the outlet (K) | |
| Wall temperature (K) | |
| Density (kg/m3) | |
| Specific heat capacities (J/kgK) | |
| l | Prandtl number |
| Inlet velocity (m/s) | |
| Hydraulic diameter (m) | |
| L | Flow length (m) |
| Minimum free flow area (m2) | |
| Total heat transfer surface area (m2) | |
| Kinematic viscosity (m2/s) | |
| Turbulent viscosity (m2/s) | |
| Mass flow rate (kg/s) | |
| Re | Reynolds number |
| ReDh | Reynolds number based on hydraulic diameter (m) |
| Pressure drop (Pa) | |
| Turbulent thermal conductivity (W/mK) | |
| Effective thermal conductivity (W/mK) | |
| Diffusion coefficient | |
| ω | Specific rate of turbulence dissipation (m2/s3) |
| E | Total energy |
| Pk | Production term |
| Destruction term | |
| Conductivity matrix | |
| F | Blending function |
| η | Enhancement factor |
| Subscripts | |
| Intermittency | |
| k | Turbulent kinetic energy |
| t | Turbulent |
| Momentum thickness | |
| Momentum thickness based on free stream | |
References
- Chai, L.; Tassou, S.A. A Review of Airside Heat Transfer Augmentation with Vortex Generators on Heat Transfer Surface. Energies 2018, 11, 2737. [Google Scholar] [CrossRef]
- Han, H.; Wang, S.; Sun, L.; Li, Y.; Wang, S. Numerical study of thermal and flow characteristics for a fin-and-tube heat exchanger with arc winglet type vortex generators. Int. J. Refrig. 2019, 98, 61–69. [Google Scholar] [CrossRef]
- Abdollahi, A.; Shams, M. Optimization of heat transfer enhancement of nanofluid in a channel with winglet vortex generator. Appl. Therm. Eng. 2015, 91, 1116–1126. [Google Scholar] [CrossRef]
- Gherasim, I.; Taws, M.; Galanis, N.; Nguyen, C.T. Heat transfer and fluid flow in a plate heat exchanger part I. Experimental investigation. Int. J. Therm. Sci. 2011, 50, 1492–1498. [Google Scholar] [CrossRef]
- Godazandeh, K.; Ansari, M.; Godazandeh, B.; Ashjaee, M. Optimization of the Angle of Attack of Delta-Winglet Vortex Generators Over a Bank of Elliptical-Tubes Heat Exchanger. In Proceedings of the ASME 2013 International Mechanical Engineering Congress and Exposition, Heat Transfer and Thermal Engineering, San Diego, CA, USA, 15–21 November 2013. [Google Scholar] [CrossRef]
- Li, W.; Khan, T.A.; Tang, W.; Minkowycz, W.J. Numerical Study and Optimization of Corrugation Height and Angle of Attack of Vortex Generator in the Wavy Fin-and-Tube Heat Exchanger. J. Heat Transf. 2018, 140, 111801. [Google Scholar] [CrossRef]
- Dezan, D.J.; Rocha, A.D.; Ferreira, W.G. Parametric sensitivity analysis and optimisation of a solar air heater with multiple rows of longitudinal vortex generators. Appl. Energy 2020, 263, 114556. [Google Scholar] [CrossRef]
- Song, K.; Hu, D.; Zhang, Q.; Zhang, K.; Wu, X.; Wang, L. Thermal-hydraulic characteristic of a novel wavy fin-and-circle tube heat exchanger with concave curved vortex generators. Int. J. Heat Mass Transf. 2022, 194, 123023. [Google Scholar] [CrossRef]
- Lin, Z.-M.; Liu, C.-P.; Lin, M.; Wang, L.-B. Numerical study of flow and heat transfer enhancement of circular tube bank fin heat exchanger with curved delta-winglet vortex generators. Appl. Therm. Eng. 2015, 88, 198–210. [Google Scholar] [CrossRef]
- Lin, Z.-M.; Li, S.-F.; Liu, C.-P.; Wang, L.-B.; Zhang, Y.-H. Thermal and flow characteristics of a channel formed by aligned round tube bank fins stamped with curve delta-winglet vortex generators. Therm. Sci. Eng. Prog. 2021, 26, 101113. [Google Scholar] [CrossRef]
- Modi, A.J.; Rathod, M.K. Comparative study of heat transfer enhancement and pressure drop for fin-and-circular tube compact heat exchangers with sinusoidal wavy and elliptical curved rectangular winglet vortex generator. Int. J. Heat Mass Transf. 2019, 141, 310–326. [Google Scholar] [CrossRef]
- Zeng, M.; Tang, L.; Lin, M.; Wang, Q. Optimization of heat exchangers with vortex-generator fin by Taguchi method. Appl. Therm. Eng. 2010, 30, 1775–1783. [Google Scholar] [CrossRef]
- Xie, J.; Lee, H.M. Flow and heat transfer performances of directly printed curved-rectangular vortex generators in a compact fin-tube heat exchanger. Appl. Therm. Eng. 2020, 180, 115830. [Google Scholar] [CrossRef]
- Xie, J.; Lee, H.M. Thermo-Hydraulic Performance of a Fin-and-Tube Heat Exchanger with Differently Configured Curved-Rectangular Vortex Generators. Heat Transf. Eng. 2020, 43, 63–82. [Google Scholar] [CrossRef]
- Zhou, G.; Ye, Q. Experimental investigations of thermal and flow characteristics of curved trapezoidal winglet type vortex generators. Appl. Therm. Eng. 2012, 37, 241–248. [Google Scholar] [CrossRef]
- Lu, G.; Zhou, G. Numerical simulation on performances of plane and curved winglet – Pair vortex generators in a rectangular channel and field synergy analysis. Int. J. Therm. Sci. 2016, 109, 323–333. [Google Scholar] [CrossRef]
- Esmaeilzadeh, A.; Amanifard, N.; Deylami, H. Comparison of simple and curved trapezoidal longitudinal vortex generators for optimum flow characteristics and heat transfer augmentation in a heat exchanger. Appl. Therm. Eng. 2017, 125, 1414–1425. [Google Scholar] [CrossRef]
- Zhou, G.; Feng, Z. Experimental investigations of heat transfer enhancement by plane and curved winglet type vortex generators with punched holes. Int. J. Therm. Sci. 2014, 78, 26–35. [Google Scholar] [CrossRef]
- Gong, B.; Wang, L.-B.; Lin, Z.-M. Heat transfer characteristics of a circular tube bank fin heat exchanger with fins punched curve rectangular vortex generators in the wake regions of the tubes. Appl. Therm. Eng. 2015, 75, 224–238. [Google Scholar] [CrossRef]
- Lu, G.; Zhou, G. Numerical simulation on performances of plane and curved winglet type vortex generator pairs with punched holes. Int. J. Heat Mass Transf. 2016, 102, 679–690. [Google Scholar] [CrossRef]
- Oh, Y.; Kim, K. Effects of position and geometry of curved vortex generators on fin-tube heat-exchanger performance characteristics. Appl. Therm. Eng. 2021, 189, 116736. [Google Scholar] [CrossRef]
- Fazeli, I.; Emami, M.R.S.; Rashidi, A. Investigation and optimization of the behavior of heat transfer and flow of MWCNT-CuO hybrid nanofluid in a brazed plate heat exchanger using response surface methodology. Int. Commun. Heat Mass Transf. 2021, 122, 105175. [Google Scholar] [CrossRef]
- Han, H.-Z.; Li, B.-X.; Wu, H.; Shao, W. Multi-objective shape optimization of double pipe heat exchanger with inner corrugated tube using RSM method. Int. J. Therm. Sci. 2015, 90, 173–186. [Google Scholar] [CrossRef]
- Hatami, M.; Jafaryar, M.; Ganji, D.; Gorji-Bandpy, M. Optimization of finned-tube heat exchangers for diesel exhaust waste heat recovery using CFD and CCD techniques. Int. Commun. Heat Mass Transf. 2014, 57, 254–263. [Google Scholar] [CrossRef]
- Zhou, J.; Hatami, M.; Song, D.; Jing, D. Design of microchannel heat sink with wavy channel and its time-efficient optimization with combined RSM and FVM methods. Int. J. Heat Mass Transf. 2016, 103, 715–724. [Google Scholar] [CrossRef]
- Promvonge, P.; Eiamsa-Ard, S.; Wongcharee, K.; Chuwattanakul, V.; Samruaisin, P.; Chokphoemphun, S.; Nanan, K. Characterization of heat transfer and artificial neural networks prediction on overall performance index of a channel installed with arc-shaped baffle turbulators. Case Stud. Therm. Eng. 2021, 26, 101067. [Google Scholar] [CrossRef]
- Wu, X.; Lin, Z.-M.; Liu, S.; Su, M.; Wang, L.-C. Experimental study on the effects of fin pitches and tube diameters on the heat transfer and fluid flow characteristics of a fin punched with curved delta-winglet vortex generators. Appl. Therm. Eng. 2017, 119, 560–572. [Google Scholar] [CrossRef]
- Tian, X.-L.; Jin, H.; Song, K.-W.; Wang, L.-C.; Liu, S.; Wang, L.-B. Effects of fin pitch and tube diameter on the air-side performance of tube bank fin heat exchanger with the fins punched plane and curved rectangular vortex generators. Exp. Heat Transf. 2018, 31, 297–316. [Google Scholar] [CrossRef]
- Box, G.E.P.; Wilson, K.B.; Hunter, J.S. On the Experimental Attainment of Optimum Conditions. J. R. Stat. Soc. Ser. B 1951, 13, 1–45. [Google Scholar] [CrossRef]
- Bovand, M.; Valipour, M.S.; Dincer, K.; Eiamsa-Ard, S. Application of Response Surface Methodology to optimization of a standard Ranque–Hilsch vortex tube refrigerator. Appl. Therm. Eng. 2014, 67, 545–553. [Google Scholar] [CrossRef]
- Hosseinirad, E.; Hormozi, F. Performance intensification of miniature channel using wavy vortex generator and optimization by response surface methodology: MWCNT-H2O and Al2O3-H2O nanofluids as coolant fluids. Chem. Eng. Process. Process Intensif. 2018, 124, 83–96. [Google Scholar] [CrossRef]
- Kanaris, A.; Mouza, A.; Paras, S. Optimal design of a plate heat exchanger with undulated surfaces. Int. J. Therm. Sci. 2009, 48, 1184–1195. [Google Scholar] [CrossRef]
- Khalajzadeh, V.; Heidarinejad, G.; Srebric, J. Parameters optimization of a vertical ground heat exchanger based on response surface methodology. Energy Build. 2011, 43, 1288–1294. [Google Scholar] [CrossRef]
- Chamoli, S. ANN and RSM approach for modeling and optimization of designing parameters for a V down perforated baffle roughened rectangular channel. Alex. Eng. J. 2015, 54, 429–446. [Google Scholar] [CrossRef]
- Lemouedda, A.; Breuer, M.; Franz, E.; Botsch, T.; Delgado, A. Optimization of the angle of attack of delta-winglet vortex generators in a plate-fin-and-tube heat exchanger. Int. J. Heat Mass Transf. 2010, 53, 5386–5399. [Google Scholar] [CrossRef]
- Sun, L.; Zhang, C.-L. Evaluation of elliptical finned-tube heat exchanger performance using CFD and response surface methodology. Int. J. Therm. Sci. 2014, 75, 45–53. [Google Scholar] [CrossRef]
- Gholap, A.; Khan, J. Design and multi-objective optimization of heat exchangers for refrigerators. Appl. Energy 2007, 84, 1226–1239. [Google Scholar] [CrossRef]
- Wu, X.; Liu, D.; Zhao, M.; Lu, Y.; Song, X. The optimization of fin-tube heat exchanger with longitudinal vortex generators using response surface approximation and genetic algorithm. Heat Mass Transf. 2016, 52, 1871–1879. [Google Scholar] [CrossRef]
- Liu, S.; Huang, W.; Bao, Z.; Zeng, T.; Qiao, M.; Meng, J. Analysis, prediction and multi-objective optimization of helically coiled tube-in-tube heat exchanger with double cooling source using RSM. Int. J. Therm. Sci. 2021, 159, 106568. [Google Scholar] [CrossRef]
- Zheng, N.; Liu, P.; Shan, F.; Liu, Z.; Liu, W. Sensitivity analysis and multi-objective optimization of a heat exchanger tube with conical strip vortex generators. Appl. Therm. Eng. 2017, 122, 642–652. [Google Scholar] [CrossRef]
- Salviano, L.O.; Dezan, D.J.; Yanagihara, J.I. Optimization of winglet-type vortex generator positions and angles in plate-fin compact heat exchanger: Response Surface Methodology and Direct Optimization. Int. J. Heat Mass Transf. 2015, 82, 373–387. [Google Scholar] [CrossRef]
- Motahar, S.; Jahangiri, M. Transient heat transfer analysis of a phase change material heat sink using experimental data and artificial neural network. Appl. Therm. Eng. 2020, 167, 114817. [Google Scholar] [CrossRef]
- Qiu, Y.; Garg, D.; Zhou, L.; Kharangate, C.R.; Kim, S.-M.; Mudawar, I. An artificial neural network model to predict mini/micro-channels saturated flow boiling heat transfer coefficient based on universal consolidated data. Int. J. Heat Mass Transf. 2020, 149, 119211. [Google Scholar] [CrossRef]
- Haykin, S. Neural Networks a Comprehensive Foundation, 2nd ed.; Prentice Hall: Upper Saddle River, NJ, USA, 1999. [Google Scholar]
- Eeckman, F. Analysis and Modeling of Neural Systems; Springer Science & Business Media: New York, NY, USA, 2012. [Google Scholar]
- Berber, A.; Gürdal, M.; Bağırsakçı, K. Prediction of heat transfer in a circular tube with aluminum and Cr-Ni alloy pins using artificial neural network. Exp. Heat Transf. 2021, 34, 547–563. [Google Scholar] [CrossRef]
- Kocyigit, N.; Bulgurcu, H. Modeling of overall heat transfer coefficient of a concentric double pipe heat exchanger with limited experimental data by using curve fitting and artificial neural network combination. Therm. Sci. 2018, 23, 3579–3590. [Google Scholar] [CrossRef]
- Khan, M.Z.A.; Aziz, M.; Wijayanta, A.T. Prediction of heat transfer enhancement of delta-wing tape inserts using artificial neural network. Case Stud. Therm. Eng. 2021, 27, 101322. [Google Scholar] [CrossRef]
- Khan, T.A.; Li, W. Optimal configuration of vortex generator for heat transfer enhancement in a plate-fin channel. J. Therm. Sci. Eng. Appl. 2017, 10, 021013. [Google Scholar] [CrossRef]
- Pourpasha, H.; Farshad, P.; Heris, S.Z. Modeling and optimization the effective parameters of nanofluid heat transfer performance using artificial neural network and genetic algorithm method. Energy Rep. 2021, 7, 8447–8464. [Google Scholar] [CrossRef]
- Ke, H.; Khan, T.A.; Li, W.; Lin, Y.; Ke, Z.; Zhu, H.; Zhang, Z. Thermal-hydraulic performance and optimization of attack angle of delta winglets in plain and wavy finned-tube heat exchangers. Appl. Therm. Eng. 2019, 150, 1054–1065. [Google Scholar] [CrossRef]
- Song, K.; Xi, Z.; Su, M.; Wang, L.; Wu, X.; Wang, L. Effect of geometric size of curved delta winglet vortex generators and tube pitch on heat transfer characteristics of fin-tube heat exchanger. Exp. Therm. Fluid Sci. 2017, 82, 8–18. [Google Scholar] [CrossRef]
- Song, K.; Tagawa, T.; Chen, Z.; Zhang, Q. Heat transfer characteristics of concave and convex curved vortex generators in the channel of plate heat exchanger under laminar flow. Int. J. Therm. Sci. 2019, 137, 215–228. [Google Scholar] [CrossRef]
- Sarangi, S.; Mishra, D.; Ramachandran, H.; Anand, N.; Masih, V.; Brar, L. Analysis and optimization of the curved trapezoidal winglet geometry in a compact heat exchanger. Appl. Therm. Eng. 2021, 182, 116088. [Google Scholar] [CrossRef]
- Joardar, A.; Jacobi, A. A Numerical Study of Flow and Heat Transfer Enhancement Using an Array of Delta-Winglet Vortex Generators in a Fin-and-Tube Heat Exchanger. J. Heat Transf. 2007, 129, 1156–1167. [Google Scholar] [CrossRef]
- Webb, R.L.; Kim, N.H. Principles of Enhanced Heat Transfer, 2nd ed.; Taylor and Francis: New York, NY, USA, 2005; p. 315. [Google Scholar]
- Larki, A.J.; Ghafouri, A.; Assareh, E.; Moravej, M. Investigation of the effects of the detachable vortex generators series on phase change material behavior in an energy storage system. J. Build. Eng. 2022, 52, 104384. [Google Scholar] [CrossRef]
- Lu, G.; Zhai, X. Effects of curved vortex generators on the air-side performance of fin-and-tube heat exchangers. Int. J. Therm. Sci. 2019, 136, 509–518. [Google Scholar] [CrossRef]
- Langtry, R.B.; Menter, F.R. Correlation-Based Transition Modeling for Unstructured Parallelized Computational Fluid Dynamics Codes. AIAA J. 2009, 47, 2894–2906. [Google Scholar] [CrossRef]
- Menter, F.R.; Langtry, R.; Völker, S. Transition Modelling for General Purpose CFD Codes. Flow Turbul. Combust. 2006, 77, 277–303. [Google Scholar] [CrossRef]
- Leonard, B.P.; Mokhtari, S. ULTRA-SHARP Nonoscillatory Convection Schemes for High-Speed Steady Multidimensional Flow; NASA Lewis Research Center ICOMP: Cleveland, OH, USA, 1990; Volume 90, pp. 1–54. [Google Scholar]
- Naphon, P.; Wiriyasart, S.; Arisariyawong, T.; Nakharintr, L. ANN, numerical and experimental analysis on the jet impingement nanofluids flow and heat transfer characteristics in the micro-channel heat sink. Int. J. Heat Mass Transf. 2019, 131, 329–340. [Google Scholar] [CrossRef]
- Krzywanski, J. A General Approach in Optimization of Heat Exchangers by Bio-Inspired Artificial Intelligence Methods. Energies 2019, 12, 4441. [Google Scholar] [CrossRef]
- Holland, J.H. Genetic Algorithms, Scientific American. Sci. Am. 1992, 267, 66–73. Available online: http://www.jstor.org/stable/24939139 (accessed on 2 May 2018). [CrossRef]
- Sharma, R.; Mishra, D.P.; Sarangi, S.K.; Brar, L.S. Performance Evaluation of a Fin and Tube Heat Exchanger Based on Different Shapes of the Winglets. J. Therm. Sci. Eng. Appl. 2023, 15, 050905. [Google Scholar] [CrossRef]
- Naik, H.; Tiwari, S. Effect of winglet location on performance of fin-tube heat exchangers with inline tube arrangement. Int. J. Heat Mass Transf. 2018, 125, 248–261. [Google Scholar] [CrossRef]
- Gentry, M.C.; Jacobi, A.M. Heat transfer enhancement by delta-wing-generated tip vortices in flat-plate and developing channel flows. J. Heat Transf. 2002, 124, 1158–1168. [Google Scholar] [CrossRef]
- Sarangi, S.; Mishra, D.; Ramachandran, H.; Anand, N.; Masih, V.; Brar, L. Analysis and optimization of the curved trapezoidal winglet geometry in a high-efficiency compact heat exchanger. Int. J. Therm. Sci. 2021, 164, 106872. [Google Scholar] [CrossRef]
Disclaimer/Publisher’s Note: The statements, opinions and data contained in all publications are solely those of the individual author(s) and contributor(s) and not of MDPI and/or the editor(s). MDPI and/or the editor(s) disclaim responsibility for any injury to people or property resulting from any ideas, methods, instructions or products referred to in the content. |
© 2023 by the authors. Licensee MDPI, Basel, Switzerland. This article is an open access article distributed under the terms and conditions of the Creative Commons Attribution (CC BY) license (https://creativecommons.org/licenses/by/4.0/).