Article

Medium-Term Effects and Economic Analysis of Biochar Application in Three Mediterranean Crops

by
Juan Luis Aguirre
1,2,*,
Sergio González-Egido
1,2,
María González-Lucas
1,2 and
Francisco Miguel González-Pernas
1,2
1
Cátedra de Medio Ambiente, Faculty of Life Sciences, University of Alcala, 28871 Madrid, Spain
2
Environment and Bioproducts Group, Faculty of Life Sciences, University of Alcala, 28871 Madrid, Spain
*
Author to whom correspondence should be addressed.
Energies 2023, 16(10), 4131; https://doi.org/10.3390/en16104131
Submission received: 15 March 2023 / Revised: 18 April 2023 / Accepted: 9 May 2023 / Published: 16 May 2023
(This article belongs to the Topic Challenge and Research Trends in Pyrolysis for Waste Raw Materials)
(This article belongs to the Section D1: Advanced Energy Materials)

Abstract

:
This study assessed the effect of soil amendment with biochar on the production of some Mediterranean crops. Pine-derived biochar (B1) and partially pyrolyzed pine-derived biochar (B2) were used with a dose of 8 L/m2 in a corn crop, reporting a production increase of 38–270% over three years with B1, and no effect of B2 due to its poor quality. Olive stone-derived biochar (B3) was used in lavandin and vineyard crops with doses of 0.04–0.9 L/m2 and 0.37–2.55 L/m2, respectively. An increase of 23–25% in plant volume of lavandin was reported, while the production of grapes per plant was not significantly altered, although it increased by up to 66%. Soil analysis indicated that biochar does not significantly alter soil physicochemical parameters; therefore, biochar may affect plants by altering soil structure and increasing its cation exchange capacity and water management efficiency. Depending on its price, biochar application may be profitable for lavandin and corn crops, with a return-on-investment period ranging from 1 to 4 years. However, the profitability of its use in vineyards is questionable, particularly for the varieties with the lowest market price. Studies examining the economics of biochar application indicate that CO2 abatement certification may help in covering biochar application costs.

1. Introduction

The global increase in population has generated considerable demand for food worldwide, resulting in the overexploitation of natural resources and farmland [1]. However, in recent years, environmental awareness in highly developed countries has increased, leading to an increase in the consumption of responsibly cultivated food from sustainably cultivated and organic crops [2,3,4]. Hence, an increasing number of studies are focusing on improving production in an environmentally friendly manner [4], particularly those examining the use of biochar for improving soil quality and crop yield [5,6,7,8,9,10].
Biochar is a carbonaceous solid material obtained through the thermochemical treatment of biomass, such as pyrolysis and gasification, whose physicochemical characteristics largely depend on the treatment conditions and feedstock used for its production [11,12,13]. Generally, biochar presents an alkaline pH, a pore size highly dependent on processing conditions and biomass type, high carbon content, and good adsorption properties [14]. These properties have led biochar to become a promising material for applications such as carbon fixation [15,16,17,18], the manufacture of carbonaceous nanomaterials [19,20,21,22] and biofilters [23,24], and soil amendment [25,26], among others.
Focusing on agricultural applications, biochar is one of the most researched bioproducts in recent years owing to its properties of improving water and soil quality [27,28,29,30].
Nowadays, it is considered a potential tool for improving agricultural soil fertility and adaptation and climate change mitigation through carbon sequestration [31,32,33,34]. The effects of biochar application observed by other researchers indicate that biochar improves soils by increasing the pH, water and nutrient retention, and cation exchange capacity (CEC) and by enhancing the soil structure and biota [35,36,37], thereby improving plant growth [5,6,7,8]. The effect of biochar application in agricultural environments has been widely studied, reporting particularly good results for horticultural crops [10,38,39,40,41]. Some authors have reported an improvement in corn yields from amending the soil with biochar [42,43,44]. It also has been found that the application in vineyards can lead to an improvement in yield without affecting the quality of grapes [45,46,47]. On the other hand, a few studies have been carried out for lavender, reporting enhancements in different parameters, such as plant height and flower production [48].
The use of biochar as a strategy for climate change mitigation is attributed to its low microbial decomposition rate, which results in a slow transformation of soil organic carbon to carbon dioxide emitted into the atmosphere. Several authors refer to the process of biochar mineralization as biomass recalcitrance [49,50]. Given its ability to act as a climate change mitigator and permanent carbon store, biochar was recognized by the most recent Intergovernmental Panel on Climate Change (IPCC) as a tool for combating climate change through mitigation and adaptation. The IPCC report encouragingly assessed the global potential of biochar application as a method for removing up to 2.6 billion tons of CO2 per year, also showing the potential benefits of soil amendment with biochar in the increase of crop yields, particularly in sandy and acid soils, soil water holding capacity, nitrogen use efficiency, biological nitrogen fixation, and resilience to climate change. In particular, the report highlighted biochar’s ability to adsorb and, hence, immobilize organic contaminants and heavy metals. Therefore, this report is in line with evidence reported over the last few years on the benefits of biochar [51].
The aim of this present study was to assess the effect of biochar on corn cultivation for three consecutive years and the evolution of soil properties during those years. Furthermore, this study assessed the effect of different concentrations of biochar on the growth of lavandin (Lavandula × intermedia), which is a recently introduced crop in Spain with a high growth potential in a Mediterranean climate, and grapevine cultivated in a Cabernet Sauvignon vineyard. Another objective of this study was to verify the feasibility of biochar application in plantations using the farmers’ own machinery to reflect the actual conditions during its application and estimate the profitability of its use under market conditions. According to previous studies, biochar should improve crop yields in a profitable way by enhancing soil structure and physicochemical properties.

2. Materials and Methods

2.1. Biochar

Biochar derived from raw pyrolysis was procured from Neoliquid Advanced Biofuels and Biochemicals S.L. (Guadalajara, Spain). The product was purchased using funds from the LIGNOBIOLIFE project CCM/ES000051, www.lignobiolife.com (accessed on 15 March 2023).
The feedstock for biochar production was pine wood chips (fully pyrolyzed, B1, and partially pyrolyzed, B2) for the application in corn and olive stone (B3) in the case of lavandin and grapevine. Both feedstocks were selected due to the scope of the LIGNOBIOLIFE project, which attempts to use locally sourced biomass residual materials. Biochar was produced in a semi-industrial pyrolysis plant with a capacity of 1 t/day in a continuous reactor using patented technology. Pyrolysis was performed under vacuum conditions (2 mbar) at reactor temperatures of 550–600 °C and residence times of 20 min. These operating parameters were previously optimized by the company for semi-industrial production.
All products resulting from the treatment of these residues have different applications including the following: biochar is used in agricultural experiments [9]; wood vinegar is used in experiments as an herbicide [52]; bio-bitumen is used as a binder in asphalt works; the syngas or pyrolysis gas is recycled in the same reactor to aid the combustion process.
Mass balances (Table 1) were calculated for biochar production through pyrolysis, amounting to approximately 30% of the initial weight.

2.2. Biochar Analysis

The different types of biochar procured from Neoliquid were weighed and analyzed by the company Eurofins Agroambiental, S.L. (Sidamon, Lleida, Spain). For each type of biochar, the following parameters were analyzed: humidity, pH, electrical conductivity at 25 °C, organic matter content, organic carbon content, C/N ratio, total humic extract, humic acid content, and fulvic acid content (fresh), among others (Table 2).
The dry matter, organic matter, and organic carbon values of pine (B1) and olive stone (B3) biochar were very similar. However, these values considerably differed from those of pine biochar (B2), which underwent partial pyrolysis. The pH was slightly alkaline in all cases; however, the pH of olive stone biochar (B3) was more basic than that of the others. The C/N ratio in pine biochar (B1) was higher than that in B2 and B3, which indicates a higher contribution of carbon to the soil. Nevertheless, the value of olive stone biochar (B3) was also considered adequate.

2.3. Field Experiments

All biochar experiments were performed in Mediterranean climate zones in Spain, classified as Csa according to the Köppen Climate classification, and characterized by very hot and dry summers and cold and rainy winters. In addition, in January 2021, an unusual snowfall event affected grapevine plantations in the Iberian Peninsula, and 2022 was an extremely hot year, with precipitation values well below those normally reported in the area.

2.3.1. Biochar Amendment in Corn Crops

Experiments on flint corn (Zea mays var. indurata) were conducted at the Royal Botanic Gardens of the University of Alcala (Universidad de Alcalá—UAH). For this purpose, four terraces (or plots) divided into 40 1 m2 plots and spaced <10 m apart were used to minimize differences between soils and environmental conditions. Before biochar amendment, the soil was slightly alkaline, nutrient-rich, and classified as sandy clay loam soil. There were no remarkable soil differences between the different terraces, and the orientation and irrigation were identical for all of them.
One of the terraces was amended with pine-derived biochar (B1) and other with biochar from incomplete pyrolysis of pine wood chips (B2), while the other two terraces were used as controls (C1 and C2). The amendment with both types of pine-derived biochar was performed to assess the influence of biochar quality on its effect on crops. A dose of biochar of 8 L/m2 was applied in December 2019 and was subsequently mixed with the soil using a rotary tiller.
The experimental results from the first year have previously been published [9]. The results from the second and third years following biochar application were analyzed in this study. No supplementary fertilizer or compost was added throughout the experiment.
In the second year, corn was harvested on 29 September 2021, obtaining 243 cobs. In the third year, harvesting took place on 27 September 2022, collecting 264 cobs. In both years, corn was harvested when the cobs had fully developed, and the leaves had begun to turn yellow. No sampling was performed, as every cob was measured.

2.3.2. Biochar Amendment in Lavandin

Biochar amendment in lavandin (Lavandula × intermedia) was cultivated in a 7-year-old plot owned by Intercova Aromáticas S.L. in Brihuega (Guadalajara, Spain). Biochar was applied in early spring, when the plants had not yet bloomed, and the plants were measured immediately prior to the harvest. In 2021, six concentrations of olive stone biochar (B3) were selected for application, ranging from 0.04 to 0.75 L/m2; in order to assess the effect of low doses, Biochar amendment was performed on 23 March 2021, using a tractor with a broadcast spreader and rotary hoe to incorporate the biochar into the soil after broadcasting. Consecutive rows of plants subjected to biochar application were selected for the analysis. Total volume of 346 lavandin plants was measured on 8 July 2021 in order to assess the effect of biochar. A systematic sampling method was performed to ensure the representativeness of the study sample, measuring a plant every ten meters.
Based on 2021 results, a single biochar dose of 0.9 L/m2 was applied on 6 May 2022. The volume of 168 lavandin plants was measured on 27 July 2022, also carrying out a systematic sampling. Total plant volume was chosen as the assessment parameter as it is directly related to the number of spikes and flowers.

2.3.3. Biochar Amendment in Vineyards

The effect of biochar on grapevine was assessed in a plot located at a Cabernet Sauvignon vineyard (Vitis vinifera) belonging to José Luis Sanchez, Mondejar cooperative (Guadalajara) in 2021. Olive stone biochar was applied on 23 March 2021 using a fertilizer spreader in alternate rows and subsequently incorporated into the soil. The measurements were performed via systematic sampling of the grapevines under each treatment, one every five meters, amounting to a total of 66 grapevines, and via weighing fresh bunches of each grapevine on 28 September 2021.
The biochar doses are expressed as volume per surface unit (L/m2) to facilitate the calculations, as the density to calculate the weight differs enormously even within the same biochar batch.

2.4. Soil Analysis on Corn

A total of eight samples were selected for soil analysis in corn crops, and two samples were obtained from each treatment before and after harvesting for the first and third years (n = 32). The soil sampling procedure was based on the collection of sub-samples from zig-zag spots and their mixture in a composite sample. The evaluation of soil properties was only performed in the case of corn since a series of previous analyses were available.
Soil samples were analyzed at the Control Laboratory (Tentamus Company, Las Rozas, Madrid, Spain) for the following parameters: pH, conductivity at 20 °C, sodium absorption ratio (SAR), anions and cations, saturation moisture, cation exchange capacity (CEC), total N, assimilable K, assimilable P, assimilable organic matter, C/N ratio, and textural analysis (sand, silt, and clay composition).

2.5. Statistical Analysis

The data were statistically analyzed to assess the effectiveness of biochar application on different crops. For this purpose, confidence intervals (p = 0.05) were calculated, and an analysis of variance (ANOVA) was performed to determine significant differences between different treatments. In addition, Fisher’s least significant difference (LSD) analysis was performed to determine significant differences between the means of different groups. The software Statplus version 7.1 (AnalystSoft Inc., Walnut, CA, USA) was used for all statistical analyses.

3. Results

3.1. Fresh Cob Production in 2021 and 2022

The results from the 2021 corn harvest showed a significant difference between the production of the plot with B1 and the other plots and between the plot with C1 and the other plots, according to Fisher’s test (p ≤ 0.01). In 2022, the differences between the plots treated with B1 biochar and the other plots remained significant with respect to both average fresh cob weight and total cob weight by the plot. These results are presented in Table 3.
The improvement in average fresh cob weight in the plots treated with B1 biochar was maintained in each treatment year, with increases of >20% in almost all cases. The total production per treatment in the plots treated with B1 biochar was also higher than that of the other treatments in all years (Table 4).
The improvement in total crop production per treatment in the plots treated with B1 biochar was also maintained each year, and all increases in average fresh cob weight were >35%, with a 200% increase observed in the last year (Table 5).
However, the net production by year showed a significant decrease in fresh cob weights, decreasing from between 150 and 200 g to values lower than 50 g in all treatments. In other words, production significantly decreased in plots with and without biochar amendment. The total harvest also decreased by approximately 90% in all plots, including both the total and average fresh cob weight.
Therefore, despite the general drop in production, the plots treated with B1 biochar maintained an improvement in production (Figure 1).

3.2. Soil Analysis

To assess biochar effects on soil, soil samples from four plots used to cultivate corn were analyzed; of these, two were treated with biochar (pine biochar, B1 and B2), and the other two were used as control (C1 and C2).
Soil samples were collected in year 1, prior to adding biochar to the soil (control), after the first harvest (year 1), and in the third year of planting (year 3). For this purpose, two samples were collected from each plot, and the means were calculated, as outlined in Table S1. Table 6 summarizes the most representative parameters:
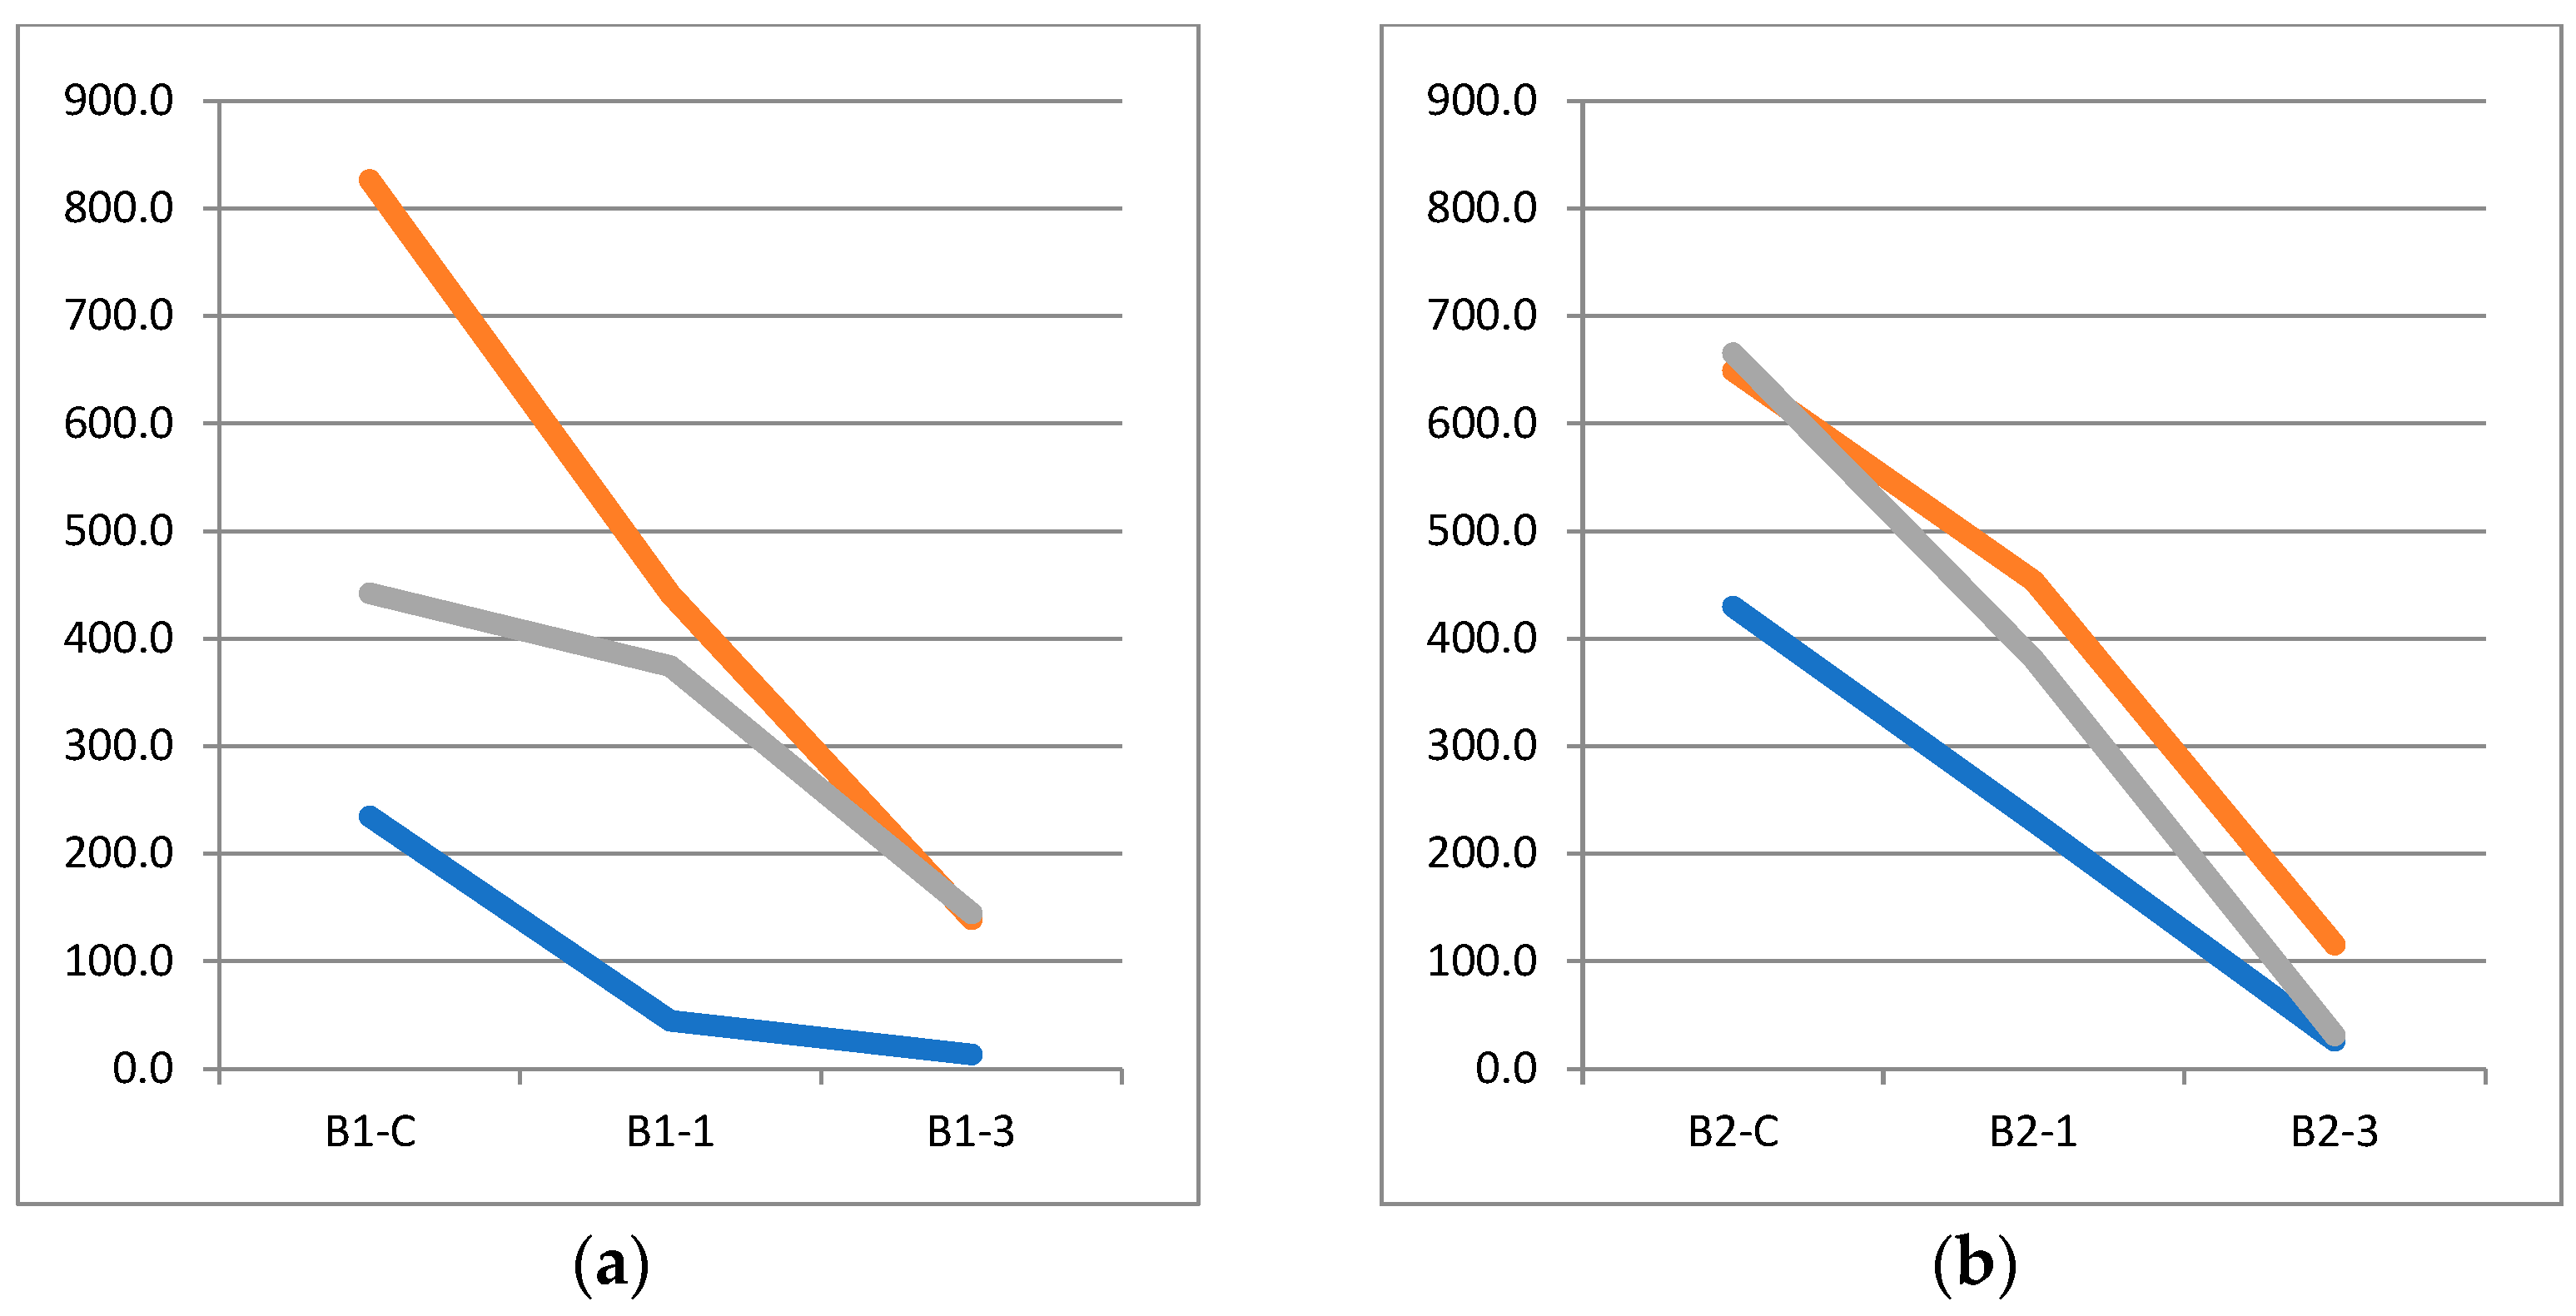
Biochar did not cause significant changes in the soil. Soil analysis did not show any difference in soil parameters that could explain differences in the production of the plots. Nevertheless, the harvest decreased in each successive year, as did some of the parameters outlined in the table above, such as potassium and exchangeable phosphorus, which gradually decreased after each harvest, the NO3/K, Ca/Na, Ca/Mg, and K/Mg ratios, and the concentrations of available metals. These results indicate a depletion of soil resources, which is in line with the decrease in crop yield and growth.
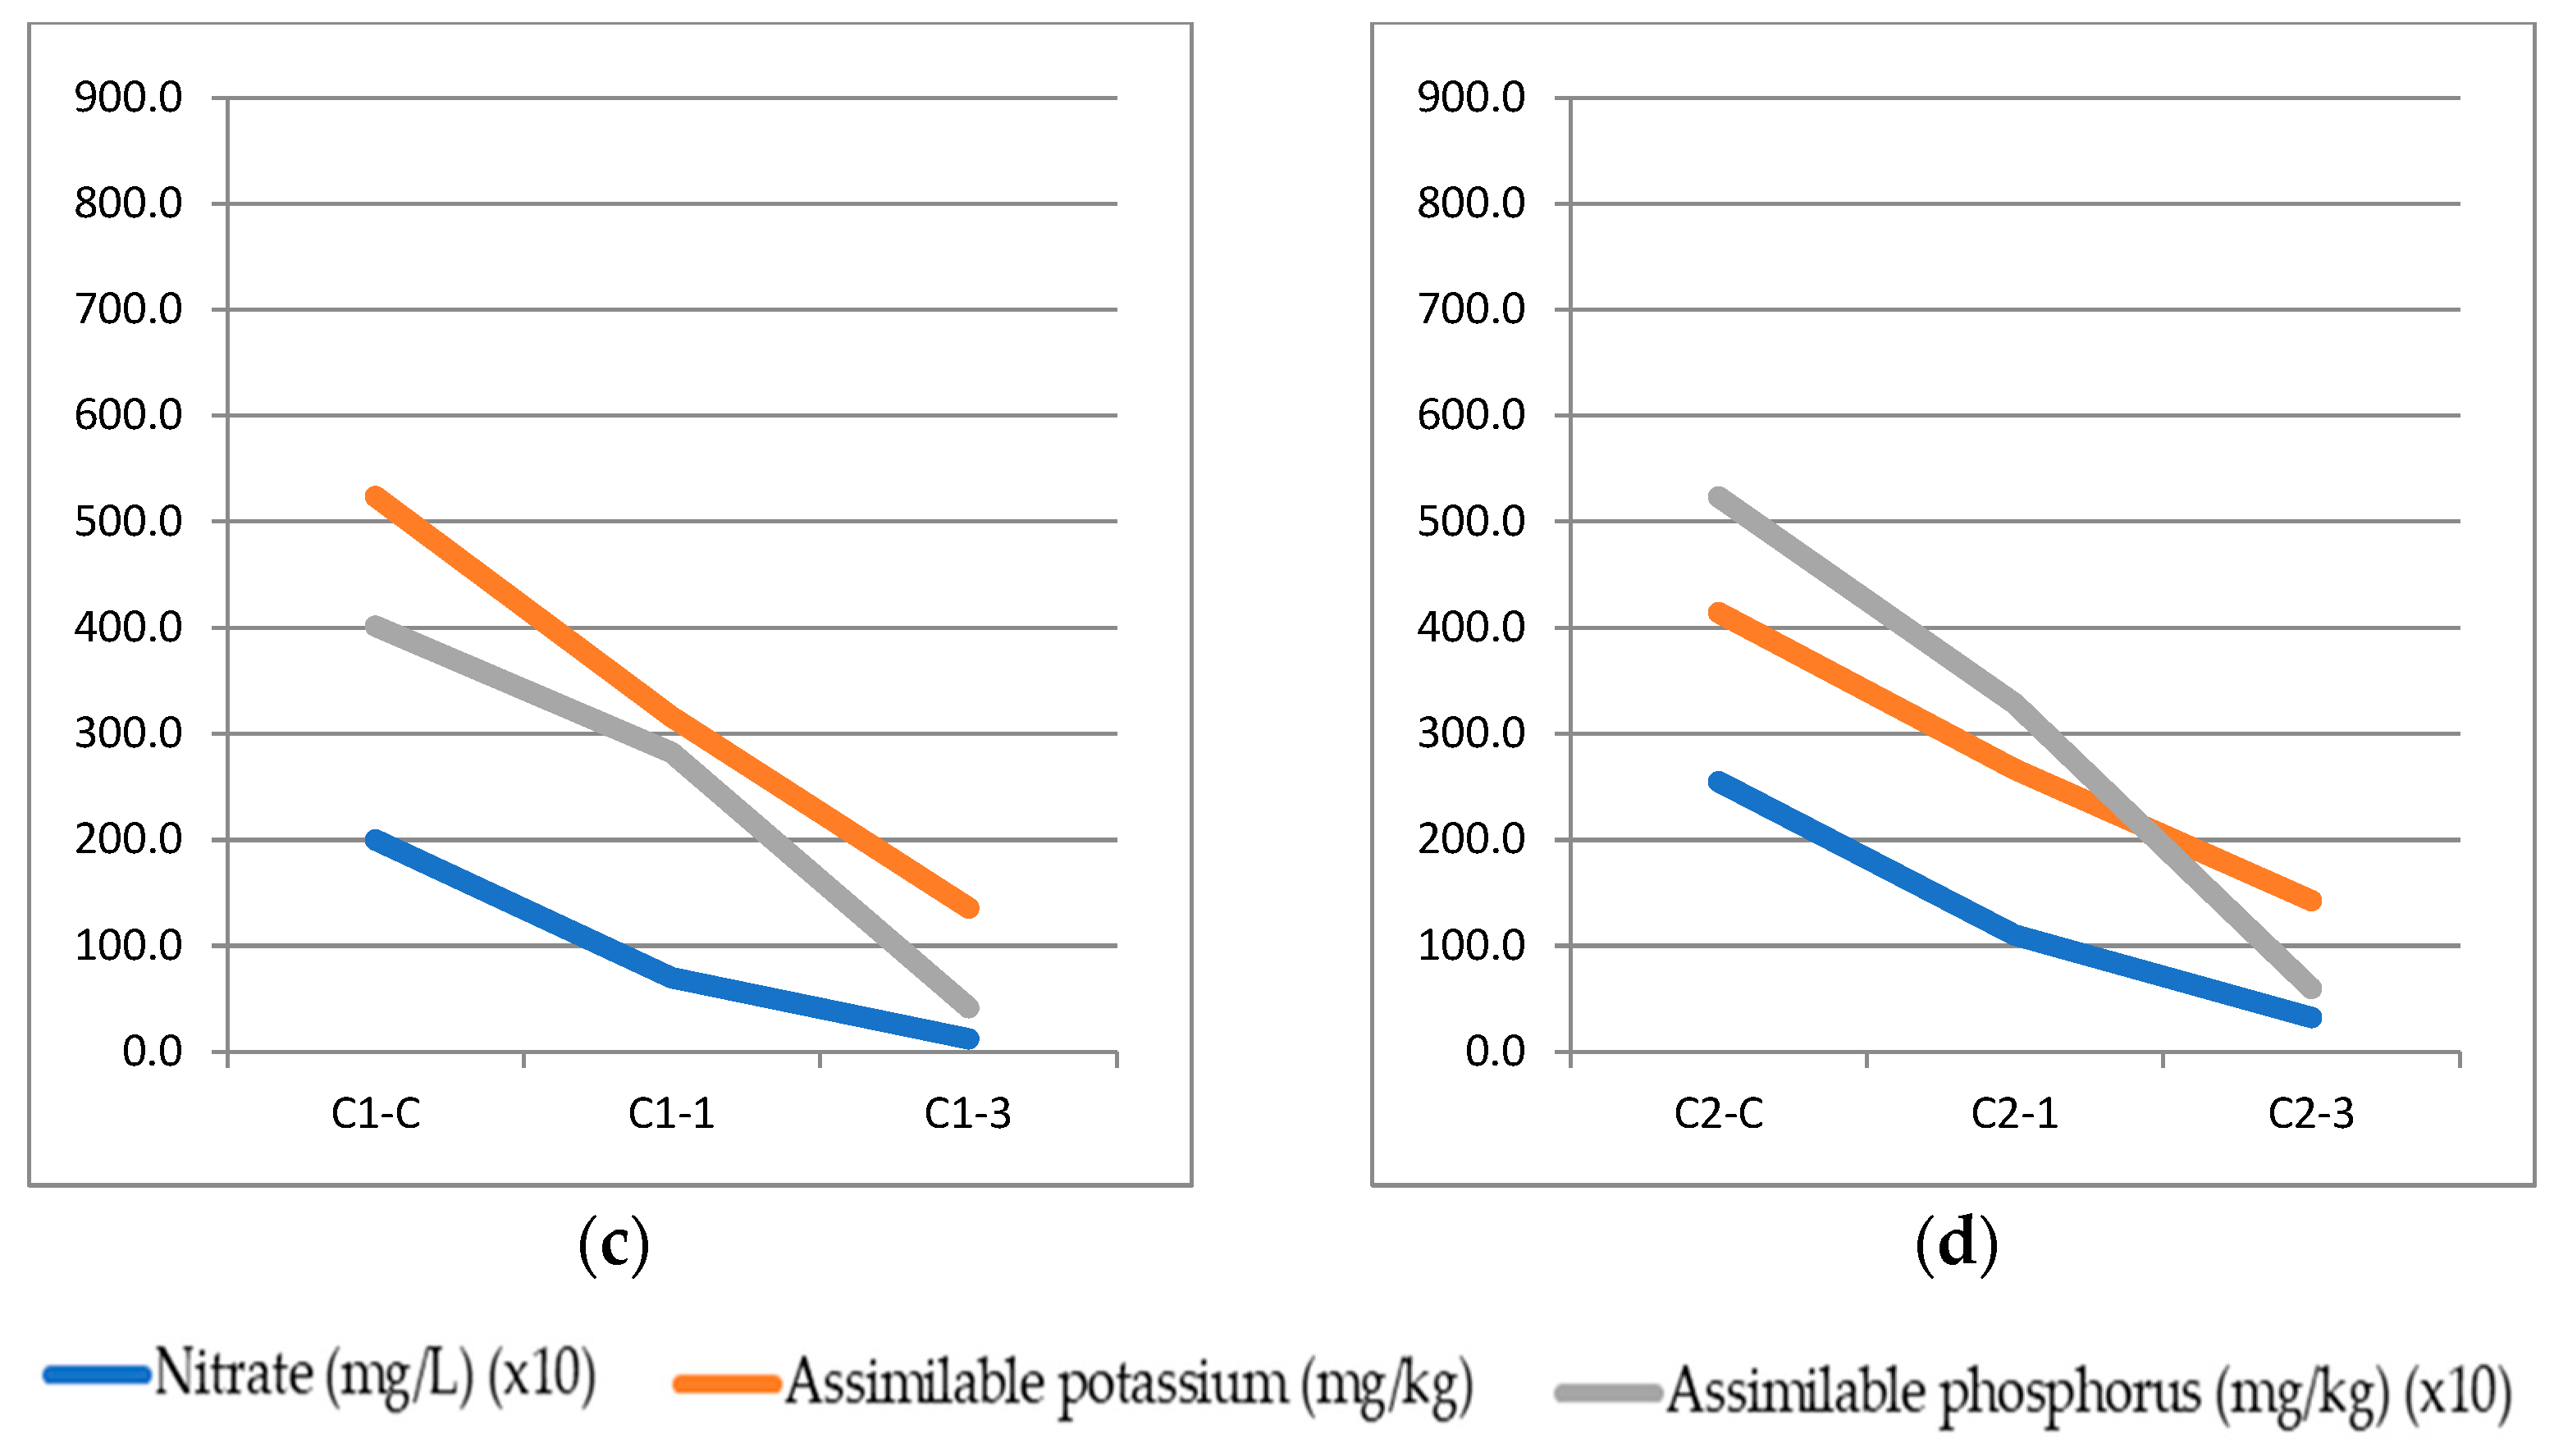
The variations in important parameters for soil “health” as a function of treatment are plotted below. The values of assimilable nitrate and phosphorus shown in Figure 2 were multiplied by 10 to highlight differences because their values were much lower than those of assimilable potassium.
The soil concentration of nutrients clearly decreased over time. In year 3, the values fell below the reference values indicated by the Spanish Ministry of Agriculture (Ministerio de Agricultura, Pesca y Alimentación—MAPA) in its document “Interpretación de análisis de suelos” [Interpretation of soil analysis] (Number 5/93HD of its 1994 factsheets), which indicates a marked soil impoverishment.
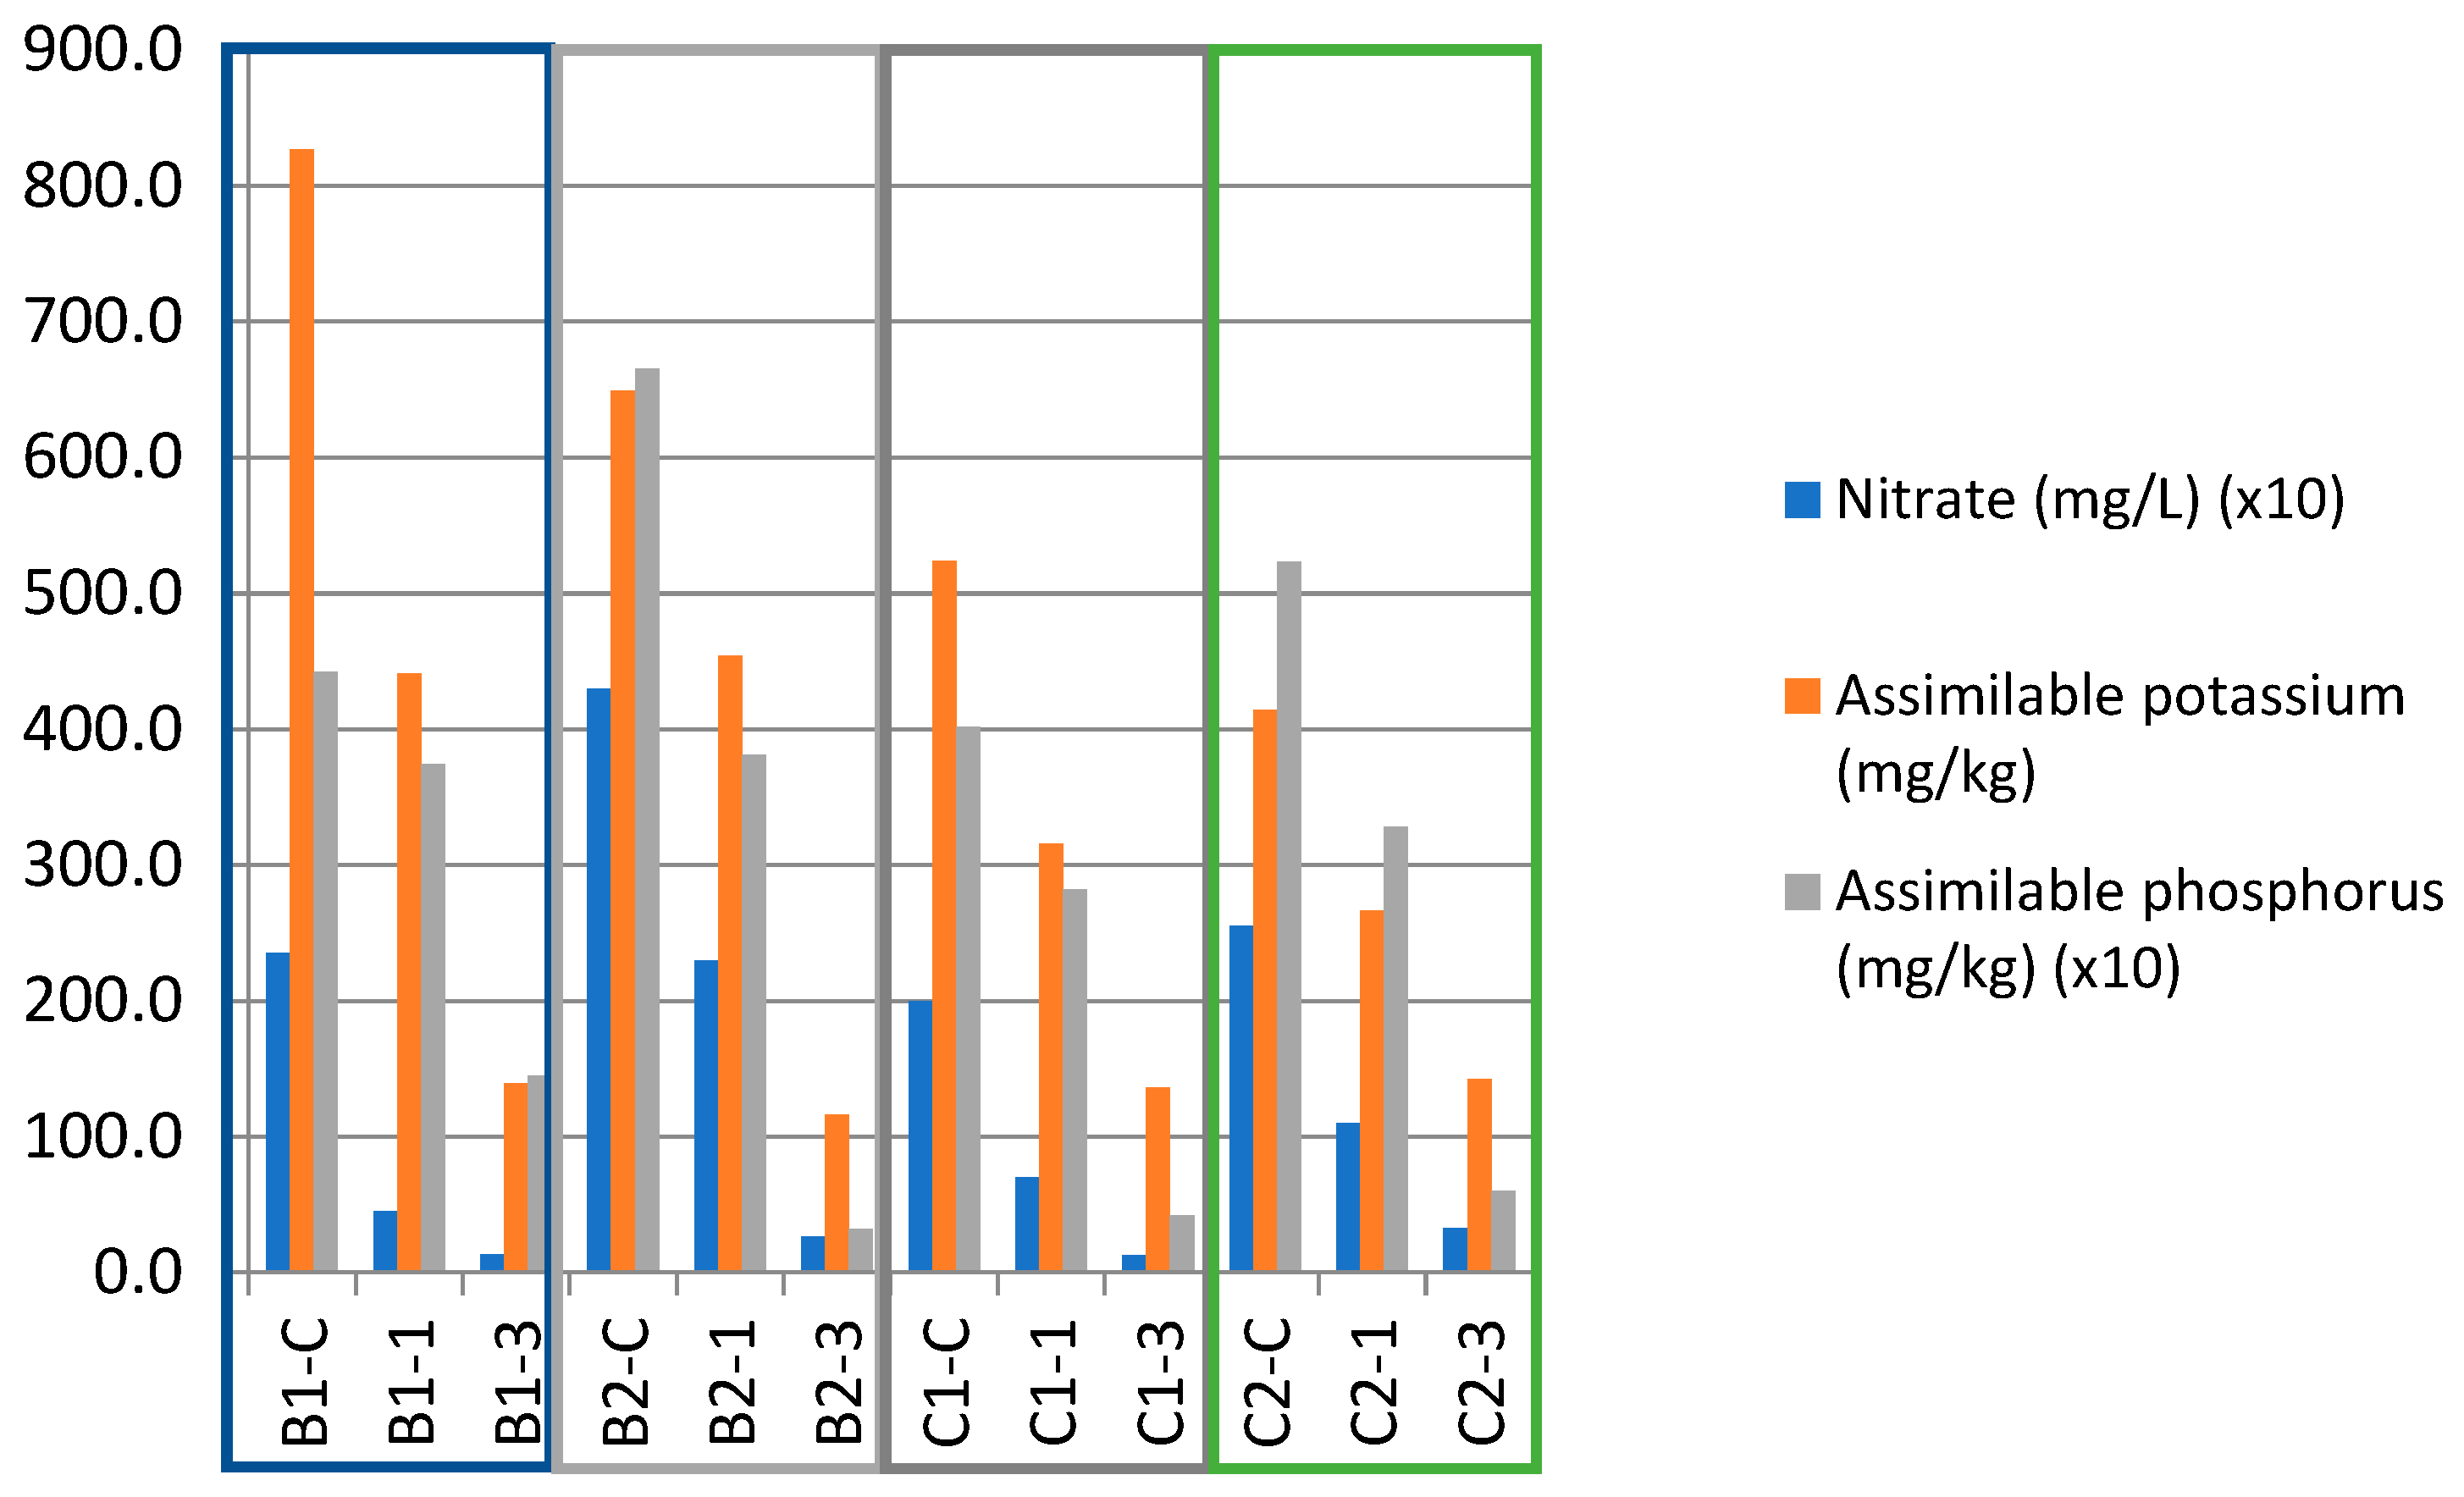
The comparison between soils showed only a noticeable change in potassium and phosphorus levels in plot B1; however, this difference does not account for the considerable difference in production (Figure 3).

3.3. Effect of Biochar Application on Lavandin

As shown in the bar chart plotting the average lavandin volume by treatment in 2021 (Figure 4), the lowest concentration of biochar had no effect on plant growth and volume, and only the highest concentrations significantly affected plant volume; that is, biochar doses below 0.5 L/m2 had no effect on the plants. However, the plants in rows treated with doses of 0.5 and 0.75 L/m2 grew significantly more than the plants treated with other doses and the control plants (p ≤ 0.01).
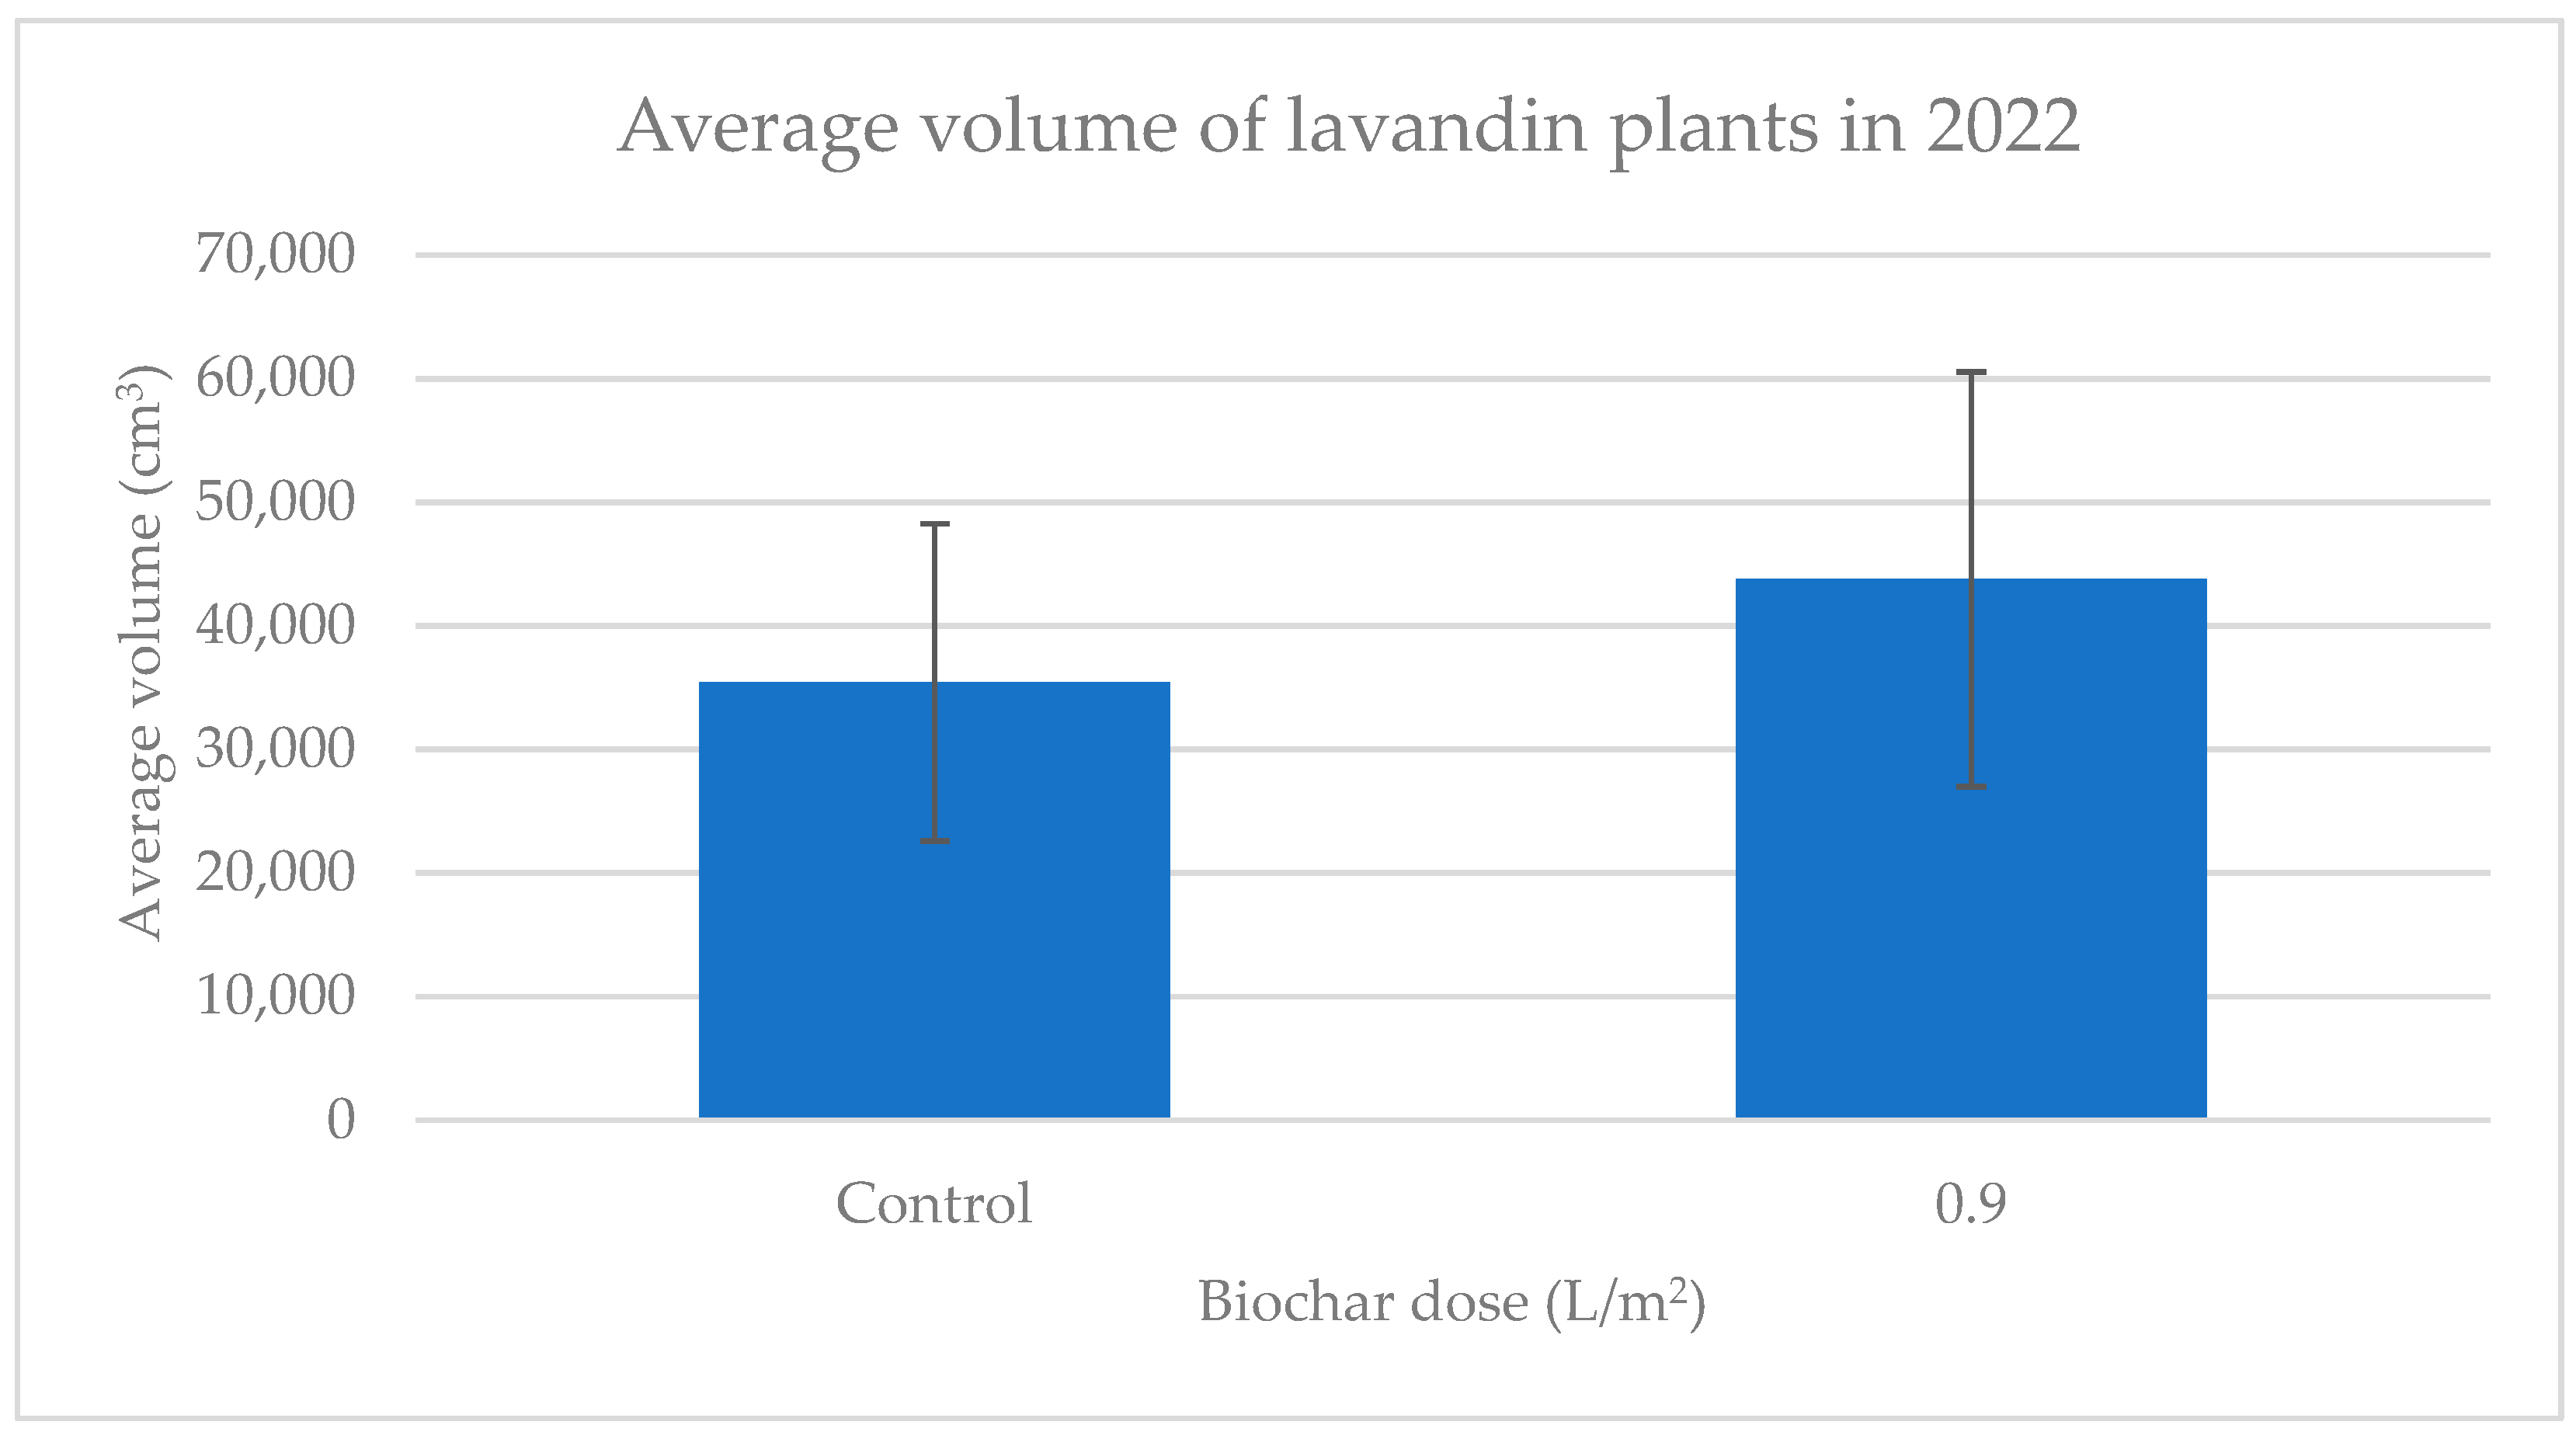
Considering these results, in 2022, only one treatment with a dose of 0.9 L/m2 was applied to three consecutive rows of lavandin adjacent to three other rows without biochar treatment (controls).
The results showed significant differences, with plant volume increasing by 23.5% in only 3 months of growth (ANOVA F:10.87, p ≤ 0.01) (Figure 5).

3.4. Effect of Biochar Application on Grapevine in 2021

In the vineyard, work was performed in two zones. In each zone, five biochar doses were applied in consecutive rows. In the first zone, the doses ranged from 0 to 1.1 L/m2; however, the results showed no significant difference between groups (ANOVA, F: 0.38 p = 0.82) (Figure 6).
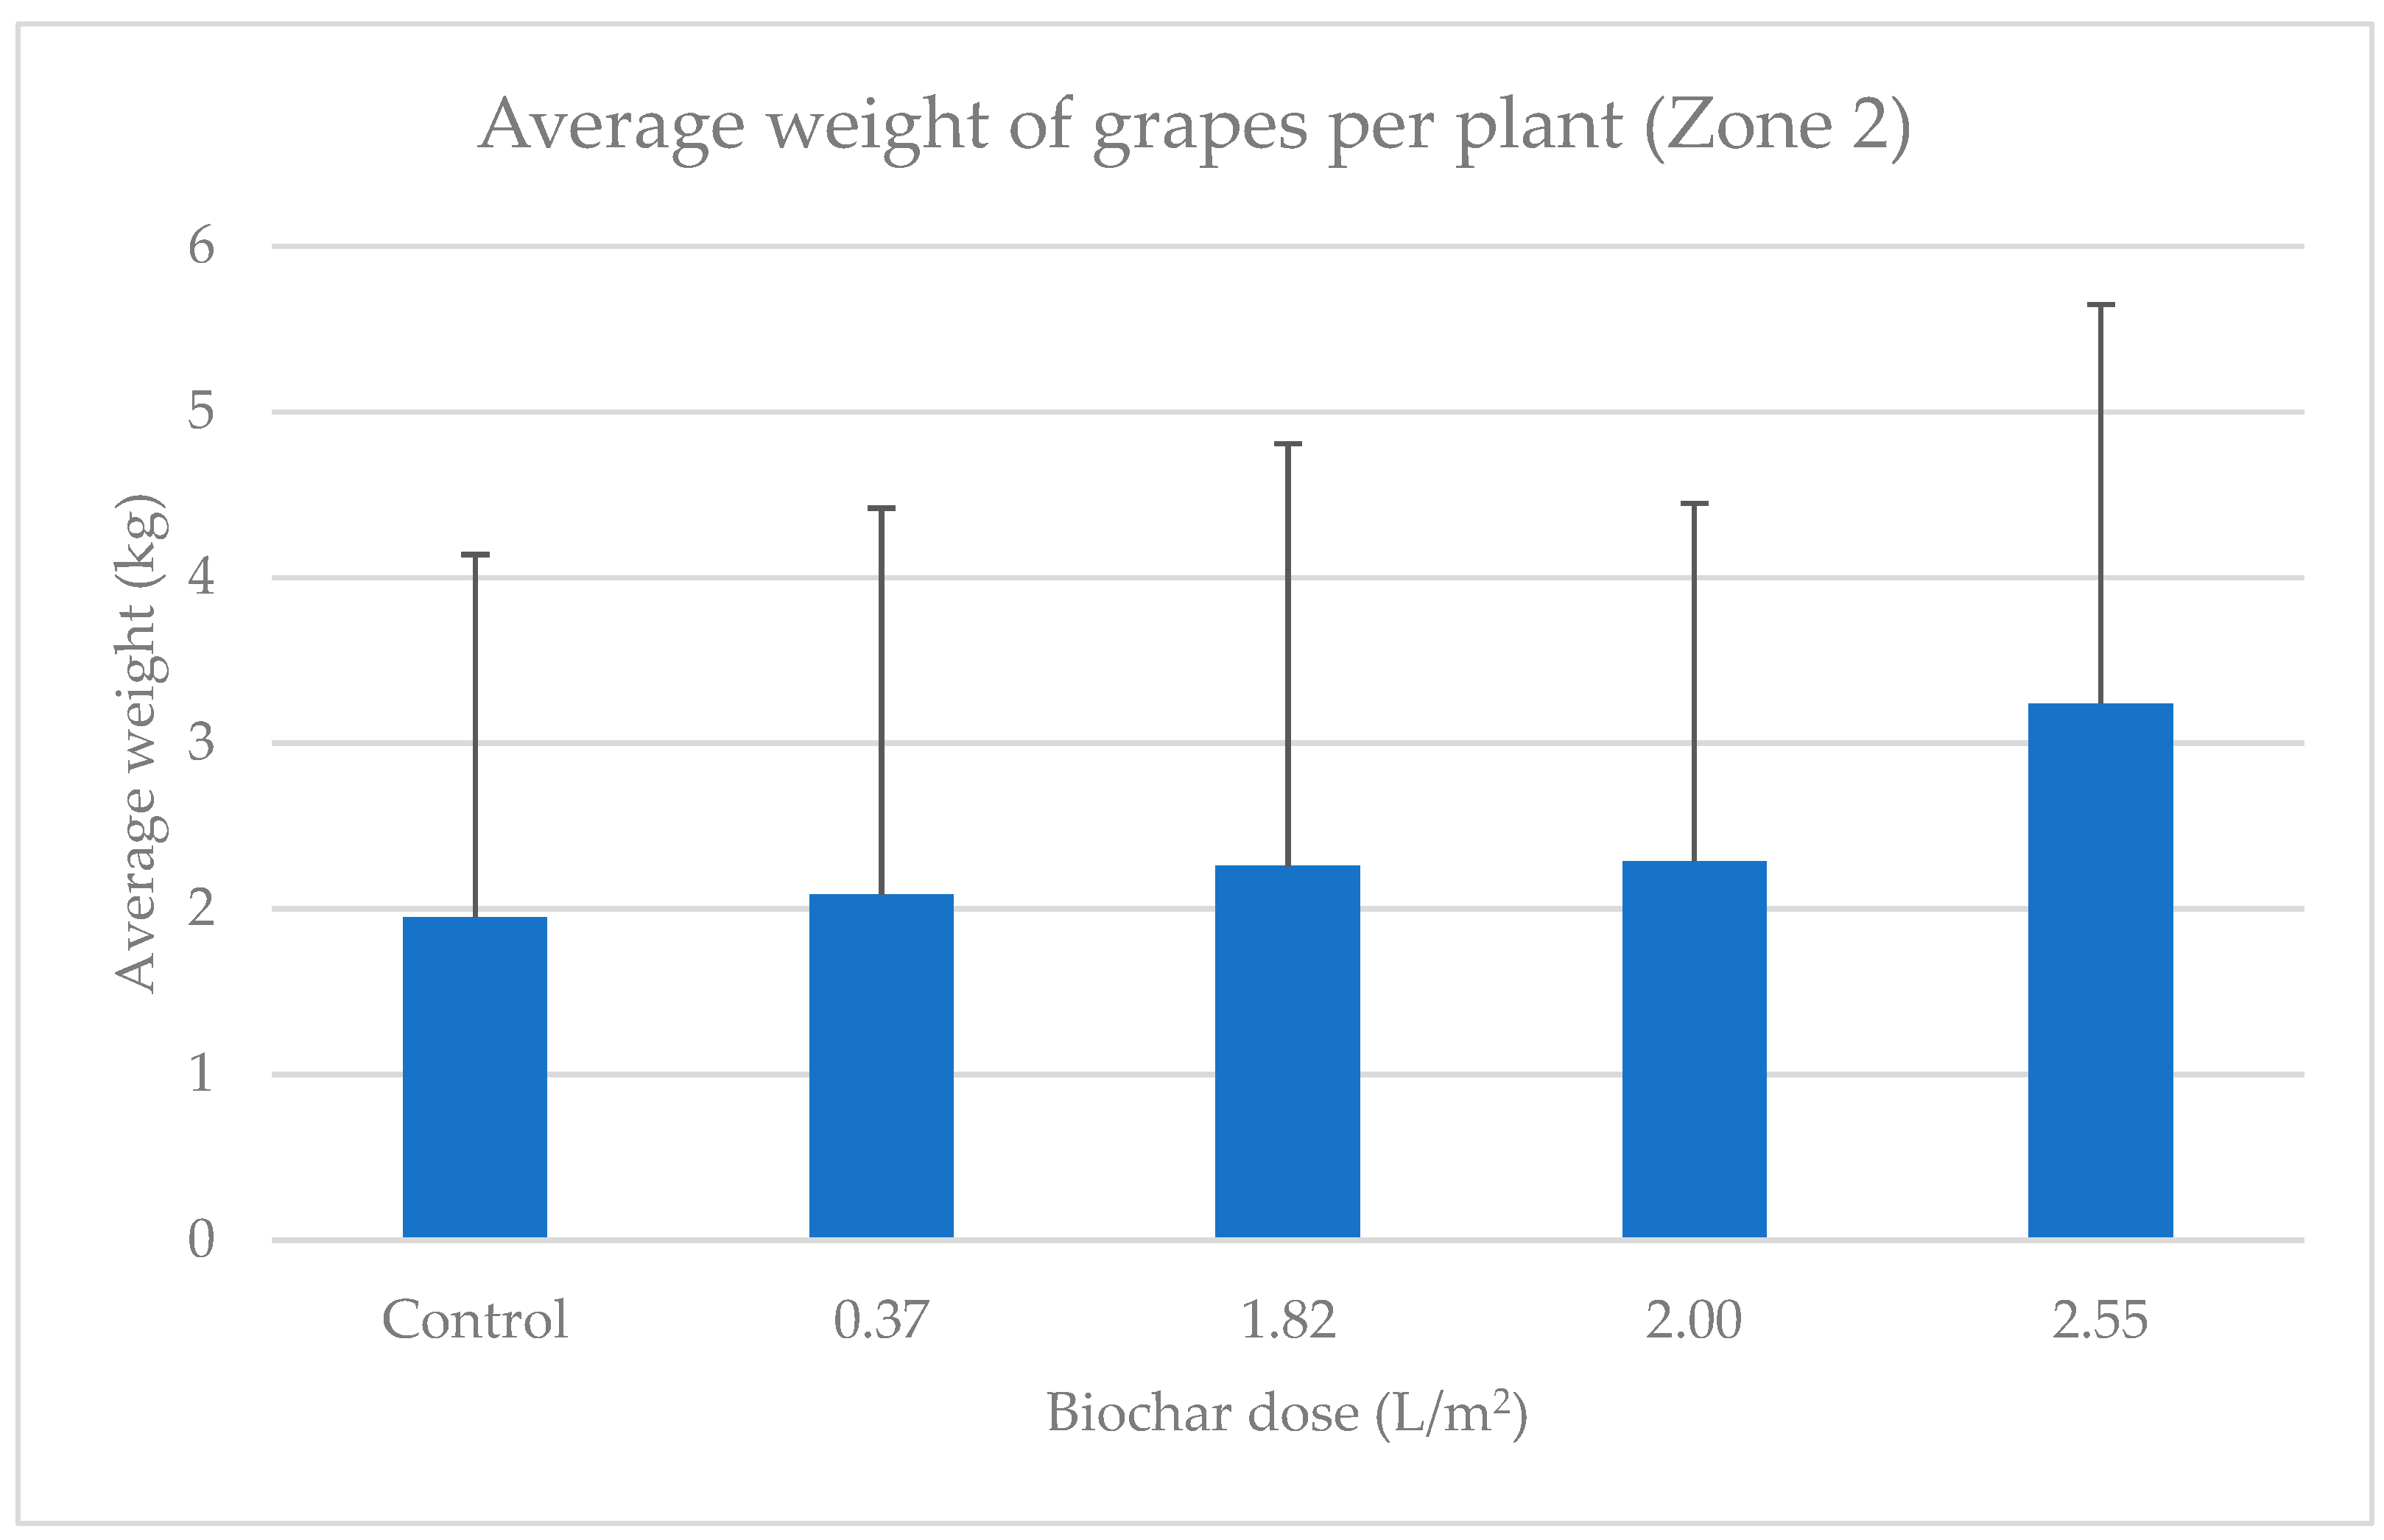
In the second zone, higher biochar concentrations were applied, ranging from 0 to 2.55 L/m2. In this case, production slightly increased with an increase in the dose of biochar applied. More specifically, the dose of 2.55 L/m2 increased production by 66% in relation to the control; however, the differences were not significant (ANOVA; F: 0.67, p = 0.61) (Figure 7).

4. Discussion

Previous studies have demonstrated high-quality biochar’s ability to increase corn production by up to 62.1% in areas with a Mediterranean climate [9]. However, this improvement must be maintained for a minimum of 4 years for biochar application to be economically profitable. This present study evaluated the effects of three consecutive years of planting following soil biochar amendment without the application of new doses of biochar and without the use of fertilizers. The results show that treatment with B1, with 55% organic carbon, significantly improved production over time; however, treatment with B2, with 23% organic carbon, did not improve crop production.
Between 2021 and 2022, plots treated with B1 showed an increase in production from 38% to 270% compared to that of the other treatments. However, 2022 was an exceptionally dry year, especially from May onwards, and even though an automatic irrigation system had been installed in the plots, the plants experienced considerable water stress. In fact, most cobs produced in 2022 had markedly low weights. Overall, in the 3 years of the experiment, the plots treated with B1 produced between 55% and 80% more corn than that produced in the other plots.
Other studies on corn growth and production have provided evidence that the addition of biochar to the soil improves corn productivity for at least 2 years. These studies have not been conducted over longer periods and only provide improvement data in periods of up to 2 years following biochar application, with the production increase ranging from 6–11% [53,54,55], which is in line with the results of this study. Nevertheless, all studies demonstrate that plant growth and production are strongly associated with the raw material used for biochar production, production process characteristics, and dose. Furthermore, most of these studies were conducted under controlled laboratory or greenhouse conditions [56,57].
Differences in the characteristics and methods of transformation of the raw material used to prepare biochar result in a highly variable price range of up to EUR 1000 per ton of biochar [58]. However, some studies indicate average prices between EUR 200 and EUR 600/t, depending on the country and labor costs, among other factors [59]. Based on estimates reported in the literature, biochar prices presumably range from EUR 200 to EUR 500/t in Spain.
According to official data from Spanish governmental sources, the price of corn was approximately EUR 300/t in 2022, reaching a maximum value of EUR 350 [60]. Corn production in the Mediterranean region is approximately 12 t/ha [61]. In other words, as the harvesting costs are similar, a 60% improvement in dry grain production may lead to an increase in production of 8.4 t/ha per year. At a price of EUR 300/t corn, that is, EUR 2550/ha per year, this increased production translates into an improvement of approximately EUR 8000/ha in three years. If these statistics were maintained, the crop yield improvement as a result of biochar treatment would be considerably high. Even when using the highest dose of biochar, 8 L/m2 (40 t/ha), the investment in the purchase of biochar (at EUR 200/t) would be recovered within 3 years. Moreover, all future benefits would already be net profits from exploitation. Purchasing biochar at EUR 500/t would require maintaining production improvements for up to 8 years to ensure its profitability.
Various studies and market trends indicate that biochar may be a good material for reducing CO2 emissions. Accordingly, its use and application may be subsidized. According to Filiberto & Gaunt [62], one ton of biochar can reduce 2.06 t of CO2. Considering that the average price of one ton of CO2 was EUR 80.87 in 2022 [63] and that this study estimated a requirement of 40 t/ha biochar, the corresponding CO2 reduction would total 82.4 t/ha, which entails a subsidy of EUR 6664/ha. This subsidy would be an incentive for the use of this bioproduct, shortening the return-on-investment period. For biochar costing EUR 200/t, the investment would be profitable within the first year; conversely, for biochar costing EUR 500/t, the investment would be profitable only after the 5th year.
These calculations highlight the importance of accurately defining biochar and its characteristics to safely assess its market value. Currently, there is still a lack of homogeneity in biochar characteristics and even in its definition. Nevertheless, major advances have been made over the past 2 years, such as the standardization and certification of biochar with minimum quality characteristics. In the European Union, standardizations have been proposed for producing biochar with specific and regulated characteristics for each type of application. Some European Union countries have established national regulations and regulatory procedures for its use as a soil fertilizer and may request its registration for use in agriculture [64,65,66,67].
In the European Union, measures for biochar standardization have also been implemented, including certifications such as European Biochar Certificate (EBC), Biochar Quality Mandate (BQM), and International Biochar Initiative (IBI-BS). These certifications aim at providing standard values for the safe use of biochar with a certified quality in agriculture, disregarding other biochar applications [64,65,66,67]. The most important parameters included in these certifications are outlined in Table 7.
Determining the manner in which biochar acts on plants using standard soil tests is challenging. The results from the soil analysis after three consecutive cropping years indicate that the effect of biochar is not easily measurable using conventional analytical methods. The depletion of essential soil nutrients was similar across all soils, with decreases in assimilable phosphorus and potassium, as well as nitrates. This suggests that biochar may not affect nutrient incorporation into the soil, and as the plots were subjected to the same climatic and irrigation regimes, production improving water and/or nutrient exchange efficiency may improve production.
A challenge encountered when assessing the effects of biochar on soils is that most experiments are performed under highly controlled conditions. For example, experiments measuring the percentage of a product on soil may be replicated under greenhouse conditions but not under actual conditions of extensive farming. In other words, when working with containers, the percentage of biochar on the substrate can be estimated, whereas this parameter is not measurable under actual growth conditions where biochar is applied as a fertilizer.
Hardeep Singh’s research group reviewed several studies to statistically analyze the effects of biochar on soil physicochemical characteristics, such as pH and electrical conductivity, and soil productivity. In this study, the authors reported that the pH significantly increases when applying biochar doses of 43% or higher, with no significant variations in electrical conductivity. The results of this study corroborate these findings because the applied dose was lower than 43% and resulted in limited variations in pH and conductivity values. Additionally, this review showed that biochar application in agricultural soils at medium to low doses increases production by 30–40%, which is a conservative outcome in relation to the results of this study, where production improved by 17% and 270%, depending on the crop [68].
Many other research groups have assessed biochar’s effects on crop productivity by considering different factors, such as pyrolysis temperature, raw material, and even the type of soil. In all studies, biochar application increases crop productivity, particularly biochar prepared at medium or moderate pyrolysis temperatures, between 400–600 °C [69,70,71,72,73,74].
Biochar introduces carbon into the soil as a substrate because carbon is the main component of biochar. In addition, biochar provides the soil with a high C/N ratio, which improves nitrogen retention in the soil, thereby improving microbiological fixation and increasing soil organic carbon and yield [75,76]. The results of this study show that the increase in the C/N ratio is correlated with the improvement in productivity.
Several studies have shown that biochar improves crop yield by improving the chemical as well as physical properties of the soil, including decreasing bulk density and increasing soil porosity, which improves water and nutrient retention and increases aeration [77,78]. The results obtained for lavandin demonstrated that low biochar doses had no measurable effect on plant growth. Below the application rate of 0.25 L/m2, biochar had no detectable effect on lavandin growth, and even at doses of 0.5 L/m2, the volume of lavandin was only 25% higher in plants treated with biochar than that of control plants. Even though the following year was exceptionally dry in central Spain, plant volume improved by 23%. This result demonstrates that, on the one hand, biochar is efficient a few months after its application and that, on the other hand, biochar application using normal farming mechanisms and machinery is also effective. Moreover, an important attribute that can affect farmers’ preference for biochar is that biochar can be easily applied using common machinery. Normal fertilizer machinery commonly used for other crops may enable effective biochar application to lavandin plantations.
A 25% improvement in lavandin production may improve profits by EUR 400 to EUR 500/ha because the profitability of one hectare of lavandin is approximately 70 kg of essential oil at a price of EUR 24/kg (https://www.agroptima.com/es/blog/cultivar-lavanda-gran-escala/ (accessed on 2 March 2023)). Thus, depending on the cost of biochar and assuming that its activity is sustained over 12 years (the average lifespan of healthy and productive lavandin), the total profits range between EUR 4800 to EUR 6000. Given that this crop requires 2500 kg/ha biochar, if biochar costs EUR 500/t, each farmer will spend EUR 1250/ha; however, if the biochar is applied when the lavandin is planted, the application cost would be almost zero (disregarding renting and tillage costs). Under these conditions, the return-on-investment period will range from 3 to 4 years. Furthermore, since biochar permanently improves the soil, this investment could be affordable for lavandin growers. In turn, assuming that 1 t of biochar reduces 2.06 t of CO2, this abatement could be certified and sold on the emissions market at EUR 80.87/t at average prices for 2022 [63]. Therefore, the cost of biochar application could be reduced by EUR 166.6/t of biochar or EUR 416.5/t/ha.
Research on the use of biochar in lavandin plantations remains incipient, and most studies have been conducted under highly controlled conditions and on a small scale, resulting in very small increases in productivity, with percentages lower than 25% and generating soil deficits when exceeding this percentage, which lower productivity [48,79]. Thus, this is most likely the first study conducted on a lavandin field.
The results obtained for grapevines indicated a certain degree of improvement in grape production at the highest biochar concentrations. In 2021, a highly unusual meteorological event occurred in Spain, wherein the central peninsular area recorded the heaviest snowfall received in the last 50 years. That year, this heavy snowfall significantly affected crops grown throughout the region. The results from the biochar application to grapevines were only visible at 1.82 L/m2 (17.4% improvement) and were more significant at 2.8 L/m2 (66.15% improvement). Grapevine roots are very deep, and grapevines are planted in widely spaced rows. These factors may explain why only such high biochar concentrations yielded significant results.
The profitability of biochar is difficult to estimate in grapevines given the wide variation in the price and other economic aspects of this crop. The average dryland production of vines in Castile-La Mancha (Spain) is approximately 4900 kg/ha, albeit with a high variation between years. The wide variety of prices by wine region and year preclude any reliable economic calculation with these data; however, the cost of incorporating approximately 2 L/m2 biochar in a normal plot is estimated at EUR 5000, considering a biochar price of EUR 500/t. These high costs hardly justify the investment, at least in varieties with low added value, since grapes are usually worth less than EUR 0.5/kg (EUR 2450/ha). Considering a 50% improvement in grape production, the contribution of biochar will generate an average income of EUR 1225/ha. However, this CO2 abatement could be certified and sold on the emissions market, thereby reducing the costs by approximately EUR 833. Nevertheless, in future tests, biochar should be applied to this crop using a different method because the results obtained in this study were insipid.
In some studies, grapevine residues were converted to biochar [80,81]. However, few studies have assessed the effect of biochar application on soils used for cultivating grapevines. Authors who have studied biochar application in vineyards generally agree that the improvement in production is not significant in the short term, but differences are observed in the microbial activity of the soil when combining biochar with compost (biodynamic compost), which controls contaminants and improves soil quality [45,82]. This improvement is generally attributed to the improved water retention capacity of soil treated with biochar, thus improving crop adaptability to the lack of water [47].
In this study, the most important result from the field tests is that usual farming machinery can be used to apply biochar in fields without requiring new investments in implements. However, adaptation is necessary sometimes because farmers are often habituated to the application of chemical fertilizers, which are effective at low concentrations. Biochar must be used in much higher quantities than fertilizers (except for manure); therefore, the most modern machinery does not reach the necessary concentrations in a single pass. For this reason, sometimes, biochar must be applied either at a higher dose, introducing mechanical changes to lower the speed of application and thus release a higher quantity, or in several passes (an unpopular measure owing to its potential in soil compaction) to reach to the minimum effective concentration.

5. Conclusions

The results from the experiments conducted in this study show that biochar amendment may lead to an increase in income due to higher crop productivity at the field scale for different crops, as can be seen in the case of corn, where biochar (B1) led to an improvement in production in the successive years. Additionally, the B1-treated soil showed higher resistance to nutrient deficiency than the other plots.
In lavandin, production significantly improved at moderate biochar doses (from 0.5 L/m2). In contrast, at low doses ranging from 0.04 to 0.25 L/m2, no significant improvement in production was observed. In addition, plant volume increased by 23.5% after 3 months of application of a dose of 0.9 L/m2.
However, in the case of vineyards, biochar amendment with the higher dose (2.55 L/m2) reported a non-significant improvement of 66% in grape production per plant. The high deviation of the results due to adverse weather conditions caused the loss of statistical significance, despite the fact that notable improvements were reported.
Further research on soil amendment with biochar is crucial, as some aspects of actual cultivation conditions have not been considered for these experiments, such as crop rotation or fallow periods for the preservation of soil health or the mixture with other organic fertilizers or phytosanitary products.
In addition, biochar enhances the soil environment, water, and nutrient retention and provides economic benefits as a carbon sink. Promoting biochar certification and tax credits for the fixation of CO2 and other pollutants helps farmers to recover their investment in relatively short periods and enables them to report economic benefits, favoring the bioeconomy. Positioning agriculture as a carbon sink activity opens up access to markets with a higher added value.

Supplementary Materials

The following supporting information can be downloaded at: https://www.mdpi.com/article/10.3390/en16104131/s1, Table S1: Variation in soil composition over time in plots B1, B2, C1, and C2.

Author Contributions

Conceptualization, J.L.A. and M.G.-L.; methodology, J.L.A.; software, J.L.A.; validation, J.L.A., S.G.-E., M.G.-L. and F.M.G.-P.; formal analysis, J.L.A. and M.G.-L.; research, J.L.A. and M.G.-L.; resources, J.L.A.; data preservation, J.L.A.; writing-writing of the original draft, J.L.A. and M.G.-L.; writing-revising and editing, J.L.A., S.G.-E., M.G.-L. and F.M.G.-P.; visualization, J.L.A., S.G.-E., M.G.-L. and F.M.G.-P.; supervision, J.L.A., S.G.-E., M.G.-L. and F.M.G.-P.; project management, J.L.A. and S.G.-E.; securing funding, J.L.A. and S.G.-E. All authors have read and agreed to the published version of the manuscript.

Funding

This research was funded by the project European funds LIGNOBIOLIFE, LIFE 17 CCM/ES/000051 (www.lignobiolife.com).

Data Availability Statement

Data are available by request to the authors.

Acknowledgments

The authors thank Neoliquid Advanced Biofuels and Biochemicals S.L. for providing the wood vinegar used in the herbicide experiments and the Centro de Química Aplicada y Biotecnología de la Universidad de Alcalá (CQAB) for their technical support. We also thank Manuel Peinado, Director, Real Jardín Botánico de Alcalá de Henares, for his assistance during this study.

Conflicts of Interest

The authors declare no conflict of interest.

References

  1. FAOSTAT Food and Agriculture Data. 2019. Available online: https://www.fao.org/3/ca6030en/ca6030en.pdf (accessed on 15 March 2023).
  2. Wanger, T.C.; DeClerck, F.; Garibaldi, L.A.; Ghazoul, J.; Kleijn, D.; Klein, A.-M.; Kremen, C.; Mooney, H.; Perfecto, I.; Powell, L.L. Integrating agroecological production in a robust post-2020 Global Biodiversity Framework. Nat. Ecol. Evol. 2020, 4, 1150–1152. [Google Scholar] [CrossRef] [PubMed]
  3. Pradhan, A.; Chan, C.; Roul, P.K.; Halbrendt, J.; Sipes, B. Potential of conservation agriculture (CA) for climate change adaptation and food security under rainfed uplands of India: A transdisciplinary approach. Agric. Syst. 2018, 163, 27–35. [Google Scholar] [CrossRef]
  4. Horrigan, L.; Lawrence, R.S.; Walker, P. How sustainable agriculture can address the environmental and human health harms of industrial agriculture. Environ. Health Perspect. 2002, 110, 445–456. [Google Scholar] [CrossRef] [PubMed]
  5. Schulz, H.; Dunst, G.; Glaser, B. Positive effects of composted biochar on plant growth and soil fertility. Agron. Sustain. Dev. 2013, 33, 817–827. [Google Scholar] [CrossRef]
  6. Devereux, R.C.; Sturrock, C.J.; Mooney, S.J. The effects of biochar on soil physical properties and winter wheat growth. Earth Environ. Sci. Trans. R. Soc. Edinb. 2012, 103, 13–18. [Google Scholar] [CrossRef]
  7. Schulz, H.; Glaser, B. Effects of biochar compared to organic and inorganic fertilizers on soil quality and plant growth in a greenhouse experiment. J. Plant Nutr. Soil Sci. 2012, 175, 410–422. [Google Scholar] [CrossRef]
  8. Huang, L.; Gu, M. Effects of biochar on container substrate properties and growth of plants—A review. Horticulturae 2019, 5, 14. [Google Scholar] [CrossRef]
  9. Aguirre, J.L.; Martín, M.T.; González, S.; Peinado, M. Effects and economic sustainability of biochar application on corn production in a mediterranean climate. Molecules 2021, 26, 3313. [Google Scholar] [CrossRef]
  10. González-Pernas, F.M.; Grajera-Antolín, C.; García-Cámara, O.; González-Lucas, M.; Martín, M.T.; González-Egido, S.; Aguirre, J.L. Effects of biochar on biointensive horticultural crops and its economic viability in the Mediterranean climate. Energies 2022, 15, 3407. [Google Scholar] [CrossRef]
  11. Brewer, C.E. Biochar Characterization and Engineering; Iowa State University: Ames, IA, USA, 2012; ISBN 126739062X. [Google Scholar] [CrossRef]
  12. Crombie, K.; Mašek, O.; Sohi, S.P.; Brownsort, P.; Cross, A. The effect of pyrolysis conditions on biochar stability as determined by three methods. GCB Bioenergy 2013, 5, 122–131. [Google Scholar] [CrossRef]
  13. Břendová, K.; Tlustoš, P.; Száková, J.; Habart, J. Biochar properties from different materials of plant origin. Eur. Chem. Bull. 2012, 1, 535–539. [Google Scholar]
  14. Li, H.; Dong, X.; da Silva, E.B.; de Oliveira, L.M.; Chen, Y.; Ma, L.Q. Mechanisms of metal sorption by biochars: Biochar characteristics and modifications. Chemosphere 2017, 178, 466–478. [Google Scholar] [CrossRef]
  15. Zhang, C.; Zeng, G.; Huang, D.; Lai, C.; Chen, M.; Cheng, M.; Tang, W.; Tang, L.; Dong, H.; Huang, B. Biochar for environmental management: Mitigating greenhouse gas emissions, contaminant treatment, and potential negative impacts. Chem. Eng. J. 2019, 373, 902–922. [Google Scholar] [CrossRef]
  16. Mukherjee, A.; Lal, R. Biochar impacts on soil physical properties and greenhouse gas emissions. Agronomy 2013, 3, 313–339. [Google Scholar] [CrossRef]
  17. Spokas, K.A.; Reicosky, D.C. Impacts of sixteen different biochars on soil greenhouse gas production. Ann. Environ. Sci. 2009, 3, 179–193. [Google Scholar]
  18. Li, Y.; Hu, S.; Chen, J.; Müller, K.; Li, Y.; Fu, W.; Lin, Z.; Wang, H. Effects of biochar application in forest ecosystems on soil properties and greenhouse gas emissions: A review. J. Soils Sediments 2018, 18, 546–563. [Google Scholar] [CrossRef]
  19. Kumar, M.; Xiong, X.; Wan, Z.; Sun, Y.; Tsang, D.C.W.; Gupta, J.; Gao, B.; Cao, X.; Tang, J.; Ok, Y.S. Ball milling as a mechanochemical technology for fabrication of novel biochar nanomaterials. Bioresour. Technol. 2020, 312, 123613. [Google Scholar] [CrossRef]
  20. Rodriguez-Narvaez, O.M.; Peralta-Hernandez, J.M.; Goonetilleke, A.; Bandala, E.R. Biochar-supported nanomaterials for environmental applications. J. Ind. Eng. Chem. 2019, 78, 21–33. [Google Scholar] [CrossRef]
  21. Li, S.; Huang, D.; Cheng, M.; Wei, Z.; Du, L.; Wang, G.; Chen, S.; Lei, L.; Chen, Y.; Li, R. Application of sludge biochar nanomaterials in Fenton-like processes: Degradation of organic pollutants, sediment remediation, sludge dewatering. Chemosphere 2022, 307, 135873. [Google Scholar] [CrossRef]
  22. Zhou, Y.; Zhang, H.; Cai, L.; Guo, J.; Wang, Y.; Ji, L.; Song, W. Preparation and characterization of macroalgae biochar nanomaterials with highly efficient adsorption and photodegradation ability. Materials 2018, 11, 1709. [Google Scholar] [CrossRef]
  23. Baltrėnas, P.; Baltrėnaitė, E.; Spudulis, E. Biochar from pine and birch morphology and pore structure change by treatment in biofilter. Water Air Soil Pollut. 2015, 226, 69. [Google Scholar] [CrossRef]
  24. Deng, S.; Chen, J.; Chang, J. Application of biochar as an innovative substrate in constructed wetlands/biofilters for wastewater treatment: Performance and ecological benefits. J. Clean. Prod. 2021, 293, 126156. [Google Scholar] [CrossRef]
  25. Zhang, Y.; Wang, J.; Feng, Y. The effects of biochar addition on soil physicochemical properties: A review. Catena 2021, 202, 105284. [Google Scholar] [CrossRef]
  26. Trinh, B.; Werner, D.; Reid, B.J. Application of a full-scale wood gasification biochar as a soil improver to reduce organic pollutant leaching risks. J. Chem. Technol. Biotechnol. 2017, 92, 1928–1937. [Google Scholar] [CrossRef]
  27. Knicker, H. How does fire affect the nature and stability of soil organic nitrogen and carbon? A review. Biogeochemistry 2007, 85, 91–118. [Google Scholar] [CrossRef]
  28. Naeem, I.; Masood, N.; Turan, V.; Iqbal, M. Prospective usage of magnesium potassium phosphate cement combined with Bougainvillea alba derived biochar to reduce Pb bioavailability in soil and its uptake by Spinacia oleracea L. Ecotoxicol. Environ. Saf. 2021, 208, 111723. [Google Scholar] [CrossRef]
  29. Agegnehu, G.; Srivastava, A.K.; Bird, M.I. The role of biochar and biochar-compost in improving soil quality and crop performance: A review. Appl. Soil Ecol. 2017, 119, 156–170. [Google Scholar] [CrossRef]
  30. Li, X.; Wang, C.; Zhang, J.; Liu, J.; Liu, B.; Chen, G. Preparation and application of magnetic biochar in water treatment: A critical review. Sci. Total Environ. 2020, 711, 134847. [Google Scholar] [CrossRef]
  31. Lehmann, J.; Gaunt, J.; Rondon, M. Bio-char sequestration in terrestrial ecosystems—A review. Mitig. Adapt. Strateg. Glob. Chang. 2006, 11, 403–427. [Google Scholar] [CrossRef]
  32. Lehmann, J. Bio-energy in the black. Front. Ecol. Environ. 2007, 5, 381–387. [Google Scholar] [CrossRef]
  33. Laird, D.A. The charcoal vision: A win–win–win scenario for simultaneously producing bioenergy, permanently sequestering carbon, while improving soil and water quality. Agron. J. 2008, 100, 178–181. [Google Scholar] [CrossRef]
  34. Sohi, S.P.; Krull, E.; Lopez-Capel, E.; Bol, R. A review of biochar and its use and function in soil. Adv. Agron. 2010, 105, 47–82. [Google Scholar]
  35. van Zwieten, L.; Kimber, S.; Morris, S.; Chan, K.Y.; Downie, A.; Rust, J.; Joseph, S.; Cowie, A. Effects of biochar from slow pyrolysis of papermill waste on agronomic performance and soil fertility. Plant Soil 2010, 327, 235–246. [Google Scholar] [CrossRef]
  36. Liang, B.; Lehmann, J.; Solomon, D.; Kinyangi, J.; Grossman, J.; O’Neill, B.; Skjemstad, J.O.; Thies, J.; Luizão, F.J.; Petersen, J. Black carbon increases cation exchange capacity in soils. Soil Sci. Soc. Am. J. 2006, 70, 1719–1730. [Google Scholar] [CrossRef]
  37. Jin, H. Characterization of Microbial Life Colonizing Biochar and Biochar-Amended Soils. Ph.D. Thesis, Cornell University, Ithaca, NY, USA, 2010. [Google Scholar]
  38. Riad, G.S.; Youssef, S.M.; El-azm, N.A.I.A.; Ahmed, E.M. Amending Sandy Soil with Biochar or/and Superabsorbent Polymer Mitigates the Adverse Effects of Drought Stress on Green Pea. Egypt. J. Hortic. 2018, 45, 169–183. [Google Scholar] [CrossRef]
  39. Nadeem, S.M.; Imran, M.; Naveed, M.; Khan, M.Y.; Ahmad, M.; Zahir, Z.A.; David, E. Synergistic use of biochar, compost and plant growth promoting rhizobacteria for enhancing cucumber growth under water deficit conditions. J. Sci. Food Agric. 2017, 97, 5139–5145. [Google Scholar] [CrossRef]
  40. Artiola, J.F.; Rasmussen, C.; Freitas, R. Effects of a biochar-amended alkaline soil on the growth of romaine lettuce and bermudagrass. Soil Sci. 2012, 177, 561–570. [Google Scholar] [CrossRef]
  41. Reza, A.; Langeroodi, S.; Campiglia, E.; Mancinelli, R.; Radicetti, E. Scientia Horticulturae Can biochar improve pumpkin productivity and its physiological characteristics under reduced irrigation regimes? Sci. Hortic. 2019, 247, 195–204. [Google Scholar] [CrossRef]
  42. Liu, X.; Wang, H.; Liu, C.; Sun, B.; Zheng, J.; Bian, R.; Drosos, M.; Zhang, X.; Li, L.; Pan, G. Biochar increases maize yield by promoting root growth in the rainfed region. Arch. Agron. Soil Sci. 2020, 67, 1411–1424. [Google Scholar] [CrossRef]
  43. Khan, I.; Iqbal, B.; Khan, A.A.; Inamullah; Rehman, A.; Fayyaz, A.; Shakoor, A.; Farooq, T.H.; Wang, L.-X. The Interactive Impact of Straw Mulch and Biochar Application Positively Enhanced the Growth Indexes of Maize (Zea mays L.) Crop. Agronomy 2022, 12, 2584. [Google Scholar] [CrossRef]
  44. Uzoma, K.C.; Inoue, M.; Andry, H.; Fujimaki, H.; Zahoor, A.; Nishihara, E. Effect of cow manure biochar on maize productivity under sandy soil condition. Soil Use Manag. 2011, 27, 205–212. [Google Scholar] [CrossRef]
  45. Schmidt, H.-P.; Kammann, C.; Niggli, C.; Evangelou, M.W.H.; Mackie, K.A.; Abiven, S. Biochar and biochar-compost as soil amendments to a vineyard soil: Influences on plant growth, nutrient uptake, plant health and grape quality. Agric. Ecosyst. Environ. 2014, 191, 117–123. [Google Scholar] [CrossRef]
  46. Ubalde, J.M.; Payan, E.; Sort, X.; Rosas, J.G.; Gómez, N. Application of biochar amendments to Mediterranean soils: Effects on vine growth and grape quality. Geophys. Res. Abstr. 2014, 16, 440000. [Google Scholar]
  47. Genesio, L.; Miglietta, F.; Baronti, S.; Vaccari, F.P. Biochar increases vineyard productivity without affecting grape quality: Results from a four years field experiment in Tuscany. Agric. Ecosyst. Environ. 2015, 201, 20–25. [Google Scholar] [CrossRef]
  48. Fascella, G.; Mammano, M.M.; D’Angiolillo, F.; Pannico, A.; Rouphael, Y. Coniferous wood biochar as substrate component of two containerized Lavender species: Effects on morpho-physiological traits and nutrients partitioning. Sci. Hortic. 2020, 267, 109356. [Google Scholar] [CrossRef]
  49. Lehmann, J. A handful of carbon. Nature 2007, 447, 143–144. [Google Scholar] [CrossRef]
  50. Woolf, D.; Amonette, J.E.; Street-Perrott, F.A.; Lehmann, J.; Joseph, S. Sustainable biochar to mitigate global climate change. Nat. Commun. 2010, 1, 56. [Google Scholar] [CrossRef]
  51. Llanes, J. IPCC–INFORME DEL PANEL INTERGUBERNAMENTAL SOBRE CAMBIO CLIMÁTICO|Cambio Climático 2022: Mitigación del cambio climático. Rev. Int. Comun. Desarro 2022, 4, 4. [Google Scholar]
  52. Aguirre, J.L.; Baena, J.; Martín, M.T.; Nozal, L.; González, S.; Manjón, J.L.; Peinado, M. Composition, ageing and herbicidal properties of wood vinegar obtained through fast biomass pyrolysis. Energies 2020, 13, 2418. [Google Scholar] [CrossRef]
  53. Feng, W.; Yang, F.; Cen, R.; Liu, J.; Qu, Z.; Miao, Q.; Chen, H. Effects of straw biochar application on soil temperature, available nitrogen and growth of corn. J. Environ. Manag. 2021, 277, 111331. [Google Scholar] [CrossRef]
  54. Iglesias Abad, S.; Alegre Orihuela, J.; Salas Macias, C.; Egüez Moreno, J. Corn yield (Zea mays L.) improves with the use of Eucalyptus biochar. Sci. Agropecu 2018, 9, 25–32. [Google Scholar] [CrossRef]
  55. Sánchez, A.M.; Orozco, L.E.M.; Villegas, R.G.; Duque, A.S.; Oregel, V.N. Efecto del Biocarbón en la Producción de un Maíz Comercial Bajo Riego en Michoacán. Available online: https://www.researchgate.net/profile/Alexander-Sanchez-Duque/publication/352006775_Efecto_del_biocarbon_en_la_produccion_de_un_maiz_comercial_bajo_riego_en_Michoacan/links/60b55206a6fdcc476bda78b1/Efecto-del-biocarbon-en-la-produccion-de-un-maiz-comercial-bajo-riego-en-Michoacan.pdf (accessed on 15 March 2023).
  56. Rajkovich, S.; Enders, A.; Hanley, K.; Hyland, C.; Zimmerman, A.R.; Lehmann, J. Corn growth and nitrogen nutrition after additions of biochars with varying properties to a temperate soil. Biol. Fertil. Soils 2012, 48, 271–284. [Google Scholar] [CrossRef]
  57. Brantley, K.E.; Savin, M.C.; Brye, K.R.; Longer, D.E. Nutrient availability and corn growth in a poultry litter biochar-amended loam soil in a greenhouse experiment. Soil Use Manag. 2016, 32, 279–288. [Google Scholar] [CrossRef]
  58. Zilberman, D.; Laird, D.; Rainey, C.; Song, J.; Kahn, G. Biochar supply-chain and challenges to commercialization. GCB Bioenergy 2023, 15, 7–23. [Google Scholar] [CrossRef]
  59. Maroušek, J.; Trakal, L. Techno-economic analysis reveals the untapped potential of wood biochar. Chemosphere 2022, 291, 133000. [Google Scholar] [CrossRef]
  60. Pesca y Alimentación. (España) Ministerio de Agricultura. Precios Medios Nacionales. 2022. Available online: https://www.mapa.gob.es/es/estadistica/temas/estadisticas-agrarias/economia/precios-medios-nacionales/ (accessed on 16 March 2023).
  61. Servicio Agronómico Pioneer de Castilla y León. Por qué hoy sigue siendo rentable sembrar maíz en Castilla y León? 2017. Available online: https://www.campocyl.es/portada/por-que-hoy-sigue-siendo-rentable-sembrar-maiz-en-castilla-y-leon/ (accessed on 16 March 2023).
  62. Filiberto, D.; Gaunt, J. Practicality of Biochar Additions to Enhance Soil and Crop Productivity. Agriculture 2013, 3, 715–725. [Google Scholar] [CrossRef]
  63. Sendeco2 Precios CO2. 2023. Available online: https://www.sendeco2.com/es/precios-co2 (accessed on 16 March 2023).
  64. Meyer, S.; Genesio, L.; Vogel, I.; Schmidt, H.-P.; Soja, G.; Someus, E.; Shackley, S.; Verheijen, F.G.A.; Glaser, B. Biochar standardization and legislation harmonization. J. Environ. Eng. Landsc. Manag. 2017, 25, 175–191. [Google Scholar] [CrossRef]
  65. Gollenbeek, L.; Ehlert, P.; Buisonjeé, F. Perspectives of Ecochar in Europe: Uses and Regulatory Requirements; Wageningen Livestock Research: Wageningen, The Netherlands, 2018. [Google Scholar] [CrossRef]
  66. Garcia, B.; Alves, O.; Rijo, B.; Lourinho, G.; Nobre, C. Biochar: Production, applications, and market prospects in Portugal. Environments 2022, 9, 95. [Google Scholar] [CrossRef]
  67. Rashidi, N.A.; Yusup, S. A mini review of biochar synthesis, characterization, and related standardization and legislation. Appl. Biochar Environ. Saf. 2020, 16, 11–26. [Google Scholar] [CrossRef]
  68. Singh, H.; Northup, B.K.; Rice, C.W.; Prasad, P.V.V. Biochar applications influence soil physical and chemical properties, microbial diversity, and crop productivity: A meta-analysis. Biochar 2022, 4, 8. [Google Scholar] [CrossRef]
  69. Li, S.; Harris, S.; Anandhi, A.; Chen, G. Predicting biochar properties and functions based on feedstock and pyrolysis temperature: A review and data syntheses. J. Clean. Prod. 2019, 215, 890–902. [Google Scholar] [CrossRef]
  70. Joseph, S.; Pow, D.; Dawson, K.; Rust, J.; Munroe, P.; Taherymoosavi, S.; Mitchell, D.R.G.; Robb, S.; Solaiman, Z.M. Biochar increases soil organic carbon, avocado yields and economic return over 4 years of cultivation. Sci. Total Environ. 2020, 724, 138153. [Google Scholar] [CrossRef] [PubMed]
  71. Keey Liew, R.; Loke Show, P.; Su, M.H.; Azwar, E.; Yang, Y.; Sonne, C.; Yek, P.N.Y.; Liew, R.K.; Cheng, C.K.; Show, P.L. Simultaneous removal of toxic ammonia and lettuce cultivation in aquaponic system using microwave pyrolysis biochar. J. Hazard. Mater. 2020, 396, 122610. [Google Scholar]
  72. Biederman, L.A.; Harpole, W.S. Biochar and its effects on plant productivity and nutrient cycling: A meta-analysis. GCB Bioenergy 2013, 5, 202–214. [Google Scholar] [CrossRef]
  73. Ronsse, F.; Van Hecke, S.; Dickinson, D.; Prins, W. Production and characterization of slow pyrolysis biochar: Influence of feedstock type and pyrolysis conditions. GCB Bioenergy 2013, 5, 104–115. [Google Scholar] [CrossRef]
  74. Liu, X.; Zhang, A.; Ji, C.; Joseph, S.; Bian, R.; Li, L.; Pan, G.; Paz-Ferreiro, J. Biochar’s effect on crop productivity and the dependence on experimental conditions—A meta-analysis of literature data. Plant Soil 2013, 373, 583–594. [Google Scholar] [CrossRef]
  75. Kirkby, C.A.; Richardson, A.E.; Wade, L.J.; Passioura, J.B.; Batten, G.D.; Blanchard, C.; Kirkegaard, J.A. Nutrient availability limits carbon sequestration in arable soils. Soil Biol. Biochem. 2014, 68, 402–409. [Google Scholar] [CrossRef]
  76. Cleveland, C.C.; Liptzin, D. C: N: P stoichiometry in soil: Is there a “Redfield ratio” for the microbial biomass? Biogeochemistry 2007, 85, 235–252. [Google Scholar] [CrossRef]
  77. Page, K.L.; Dang, Y.P.; Dalal, R.C. The ability of conservation agriculture to conserve soil organic carbon and the subsequent impact on soil physical, chemical, and biological properties and yield. Front. Sustain. Food Syst. 2020, 4, 31. [Google Scholar] [CrossRef]
  78. Ontl, T.A.; Schulte, L.A. Soil carbon storage. Nat. Educ. Knowl. 2012, 3, 35. [Google Scholar]
  79. Fascella, G.; D’Angiolillo, F.; Ruberto, G.; Napoli, E. Agronomic performance, essential oils and hydrodistillation wastewaters of Lavandula angustifolia grown on biochar-based substrates. Ind. Crops Prod. 2020, 154, 112733. [Google Scholar] [CrossRef]
  80. Egri, D.; Pârvulescu, O.C.; Ion, V.A.; Răducanu, C.E.; Calcan, S.I.; Bădulescu, L.; Madjar, R.; Orbeci, C.; Dobre, T.; Moț, A. Vine Pruning-Derived Biochar for Agronomic Benefits. Agronomy 2022, 12, 2730. [Google Scholar] [CrossRef]
  81. Rivelli, A.R.; Libutti, A. Effect of biochar and inorganic or organic fertilizer co-application on soil properties, plant growth and nutrient content in Swiss chard. Agronomy 2022, 12, 2089. [Google Scholar] [CrossRef]
  82. Mackie, K.A.; Marhan, S.; Ditterich, F.; Schmidt, H.P.; Kandeler, E. The effects of biochar and compost amendments on copper immobilization and soil microorganisms in a temperate vineyard. Agric. Ecosyst. Environ. 2015, 201, 58–69. [Google Scholar] [CrossRef]
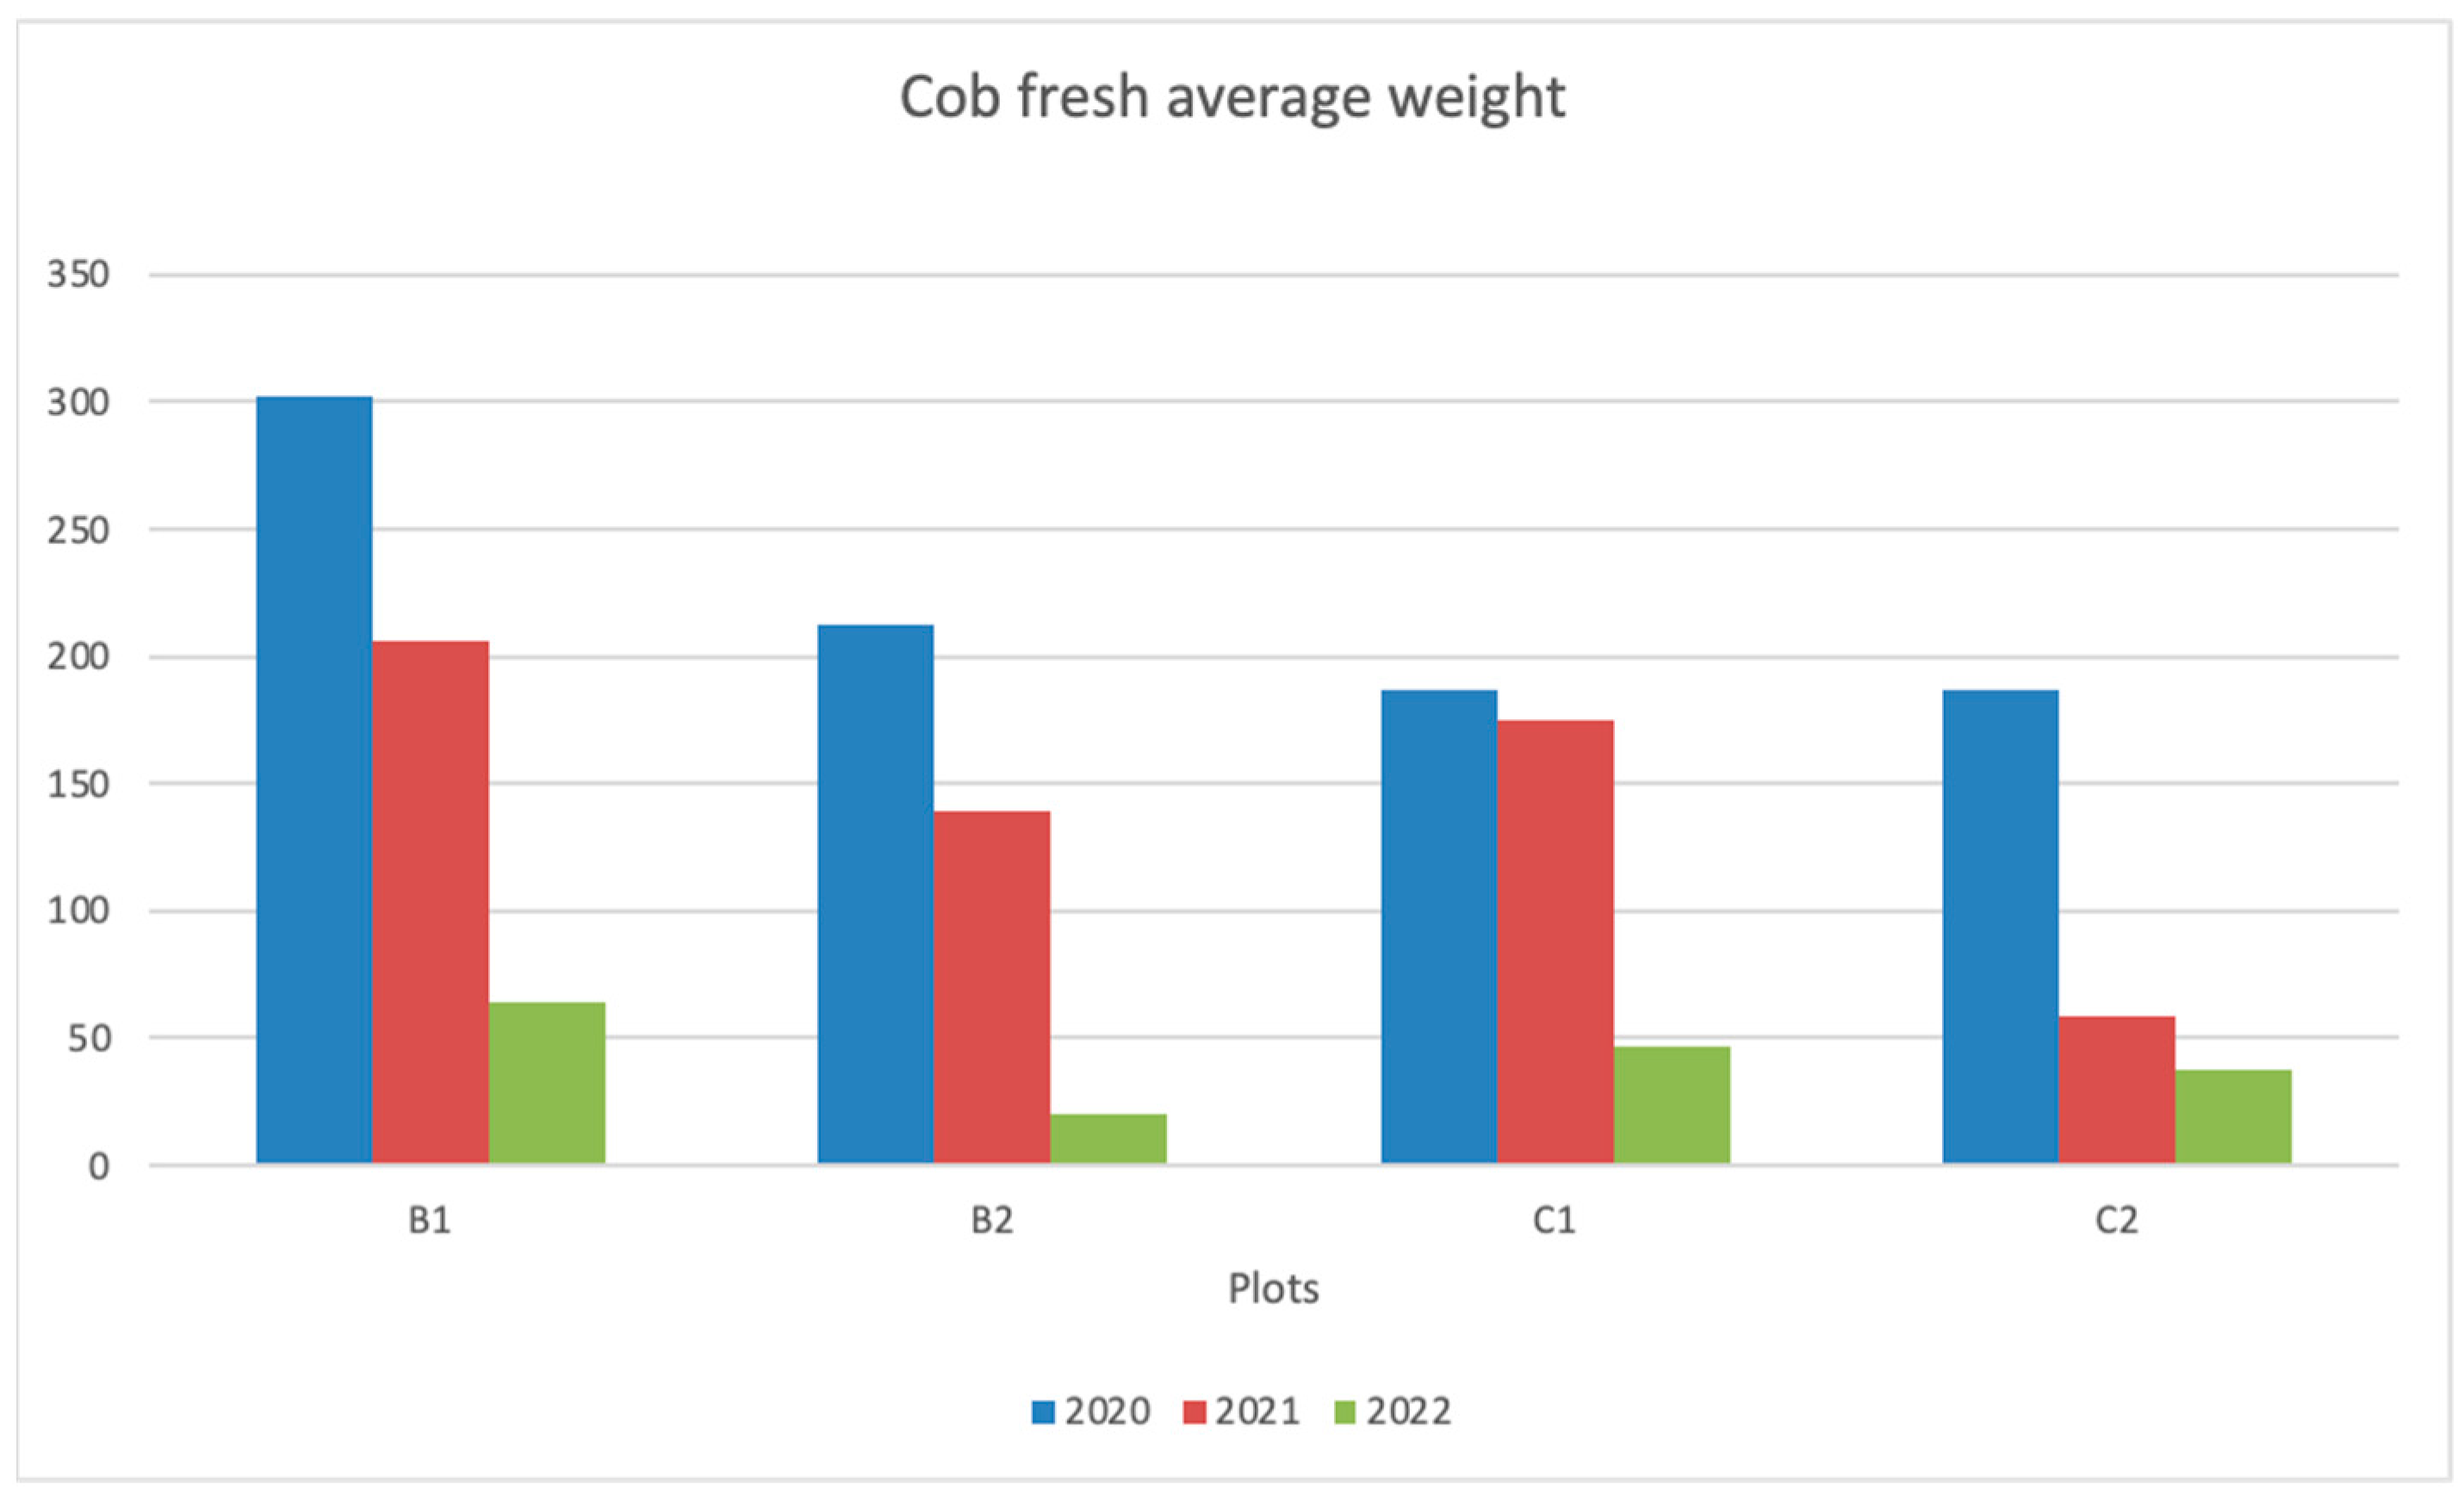
Figure 1. Average fresh cob weight by year. B1, Biochar 1; B2, Biochar 2; C1 and C2, Control.
Energies 16 04131 g001
Figure 2. Comparison of the variation in assimilable nitrate (mg/L) (×10), assimilable potassium, and (mg/kg) and assimilable phosphorus (mg/kg) (×10) over time in soil (a) B1, (b) B2, (c) C1, and (d) C2.
Energies 16 04131 g002aEnergies 16 04131 g002b
Figure 3. Comparison of the variation in assimilable nitrate (mg/L) (×10), assimilable potassium (mg/kg), and assimilable phosphorous (mg/kg) (×10) over time (crop year).
Energies 16 04131 g003
Figure 4. Average lavandin volume by treatment; the data are arranged based on the location of the rows in each treatment.
Energies 16 04131 g004
Figure 5. Average lavandin volume with and without treatment with biochar.
Energies 16 04131 g005
Figure 6. Average weight of grapes in the vineyard by biochar doses (zone 1).
Energies 16 04131 g006
Figure 7. Average weight of grapes in the vineyard for different biochar doses (zone 2).
Energies 16 04131 g007
Table 1. Mass balance of the different raw materials used in the biochar production process.
BiocharWood VinegarBio-OilBio-BitumenSyngas
Pinewood (B1)27.54%36.23%8.45%0.67%27.11%
Olive stone (B3)31.72%44.49%7.49%1.76%14.54%
Table 2. Proximate analysis and main physicochemical properties of the three biochar.
ParameterUnitPine (B1)Pine (B2)Olive Stone (B3)
Moisturewt.%1.5518.31.33
Dry Matterwt.%98.581.798.7
Organic Material%s.m.s.97.549.597.7
Organic Carbonwt.%55.523.555.9
pHpH unit7.37.98.6
Electrical Conductivity (25 °C) dS/m0.1447.5400.508
C/N Ratio-334.5533.05233.99
Humic Acidwt.%2.34.90.9
Total Humic Extractwt.%6.78.320.3
Fluvic Acidwt.%4.43.419.4
Table 3. Data on corn production and cob weight by treatment in 2021 and 2022.
Treatment/CobFresh Cob (g) 2021Cob Weight (g) by Plot 2021Fresh Cob (g) 2022Cob Weight (g) by Plot 2022
B1206.11 ± 186.2913,809.168.45 ± 64.283856.90
B2139.12 ± 139.128347.420.03 ± 18.021482.00
C1174.54 ± 156.629948.946.40 ± 41.302784.1
C2136.93 ± 121.668079.0131.98 ± 37.741022.91
Note: Data are expressed as mean ± standard deviation.
Table 4. Increase in the average fresh weight of cobs from plants cultivated in plots treated with B1 biochar compared with other plots for each year.
Groups vs. B1 (%)Cob 2020Cob 2021Cob 2022
B242.39%48.15%220.92%
C161.73%18.09%38.53%
C261.60%251.72%70.32%
Table 5. Increase in fresh weight of corn for each treatment of B1 over the rest of plots.
Increase in Fresh Weight of Corn
by Treatment (vs. B1)
202020212022
B281.55%65.44%160.19%
C173.18%38.81%38.51%
C2119.71%70.92%277.30%
Table 6. Variation in the most relevant soil parameters over time in plots B1, B2, C1, and C2.
Control 1st Year3rd YearControl 1st Year3rd YearControl 1st Year3rd YearControl 1st Year3rd Year
B1B1B1B2B2B2C1C1C1C2C2C2
pH 7.87.97.97.88.08.07.77.98.07.88.08.0
Conductivity at 20 °C (μS/cm)266.5346.0413.5291.0522.0384.5266.0317.0436.3233.5269.5416.8
NO3/K ratio 0.80.20.11.00.80.30.80.60.11.31.00.3
Ca/Na ratio 1.61.01.12.50.80.93.31.00.81.20.91.0
Ca/Mg ratio 2.21.41.31.91.41.11.91.21.12.01.31.2
K/Mg ratio 1.30.40.11.00.40.10.80.20.10.80.30.1
Exchangeable sodium (meq/100 g soil)0.50.90.50.31.40.50.30.80.60.60.80.5
Exchangeable potassium (meq/100 g soil)2.11.10.41.71.20.31.30.80.31.10.70.4
Exchangeable calcium (meq/100 g soil)23.220.19.720.619.78.621.420.48.617.819.88.5
Exchangeable magnesium (meq/100 g soil)5.16.23.44.96.13.04.76.62.94.06.93.1
Cation exchange capacity (meq/100 g soil)30.928.314.027.528.412.527.728.612.423.528.312.4
Assimilable potassium (mg/kg)826.8441.3139.4649.4454.0116.0523.8316.0136.0414.4266.4142.7
Assimilable phosphorus (mg/kg)44.237.514.566.638.13.240.228.24.252.432.86.0
Table 7. Overview of biochar certification schemes [64,65,66,67].
ParameterUnitsIBI-BSEBCBQM
BasicPremiumStandardHigh Grade
Organic C%≥10-≥10
H/C-≤0.7≤0.7≤0.7
O/C-≤0.4-
Moisture%-≥30≥20
Ash
ECmS m−1Optional
Liming---
pH
PSDmm-
SSAm2g−1-Optional
AWC%-Optional
VMOptional-
Germination-Pass/FailOptional-
Total N%
P, K, Mg, CaOptionalTotal P & K
PAHmg kg−1, db≤300<12<4<20
B(a)P≤3--
PCB≤1<0.2<0.5
PCDD/F≤17<20<20
Asmg kg−1, db (max.)12–100-10010
Cd1.4–391.51393
Cr64–1200908010015
Co40–150--
Cu65–1500100150040
Pb70–50015012050060
Hg1–171171
Mn---3500
Mo5–20-7510
Ni47–600503060010
Se2–36-1005
Zn200–70004002800150
B--
Cl
Na
Note: PSD—Particle Size Distribution; AWC—Available Water Holding Capacity; VM—Volatile Matter. The symbol √ refers to the required analysis for biochar (declaration).
Disclaimer/Publisher’s Note: The statements, opinions and data contained in all publications are solely those of the individual author(s) and contributor(s) and not of MDPI and/or the editor(s). MDPI and/or the editor(s) disclaim responsibility for any injury to people or property resulting from any ideas, methods, instructions or products referred to in the content.