Abstract
This article describes a system for designing floodlighting of objects using computer graphics. Contrary to the currently used visualisation tools, the developed computer application is based on the daytime photography of the object and not on its three-dimensional geometric model. The advantage of the system is the high photorealism of the simulation, with no need to create a collage of visualisation with photography. The designer uses the photometric data of luminaires, and their photometric and colourimetric parameters are defined. With the system it is possible to perform a precise lighting analysis—the distribution of illuminance and luminance—both for the entire facility and in any plane or point. The system also analyses the total installed power of a given design solution. The system application is presented as an example in the form of a case study. This example shows the features of the system and further expected directions of development.
1. Introduction
Currently, the design of floodlighting is primarily performed using simulation methods. Various computer software are used for this purpose, ranging from relatively simple to technically very advanced [1,2,3,4,5]. In any case, however, it is a laborious and time-consuming process. This feature is primarily due to the need to build a three-dimensional geometric model of the object intended for lighting. It is estimated that making a three-dimensional geometric model of an object used as a basis for a lighting design constitutes about 70% of the overall designer’s working time [6]. The final effect of the simulation work depends on the quality of the 3D model [7,8,9,10,11]. However, the geometric model is the beginning of the design process using this technique. The second stage of such a process is correctly mapping the reflective and transmissive properties of the materials from which the object is made. Another problem is the time required to perform the photometric calculations. This is the third stage of design work, which is a very heavy load to the personal computer regarding graphics. The rendering time, i.e., the conversion of vector graphics into raster graphics, also depends on the resolution of the raster image. It can be said that for an average class of currently used computers, with an HD resolution of 1920 × 1080 and several dozen pieces of luminaires, the time for lighting calculations, the final effect of which is photorealistic visualisation, is several hours. The final effect is images showing both the simulation in a photorealistic form and those made using the false colour technique. Such images form the basis for project evaluation, which is, unfortunately, only visual. Although CAD software use measurement planes that give numerical values, they can also act as tools for floodlighting architectural objects. However, they work only for geometrically simple building objects, e.g., single rectangular walls. In the case of an object with a complex shape, numerical measurements are difficult and can generate significant errors [7].
Lighting design using CAD software currently has limited possibilities to analyse the demand for electricity when creating a lighting concept for an architectural object. The designer does not pay much attention to this issue, because the main goal is to achieve an aesthetic effect. After developing the concept of illumination, a classic electrical design is generated in which these parameters are analysed [12,13]. Then, the lighting and control systems are selected. In lighting design, applications working in the BIM system are also used, which can precisely determine the project’s electricity demand. However, this software only performs illuminance calculations. In floodlighting architectural objects, as in road lighting, the main photometric parameter is luminance. This parameter directly depends on the reflective properties of the materials. Even though in most CAD and BIM software, material editors are very extensive, in rare cases, it is possible to define even the primary parameter of the material—the diffusion factor.
In order to obtain photorealism for a floodlighting project, a collage of computer graphics and evening photography are additionally made. This requires the use of dedicated digital image processing tools and additional time to create the collage. In such cases, for the simulation process to run correctly, the computer graphics must be matched to the evening photographs in terms of camera parameters, the object’s position and orientation, but also in terms of photometric and colorimetric properties. Generally, the lighting designer needs to measure the luminance distribution when taking evening photography. These measurements can be made using any method and can be both matrix and analogue measurements. It is essential that the actual luminance levels on the object are measured. The measured luminance levels and distributions should be transferred into a virtual environment in the correct way. Light sources occurring in real conditions are defined in this environment to do this. These will be both street lighting fixtures as well as natural light. After photometric calculations using lighting software, it should be checked whether the luminance levels are close to those measured. A false colour image can be used for this purpose (Figure 1).
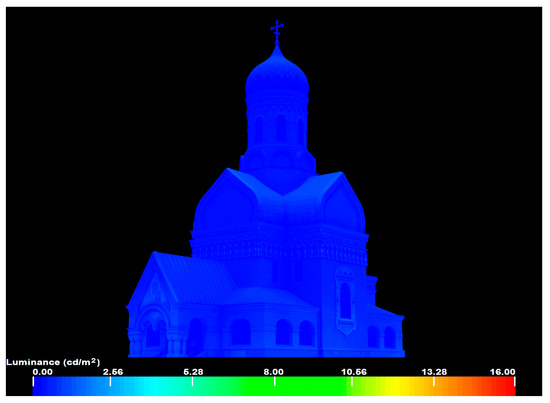
Figure 1.
Simulation of luminance distribution on the object from both natural and artificial ambient lights.
Notably, luminance correction can only be performed using natural light. Using the example in Figure 2, the designer should keep the parameters of the road lighting and another luminaire near the object. The extreme accuracy of mapping real conditions is not required in this case because the designed illumination of the object will significantly change the luminance distribution. These values will be more than ten times greater, so minor errors in the simulation of the existing lighting conditions will be invisible to the human eye. This can be seen by analysing the distribution presented in Figure 1. The range 0–16 cd/m2 was deliberately chosen. Such a range of luminance values is recommended for a final floodlighting project of this object [14]. Even though the uniformity of the distribution is not considerable, it is not noticeable in this range. In real conditions, particularly when the sky is darkened, the luminance of an object often changes dynamically from a few cd/m2 to less than one cd/m2f. All data of the virtual camera should also be transferred into the virtual environment where the final rendering is performed (Figure 2).
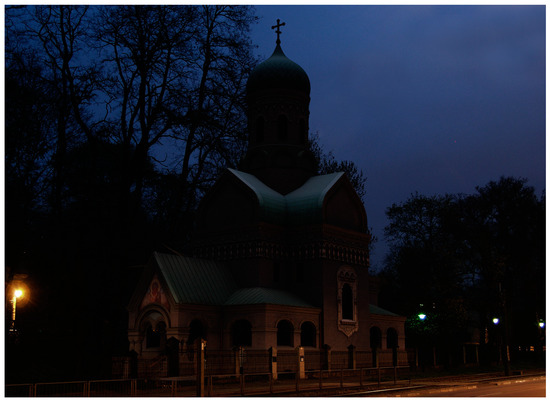
Figure 2.
Photorealistic 3D visualisation of the existing lighting conditions before the implementation of the floodlighting project, integrated into the evening photography.
The image of the virtual object should be matched with the brightness and contrast of the photographed object. The exposure of the virtual camera can only correct this. Such a course in designing virtual lighting guarantees that the brightness of the virtual image will be fully matched to the photograph. In other words, the visualisation and photography will coincide after the project is completed and photographed.
In terms of graphics, the modelling the environment of the object is often a demanding task. The landscaping around it especially objects with organic shapes (trees, shrubs, and figures walking around the object) are challenging to recreate geometrically or transfer from a photograph. This is the reason why these objects are very often removed from the final collage. Therefore, it should be borne in mind that what is presented on such visualisations, despite correctly performing the photometric calculations, will differ from what a human observes after the project is implemented. Figure 3 shows a final three-dimensional computer simulation in the form of a collage, while Figure 4 shows a post-implementation photograph of the illuminated object. Although the object has the same luminance levels and distributions, the images are significantly different. The reason is that there is a different point and direction of observation of the object. When creating a computer simulation, it was designed so that the entrance to the temple and the mosaic on the tympanum were visible. Unfortunately, the tree stands that significantly obscure the object were deliberately removed in the simulation. Creating a collage of computer graphics with evening photography with a dense stand of trees from such a direction is possible but very time-consuming and laborious. Is tree stand removal a problem for this simulation? It turns out that visually, yes. It is impossible to take a photograph showing the entrance to this object so that its entire body is simultaneously displayed. As a result, there are problems with the correct project assessment, and the computer simulation is straightforward to distinguish from reality. However, a different point and direction of observation of the object do not adversely affect the accuracy of the project made in this way. Research has shown [6,15] that traceability, whether in computer graphics or reality, results only from how the collage is generated. When analysing the image in Figure 3, if we are only guided by the idea of the object generated by the computer and the real object, without taking into account the surroundings and the different directions and points of observation, the differences between the building in the simulation and the photograph are not noticeable. The luminance levels and distribution measurements also indicate a high convergence of the results. Therefore, the collage technique is a crucial issue. It is the collage that makes graphics different from reality.
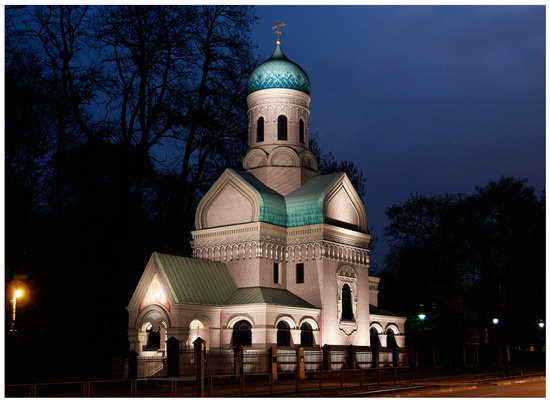
Figure 3.
Computer simulation of the object made using the collage technique of three-dimensional computer graphics and evening photography.
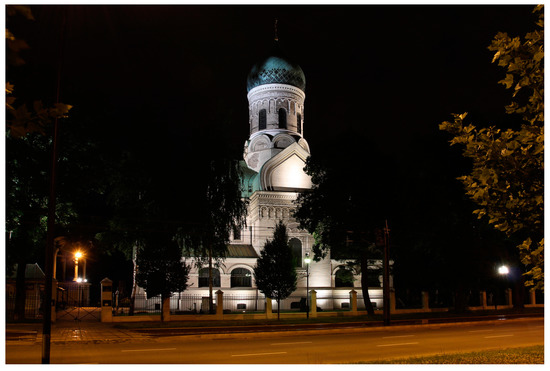
Figure 4.
Post-realization photography of the object floodlighting.
All this means that a floodlighting designer who wants to perform a photorealistic computer simulation of lighting becomes a computer graphic designer. In addition to the ability to create a geometric model, they must also have a good command of digital image processing. The designer’s graphic skills determine whether the simulation will attract the human eye. This is an important problem because the designer should focus on her/his task—designing a technically correct floodlighting, not just a graphically attractive one. It may also happen that an excellent illumination concept will not be presented in a photorealistic way, which is the only reason the project will be rejected.
The described problems are known in the lighting industry; therefore, lighting designers, especially architects, use applications for digital image processing in their work. Using daytime photos, they create eye-catching simulations. In the picture, luminance distributions are created using various techniques. Usually, it consists of “painting” colour with brushes and the so-called using a mouse or stylus to complete the stamps. This design process, by definition, leads to photorealistic, but unfortunately technically incorrect, simulations. It is easy to create the desired luminance distribution in this way; it is more difficult to execute it with actual lighting equipment.
Without the use of lighting simulations, it is difficult to predict how the light will behave on the facade of a building and what the actual levels and distributions of illuminance and luminance will be. After all, it depends on many factors. Of course, with the extensive experience of the designer, who creates the graphics and selects luminaires to achieve the intended effect, this design process can be completed. Practice shows, however, that the differences in the final implementation of the project can be significant. This means that, regardless of the technique of developing the floodlighting project, the results may be affected by many errors. In the case of the 3D model, they result from the limited time, i.e., the use of model simplifications, and in the case of photography, from the lack of professional tools for this purpose.
The aim of this work was to develop an IT system for fast, technically correct designs for the illumination of objects, without the need to build a geometric model of the object and perform post-production in the form of a collage of computer graphics with photographs. The system should also have the ability to analyse the electricity demand of the proposed illumination solution at the stage of creating the lighting concept so that shortly after developing the concept, this information is known to the designer and they can react to it appropriately. This is a very important factor nowadays, when electricity costs are high and there is a tendency to turn off the illumination of objects that do not directly affect the safety of people.
2. System Development
As already mentioned, the assumption of the system was to use a dedicated computer application and daytime photography of the facility to design the illumination scheme. Figure 5 shows the application interface. The developed algorithms make it possible to simulate the illumination project, regardless of the object’s surroundings. Using colour identification of a raster image, the system can determine which elements belong to the object. Usually, the woodlot is darker than the object. The reflective properties of the materials are defined. This is the basic information for algorithms, because this parameter directly affects the level of luminance, which automatically translates into the installed power needed to obtain the levels that are required or recommended. They may vary depending on the technical report or standard. According to the CIE Guide for Floodlighting [14], the luminance levels should depend on the object’s background brightness and can be 4, 6 or 12 cd/m2 for dark, intermediate or light backgrounds, respectively. New reports and standards [16,17,18,19] limit luminance values according to environmental zones and define them from 0 to 25 cd/m2. Material reflection is defined based on the colour of the image. The system user can check the reflection factor of an object in each pixel of its daytime photograph. The system can also calculate this in any area of the object in the photograph. The colour of a pixel with the RGB component = 0 (for each red, green and blue component) has a reflectance value of 0, while a colour with an RGB value of 255 for each component has a reflectance value of 1. The system uses the grey scale to calculate the reflectance if it is a multicoloured image. However, one can imagine that the photo shows a white wall (RGB = 255 for each colour component), which has a reflectance of 0.7. In the case of such a photo, the system will calculate the reflectance with a significant error because the RGB of the pixel will indicate a reflectance value of 1. The photo may also be underexposed, and the reflectance calculated from the pixel’s colour will be underestimated. In both cases, the system makes it possible to correct the reflectance without modifying the image. This correction is performed using the Reflectance Multiplier parameter in the Material Editor section of the software interface. This correction can be made based on a single image pixel or a set of pixels. In the case of a group, select the image in the Area Shape section (Area Shape/Define Area/Reflectance Factor in Figure 5). For a reflection defined in this way, for a pixel or a set of pixels, the software automatically calculates the reflection for the entire object presented in the photograph. In this case, it compares the colour values of the pixels.
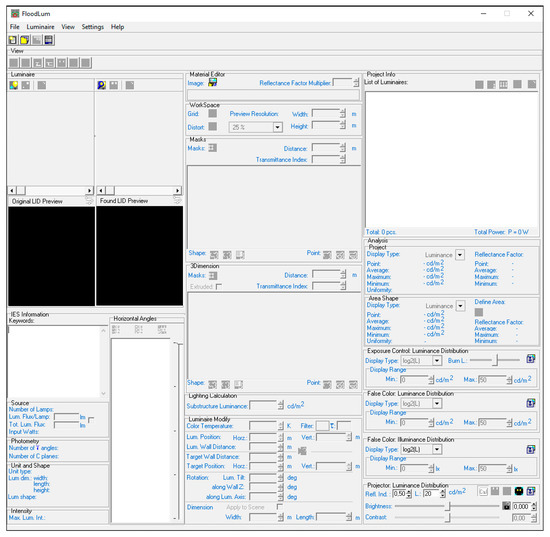
Figure 5.
The interface of computer software for designing floodlighting based on daytime photography of the object.
In addition to defining the reflective properties of the illuminated object and its surroundings, the application allows you to mask any areas of photo. Masks create layers and can apply to both areas of the photo that are not subject to lighting and the object’s body. These layers are assumed to be parallel to each other. Each mask has defined properties: dimension, reflection, transmission and displacement. In this way, a lighting scene is created and marked as 2.5D in computer graphics. The term pseudo-three-dimensionality can be used for such a scene because the layers formed in this graphic are intended to evoke the three-dimensional illusion using the axonometry theory.
The developed system enables the use of photometric files saved in the IES (Illuminating Engineering Society) or LDT (Eulumdat Formatted Luminaire Data File) format and the correction of basic parameters: luminous flux, the luminous intensity in various directions, colour temperature and colour filters. Virtual luminaires are placed in the scene by dragging the filename from the Luminaire section (Figure 5) onto the photograph of the object, which is automatically converted to the evening scenario. The ambient luminance is defined by the software user in the Lighting Calculation section as the Substructure Luminance parameter. In this way, the designer can decide the evening time of their simulation. By default, the ambient luminance value is set to 1 cd/m2. The position and orientation of the luminaires in the virtual scene can be freely modified in the Luminaire Modify section. The change may concern the horizontal and vertical position and the angle of inclination of the luminaire relative to the object. The system user can also use the target parameter and define its horizontal and vertical positions, similarly to the luminaire. It is also possible to enter numeric values relative to the global coordinate system, the origin of which is defined by default as the centre of the photo. The system also allows you to define a local coordinate system. Then, the numerical values in the Luminaire Modify section refer directly to this system. Thus, by indicating numerical values, the designer can define the position of the luminaire that does not fit into the photographic area. The numerical definition of the position of the luminaire’s target is based on the same principles. Additionally, it has the same features (and the maximum luminous intensity of the luminaire may be outside the photographic area). The system enables complete lighting analysis based on luminance distributions generated in the false colour scale and measurements in points or areas.
All these parameters are correlated with the electrical power needed to complete the design task. Information about the number of luminaires used in the project and the total installed power is provided by the system in real time. Every time the equipment is changed, the illuminance distribution is automatically recalculated, which, after taking into account the reflective properties, translates directly into luminance.
Figure 6 presents a flowchart for designing the floodlighting of objects using the proposed system. The first step is to load a Daytime Photo of the object and define its dimensions (Scene Size). Then, the designer creates masks for areas that exclude parts of the image from lighting (Excluding Masks) and masks that represent the object’s three-dimensionality (3D Masks). At the same time, based on the RGB colour system, the surface reflectance is calculated (Reflectance Info). The reflectance values can be corrected (Reflectance Corrections). After loading Photometric Data of luminaires and placing/directing them in the scene (Position XYZ), the application converts the daytime photo into an evening photograph (Night Scene) and calculates the illuminance distribution (Illuminance Calculation) in the entire scene. Considering the Reflection values (after Corrections if necessary) for each scene element represented by the image pixel, the full luminance distribution is calculated (Luminance Calculation). These distributions can be analysed numerically and based on an image made using the false colour technique (False Colour Distribution). Finally, the system creates a Photorealistic Visualization with project documentation in the form of a luminaire’s position layout plan and electricity demand (Project Info).
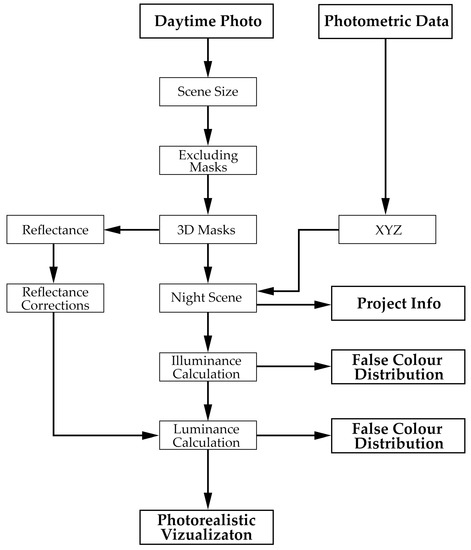
Figure 6.
A flowchart of the floodlighting design process using a system based on daylight photography.
The assumption is that the application is intended for designing the floodlighting of objects with classical architecture. The system uses a raster file (day photo) and, like most currently used software on the market, the luminance calculations are based on Lambert’s cosine law. All materials are therefore perceived as diffusive by the application. Therefore, design errors will appear if anyone tries to simulate an object made of glossy materials. This is an application limitation that the designer should keep in mind. However, as mentioned above, this is a common practice today, when the designer uses a raster image during the design process. This is the limitation of the software. Plans for its further development include marking the areas of the object in the photograph and defining the nature of their reflection.
3. System Validation
The developed system is dedicated to floodlighting projects based on photorealistic computer simulations. One of the most popular CAD software currently used for this purpose is Autodesk 3ds Max. This is a validated application [20]. Therefore, in the tests of the developed system, it was decided use Autodesk 3ds Max as a reference. For validation tests, a geometrically simple scene was used consisting of a white coloured wall with dimensions of width 10 m and height 10 m with a defined reflectance of 0.7.
A simple lighting system was used, but at the same time, it is the most sensitive. It uses a luminaire with a narrow half-beam angle placed 1 m from the plane. The luminaire is installed at the base of the wall, and its maximum luminous intensity is aimed at its geometric centre. The calculation results obtained from both applications, illuminance and luminance, were compared in the validation test. Visualisations were also analysed. In the case of numerical values, both the maximum and average values of illuminance (Emax, Eavg) and luminance (Lmax, Lavg) were considered. Both systems report values rounded to the second decimal place. In the case of photometric quantities, such accuracy is not required, but it may be helpful for validation tests. Table 1 compares the obtained numerical simulation results, while Figure 7 shows the visualisations generated by both software. The range of illuminance and luminance distributions of the false colour pictures were the same (0–100 lx for illuminance, 0–50 cd/m2 for luminance).

Table 1.
Numerical results of the illuminance and luminance values for the validation test of the proposed system.
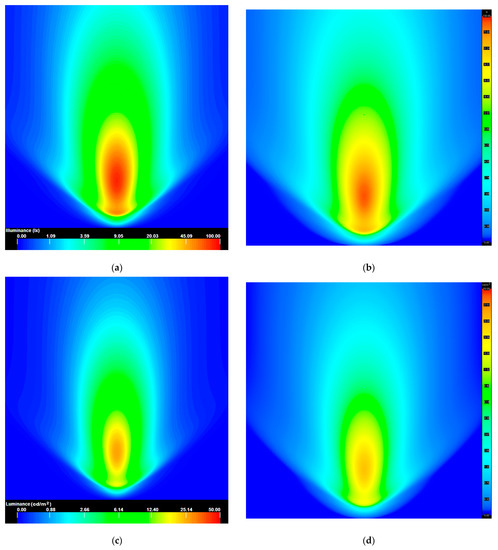
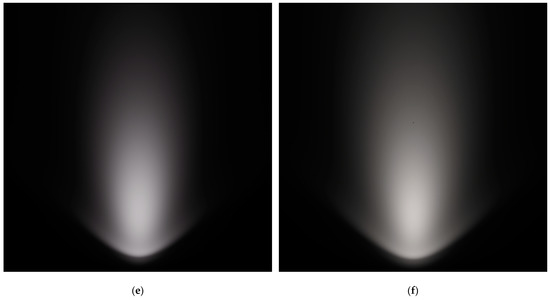
Figure 7.
Illuminance and luminance distribution visualization for Autodesk 3ds Max software and the developed system. (a) Illuminance distribution in 3ds Max, (b) illuminance distribution in the proposed system, (c) luminance distribution in 3ds Max, (d) luminance distribution in the developed system, (e) photorealistic visualization in the 3ds Max software, (f) photorealistic visualization in the developed system.
Analysing the results presented in Table 1 and the images of illuminance and luminance distributions from Figure 7, it should be stated that the results obtained were convergent. The relative calculation difference was lower than 3%. Hence, the developed software algorithm performed well.
In the images presented in the false colour technique, the differences in the images from both software were noticeable. Still, it should be considered that the legends of both systems were also slightly different. Numerical discrepancies were also be noticed, but the difference in the results of the average values was at the level of 1%, and the maximum values were at the level of 2%, and was higher for maximum values. The developed system calculates the illuminance in each pixel of the image. Therefore, it performs significantly more calculations than Autodesk 3ds Max. It is, therefore, possible that in the test using 3ds Max software, the real point on the wall with maximum illuminance was not considered. In the case of lighting design, the average value is a more critical parameter, which was almost identical in both software. The relative calculation difference was on the 1% level.
4. Case Study and Discussion
A daytime photograph of the Palace building in Słupia in Poland (Figure 8) was taken to analyse the system in detail. The Palace is a classic, two-floor building that meets the application requirements and behaviour for cases of simulating floodlighting projects with an organic environment. In the photo (Figure 8), on both the right and left sides of the object, we can see trees whose branches block the object. In addition, there is also low vegetation at the ground level. It would be difficult to recreate such a state in a photorealistic three-dimensional computer simulation. The photo was taken in perfect lighting conditions as there are no shadows from the sun’s rays on the facade. This is due to the northern direction of the illuminated facade of the building. If, however, there were shadows in the photograph, they would have to be removed graphically. Otherwise, the daytime play of chiaroscuro would automatically be transferred to the floodlighting project. This would disrupt the realism and, above all, the correctness of the project. When using this system, care should be taken in the selection and generation of the correct input data for the project, e.g., good daytime photography. However, it should be remembered that currently used tools have the same limitation.
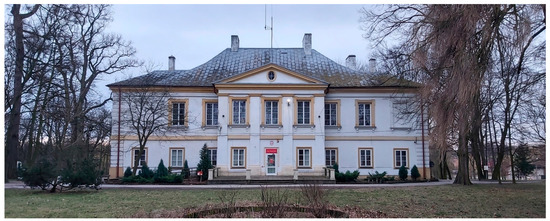
Figure 8.
Palace in Słupia (Poland)—daytime photograph that was used for the 2.5D simulation.
The first step in creating a correct lighting scene using this method is to select the sky and the surrounding area in front of the object to eliminate these parts of the image being lit. The software allows you to apply the masks and make them transparent. Figure 9 shows the orange mask of the sky and the trees standing on either side of the object.
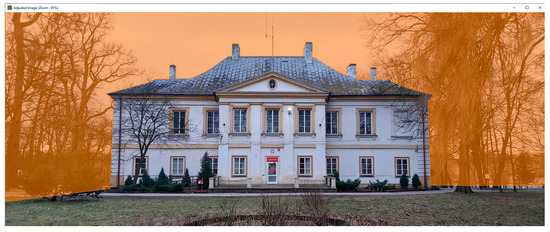
Figure 9.
Masking the sky in day photography.
The next step in the simulation is to create masks that define three-dimensional space. In Figure 10, these masks are marked in blue, with the distinction of the colour tone for the mask under editing (portico). As with masks that exclude the selected area from the lighting, 3D masks have a defined distance between themselves. The selected part of the object can also be given a transmission factor if is transparent.
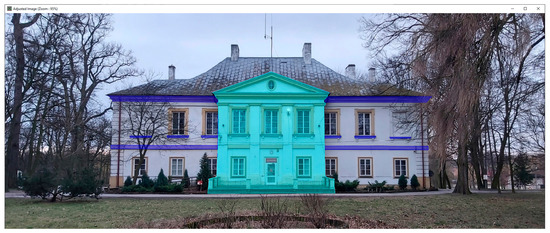
Figure 10.
Masks are responsible for the three-dimensionality of the object.
In the described case, a reflectance of 0.5 was defined for a fragment of the façade. On this basis, according to the procedure described in the System Development section, the software determined the reflectance for each fragment of the object and the environment.
The Luminaire Modify section of the computer application (Figure 11) allows the user to define the colour temperature of each light source, colour filters, and the luminaires’ exact positioning.
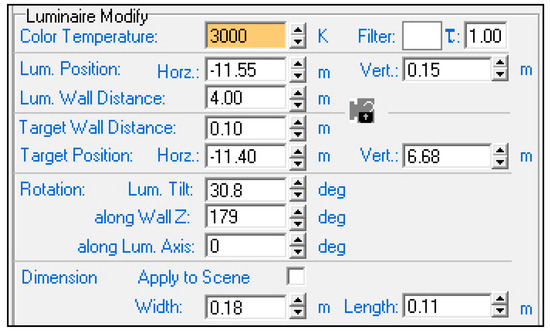
Figure 11.
The Luminaire Modify section of the system.
The test project of the floodlighting of the building assumes illumination using a planar method [14,19,21,22] with the use of ground-based luminaires and highlighting the pilasters in the central part. The tympanum will be illuminated from a long distance using two luminaires with a narrow luminous flux distribution. This will allow the roof plane to be emphasized at the same time. Figure 12 shows a 2.5D computer simulation according to the assumed lighting concept. This type of image can be analysed for compliance with the recommendations regarding architecture and floodlighting using the latest trends in this field, i.e., eye tracking [23,24].
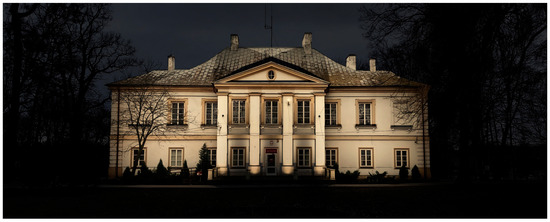
Figure 12.
Visualization of floodlighting design of the Palace in Słupia (Poland) made using the 2.5D technique.
The system automatically creates technical documentation of the project in the form of a plan for the arrangement of luminaires in the project (Figure 13). The Project Info section (Figure 14) provides information about the luminaires used, saved as Luminous Intensity Distributions files, which can be turned on/off individually or in groups. The number of luminaires used in the project and the total installed power is also provided. These parameters translate into photometric calculations, the result of which is the distribution of luminance (Figure 15) and illuminance (Figure 16) made using the false colour technique.
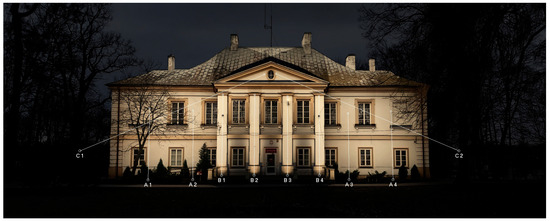
Figure 13.
Luminaire layout plan generated by the system in accordance with the floodlighting design.
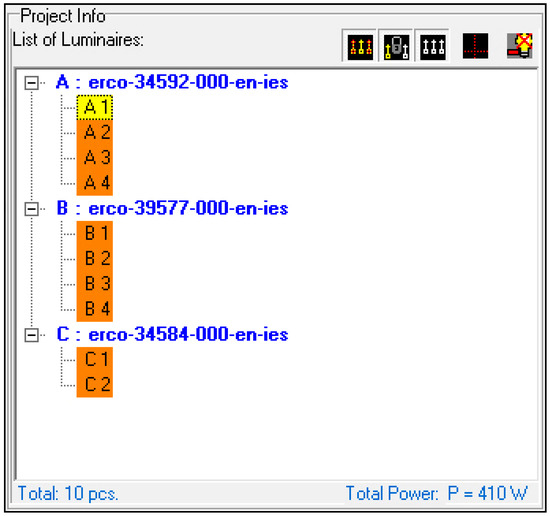
Figure 14.
Project Info section with Total Power counting.
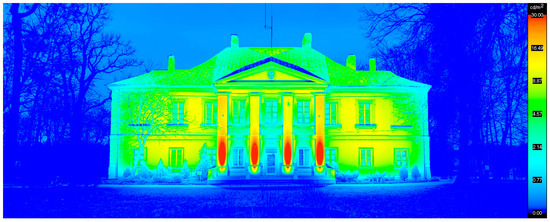
Figure 15.
Luminance distribution of the Palace areas and surroundings.
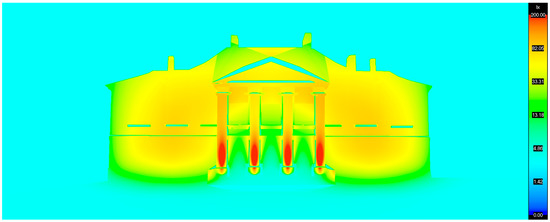
Figure 16.
Illuminance distribution on the Palace areas.
The floodlighting project of the Palace in Słupia used 10 ERCO luminaires with a total power of 410 W. For the size of the facility, the electricity consumption was low. The design is well thought out, and the system worked well in practice.
Both distributions can be analysed for the entire lighting scene, including the object’s surroundings (Figure 15 and Figure 16), only for the complete object (Figure 17) or any selected area (Area Shape shown in Figure 18).
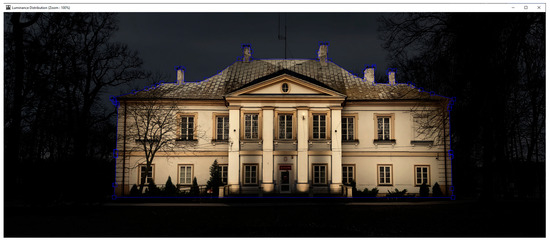
Figure 17.
Selected area (blue line) for lighting analysis for complete building.
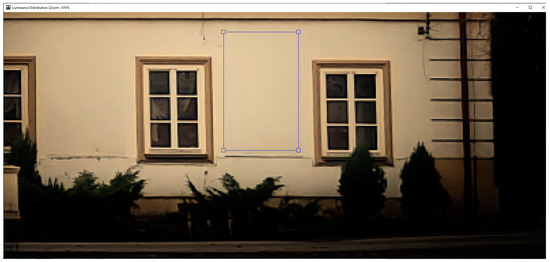
Figure 18.
Local analysis of luminance and illuminance distribution. The plane (blue rectangle) on the facade of the building for the local analysis of illuminance and luminance distributions.
The system calculates the illuminance or luminance value at any indicated point. It also provides the average value in the marked area, the maximum, minimum, uniformity (quotient of the minimum and average values), and the reflection factor’s average, maximum and minimum values (Figure 19).

Figure 19.
Numerical analysis of the luminance distribution in the selected area. The presented data refer to the area marked in Figure 18.
When analysing the final luminance or illuminance distribution, both in the form of classic visualisation (Figure 12) and false colour technique (Figure 15 and Figure 16), it should be stated that the system works very well in the case of objects covered by trees. It would be difficult to achieve such an effect with a 3D simulation using a collage with evening photography.
Our research proved that the developed system shortens the time required to create a floodlighting concept to a large extent. Depending on the architecture of the building and its size, the process is even several hundred times faster compared to the classic design approach using a 3D model. The process is faster while maintaining the same simulation quality and, most importantly, technical correctness. The simulation result presented in Figure 12 required about one hour of work.
Performing a simulation based on a three-dimensional geometric model for this object is estimated to require 50 h of work. Of course, this time depends on the designer’s experience, their knowledge of 3D software and the computing power of the computer hardware for 3D photometric calculations.
The system has some limitations. It properly created the depth of the image and the play of chiaroscuro, provided that the planes making up the object are parallel to each other and to the screen on which the project is presented. In fact, the luminance gradient on the palace roof planes will be stronger as they are rotated concerning the elevation plane by an angle of 60 to 70 deg. Due to this rotation, the shadows created from the tympanum will also be longer. Therefore, it should be borne in mind that the system generates errors in such cases. The authors are currently working on eliminating this limitation of the software.
5. Conclusions
The developed IT system enables fast, technically correct implementation of the floodlighting concept of an object. The design process is based on the daytime photography of the object, so there is no need to build a geometric model, defining materials, and adapting the computer simulation to evening conditions (creating a collage). This opportunity significantly reduces the project development time and therefore also cost. The software algorithms allow the user to simulate the object’s lighting regardless of any obstructions, which is currently a serious problem in the case of 3D simulation with the use of a collage with evening photography. The computer application enables complete lighting analysis based on illuminance and luminance distributions generated in the false colour scale and calculations at any point or area. Compared to those currently on the market, it is an innovative system. Importantly, the system informs the designer about the power installed for the lighting concept in real time. Additionally, each modification of the equipment or its arrangement is taken into account in the calculations. In summary, the developed system is a universal and useful tool in the hands of a designer of object floodlighting. However, it should be remembered that the system is not based on a 3D model of the object. Therefore, only parts of the object that are visible in the photograph can participate in the lighting calculations. Another limitation is the inclusion of only perfectly diffusing materials in the photometric calculations. An attempt to simulate objects made of glossy materials will have a quite large error. Nevertheless, there are many advantages of the proposed software and the presented limitations do not significantly affect its usability and performance.
6. Patents
The solution described in the article is subject to patent protection No. PL225208 “Method for shaping the luminance distribution and the system for the application of this method”. The system is also protected by ®329116.
Author Contributions
Conceptualization, R.K.; methodology, R.K.; software, R.K. and W.S; validation, R.K., W.S., P.P., A.W. and K.S.; formal analysis, R.K., W.S., P.P., A.W. and K.S; investigation, R.K., W.S., P.P., A.W. and K.S.; resources, R.K., W.S., P.P., A.W. and K.S.; writing—original draft preparation, R.K., P.P., A.W. and K.S.; writing—review and editing, R.K., P.P., A.W. and K.S.; visualization, R.K.; supervision, R.K.; project administration, R.K.; funding acquisition, R.K. All authors have read and agreed to the published version of the manuscript.
Funding
This research received no external funding. It was created within the 2nd edition (2021) of the competition supporting scientific activities of the Scientific Council for the Discipline “Automation, Electronics and Electrical Engineering” (Warsaw University of Technology). Article Processing Charges (APC) were covered partially by the IDUB Open Science program at Warsaw University.
Data Availability Statement
Not applicable.
Conflicts of Interest
The authors declare no conflict of interest.
References
- Valetti, L.; Floris, F.; Pellegrino, A. Renovation of Public Lighting Systems in Cultural Landscapes: Lighting and Energy Performance and Their Impact on Nightscapes. Energies 2021, 14, 509. [Google Scholar] [CrossRef]
- Jiménez Fernández-Palacios, B.; Morabito, D.; Remondino, F. Access to complex reality-based 3D models using virtual reality solutions. J. Cult. Herit. 2017, 23, 40–48. [Google Scholar] [CrossRef]
- Schielke, T. The Language of Lighting: Applying Semiotics in the Evaluation of Lighting Design. Leukos—J. Illum. Eng. Soc. N. Am. 2019, 15, 227–248. [Google Scholar] [CrossRef]
- Mansfield, K.P. Architectural lighting design: A research review over 50 years. Light. Res. Technol. 2018, 50, 80–97. [Google Scholar] [CrossRef]
- Scorpio, M.; Laffi, R.; Masullo, M.; Ciampi, G.; Rosato, A.; Maffei, L.; Sibilio, S. Virtual Reality for Smart Urban Lighting Design: Review, Applications and Opportunities. Energies 2020, 13, 3809. [Google Scholar] [CrossRef]
- Krupiński, R.; Wachta, H.; Stabryła, W.M.; Büchner, C. Selected Issues on Material Properties of Objects in Computer Simulations of Floodlighting. Energies 2021, 14, 5448. [Google Scholar] [CrossRef]
- Krupiński, R. Simulation and Analysis of Floodlighting Based on 3D Computer Graphics. Energies 2021, 14, 1042. [Google Scholar] [CrossRef]
- Mantzouratos, N.; Gardiklis, D.; Dedoussis, V.; Kerhoulas, P. Concise exterior lighting simulation methodology. Build. Res. Inf. 2004, 32, 42–47. [Google Scholar] [CrossRef]
- Tural, M.; Yener, C. Lighting monuments: Reflections on outdoor lighting and environmental appraisal. Build. Environ. 2006, 41, 775–782. [Google Scholar] [CrossRef]
- Wachta, H.; Baran, K.; Leśko, M. The meaning of qualitative reflective features of the facade in the design of illumination of architectural objects. AIP Conf. Proc. 2019, 2078, 020102. [Google Scholar] [CrossRef]
- Whyte, J.; Bouchlaghem, N.; Thorpe, A.; McCaffer, R. From CAD to virtual reality: Modelling approaches, data exchange and interactive 3D building design tools. Autom. Constr. 2000, 10, 43–45. [Google Scholar] [CrossRef]
- Skarżyński, K.; Żagan, W. Improving the quantitative features of architectural lighting at the design stage using the modified design algorithm. Energy Rep. 2022, 8, 10582–10593. [Google Scholar] [CrossRef]
- Skarżyński, K.; Żagan, W. Quantitative Assessment of Architectural Lighting Designs. Sustainability 2022, 14, 3934. [Google Scholar] [CrossRef]
- CIE Technical Report Guide for Floodlighting; CIE: Vienna, Austria, 1993.
- Krupinski, R. Evaluation of Lighting Design Based on Computer Simulation. In Proceedings of the 2018 VII. Lighting Conference of the Visegrad Countries (Lumen V4 2018), Trebic, Czech Republic, 18–20 September 2018. [Google Scholar] [CrossRef]
- En 12464-1; CEN European Standard, Light and Lighting—Lighting of Work Places, Interior Work Places. CEN: Brussels, Belgium, 2021; Part 1.
- CIE Technical Report 150 Guide on the Limitation of the Effects of Obtrusive Light from Outdoor Lighting Installations, 2nd ed.; CIE: Vienna, Austria, 2017.
- En 12464-2; CEN European Standard, Lighting of Work Places—Part 2: Outdoor Work Places Lumière. CEN: Brussels, Belgium, 2014.
- CIE Technical Report A Guide to Urban Lighting Masterplanning; CIE: Vienna, Austria, 2019.
- Reinhart, C.; Pierre-Felix, B. Experimental validation of autodesk®3ds max®design 2009 and daysim 3.0. LEUKOS—J. Illum. Eng. Soc. N. Am. 2009, 6, 7–35. [Google Scholar] [CrossRef]
- External Artificial Lighting, Guidance Note. Colchester Borough Council. 2012. Available online: https://cbccrmdata.blob.core.windows.net/noteattachment/Artificial%20Light%20Planning%20Guidance%20Note.pdf (accessed on 8 March 2023).
- O’Farrell, G. External Lighting for Historic Buildings. Engl. Herit. 2007, 4, 1–14. [Google Scholar]
- Rusnak, M. Eye-tracking support for architects, conservators, and museologists. Anastylosis as pretext for research and discussion. Heritage Sci. 2021, 9, 1–19. [Google Scholar] [CrossRef]
- Rusnak, M.A.; Rabiega, M. The Potential of Using an Eye Tracker in Architectural Education: Three Perspectives for Ordinary Users, Students and Lecturers. Buildings 2021, 11, 245. [Google Scholar] [CrossRef]
Disclaimer/Publisher’s Note: The statements, opinions and data contained in all publications are solely those of the individual author(s) and contributor(s) and not of MDPI and/or the editor(s). MDPI and/or the editor(s) disclaim responsibility for any injury to people or property resulting from any ideas, methods, instructions or products referred to in the content. |
© 2023 by the authors. Licensee MDPI, Basel, Switzerland. This article is an open access article distributed under the terms and conditions of the Creative Commons Attribution (CC BY) license (https://creativecommons.org/licenses/by/4.0/).