Article

Classification of Partial Discharges Recorded by the Method Using the Phenomenon of Scintillation

Department of Electrical Power and Renewable Energy, Faculty of Electrical Engineering Automatic Control and Informatics, Opole University of Technology, 45-758 Opole, Poland
*
Author to whom correspondence should be addressed.
Energies 2023, 16(1), 201; https://doi.org/10.3390/en16010201
Submission received: 21 November 2022 / Revised: 15 December 2022 / Accepted: 23 December 2022 / Published: 25 December 2022
(This article belongs to the Special Issue High Voltage Insulating Materials-Current State and Prospects 2022)

Abstract

:
Classification is one of the most common methods of supervised learning, which is divided into a process of data acquisition, data mining, feature analysis, machine learning algorithm selection, model learning and validation, as well as prediction of the result, which was done in the current work. The data that were analyzed concerned ionizing radiation signals generated by partial discharges, recorded by a method using the phenomenon of scintillation. It was decided to check if the data could be classified and if it was possible to determine the defect of an electrical power device. It was possible to find out which classifier (algorithm) worked best for the task, and that the data obtained can be classified, as well as that it is possible to determine the defect. In addition, it was possible to check what effect changing the default values of the classifier’s parameters has on the effectiveness of classification.

1. Introduction

Machine learning is a subset of artificial intelligence that allows computer systems to learn directly from examples, data or experience (rather than according to pre-programmed rules), thus enabling them to perform specific tasks with intelligence. Today, machine learning is used in many applications and is the basis for intelligent systems [1], made possible nowadays by the available greater computing resources of PC computers.
As presented in [2,3,4,5,6], classification as a machine learning task has been successfully used in medicine to improve the quality and scope of health care while remaining relatively constant in cost, as well as diagnostics by analyzing large amounts of data to find associations. For example, [7] suggested using classification for joint diagnosis, and [8], for dementia detection. Classification is also finding applications in the military industry. The authors in [9] presented the effectiveness of classification of passive sonar signals of military data, and in [10], the use of the aforementioned machine learning task for the recognition of military aircraft in real-time radar systems was presented. The classification task also has applications in the energy industry. The article [11] used data analysis to predict efficient electricity generation and operation in cities. On the other hand, in the articles [12,13], the authors succeeded in finding that the use of classification methods is possible to diagnose the defect of a power transformer in a non-invasive way through the study of data collected by acoustic methods. In addition, in paper [14], the researchers succeeded in classifying partial discharges on the basis of UHF signals recorded with various antennas, in paper [15], the authors attempted to classify defects in XLPE-insulated cables, in paper [16], the separation and classification of partial discharge signals from various sources in SF6 gas-insulated substations was carried out, and in paper [17], a method for diagnosing partial discharges in gas-insulated switchgear was proposed. In view of the positive results that data classification brings, it was decided to try to classify ionizing radiation signals generated by partial discharges recorded by a method using the scintillation phenomenon.

2. Methodology

The purpose of this study is to classify ionizing radiation signals generated by partial discharges by using MATLAB software (version 2019b, MathWorks, Natick, MA, USA) to classify measurement data and select the best machine learning method.
The data were recorded using a method that exploited the phenomenon of scintillation, i.e., the formation of a light flash as a result of the passage of ionizing radiation through certain substances, during a discharge in the medium. The measurement system consisted of three parts (Figure 1):
  • the electrical discharge generation system, which consisted of a set of spark gaps, a high-voltage transformer, a voltage divider and a control panel,
  • a wireless system for controlling the measurement panel, which consisted of an XBee module and an integrated circuit,
  • a system for measuring high-energy radiation, consisting of a scintillation detector based on a scintillation crystal, a photomultiplier and a measurement card.
  • Figure 2 shows a simplified schematic of the circuit for data acquisition from the scintillator, which was located in the box shown in Figure 1.
The measurement system shown in Figure 1 and Figure 2 is described in detailed in the paper [18]. An americium was used to calibrate the detector system—its energy spectrum was measured near the electric field generated by the sliding discharge, and the number of scintillation counts during the one-second measurement was recorded. Then, the relevant measurements were made.
Studies of ionizing radiation generated by partial discharges were carried out for a single insulating medium—for pure mineral oil, to which argon or air bubbles were then also added. The measurement signals were transferred to a computer, and MATLAB was used to process them, which resulted in splitting the data and placing them in folders. The measurement data are stored in digital form allowing them to be analyzed in the MATLAB programming environment. One file represented one measurement and contained within it information about the values of current, voltage, time and energy of scintillation, with the number of samples being 80,000. The following types of measurements were classified, which correlated with the different types of partial discharge damage that can occur in electric power equipment:
  • type 1: electrodes in oil, blade-to-blade configuration,
  • type 2: electrodes in oil with argon bubbles, blade-to-blade configuration,
  • type 3: electrodes in oil with air bubbles, blade-to-blade configuration, detector distance 0 mm,
  • type 4: electrodes in oil with air bubbles, blade-to-blade configuration, detector distance 80 mm,
  • type 5: electrodes in oil with air bubbles, blade-to-blade configuration, detector distance 120 mm.
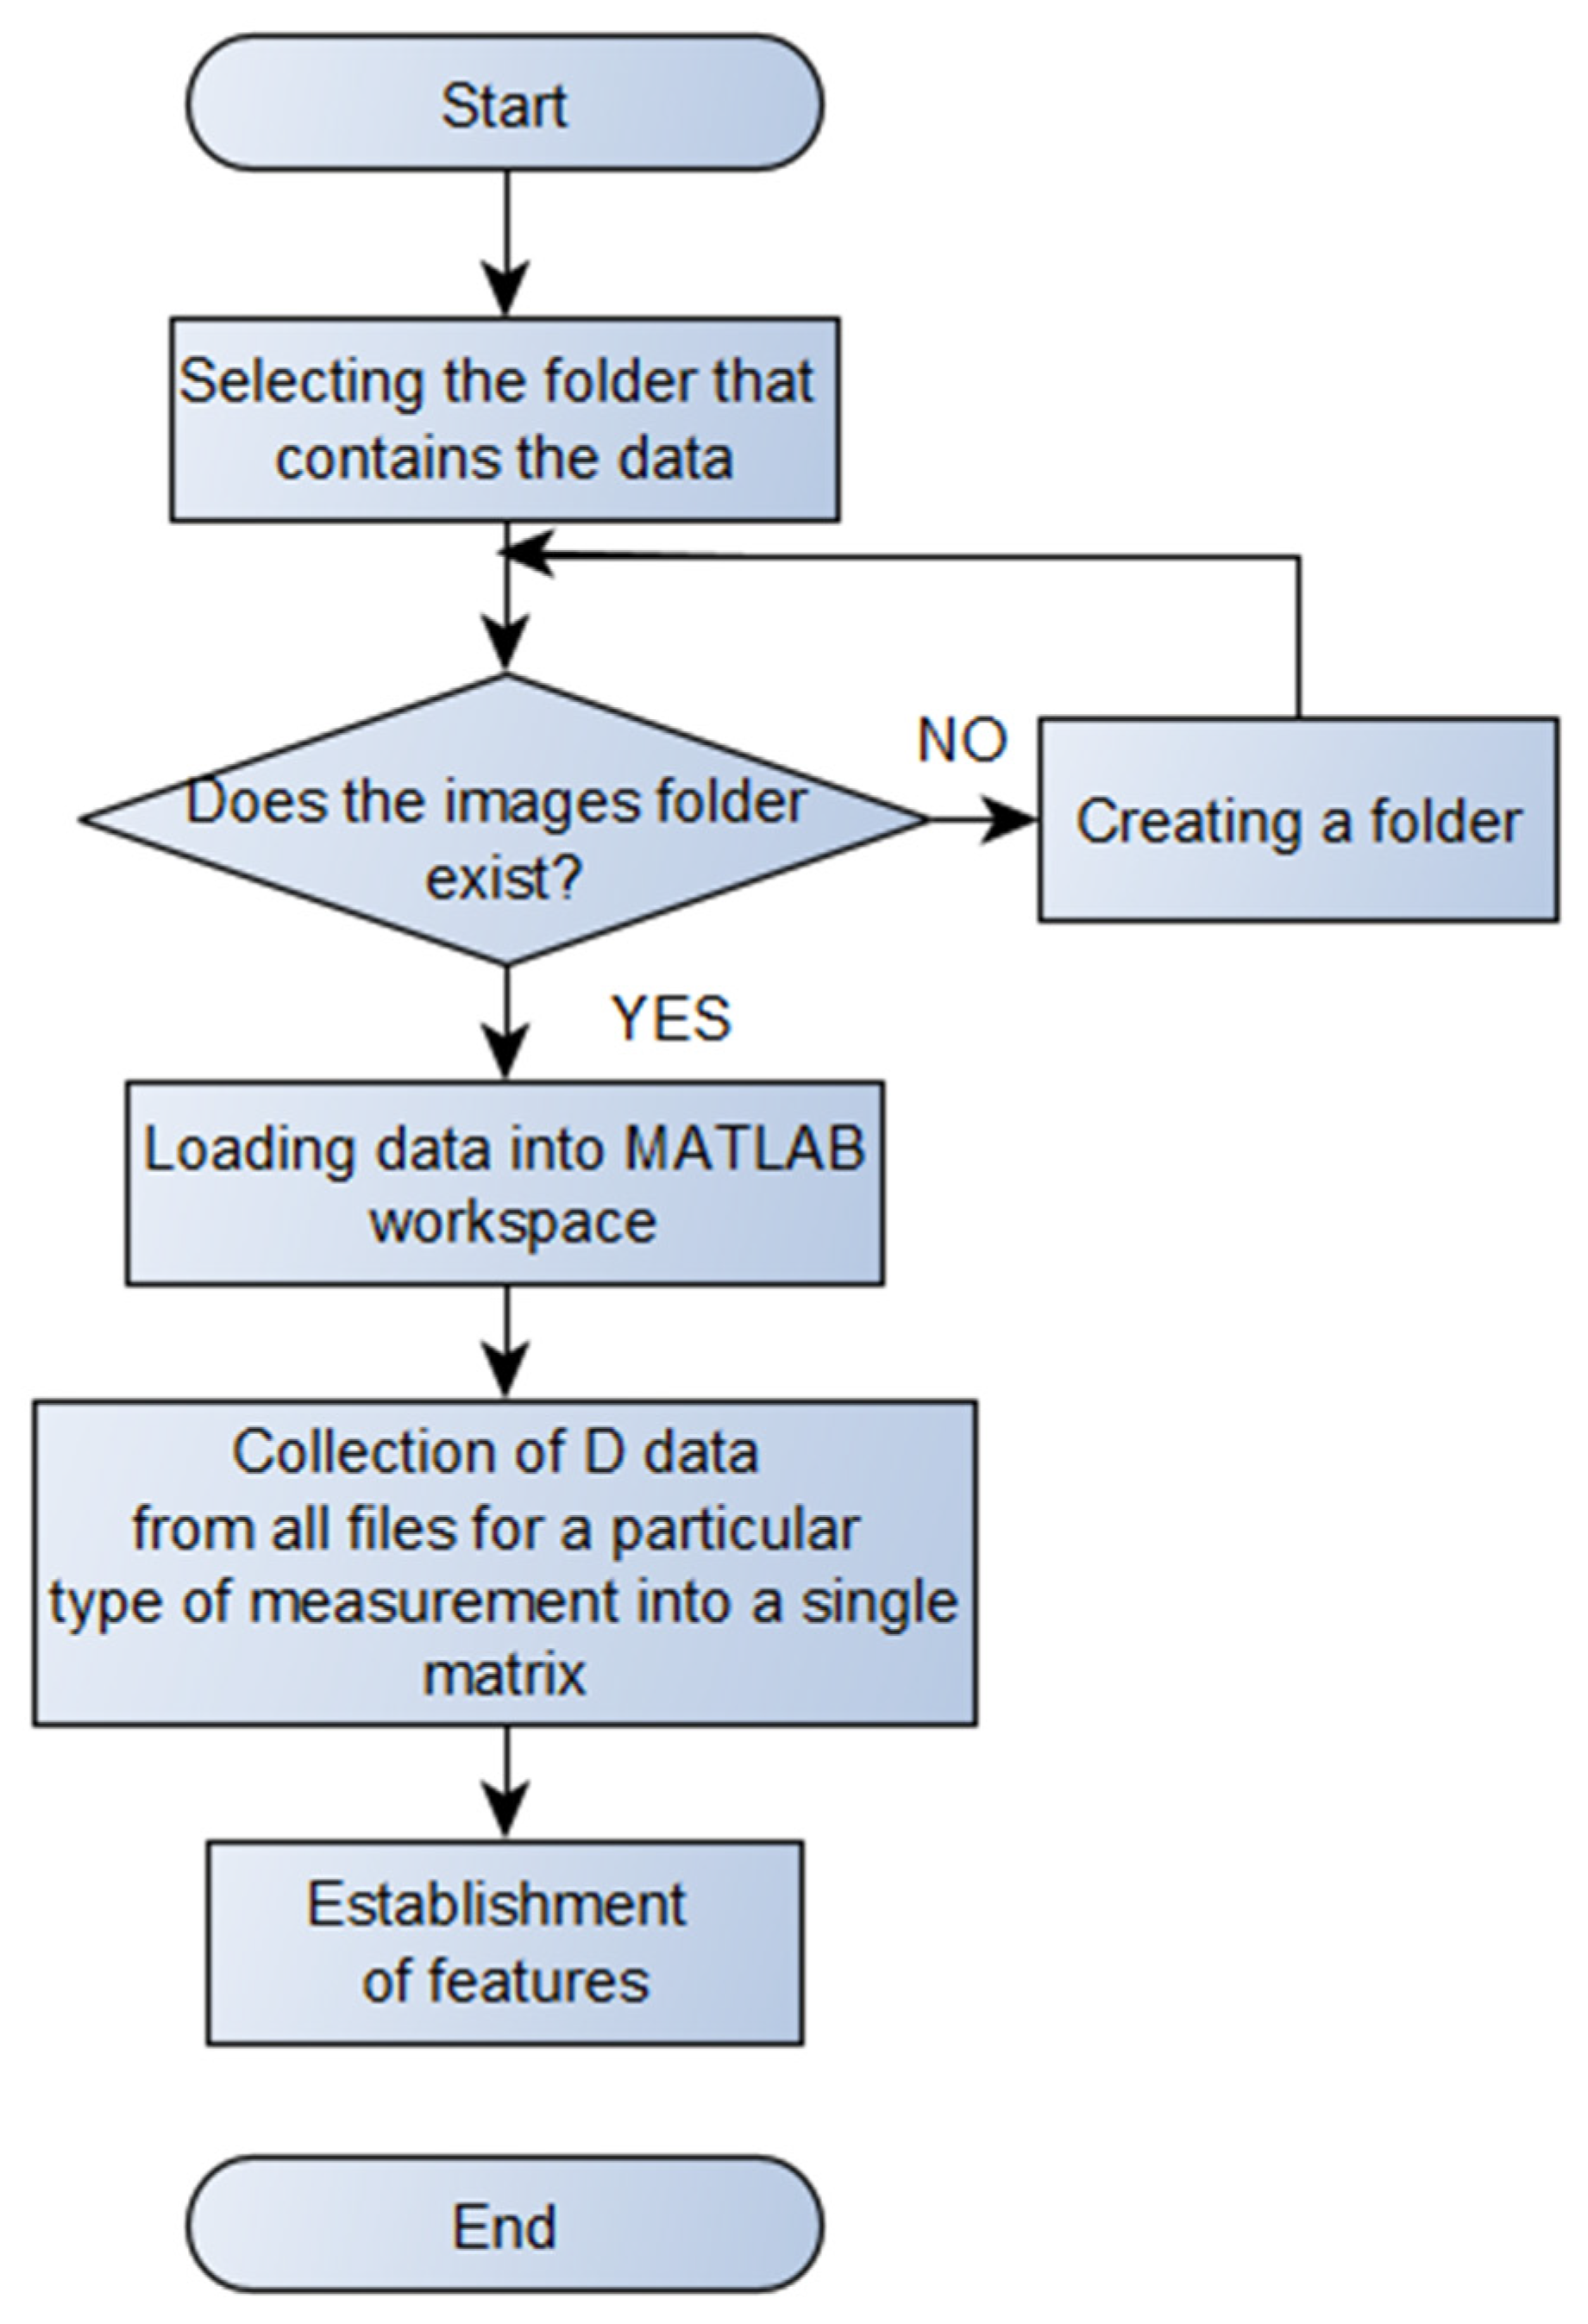
The data were grouped as follows: the first folder, for the first type of data, contained 123 m-files, for the following types; in turn, the second folder contained 121 m-files, the third folder contained 125 m-files, the fourth folder contained 146 m-files, and the fifth folder contained 168 m-files [19]. In order to automate the process of entering data from all folders into the MATLAB environment to select features for further classification, a computer program was developed, whose flowchart is shown in Figure 3.
For the further process of analysis, the main focus was on the measured scintillation energy (D), for which a feature selection was made, which was necessary due to signal noise caused by the excessive amount of data analyzed [20]. Eleven features were selected: sum, maximum, coefficient of skewness (i.e., a measure of the asymmetry of the distribution), kurtosis (a relative measure of the concentration and flattening of the distribution), median, variance, mean, root mean square RMS, standard deviation and form factor, which is the RMS value divided by the mean absolute value. Then, all the feature information for each data type was put into a matrix, which also included a label with the corresponding type number.

3. Results and Discussion

The purpose of this study was to classify ionizing radiation signals generated by partial discharges by using MATLAB software to classify measurement data and select the best machine learning method.
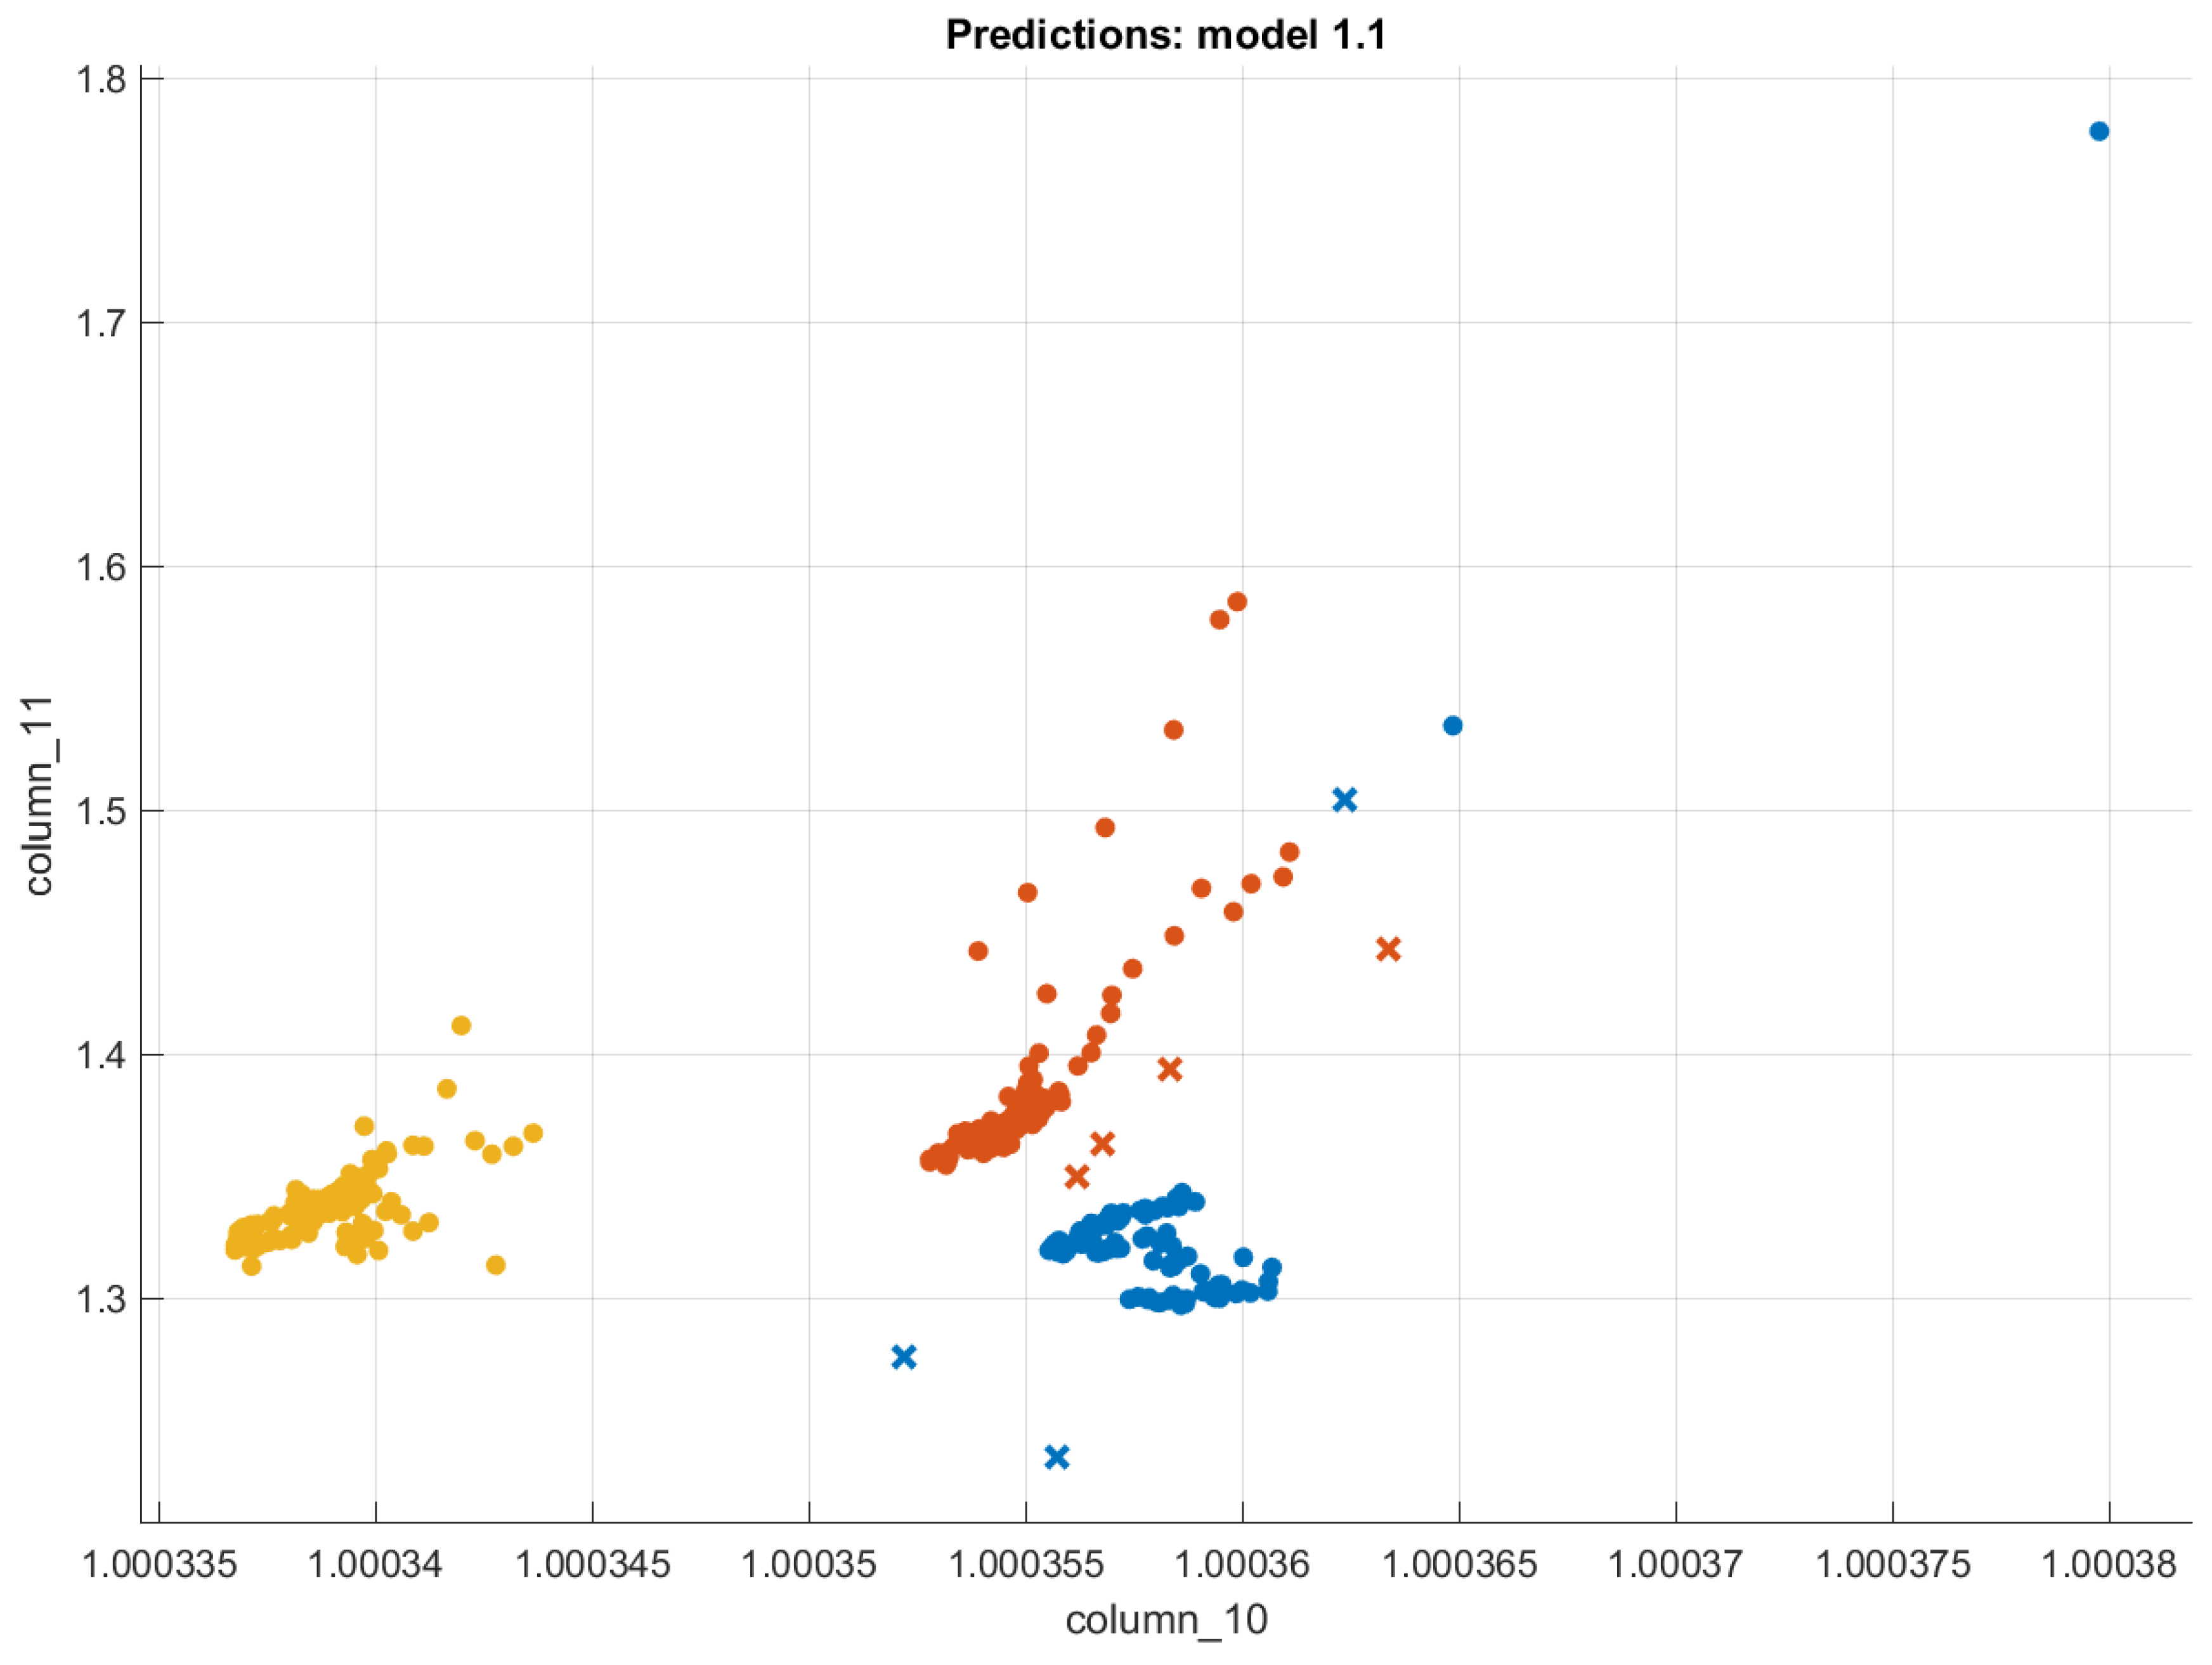
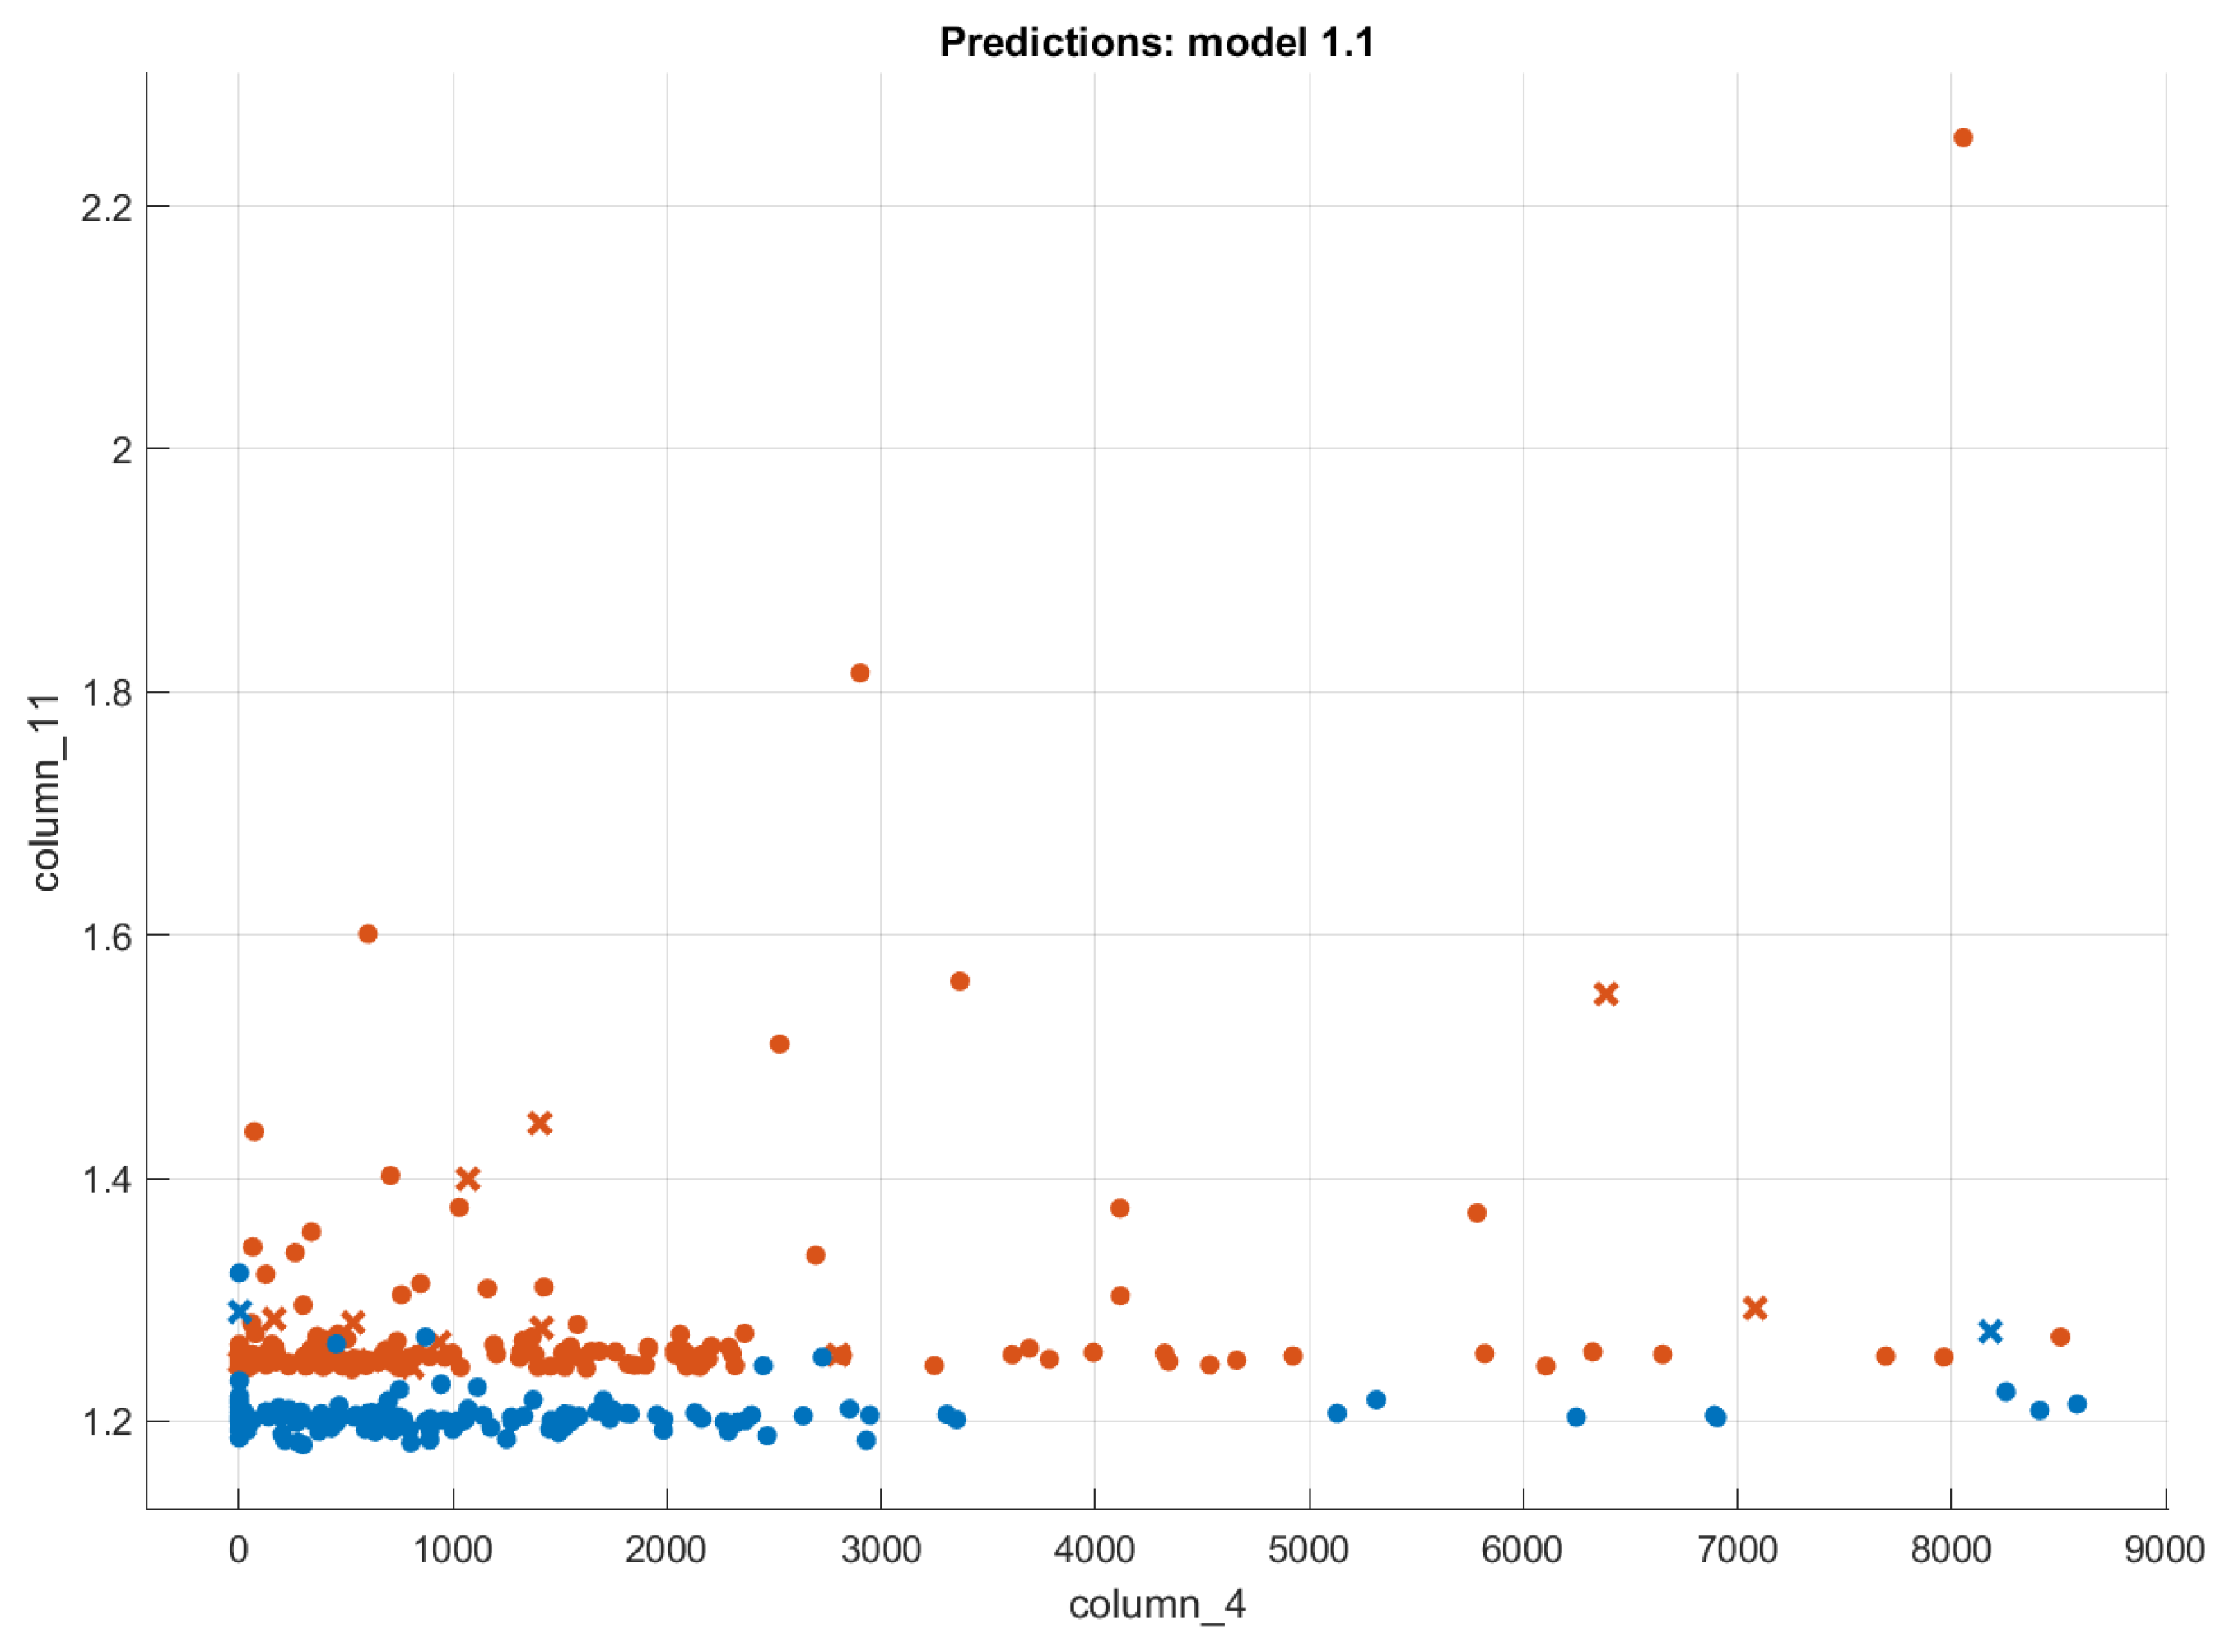
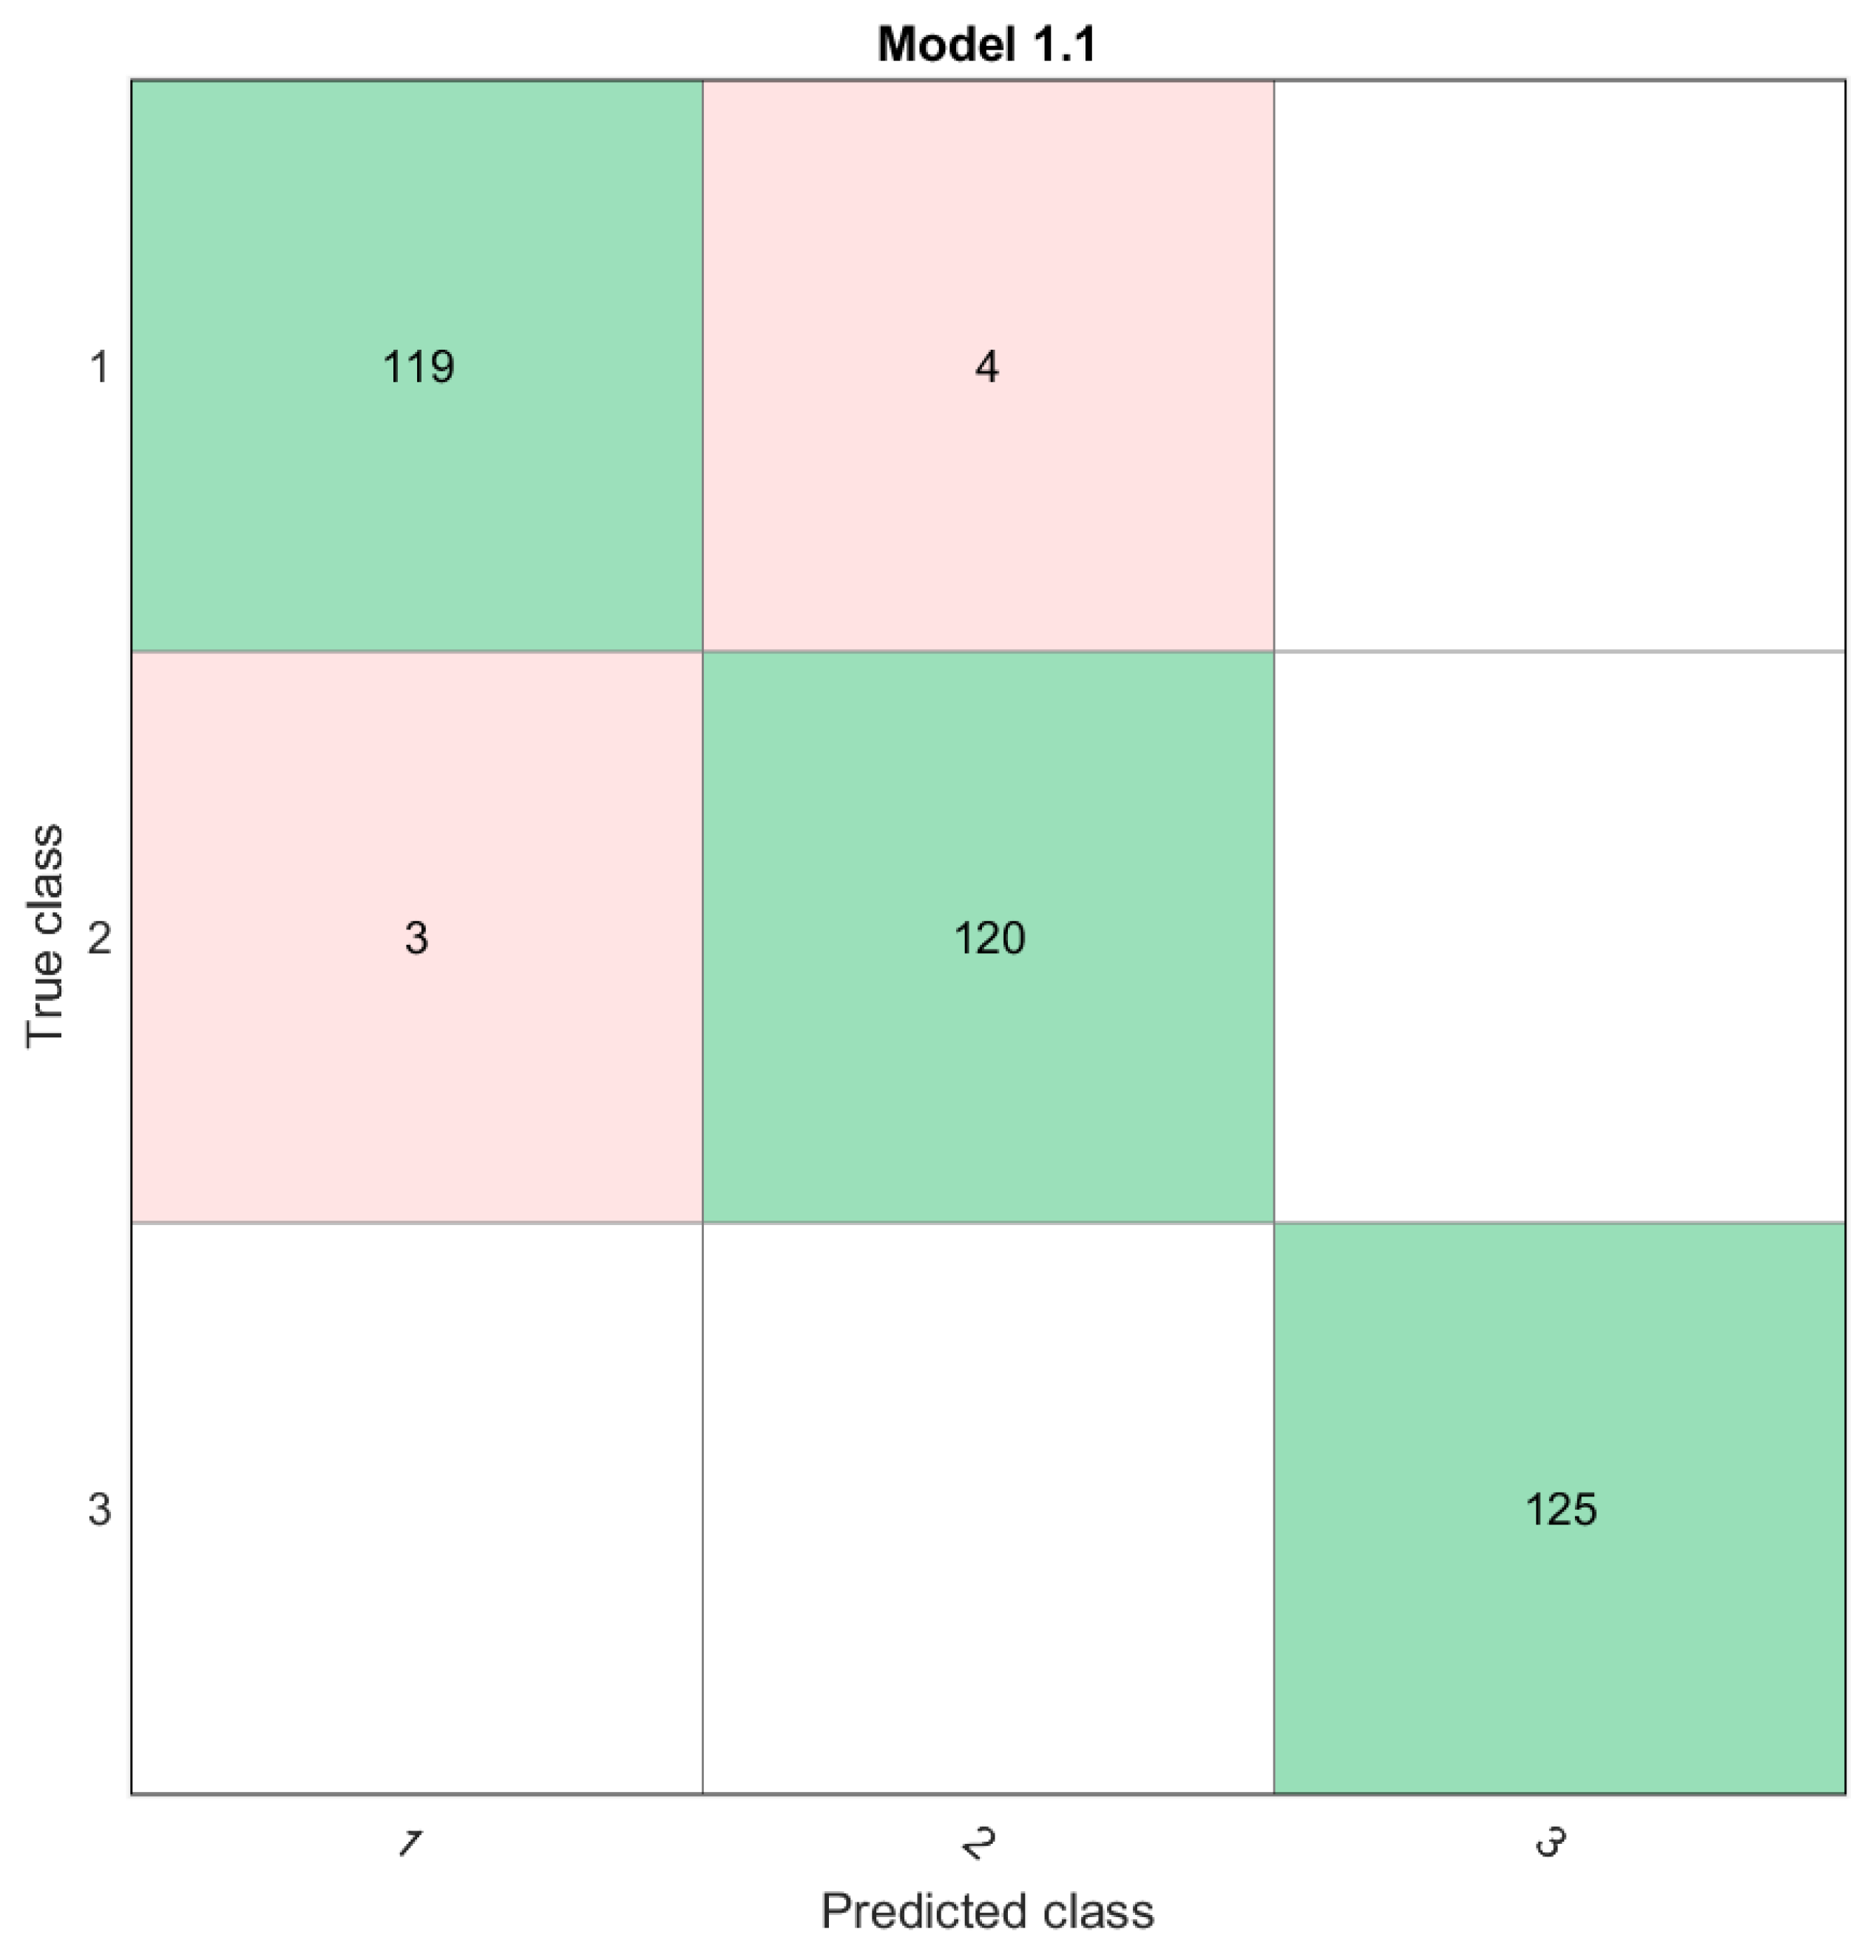
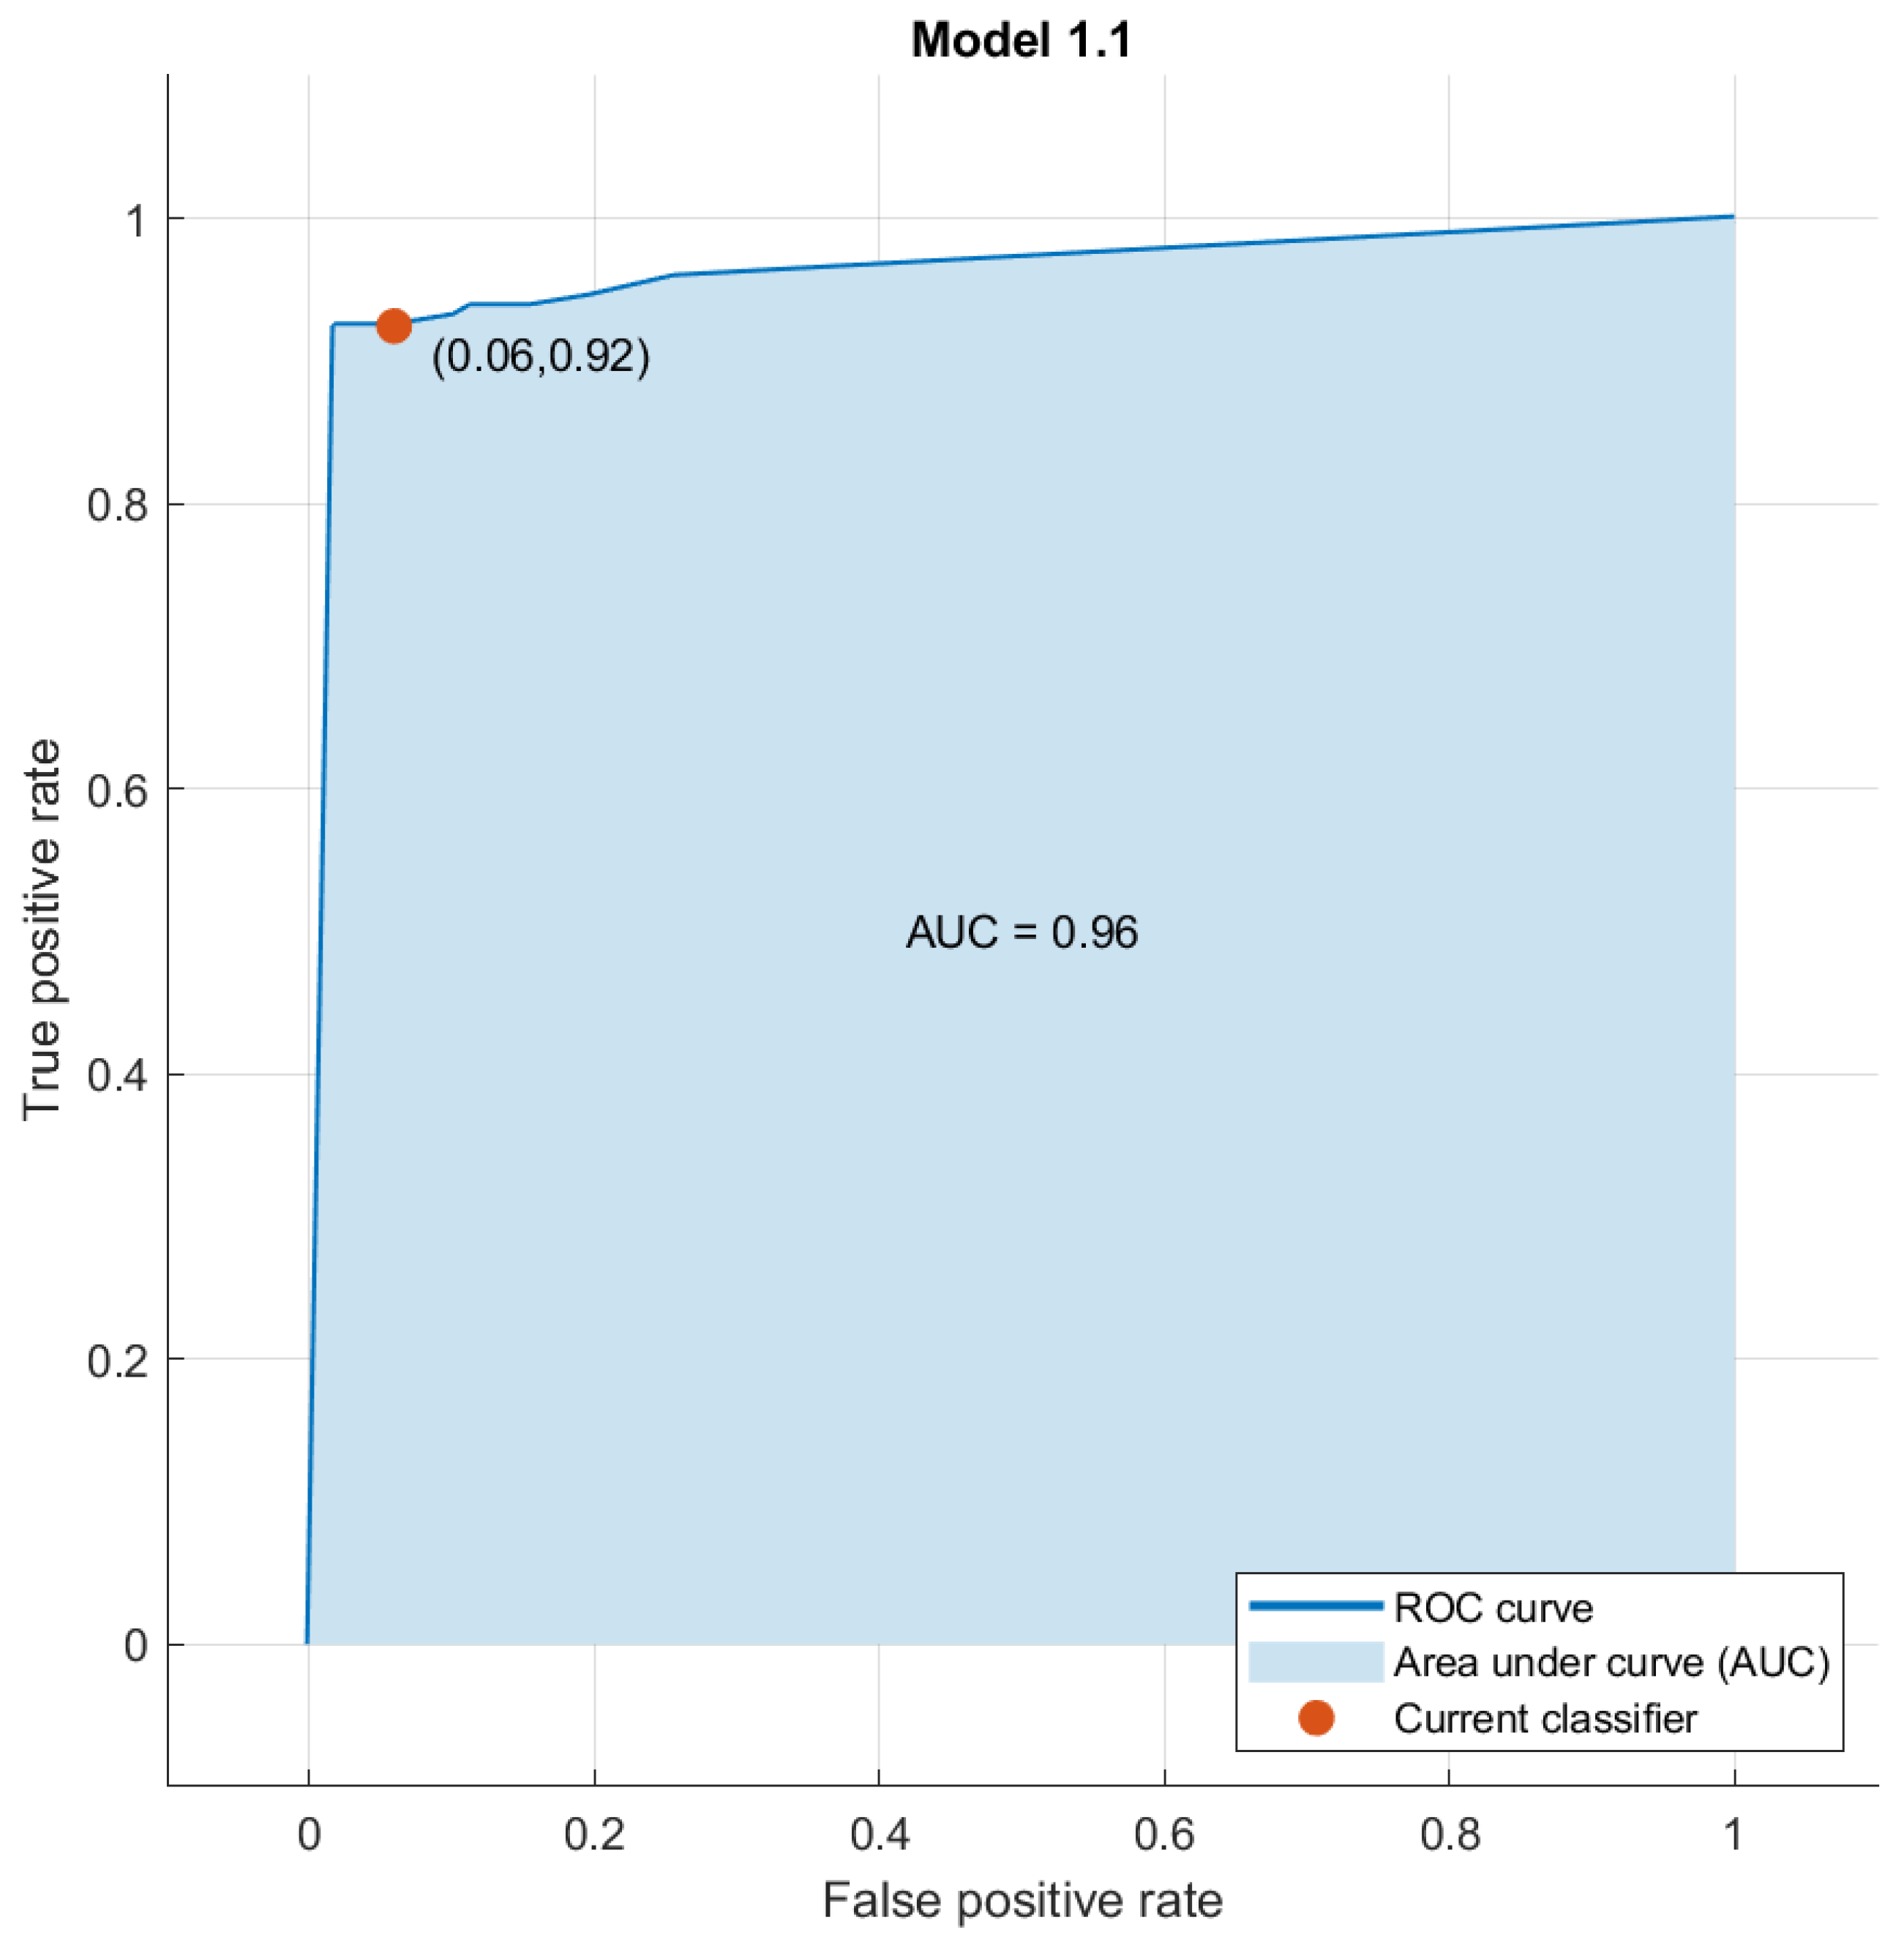
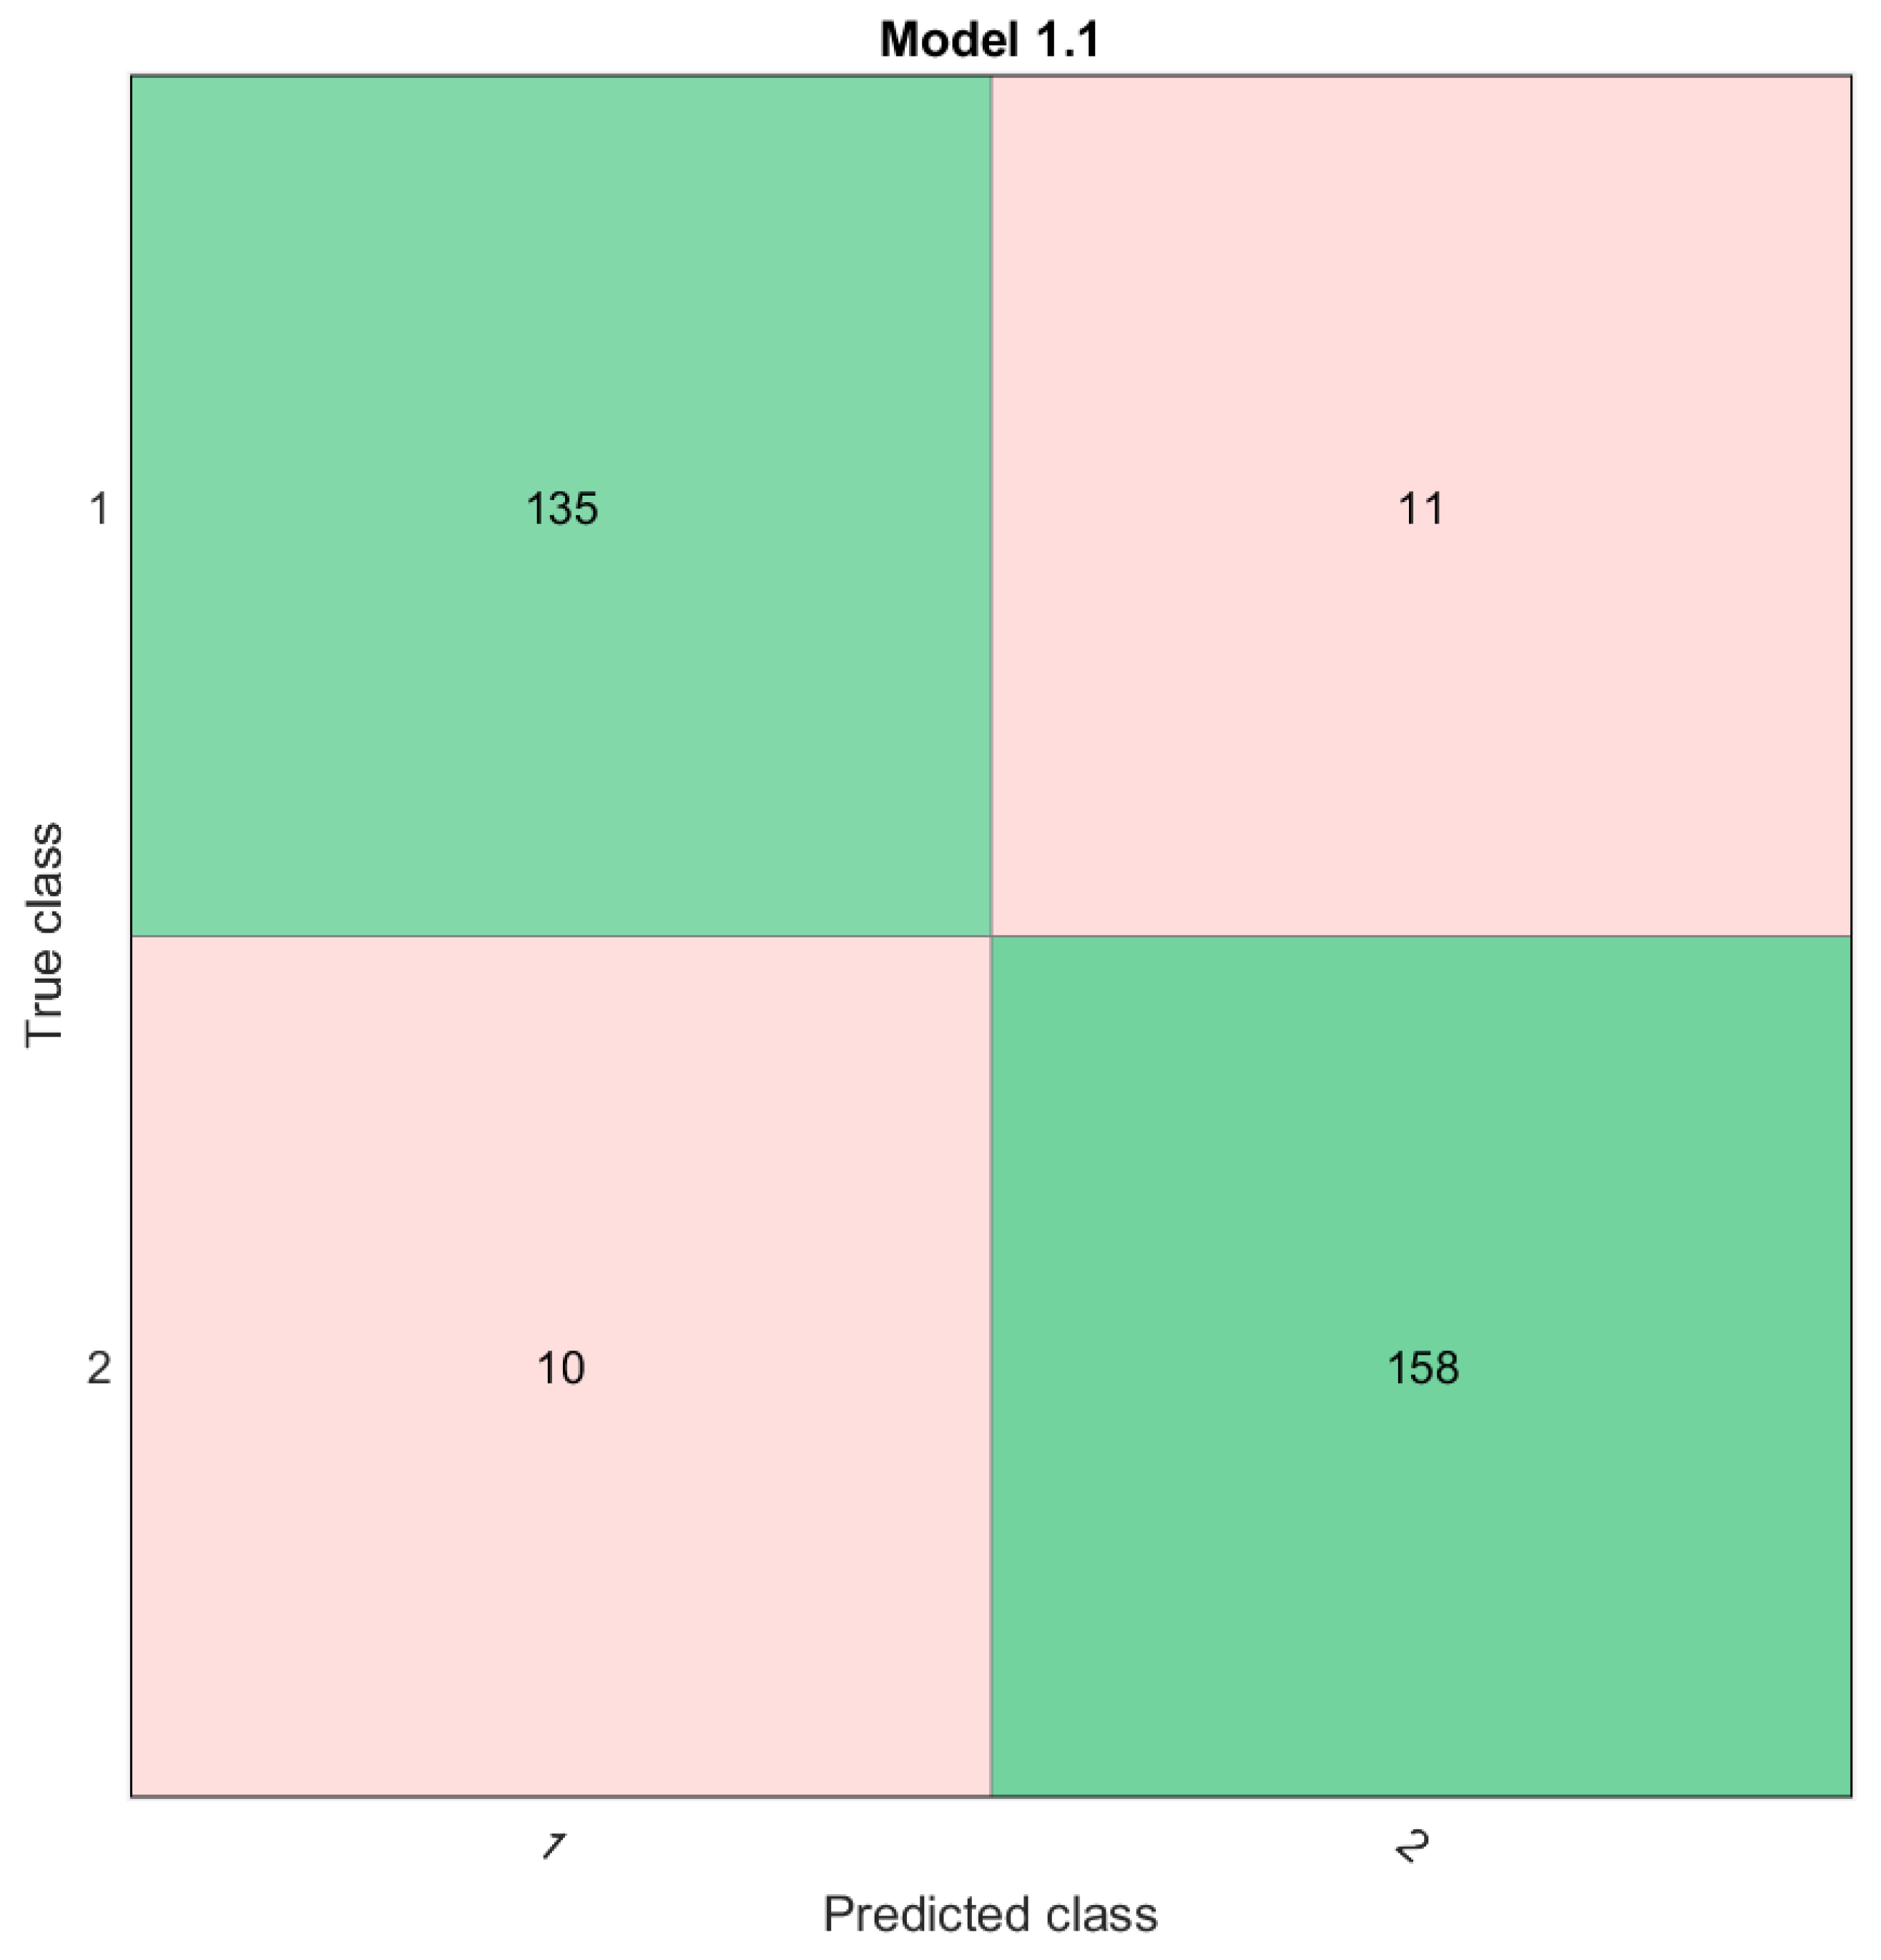
Classification was performed in the built-in tool available in MATLAB software called Classification Learner (CL). After loading the matrix described in the previous section into CL and selecting 5-fold cross-validation as the method for evaluating the accuracy of the classifier, training of the model with all the algorithms available in CL was started. Since the post-classification data were divided into two groups (type 1–3 and type 4,5), the two groups were reclassified separately. This made it possible to obtain graphs showing the relationships between features (scatter plots) for the form factor (column_10 of matrix) and peak factor (column_11 of matrix) for the first group of data (type 1–3), and for the second group (type 4,5), the best relationships were between kurtosis (column_4 of matrix) and peak factor, which are also shown in Figure 4 and Figure 5. ROC (Receiver Operating Characteristic) curves were also obtained, visually showing the accuracy of the model for the best classifier and confusion matrices, which are an assessment of the quality of classification (Figure 6, Figure 7, Figure 8 and Figure 9). For the first group of data, types 1–3, the best accuracy was shown by SVM (Support Vector Machines) and linear discriminant analysis, i.e., 99.5%. For the second group of data, packed decision trees were the best classifier, achieving an accuracy of 95.5%.
The obtained accuracy is one of the measures of the diagnostic value of the test. These measures can reach values (most commonly) from 0 to 1—the calculated value of the measure for a classifier is closer to one, the better the classifier is [21]. It was also decided to calculate sensitivity, specificity, precision and F1 score (a measure of the test’s accuracy) using another MATLAB script for the best algorithms (classifiers)—in an automated way, the measures were calculated depending on the variable values of k, being the number of k-fold cross-validation neighbors checked and the gamma parameter for linear discriminant analysis, the parameter determining the scale factor (KernelScale) for the support vector machine, and the parameter for the number of learning cycles (NumLearningCycles) for packed decision trees. The results are shown in Table 1, Table 2 and Table 3.
To simplify the analyses of the results in Table 1, Table 2 and Table 3, the average value was extracted from the obtained measurements. It can be seen that with the change of parameter values and k values of k-fold cross-validation, the average of many of them is close to one, which also means that the model has a high efficiency of data classification, so it is also possible to determine the type of defect in the power machine.

4. Conclusions

The purpose of the study was to classify ionizing radiation signals generated by partial discharges through the use of MATLAB software to classify measurement data and select the best machine learning method. The results were as follows:
  • the best classifiers for the first group of data turned out to be the linear discriminant analysis algorithm and the SVM support vector machine, for which the accuracy was more than 99%,
  • the best classifiers for the second group of data were packed decision trees, for which the accuracy was more than 95%,
  • it was possible to achieve high classification efficiency for both data sets, as shown by the values of the measures collected in the tables close to the value of 1.
It was concluded that classification of measurement data is possible, and that it is also possible to determine the defect of an electrical power machine. The next step of the work might be to create a database of defects for these machines by planning an experiment with known sources of defects.

Author Contributions

Conceptualization, A.P. and Ł.N.; Software, A.P.; Validation, Ł.N.; Formal analysis, A.P.; Resources, Ł.N.; Data curation, A.P.; Writing–original draft, A.P. and Ł.N.; Visualization, A.P.; Supervision, Ł.N.; Project administration, Ł.N.; Funding acquisition, Ł.N. All authors have read and agreed to the published version of the manuscript.

Funding

The work was co-financed from funds of the National Science Centre Poland (NCS) as part of the PRELUDIUM research project No. 2014/15/N/ST8/03680.

Conflicts of Interest

The authors declare no conflict of interest.

References

  1. Haenlein, M.; Kaplan, A. A Brief History of Artificial Intelligence: On the Past, Present, and Future of Artificial Intelligence. Calif. Manag. Rev. 2019, 61, 5–14. [Google Scholar] [CrossRef]
  2. Panch, T.; Szolovits, P.; Atun, R. Artificial Intelligence, Machine Learning and Health Systems. J. Glob. Health 2018, 8, 020303. [Google Scholar] [CrossRef] [PubMed]
  3. Haendel, M.A.; Chute, C.G.; Robinson, P.N. Classification, Ontology, and Precision Medicine. N. Engl. J. Med. 2018, 379, 1452–1462. [Google Scholar] [CrossRef] [PubMed]
  4. Krittanawong, C.; Johnson, K.W.; Rosenson, R.S.; Wang, Z.; Aydar, M.; Baber, U.; Min, J.K.; Wilson Tang, W.H.; Halperin, J.L.; Narayan, S.M. Deep Learning for Cardiovascularmedicine: A Practical Primer. Eur. Heart J. 2019, 40, 2058–2069C. [Google Scholar] [CrossRef] [PubMed]
  5. Ahmed, Z.; Mohamed, K.; Zeeshan, S.; Dong, X.Q. Artificial Intelligence with Multi-Functional Machine Learning Platform Development for Better Healthcare and Precision Medicine. Database 2020, 2020, baaa010. [Google Scholar] [CrossRef] [PubMed]
  6. Xie, J.; Li, Y.; Wang, N.; Xin, L.; Fang, Y.; Liu, J. Feature Selection and Syndrome Classification for Rheumatoid Arthritis Patients with Traditional Chinese Medicine Treatment. Eur. J. Integr. Med. 2020, 34, 101059. [Google Scholar] [CrossRef]
  7. Łysiak, A.; Froń, A.; Bączkowicz, D.; Szmajda, M. Vibroarthrographic Signal Spectral Features in 5-Class Knee Joint Classification. Sensors 2020, 20, 5015. [Google Scholar] [CrossRef] [PubMed]
  8. Battineni, G.; Chintalapudi, N.; Amenta, F. Machine Learning in Medicine: Performance Calculation of Dementia Prediction by Support Vector Machines (SVM). Inform. Med. Unlocked 2019, 16, 100200. [Google Scholar] [CrossRef]
  9. Fernandes, J.d.C.V.; de Moura Junior, N.N.; de Seixas, J.M. Deep Learning Models for Passive Sonar Signal Classification of Military Data. Remote Sens. 2022, 14, 2648. [Google Scholar] [CrossRef]
  10. Dästner, K.; Brunessaux, S.; Schmid, E.; von Haßler Zu Roseneckh-Köhler, B.; Opitz, F. Classification of Military Aircraft in Real-Time Radar Systems Based on Supervised Machine Learning with Labelled ADS-B Data. In 2018 Sensor Data Fusion: Trends, Solutions, Applications (SDF); IEEE: Pitcataway, NJ, USA, 2018. [Google Scholar] [CrossRef]
  11. Christantonis, K.; Tjortjis, C. Data Mining for Smart Cities: Predicting Electricity by Classification. In Proceedings of the 10th International Conference on Information, Intelligence, Systems and Applications (IISA), Patras, Greece, 15–17 July 2019. [Google Scholar] [CrossRef]
  12. Wotzka, D.; Cichoń, A. Study on the Influence of Measuring Ae Sensor Type on the Effectiveness of Oltc Defect Classification. Sensors 2020, 20, 3095. [Google Scholar] [CrossRef] [PubMed]
  13. Kunicki, M.; Wotzka, D. A Classification Method for Select Defects in Power Transformers Based on the Acoustic Signals. Sensors 2019, 19, 5212. [Google Scholar] [CrossRef] [PubMed] [Green Version]
  14. Wotzka, D.; Sikorski, W.; Szymczak, C. Investigating the Capability of PD-Type Recognition Based on UHF Signals Recorded with Different Antennas Using Supervised Machine Learning. Energies 2022, 15, 3167. [Google Scholar] [CrossRef]
  15. Jineeth, J.; Mallepally, R.; Sindhu, T.K. Classification of Partial Discharge Sources in XLPE Cables by Artificial Neural Networks and Support Vector Machine. In Proceedings of the 2018 IEEE Electrical Insulation Conference (EIC), San Antonio, TX, USA, 17–20 June 2018; pp. 407–411. [Google Scholar]
  16. Janani, H.; Shahabi, S.; Kordi, B. Separation and Classification of Concurrent Partial Discharge Signals Using Statistical-Based Feature Analysis. IEEE Trans. Dielectr. And. Electr. Insul. 2020, 27, 1933–1941. [Google Scholar] [CrossRef]
  17. Zheng, J.; Chen, Z.; Wang, Q.; Qiang, H.; Xu, W. GIS Partial Discharge Pattern Recognition Based on Time-Frequency Features and Improved Convolutional Neural Network. Energies 2022, 15, 7372. [Google Scholar] [CrossRef]
  18. Nagi, Ł.; Kozioł, M.; Kunicki, M.; Wotzka, D. Using a Scintillation Detector to Detect Partial Discharges. Sensors 2019, 19, 4936. [Google Scholar] [CrossRef] [PubMed]
  19. Nagi, Ł. Analysis of Ionizing Radiation Generated by Electrical Discharges. Ph.D. Thesis, Opole University of Technology, Opole, Poland, 2016. [Google Scholar]
  20. Geéron, A. Machine Learning: Using Scikit-Learn and TensorFlow; Helion: Gliwice, Poland, 2018; ISBN 9788328343740. [Google Scholar]
  21. Confusion Matrix and What It Results In. Available online: https://www.statystyczny.pl/author/admin/ (accessed on 1 July 2022).
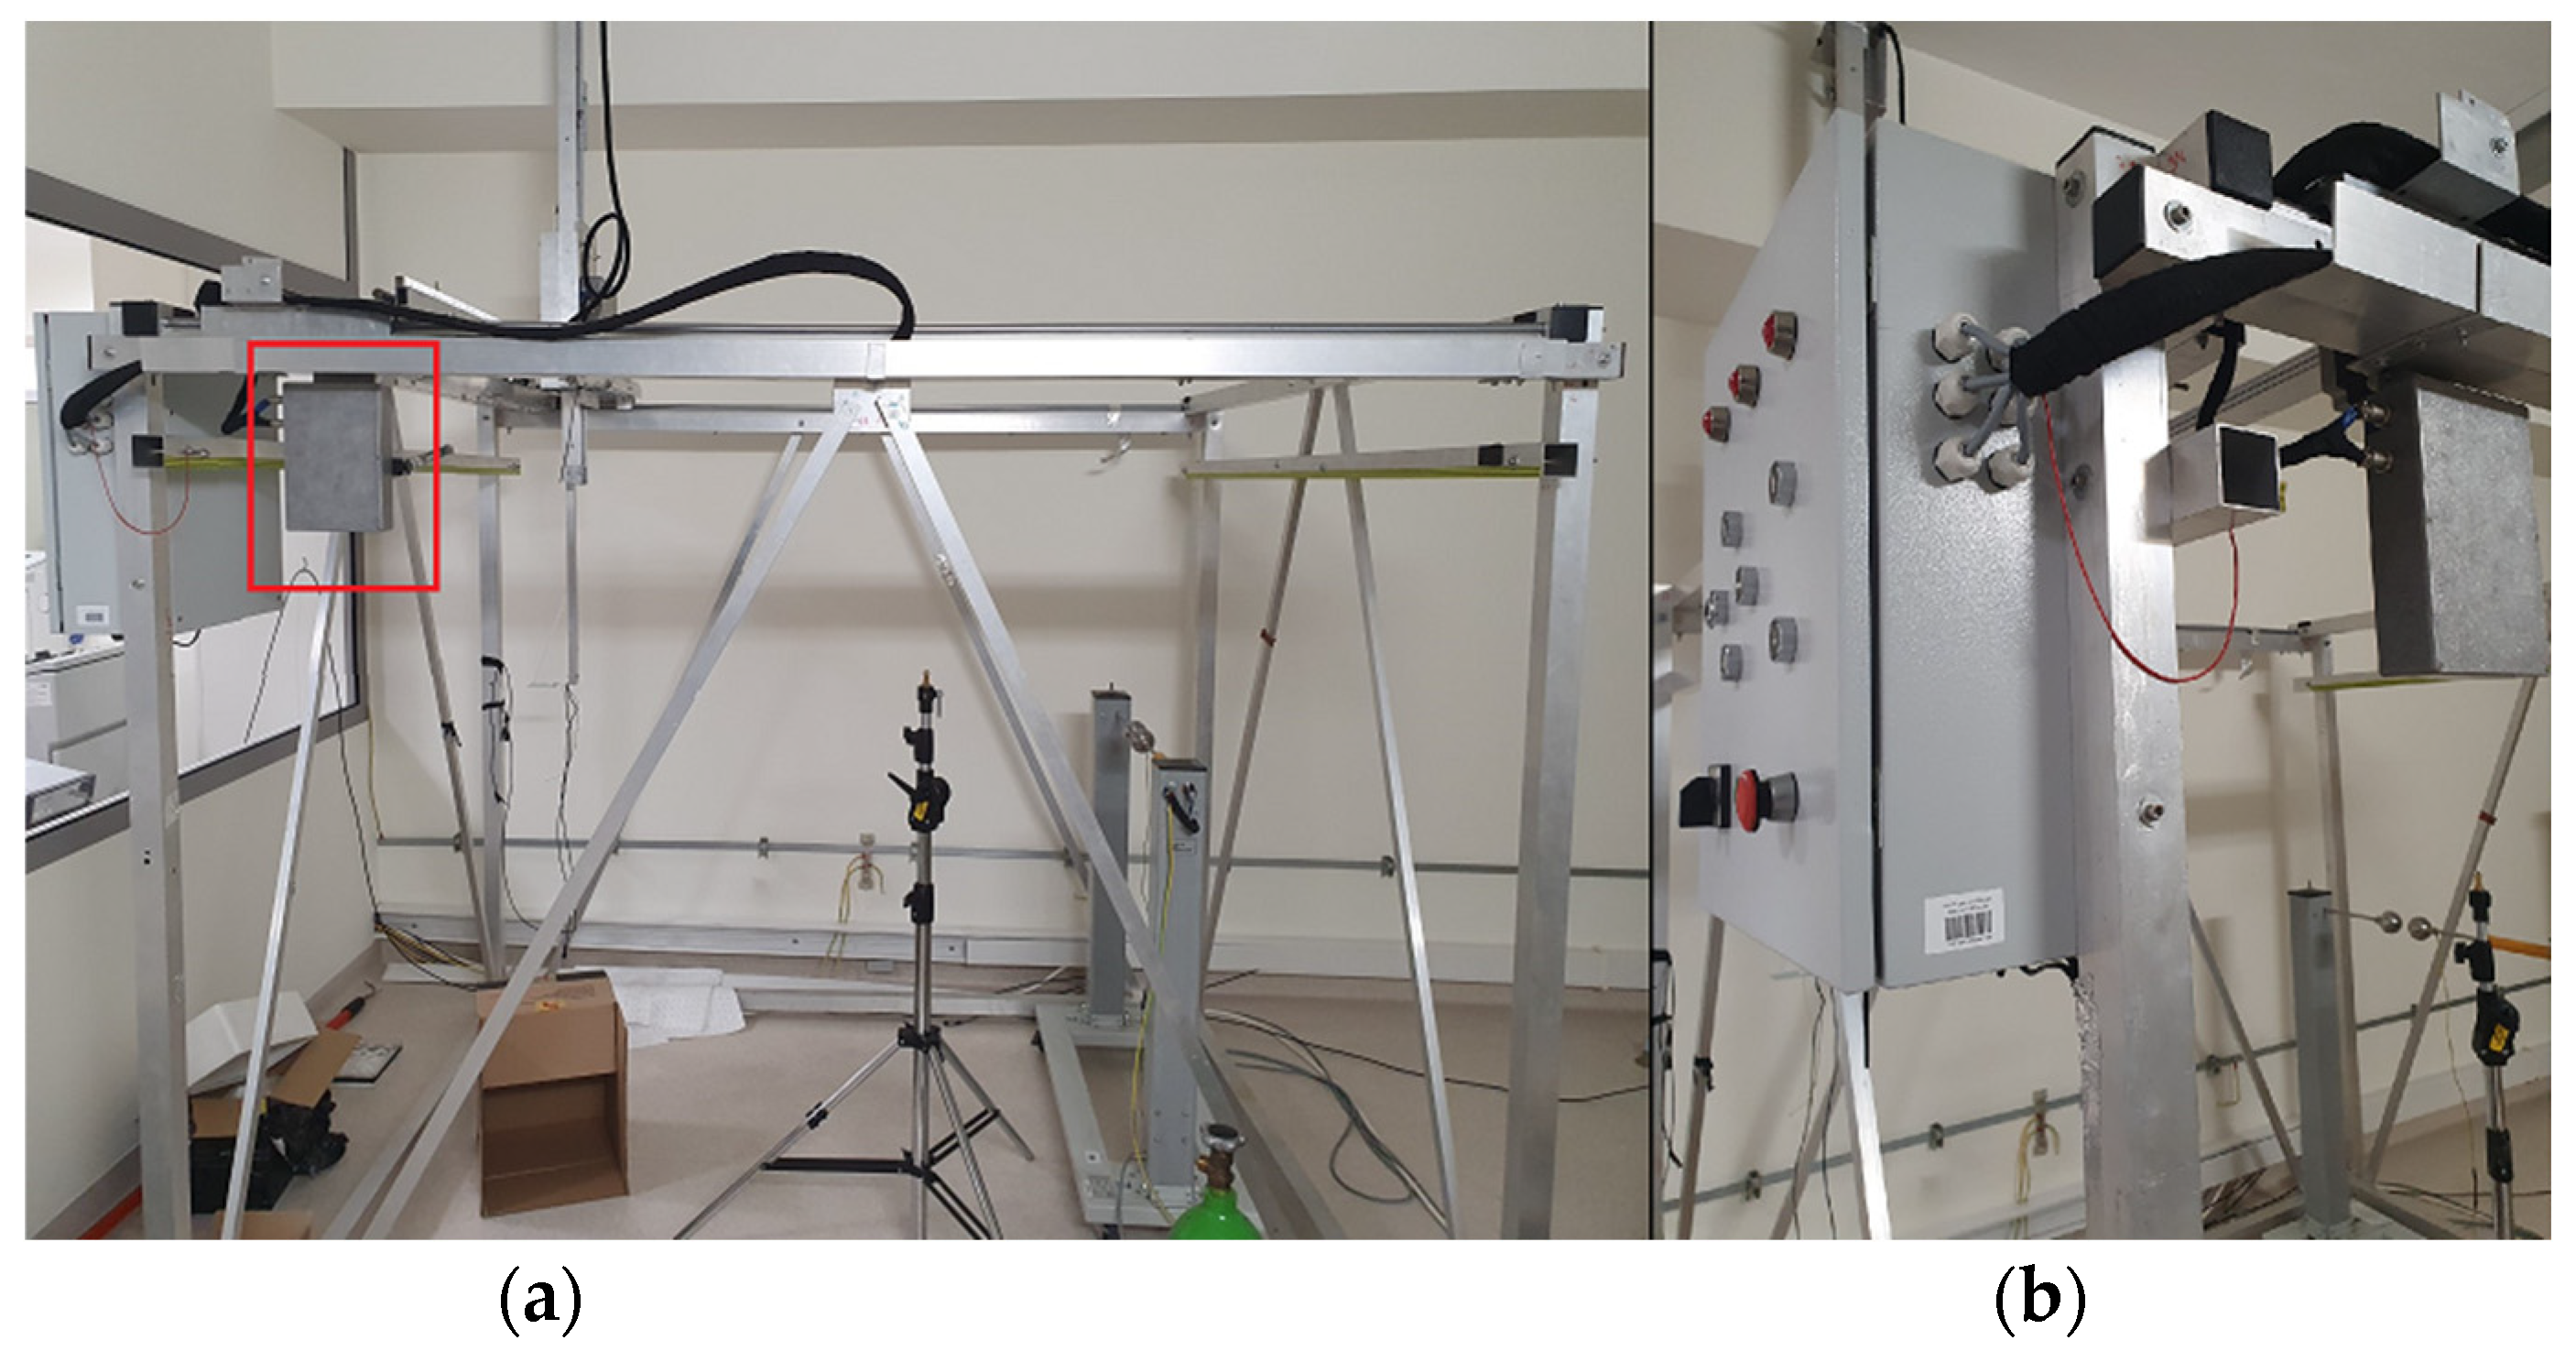
Figure 1. Measurement system: (a) construction (red marking—a box containing the data acquisition system and electronic components for powering the scintillation detector); (b) control panel.
Energies 16 00201 g001
Figure 2. Simplified block diagram of a fiber optic system for scintillator data acquisition.
Energies 16 00201 g002
Figure 3. Flowchart of data loading and feature creation.
Energies 16 00201 g003
Figure 4. Obtained scatter plot after training the model with new features (1st group of data; yellow—1st type, orange—2nd type, blue—3rd type; • as correct classification, × as misclassification).
Energies 16 00201 g004
Figure 5. Obtained scatter plot after training the model with new features (2nd group of data; orange—4th type, blue—5th type; • as correct classification, × as misclassification)).
Energies 16 00201 g005
Figure 6. ROC curve for the model (1st group of data).
Energies 16 00201 g006
Figure 7. Confusion matrix after model training (1st group of data; green—correct classification, red—misclassification).
Energies 16 00201 g007
Figure 8. ROC curve for the model (2nd group of data).
Energies 16 00201 g008
Figure 9. Confusion matrix after model training (2nd group of data; green—correct classification, red—misclassification).
Energies 16 00201 g009
Table 1. Results of calculating measures of diagnostic test value for linear discriminant analysis.
The Value of the Gamma ParameterThe k Value of Cross-ValidationSensitivitySpecificityPrecisionAccuracyF1-ScoreAverage
050.991.000.990.990.991.00
100.991.000.990.990.991.00
150.991.000.990.990.991.00
0.550.990.990.990.990.990.99
100.990.990.990.990.990.99
150.990.990.990.990.990.99
150.980.990.980.980.980.98
100.960.980.960.960.960.97
150.980.990.980.980.980.98
Table 2. Results of calculating diagnostic test value measures for SVM support vector machine.
The Value of the KernelScale ParameterThe k Value of Cross-ValidationSensitivitySpecificityPrecisionAccuracyF1-ScoreAverage
051.001.001.001.001.001.00
100.991.000.990.990.990.99
150.991.000.990.990.991.00
1050.960.980.960.960.960.96
100.960.980.960.960.960.97
150.960.980.960.960.960.97
1550.330.670.660.340.340.47
100.330.670.670.340.340.47
150.330.670.660.340.340.47
Table 3. Results of calculating measures of diagnostic test value for packed decision trees.
NumLearning
Cycles Parameter Value
The k Value of Cross-ValidationSensitivitySpecificityPrecisionAccuracyF1-ScoreAverage
3050.900.980.980.950.940.95
100.900.980.970.940.940.95
150.900.990.990.950.940.96
5050.900.990.980.950.940.95
100.900.990.990.950.940.96
150.890.990.990.950.940.95
10050.890.990.990.950.940.95
100.900.990.980.950.940.95
150.890.990.980.940.940.95
Disclaimer/Publisher’s Note: The statements, opinions and data contained in all publications are solely those of the individual author(s) and contributor(s) and not of MDPI and/or the editor(s). MDPI and/or the editor(s) disclaim responsibility for any injury to people or property resulting from any ideas, methods, instructions or products referred to in the content.