Abstract
Cellulose particles are among the aging products of the insulating paper that are used in power transformers. Too many cellulose particles can cause transformer accidents. Traditional research and detection methods that are used for this problem generally focus on the number and length information of cellulose particles, and it is usually difficult to quantitatively describe the spatial shape of cellulose particles. However, the shape of cellulose particles is also one of the factors affecting the safety of transformer insulation. In this paper, we successfully extracted quantitative information of the spatial shape of cellulose particles in transformer oil using an image processing technique and the transport of intensity equation, providing a new novel approach for the study and detection of the shape of cellulose particles in transformer oil.
1. Introduction
The power transformer is one of the most important components of the power system. Power transformers can be used to determine the security and reliability of the power system, and about one-third of power transformer accidents are caused by insulation [1,2]. The insulation protection of power transformers is mainly composed of insulating paper and power transformer oil. At present, the power transformer insulation condition is monitored using various diagnostic techniques. Field and laboratory experiences have shown that power transformer oil contains about 70% diagnostic information; therefore, physicochemical analyses of oil samples can be extremely useful in monitoring the condition of power transformers [3].
Cellulose particles are among the aging products of insulating paper in power transformers. The operation of power transformers is affected by factors such as temperature, moisture, oxygen, and acidity, whereby the cellulose in the insulated paper will inevitably degrade, resulting in a short cellulose molecule chain, a lower degree of polymerization, and the production of cellulose particles. These cellulose particles tend to be suspended in transformer oil. According to previous reports, cellulose particles account for about 90% of all impurity particles in transformer oil [4]. These cellulose particles can not only lead to a decrease in the quality and performance of the power transformer, but excessive cellulose particles can also accumulate under the action of the electric field to form a bridge, resulting in a lower resistivity of the transformer oil, thus initiating discharge and insulation breakdown [1,2,4,5]. Therefore, the detection of cellulose particles in transformer oil is very necessary.
By detecting and studying cellulose particles in transformer oil, it is possible to identify insulation problems in power transformers over time. In the traditional method of particle detection in transformer oil, the inspector usually uses a particle counter to detect the particles in the transformer oil and obtain information about the number and length of particles in the oil. However, this method does not provide information on the actual shape of the particles in the transformer oil and does not identify the type of particles. The shape of the cellulose particles is also a factor influencing the insulation of the transformer [3,6,7]. The transport of intensity equation (TIE) can extract the quantitative phase of cellulose particles; combined with image processing technology, the length, width, area, height, and volume of the cellulose particles can be obtained to gain further insight into the shape of cellulose particles.
TIE is a noninterference detection method with the advantages of a simple structure and easy operation. At present, with the development of TIE, this method has been widely used in optical measurement, X-ray imaging, biological science, and medicine [8,9,10,11]. Traditional methods of testing transformer oil usually require testing in the laboratory, which not only increases the time and economic costs, but may also lead to changes in the quality of transformer oil samples during transportation, thus affecting the accuracy of the test results. If the transformer oil can be tested on site, possible insulation problems in the transformer can be detected in real-time. In a recent study by Meng et al., phase retrieval of target objects was achieved by modifying the imaging system of a smartphone instead of a microscope [12,13], thereby decreasing the equipment cost of TIE and reducing the size of the equipment. In addition, TIE can achieve real-time detection of samples via the simultaneous recording of two cameras [14,15,16]. The method that is described above provides a boost in the potential application of TIE for the field detection of cellulose particles in transformer oil.
2. Causes of Insulating Paper Aging
The insulating paper in a power transformer is composed of approximately 90% cellulose, 6–7% hemicellulose, and 3–4% lignin. Cellulose is a linear polymer of glucose molecules that are linked together by glycosidic bonds; its structure is shown in Figure 1. The monomer unit is linearly combined in the insulating paper, and the number of monomer units in the polymer is referred to as the degree of polymerization (DP) [3,17].
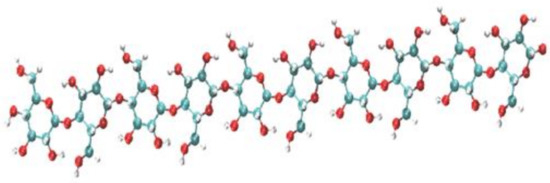
Figure 1.
Cellulose molecular structure. Red: oxygen atoms; white: hydrogen atoms; blue: carbon atoms.
During power transformer operation, the insulating paper is inevitably degraded under the action of temperature, moisture, oxygen, acidity, and other factors [18,19,20,21,22,23,24]. When the insulating paper is degraded, on the one hand, the hydrogen bonds tend to decompose, causing a shorter cellulose molecule chain and a decrease in polymerization, which produces cellulose particles that become suspended in transformer oil. On the other hand, the aging of the insulating paper leads to the production of CO, CO2, methanol, furan compounds, etc. [25].
At present, the most accurate characterization method of insulation paper is direct detection (viscometric method). Direct analysis of paper insulation is an invasive process, which requires removing the power transformer from service; thus, this method is unrealistic. Most products resulting from the aging of insulating paper are dissolved in transformers. Therefore, the degree of aging of insulating paper is most commonly detected indirectly using transformer oil [3,17], as shown in Table 1.

Table 1.
Comparison of detection methods [3,17,25].
3. Transport of Intensity Equation
In 1983, Teague proposed the transport of intensity equation (TIE) for the first time. This equation is a noninterference quantitative phase measurement method, which can be used to describe the relationship between the light intensity axial gradient of the diffractive wave propagation direction and the vertical axial direction of the vertical axis direction [26].
3.1. Equation Solving Process
From a mathematical perspective, TIE is a second-order elliptical partial differential equation. From an optical perspective, TIE represents the relationship between the change amount of the light intensity in the optical axis direction and the phase of the optical wave on the plane perpendicular to the optical axis [26,27,28,29,30]:
where is the intensity of light, is the lateral gradient operator (), k is the wave number (), is the wavelength of the optical wave, represents the phase distribution of objects (cellulose particles), and z represents the direction of transmission.
The auxiliary function can be expressed as:
is a scatter term and is a spin term.
When there is no significant vortex in the phase, can be neglected [26].
From Equation (2) and Equation (1), we can obtain:
The time-domain differential properties that are based on Fourier transform can be expressed as:
where and express the spatial frequency, and describe the spectral coordinate, and and represent the fast Fourier transform and inverse fast Fourier transform, respectively.
Substituting Equation (3) into Equation (4) yields:
Substituting Equation (2) into Equation (4) yields:
In order to facilitate calculation and operation, is typically approximated using under-focused and over-focused images, as expressed in Equation (7).
3.2. Getting the Height Information of Cellulose Particles
In order to restore the three-dimensional space information of cellulose particles, the height information of cellulose particles must be obtained. The height distribution of cellulose particles can be obtained from the phase distribution as a function of the refractive index of the medium and cellulose particles, as expressed in Equation (8):
where is the refractive index of air, simply approximated to 1, and is the refractive index of cellulose. The aging degradation of cellulose fibers in insulation paper is accompanied by a change in the refractive index and a change in the dispersion color [22,31–33]. According to [33], in different cases, the refractive index of cellulose can vary. The refractive index of nonaged cellulose particles is approximately 1.59, increasing to approximately 1.62 to 1.64 during aging. In this work, we used fresh insulating paper and transformer oil to produce cellulose emulsions; thus, .
4. Experiment
4.1. Experimental Setup and Samples
Transformer oil samples (State Grid Shaanxi Electric Power Research Institute, Xi’an, China) were stored in the dark. Insulating paper (Shanghai East China Composite Insulation Filter Screen Factory, Shanghai, China) was maintained in a dry environment. The OLYMPUS-BX53 microscope (10×, 40× micro-objective, Olympus Company, Tokyo, Japan) was used for optical microscopy. The TUCSENTCH-5.0 (3.4 × 3.4 , Tucsen, Fuzhou, China) was used for CCD. The experimental setup is shown in Figure 2.
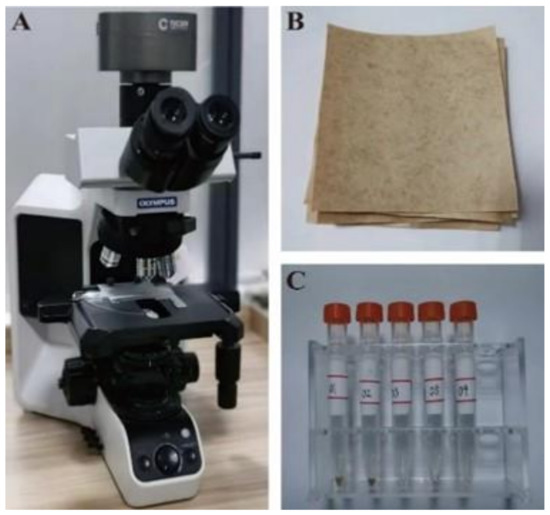
Figure 2.
Experimental setup: (A) microscope; (B) insulating paper; (C) transformer oil samples.
4.2. Experimental Process
The detailed experimental process is shown in Figure 3. First, the insulating paper and transformer oil were used to produce cellulose emulsions. Then, the cellulose emulsions were observed on the microscope stage. TIE requires the use of monochromatic light, but the light source that was used for the microscope was a halogen lamp. Therefore, a narrowband filter with a central wavelength of 532 nm and a full width at half maximum (FWHM) of 10 nm was used to separate monochromatic light from the light source with complex wavelengths. Next, the oil samples were observed through the microscope, and three images of different focus lengths were recorded by the CCD (under-focused image, over-focused image, and in-focus image; ∇z = 1 ). Finally, the identification, localization and TIE derivation were performed on the cellulose particles in the images to obtain information such as the number, length, width, height, area, and volume of the cellulose particles in the transformer oil.
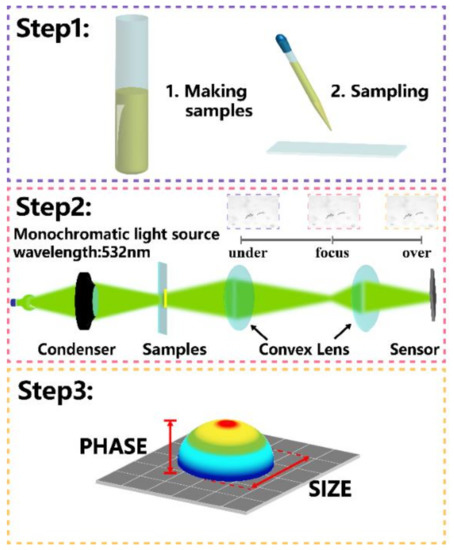
Figure 3.
Experimental process. Step 1: Marking of samples and sampling. Step 2: Observation and collection of images. Step 3: Phase recovery.
5. Results and Discussion
A total of five samples were prepared for this experiment. The cellulose particles in the figure are identified and located by recognition and image processing techniques, as shown in Figure 4b,f. The quantitative phase of cellulose particles was extracted using the TIE, which in turn restored the true shape of the cellulose particles, as shown in Figure 4. Combining Equation (8) and image processing, the information such as the number, length, width, area, and volume of cellulose particles in each oil sample was successfully obtained.
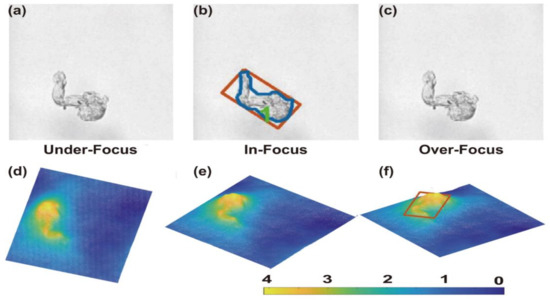
Figure 4.
Image and phase distributions of cellulose particles: (a–c) images of cellulose particles at different focus lengths; (b,f) identification and localization of cellulose particles in the oil; (d–f) phase distribution from different angles.
It is known that the phase values of the random phase plate are approximately 0 to π. Figure 5a–c represent three images of random phase plates with different focal lengths; Figure 5d–f represent the phase distributions. Different depth colors in the phase figure represent different phase values. As can be seen in Figure 5, the reliability of the method for restoring the shape of the object performs well.
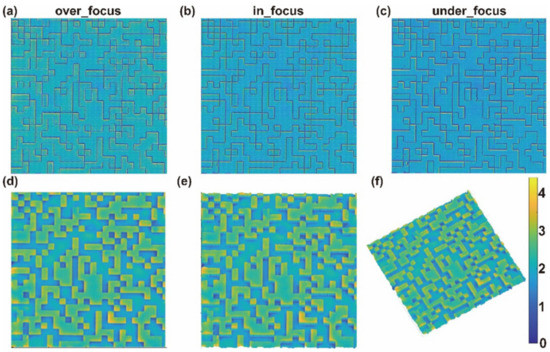
Figure 5.
Images and phase distributions of random phase plates. (a–c) represent the images of random phase plates with different focal lengths; (d–c) the phase distribution of random phase plates at different angles.
In order to better reflect the morphological information of the cellulose particles and prove the feasibility of the method, the length, width, area, and volume data of the cellulose particles were selected for statistical analysis. Among the 270 cellulose particles that were observed, the maximum and minimum lengths were 194.92 and 0.82 μm, the maximum and minimum widths were 66.64 and 0.53 μm, the maximum and minimum areas were 3048.60 and 0.47 μm2, and the maximum and minimum volumes were 7489.44 and 8.51 × 10⁻² μm3. Currently, in the detection of cellulose particles, it is often necessary to be able to measure particles with diameters that are less than or equal to 5 μm. Therefore, the proposed method can meet the requirements for the detection of cellulose particles.
The conventional particle degree detection method provides the diameter range of the particles, but the volume of the particles is not specified. Therefore, this paper divided the cellulose particle length data according to the NAS 1638 standard into six segments: <5, 5–15, 15–25, 25–50, 50–100, and >100 μm. Then, the volume data were divided into six large segments and 10 small segments according to a similar method. The statistical results are shown in Table 2 and Table 3. The experimental results show that the method could detect cellulose particles with lengths of 5 μm and below, thus meeting the requirements for conventional particle detection and the NAS 1638 standard. Furthermore, it is indicated that the volume of cellulose particles had a greater range of variation and the levels could be divided more carefully. In summary, combining length and volume information can be used to more accurately reflect the size of cellulose particles in oil.
Table 2.
Length classification statistics.
Table 3.
Volume classification statistics.
Figure 6 shows the length, width, area, and volume data of cellulose particles in the five sets of oil samples. Through an analysis of these data, we can better reflect the details of cellulose particles in transformer oil and identify those with abnormal morphology in transformer oil. For example, when the width and length of cellulose particles are similar, the plane shape of the cellulose particles is close to circular. When the length and width of the cellulose particles are large, but the area is small, the shape of the cellulose particles in a two-dimensional plane is thin and curved. When the area of the cellulose particles is small, but the volume is large, the height of the cellulose particles needs to be considered.
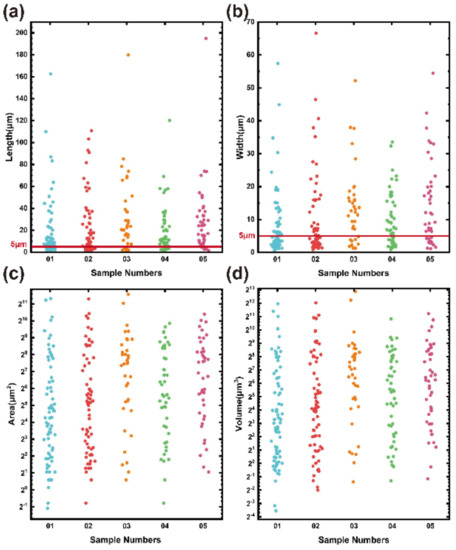
Figure 6.
Length, width, area, and volume of cellulose particles: (a) length of cellulose particles; (b) width of cellulose particles; (c) area of cellulose particles; (d) volume of cellulose particles.
As can be seen from the red line in Figure 7, the length and volume of the cellulose particles had a proportional relationship; generally, the length increased with volume, but the volume information of cellulose particles could not be represented by the length information of the cellulose particles. From the yellow dashed line in Figure 7, it can be seen that the volume of cellulose particles with similar lengths often differed greatly.
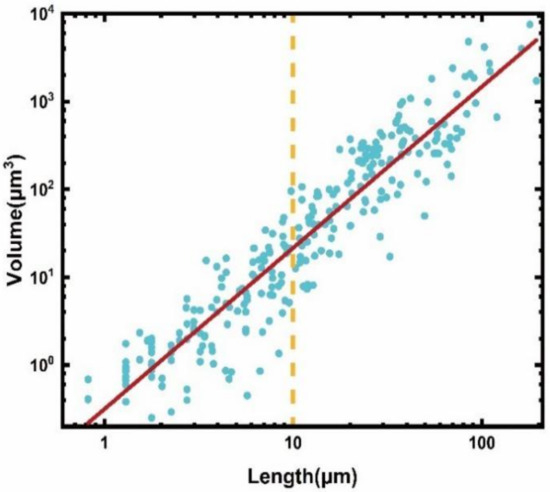
Figure 7.
The length and volume relationship.
Due to the irregular shape of cellulose particles, it is difficult to accurately reflect the complete morphological information of cellulose particles in transformer oil as a function of the number and length of cellulose particles. The shape of the cellulose particles is also a factor influencing the insulation of the transformer. A quantitative analysis of the spatial morphology of cellulose particles in transformer oil allows a more accurate assessment of the actual condition of cellulose particles in power transformers. In addition, it provides a low-cost approach to research the influence of different shapes of cellulose particles on the insulation of transformer oil and to study the differences in the shape variation of cellulose particles under the effect of different factors (such as high temperature, moisture, and abrasion, etc.).
6. Conclusions
In this work, we successfully extracted the quantitative phase of cellulose particles using the TIE; restored the three-dimensional shape of cellulose particles; and further calculated the information on the number, length, width, area, and volume of cellulose particles in transformer oil. It was shown using a large amount of experimental data that the proposed method could detect cellulose particles with lengths below 5 , thus meeting the functional requirements of conventional detection methods. In addition, this method can not only quantitatively describe the spatial morphology of cellulose particles and provide richer shape information, but it also does not require expensive equipment and complicated operation, providing a novel approach for the study and detection of cellulose particles in transformer oil.
Author Contributions
Conceptualization, H.P. and L.X. (Liang Xue); methodology, L.X. (Liang Xue) and C.Y.; software, H.P. and L.X. (Liang Xue); validation, H.P.; formal analysis, H.P.; investigation, H.P., C.Y., and L.X. (Liang Xue); resources, H.P. and Y.J.; data curation, H.P.; writing—original draft preparation, H.P., C.Y., and L.X. (Liang Xue); writing—review and editing, L.X. (Liang Xue), F.C., and Y.J.; visualization, Y.L. and L.X. (Lei Xin); supervision, H.Z., Y.L., and L.X. (Lei Xin); project administration, H.Z., L.X. (Liang Xue), and C.Y.; funding acquisition, L.X. (Liang Xue) and C.Y. All authors have read and agreed to the published version of the manuscript.
Funding
This work was supported by the National Natural Science Foundation of China (62105196), the Shanghai Sailing Program (17YF1407000), and the Shaanxi Grid (5226KY20001D).
Institutional Review Board Statement
Not applicable.
Informed Consent Statement
Not applicable.
Data Availability Statement
Not applicable.
Acknowledgments
Thanks to Shouyu Wang of Jiangnan University for providing the images of the random phase plate.
Conflicts of Interest
The authors declare no conflict of interest.
References
- Mahmud, S.; Chen, G.; Golosnoy, I.O.; Wilson, G.; Jarman, P. Bridging Phenomenon in Contaminated Transformer Oil. In Proceedings of the IEEE International Conference on Condition Monitoring and Diagnosis (CMD), Bali, Indonesia, 23–27 September 2012; pp. 180–183. [Google Scholar]
- Mahmud, S.; Chen, G.; Golosnoy, I.O.; Wilson, G.; Jarman, P. Bridging in Contaminated Transformer Oil under AC, DC and DC Biased AC Electric Field”. In Proceedings of the Conference on Electrical Insulation and Dielectric Phenomena Annual Report, Chenzhen, China, 20–23 October 2013; pp. 943–946. [Google Scholar]
- N’Cho, J.S.; Fofana, I.; Hadjadj, Y.; Beroual, A. Review of Physicochemical-Based Diagnostic Techniques for Assessing Insulation Condition in Aged Transformers. Energies 2016, 9, 367. [Google Scholar] [CrossRef]
- Guo, R.; Wang, Z.; He, C.; Zhang, X.; Meng, X.; Li, J.; Han, X.; Yao, X. Breakdown Characteristics of Transformer Oil with Cellulose Particles in a Non-uniform Field under Lightning Impulse Voltage. In IEEE Transactions on Dielectrics and Electrical Insulation; IEEE: New York, NY, USA, 2020; Volume 27, pp. 1627–1635. [Google Scholar]
- Zhao, T.; Liu, Y.P.; Lv, F.C.; Geng, J.H.; Wang, P. Study of Cellulose Particle Motion Effect on Impulse Breakdown in Transformer Oil. In IEEE Transactions on Dielectrics and Electrical Insulation; IEEE: New York, NY, USA, 2018; Volume 25, pp. 235–244. [Google Scholar]
- CIGRE Technical Brochure 157. Effect ofParticles on Transformer Dielectric Strength. In Final Report of CIGRESC 12 WG 17 (Particles in Oil); CIGRE: Paris, France, 2000. [Google Scholar]
- CIGRE Working Group A2. 34. Guide for Transformer Maintenance CIGRE Report; CIGRE: Paris, France, 2011; ISBN 978-2-85873-134-3. [Google Scholar]
- Cacace, T.; Bianco, V.; Ferraro, P. Quantitative phase imaging trends in biomedical applications. Opt. Lasers Eng. 2020, 135, 106188. [Google Scholar] [CrossRef]
- Dorrer, C.; Zuegel, J.D. Optical testing using the transport-of-intensity equation. Opt. Express 2007, 15, 7165–7175. [Google Scholar] [CrossRef] [PubMed]
- Li, Y.; Di, J.L.; Ma, C.J.; Zhang, J.W.; Zhong, J.Z.; Wang, K.Q.; Xi, T.L.; Zhao, J.L. Quantitative phase microscopy for cellular dynamics based on transport of intensity equation. Opt. Express 2018, 26, 586–593. [Google Scholar] [CrossRef] [PubMed]
- Tian, L.; Petruccelli, J.C.; Miao, Q.; Kudrolli, H.; Nagarkar, V.; Barbastathis, G. Compressive x-ray phase tomography based on the transport of intensity equation. Opt. Lett. 2013, 38, 3418–3421. [Google Scholar] [CrossRef] [PubMed]
- Meng, X.; Huang, H.C.; Yan, K.D.; Tian, X.L.; Yu, W.; Cui, H.Y.; Kong, Y.; Xue, L.; Liu, C.; Wang, S.Y. Smartphone based hand-held quantitative phase microscope using the transport of intensity equation method. Lab A Chip 2017, 17, 104–109. [Google Scholar] [CrossRef] [PubMed]
- Yang, Z.Y.; Zhan, Q.W. Single-Shot Smartphone-Based Quantitative Phase Imaging Using a Distorted Grating. PLoS ONE 2016, 11, e0159596. [Google Scholar] [CrossRef] [PubMed]
- Chen, C.; Lu, Y.-N.; Huang, H.; Yan, K.; Jiang, Z.; He, X.; Kong, Y.; Liu, C.; Liu, F.; Xue, L.; et al. PhaseRMiC: Phase real-time microscope camera for live cell imaging. Biomed. Opt. Express 2021, 12, 5261–5271. [Google Scholar] [CrossRef] [PubMed]
- Shan, Y.K.; Gong, Q.T.; Wang, J.; Xu, J.; Wei, Q.; Liu, C.; Xue, L.; Wang, S.Y.; Liu, F. Measurements on ATP induced cellular fluctuations using real-time dual view transport of intensity phase microscopy. Biomed. Opt. Express 2019, 10, 2337–2354. [Google Scholar] [CrossRef] [PubMed]
- Tian, X.; Yu, W.; Meng, X.; Sun, A.; Xue, L.; Liu, C.; Wang, S. Real-time quantitative phase imaging based on transport of intensity equation with dual simultaneously recorded field of view. Opt. Lett. 2016, 41, 1427–1430. [Google Scholar] [CrossRef] [PubMed]
- Bakar, N.A.; Abu-Siada, A.; Islam, S. A Review on Chemical Diagnosis Techniques for Transformer Paper Insulation Degradation. In Proceedings of the Australasian Universities Power Engineering Conference, Hobart, TAS, Australia, 29 September–3 October 2013. [Google Scholar]
- Garcia, D.F.; Garcia, B.; Burgos, J.C. A Review of Moisture Diffusion Coefficients in Transformer Solid Insulation-Part 1: Coefficients for Paper and Pressboard. In IEEE Electrical Insulation Magazine; IEEE: New York, NY, USA, 2013; Volume 29, pp. 46–54. [Google Scholar]
- Jusner, P.; Schwaiger, E.; Potthast, A.; Rosenau, T. Thermal stability of cellulose insulation in electrical power transformers—A review. Carbohydr. Polym. 2021, 252, 117196. [Google Scholar] [CrossRef] [PubMed]
- Lelekakis, N.; Martin, D.; Wijaya, J. Ageing Rate of Paper Insulation used in Power Transformers Part 2: Oil/paper System with Medium and High Oxygen Concentration. In IEEE Transactions on Dielectrics and Electrical Insulation; IEEE: New York, NY, USA, 2012; Volume 19, pp. 2009–2018. [Google Scholar]
- Lelekakis, N.; Wijaya, J.; Martin, D.; Susa, D. The Effect of Acid Accumulation in Power-Transformer Oil on the Aging Rate of Paper Insulation. In IEEE Electrical Insulation Magazine; IEEE: New York, NY, USA, 2014; Volume 30, pp. 19–26. [Google Scholar]
- Li, J.; Zhang, J.; Wang, F.; Huang, Z.; Zhou, Q. A Novel Aging Indicator of Transformer Paper Insulation Based on Dispersion Staining Colors of Cellulose Fibers in Oil. In IEEE Electrical Insulation Magazine; IEEE: New York, NY, USA, 2018; Volume 34, pp. 8–16. [Google Scholar]
- Liao, R.; Lin, Y.; Guo, P.; Liu, H.; Xia, H. Thermal Aging Effects on the Moisture Equilibrium Curves of Mineral and Mixed Oil-paper Insulation Systems. In IEEE Transactions on Dielectrics and Electrical Insulation; IEEE: New York, NY, USA, 2015; Volume 22, pp. 842–850. [Google Scholar]
- Tee, S.J.; Liu, Q.; Wang, Z.D.; Wilson, G.; Jarman, P.; Hooton, R.; Walker, D.; Dyer, P. Seasonal Influence on Moisture Interpretation for Transformer Aging Assessment. In IEEE Electrical Insulation Magazine; IEEE: New York, NY, USA, 2016; Volume 32, pp. 29–37. [Google Scholar]
- Saha, T.K. Review of modern diagnostic techniques for assessing insulation condition in aged transformers. In IEEE Transactions on Dielectrics and Electrical Insulation; IEEE: New York, NY, USA, 2003; Volume 10, pp. 903–917. [Google Scholar]
- Teague, M.R. Deterministic Phase Retrieval: A Green’s Function Solution. J. Opt. Soc. Am. 1983, 73, 1434–1441. [Google Scholar] [CrossRef]
- Zuo, C.; Li, J.; Sun, J.; Fan, Y.; Zhang, J.; Lu, L.; Zhang, R.; Wang, B.; Huang, L.; Chen, Q. Transport of intensity equation: A tutorial. Opt. Lasers Eng. 2020, 135, 106187. [Google Scholar] [CrossRef]
- Waller, L.; Tian, L.; Barbastathis, G. Transport of Intensity phase-amplitude imaging with higher order intensity derivatives. Opt. Express 2010, 18, 12552–12560. [Google Scholar] [CrossRef] [PubMed]
- Ichikawa, K.; Lohmann, A.W.; Takeda, M. Phase retrieval based on the irradiance transport equation and the Fourier transform method: Experiments. Appl. Opt. 1988, 27, 3433–3436. [Google Scholar] [CrossRef] [PubMed]
- Allen, L.J.; Oxley, M.P. Phase retrieval from series of images obtained by defocus variation. Opt. Commun. 2001, 199, 65–75. [Google Scholar] [CrossRef]
- Peng, L.; Fu, Q.; Zhao, Y.; Qian, Y.; Chen, T.; Fan, S. A Non-Destructive Optical Method for the DP Measurement of Paper Insulation Based on the Free Fibers in Transformer Oil. Energies 2018, 11, 716. [Google Scholar] [CrossRef]
- Yoshida, M.; Uchida, K.; Kato, M.; Konishi, Y. New Diagnosis Method of Aging Degradation for Insulating Paper in Power Transformers by Measuring the Refractive Index of Cellulose Fibers. In Proceedings of the 2012 IEEE International Conference on Condition Monitoring and Diagnosis, Bali, Indonesia, 23–27 September 2012; IEEE: New York, NY, USA, 2012; pp. 56–59. [Google Scholar]
- Yao, W.; Yao, D.; Wang, F.; Song, C.; Pang, K.; Xiong, H. Thermal Ageing Behavior of Oil-paper Insulation and Evolution of Fiber Refractive Index. Insul. Mater. 2021, 54, 81–87. [Google Scholar]
Publisher’s Note: MDPI stays neutral with regard to jurisdictional claims in published maps and institutional affiliations. |
© 2022 by the authors. Licensee MDPI, Basel, Switzerland. This article is an open access article distributed under the terms and conditions of the Creative Commons Attribution (CC BY) license (https://creativecommons.org/licenses/by/4.0/).