Article

Influence of a Cooling System on Power MOSFETs’ Thermal Parameters

by
Krzysztof Górecki
* and
Krzysztof Posobkiewicz
Department of Marine Electronics, Faculty of Electrical Engineering, Gdynia Maritime University, 81-225 Gdynia, Poland
*
Author to whom correspondence should be addressed.
Energies 2022, 15(8), 2923; https://doi.org/10.3390/en15082923
Submission received: 1 March 2022 / Revised: 21 March 2022 / Accepted: 13 April 2022 / Published: 15 April 2022
(This article belongs to the Collection Feature Papers in Thermal Management)

Abstract

:
In the current paper, an analysis of the influence of cooling system selection on the thermal parameters of two thermally coupled power MOSFETs is presented. The required measurements of the thermal parameters were performed using the indirect electrical method at different values of power dissipated in the investigated transistors and various supply conditions for the active parts of their cooling systems. The results of the investigations are analysed and discussed. Functions modelling the observed dependences of thermal parameters of the investigated MOSFETs on the power that was dissipated in them as well as the supply conditions of the active parts of their cooling systems are proposed. A good agreement between the results of the measurements and the computations was obtained. It is shown that the use of active cooling systems makes it possible to reduce the value of the thermal resistance of the tested transistor up to 20 times. In each of the tested systems, the self- and transfer-thermal resistances decreased with an increase in the dissipated power and the rotational speed of the fan.

1. Introduction

Power MOS (Metal-Oxide Semiconductor) transistors are power semiconductor devices that are commonly used in electronics and power electronics [1,2,3]. The characteristics of these devices strongly depend on their internal temperature Tj [1,4,5]. This temperature rises above the ambient temperature Ta due to thermal phenomena; i.e., self-heating and mutual thermal couplings with the devices situated on a common base (e.g., on a common PCB or on a common heat sink) [6,7,8]. An excessive increase in the internal temperature of a semiconductor device may lead to a significant shortening of its lifetime [9,10]. Therefore, the cooling systems of semiconductor devices are very important as they allow the limitation of the value of the internal temperature of the semiconductor device during its operation.
The ability of a cooling system to remove the heat that is generated in a semiconductor device is described using thermal parameters. These include transient thermal impedance Zth(t) and thermal resistance Rth [8,11,12]. These parameters characterise the efficiency of removing the heat that was generated in the semiconductor structure of the device to the surroundings.
For the cooling of semiconductor devices, either passive cooling systems are used, which rely on the phenomenon of free convection, or active cooling systems are used, which rely on forced convection [13,14]. These systems make it possible to increase the efficiency of the heat dissipation between the case of the device and the surroundings. Practical solutions for cooling electronics can include many components, e.g., heat sinks, fans, Peltier modules, heat exchangers for liquid cooling systems and interface materials [15,16,17]. Many of the forced cooling systems are characterised in the papers [13,14,15,16,17,18]. Some components of such cooling systems are described by their manufacturers [19,20,21,22,23,24]. As shown i.a. in the papers [13,25], the thermal resistance of an electronic component depends on many factors characterising the heat transport between the semiconductor die and its surroundings and it is related to a manner of mounting the component and the multi-path flow of heat.
In passive cooling systems, a reduction in the value of the thermal resistance is achieved by increasing the surface on which the heat convection takes place (e.g., by using heat sinks) or by increasing the efficiency of the radiation by increasing the emissivity of the cooling system’s surface (e.g., by oxidising it) [14]. In turn, in forced cooling systems, the reduction of the thermal resistance value is achieved, among other methods, by increasing the air flow rate around the device that is to be cooled or by increasing the flow rate of the cooling liquid through the heat exchanger [14].
Cooling systems can be built in various configurations having different efficiencies. From an engineer’s point of view, computer modelling is a useful tool in the design and optimisation of cooling systems [18,26,27,28].
Thermal models allow the computing of the device’s internal temperature at the known dissipated power. The transfer of the heat that is generated in electronic devices to their surroundings takes place by means of three mechanisms [14,29]: heat conduction, convection and radiation. As indicated in [14,29,30], the efficiency of each of these mentioned ways depends, among other factors, on the ambient temperature and internal temperature of the considered device.
Most compact thermal models that are proposed in the literature are linear and do not take into account the influence of the temperature on the effectiveness of the semiconductor device’s cooling. In the authors’ previous paper [30], nonlinear thermal models of semiconductor devices that operate with passive cooling systems were proposed.
Classical compact thermal models make it possible to determine the temperature value by taking into account only the influence of self-heating [11,16]. These models use thermal transient impedances Zth(t), hereinafter referred to as self-transient thermal impedances. In the case of thermally coupled elements, it is necessary to additionally use transfer transient thermal impedances Zthm(t) [7]. As it is known, from the papers [13,30], waveforms Zth(t) depend on the design of the cooling system and change with changes in the value of the power that is dissipated in the device. It should be expected that the mentioned factors also influence the time histories of Zthm(t). The transient thermal impedance waveforms are described using the general formula of the form [28]:
Z th t = R th · 1 i = 1 N a i · exp t τ thi
where Rth is thermal resistance, ai are the weight coefficients that are related to thermal time constants τthi, and N is the number of thermal time constants. For transfer transient thermal impedance Zthm(t), transfer thermal resistance Rthm is used instead of Rth.
In many papers (e.g., [25,30,31,32,33]) the influences of the construction of a cooling system and the operating point of the considered semiconductor device on its thermal resistance are analysed. In the cited papers it is shown that this thermal resistance decreases with an increase in the area of the soldering pads, the dimensions of the heat-sink and the rotational speed of the fan. The influence of the dissipated power on the thermal resistance depends on the dimensions of the used heat-sink. In the known literature there is a lack of analysis of the influence of the construction of the forced cooling systems on the self- and transfer-transient thermal impedances of power semiconductor devices.
This paper presents the results of investigations that illustrate the influence of the cooling system’s design and its selected parameters, as well as the power that is dissipated in the tested device, on the self- and transfer-transient thermal impedances. The investigations were carried out for power MOSFETs in TO-220 cases that were mounted on a common PCB and operating in selected passive and active cooling systems. Based on the measurement results that were obtained, an analytical description of the influence of the selected parameters on values of Zth(t) and Zthm(t) at the steady state is proposed.
Section 2 describes the measurement method that was used. Section 3 describes the cooling systems that were used. Section 4 contains the obtained measurement results.

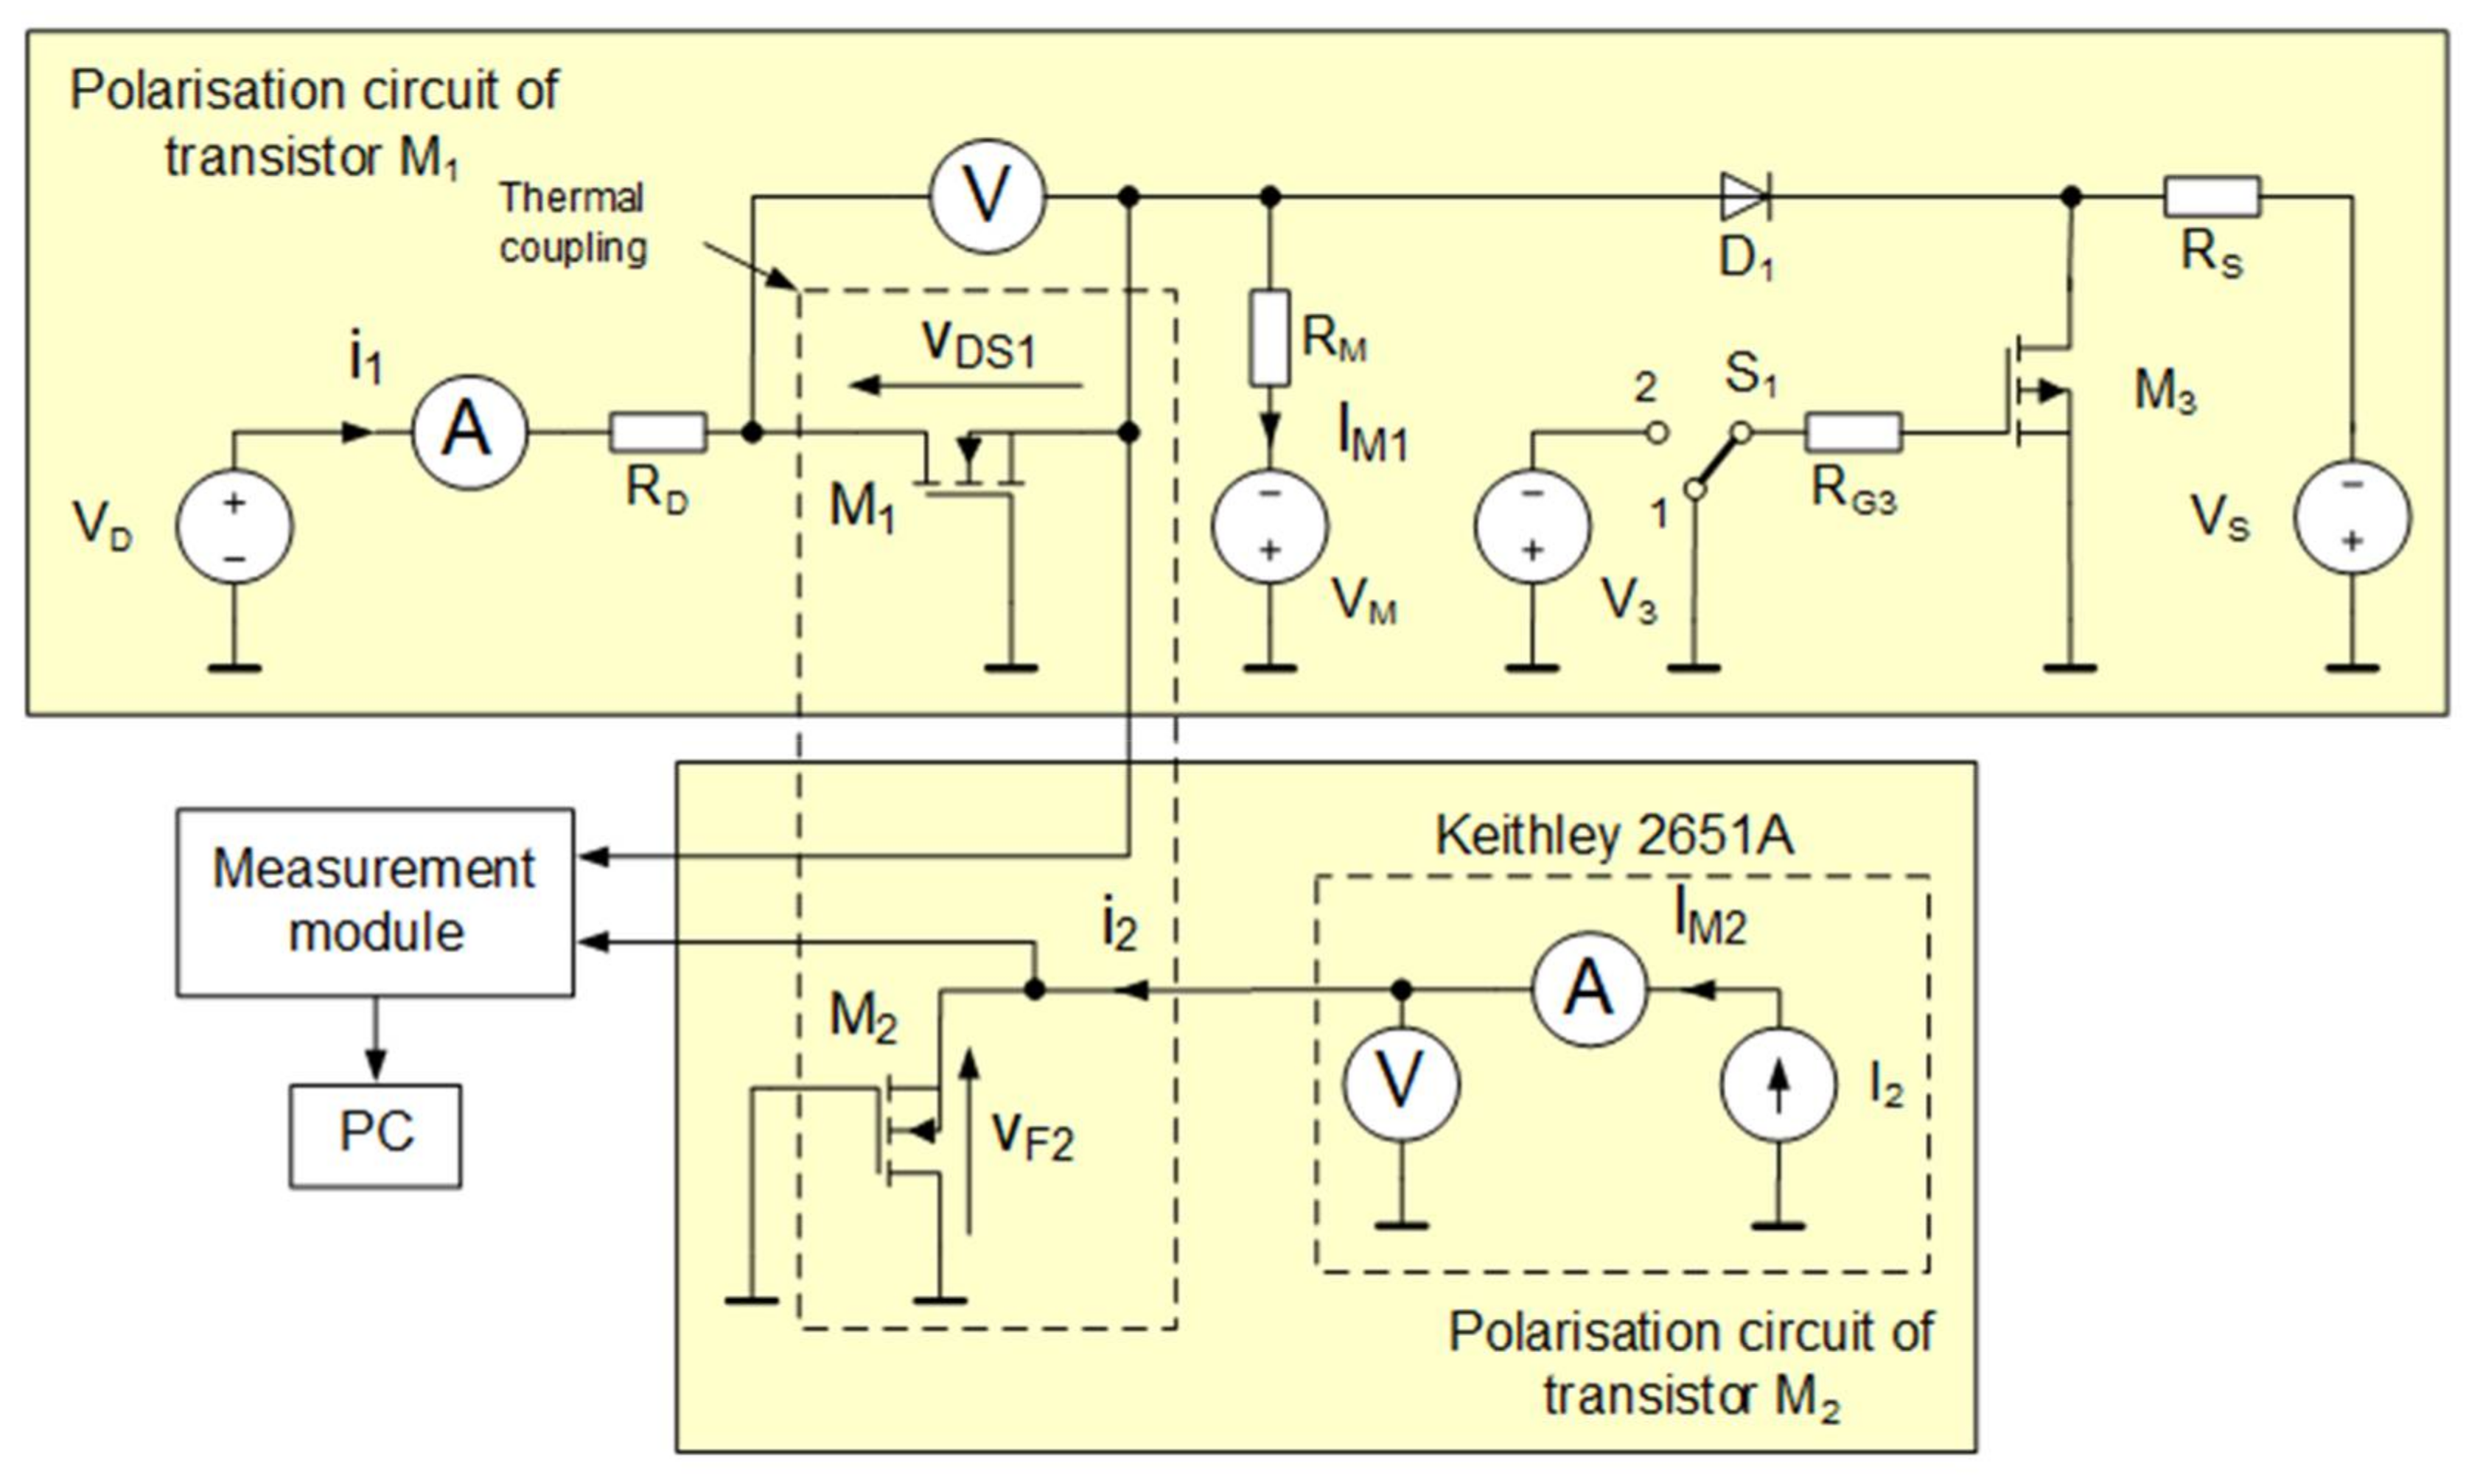
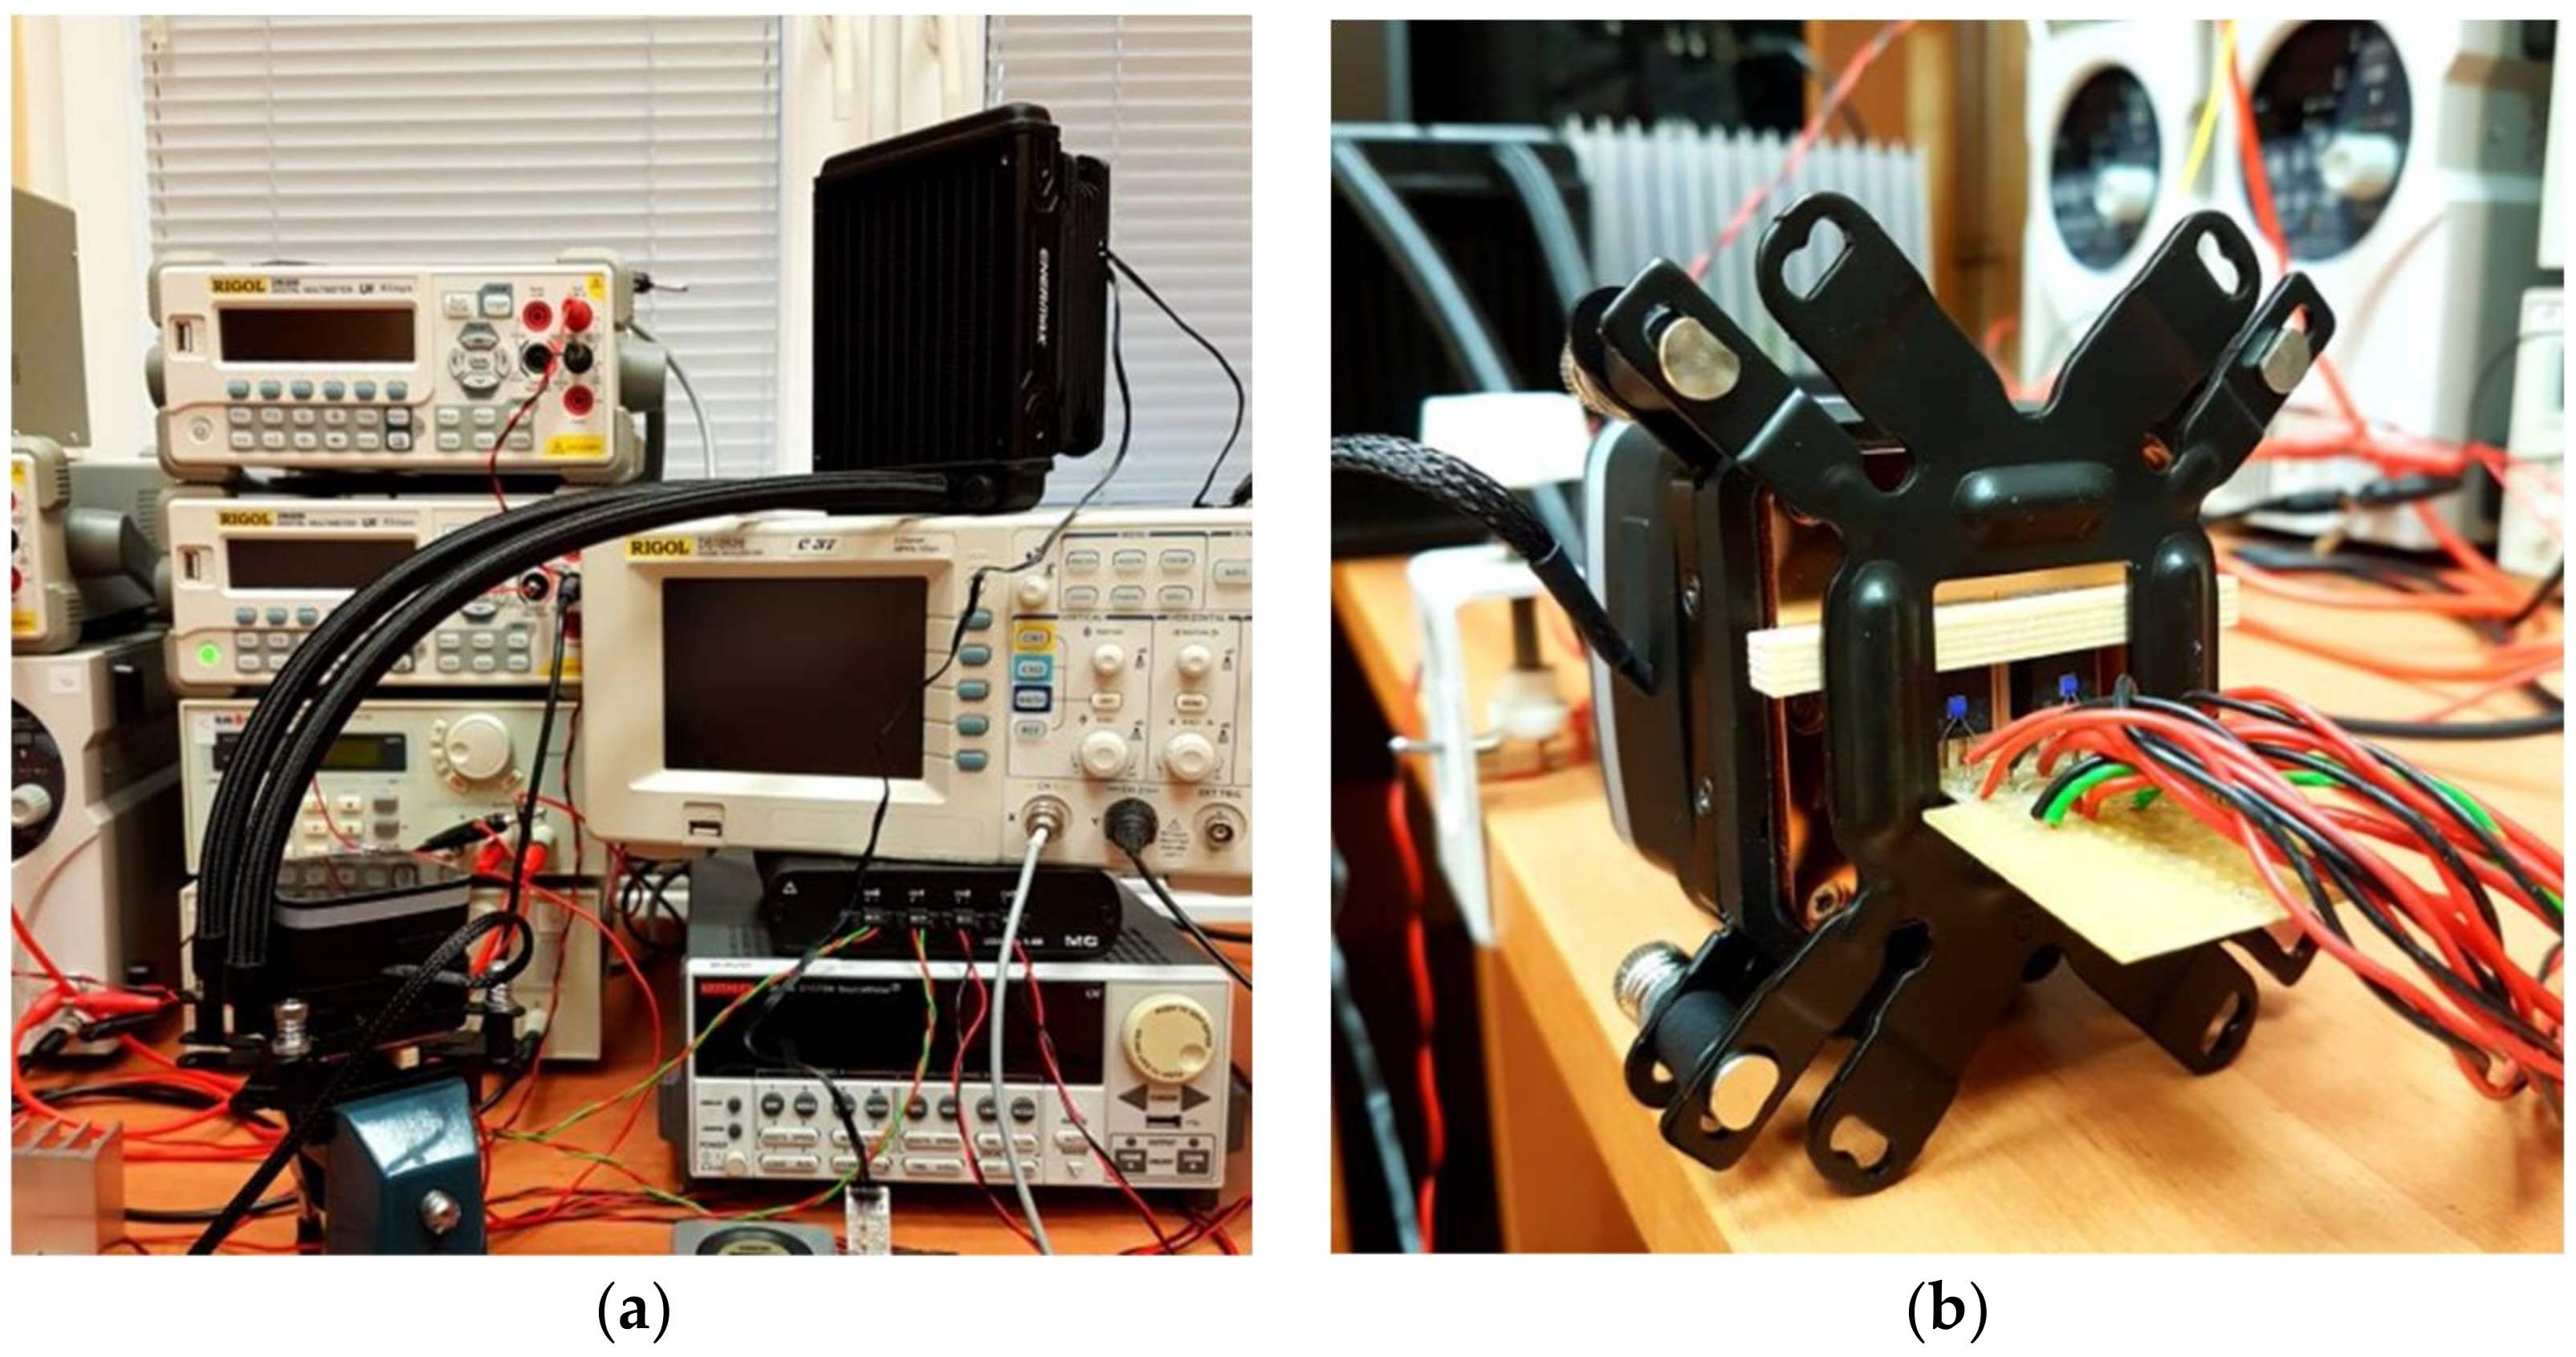
2. Measurement Method

In the present paper, two thermally coupled power MOSFETs working with various cooling systems are an object of the investigations. To carry out the measurements of thermal parameters of these transistors, the setup that is shown in Figure 1 was designed and constructed.
In the discussed setup, the investigated MOSFETs were marked as M1 and M2. M1 is the transistor, in which the power was dissipated. Its die temperature grew as a result of self-heating. The die temperature of M2 rose as a result of its thermal coupling with M1. In this setup, the indirect electrical method of thermal parameter measurement was used. This method makes use of the dependence of a thermosensitive parameter (TSP) on the die temperature of an electronic device.
The described setup allows for the measurement of the die temperature of transistor M1 using the gate-source voltage vGS as the TSP. During the measurements, the transistor was operating in the saturation range. The measurements of the die temperature of transistor M2 were carried out using voltage vF2 on the forward biased body diode.
The measurement setup was composed of three main subcircuits: the circuit of polarisation of transistor M1, the circuit of polarisation of transistor M2 and the measurement module with the PC.
The values of the TSPs, vGS and vF, were logged with the measurement module USB-2404-60 by Measurement Computing (Norton, MA, USA) [34]. This module has four built-in independent measurement channels. Each channel contains 24-bit Delta-Sigma DAC and enables the achievement of a sampling rate within a range from 1.613 kS/s to 50 kS/s. The measurement range of the module embraces voltages from −60 V to +60 V. The maximum sampling frequency fSmax that was used during the measurements was equal to 10 kS/s. The values of TSP parameters of both of the MOSFETs were logged with the use of the dedicated software MCScan and the PC [31,35].
So as to apply the indirect electrical method in order to measure the self-transient thermal impedance Zth(t) of transistor M1 and transfer-transient thermal impedance Zthm(t) of transistor M2 with the electrical method, it was necessary to measure the thermometric characteristics of both of the investigated transistors; i.e., the dependences of the selected TSP on the die temperature. The procedure and the results of the thermometric characteristics measurements for the investigated transistors in the setup that is currently under consideration are described in [31].
Once the thermometric characteristics of both of the transistors were known and their approximating functions were determined, the measurements of Zth(t) and Zthm(t) were performed in the following three steps:
  • Heating the transistors up to the thermally steady state by means of the dissipation of power p equal to the product of the voltage VDS1 and current I1 in transistor M1. At this measurement stage, switch S1 was set to position 1. Due to the self-heating of the die of transistor M1, its temperature increased and, at the same time, the internal temperature of M2 increased as a result of the mutual thermal coupling with transistor M1. This stage of measurement ended after the thermally steady state in both of the transistors was reached.
  • Recording the TSPs waveforms after a change in the position of switch S1 from 1 to 2. The measurement ended when the transistors M1 and M2 cooled down to the ambient temperature.
  • Computing Zth(t) and Zthm(t) from the formulas [31]:
Z th t = a 1 · v GS 2 t v GS 2 t = 0 + b 1 · v GS t v GS t = 0 I 1 · V DS 1 ,
Z thm t = a 2 · v F 2 2 t v F 2 2 t = 0 + b 2 · v F 2 t v F 2 t = 0 I 1 · V DS 1 ,
where a1 and b1 are the coefficients of the function approximating the thermometric characteristic Tj(vGS) of transistor M1 and a2 and b2 are the coefficients approximating the thermometric characteristic Tj(vF2) of transistor M2. The values of parameters a1, b1, a2 and b2 were obtained using the measured thermometric characteristics Tj(vGS) and Tj(vF2) as the input data for the approximation procedure that was performed with Excel software (Microoft, Redmond, WA, USA).
The accuracy of the presently used measurement method was analysed in the paper [31]. The results of the performed analyses proved that the measurement error is a decreasing function of the dissipated power. If this power is so high that the internal temperature Tj is over 50 °C higher than ambient temperature Ta, then this error is smaller than 5%.

3. Investigated Cooling Systems

Two power MOSFET transistors IRF840 in TO-220 package, produced by Vishay (Malvern, PA, USA), were chosen for the investigation [36]. The transistors were soldered to a universal PCB that is made of FR4 laminate of the dimensions 35 × 45 mm. The distance between the axes of symmetry of the transistors was equal to 10 mm and the distance between the inner edges of their packages was equal to 5 mm.
The thermal parameters of the investigated MOSFETs that are specified by the producer are as follows [36]:
(a)
The maximum value of thermal resistance junction-ambient Rthj-a = 62 K/W,
(b)
The maximum value of thermal resistance junction-case (drain) Rthj-c = 1.0 K/W,
(c)
The typical value of thermal resistance case-heat sink in the case when thermal paste is used: Rthc-s = 0.5 K/W.
In order to assess the influence of a cooling system on the thermal parameters of the investigated MOSFETs, several cooling systems were selected. The investigations were carried out using the following cooling systems:
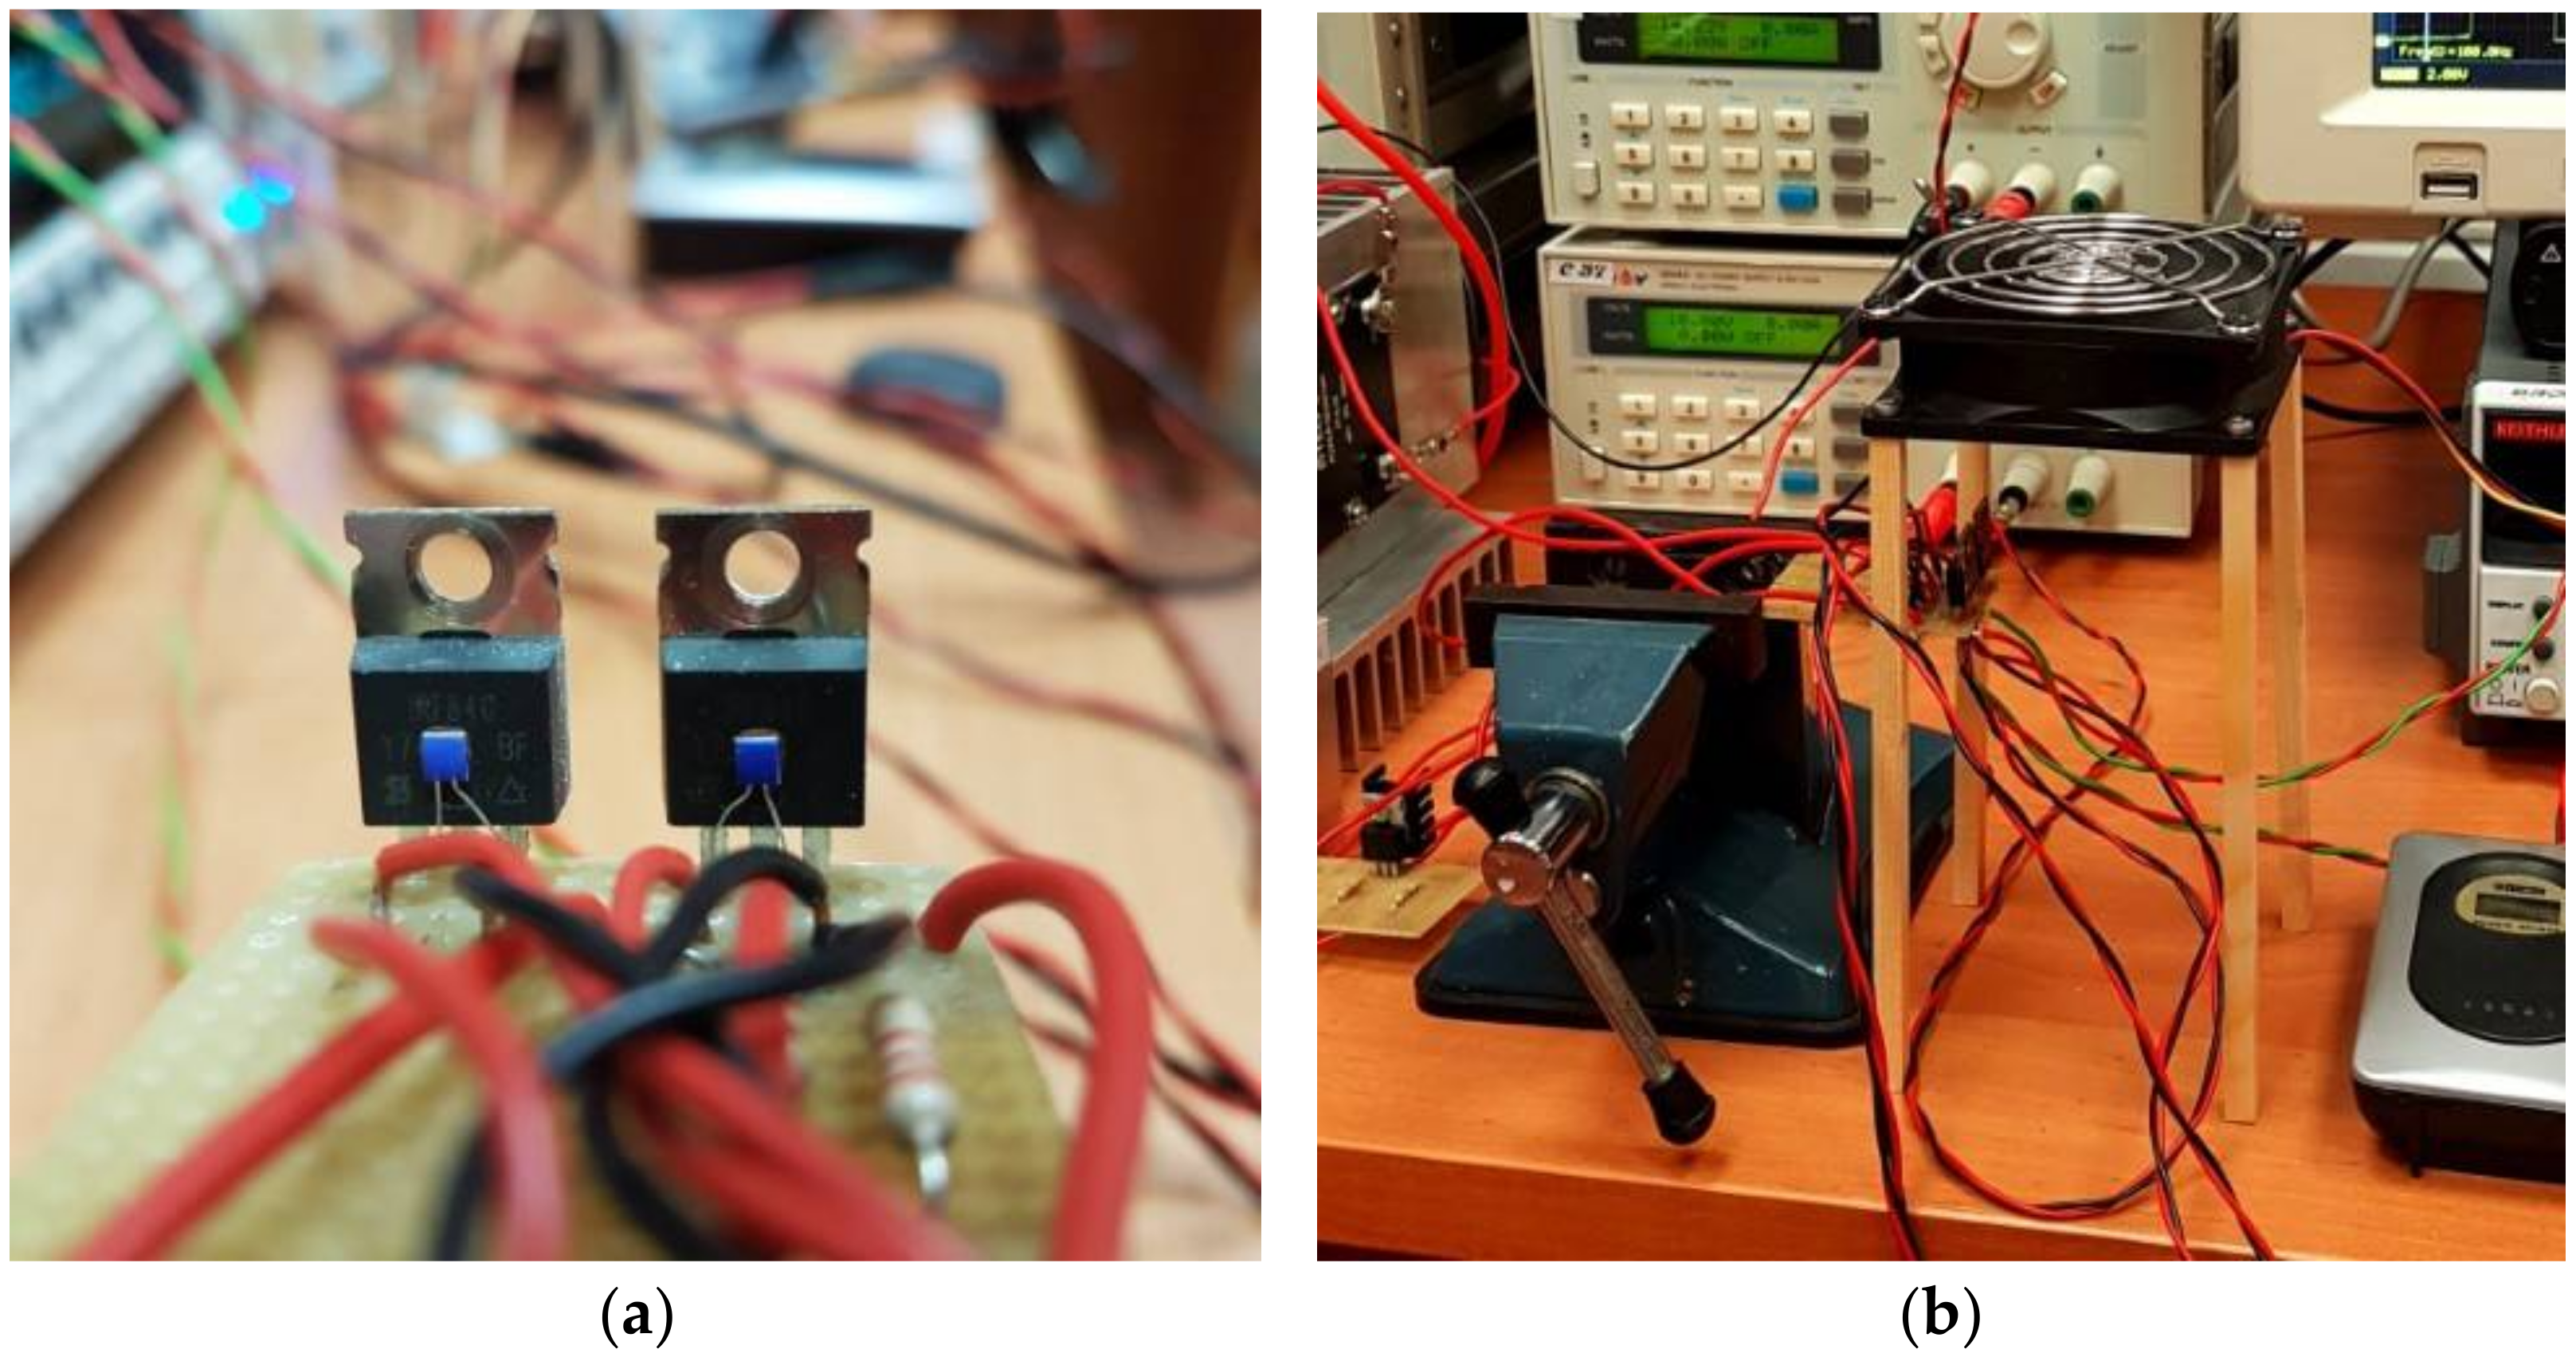
  • Transistors with no additional cooling components.
  • Fan with transistors placed on the intake side.
  • Fan with transistors placed on the exhaust side.
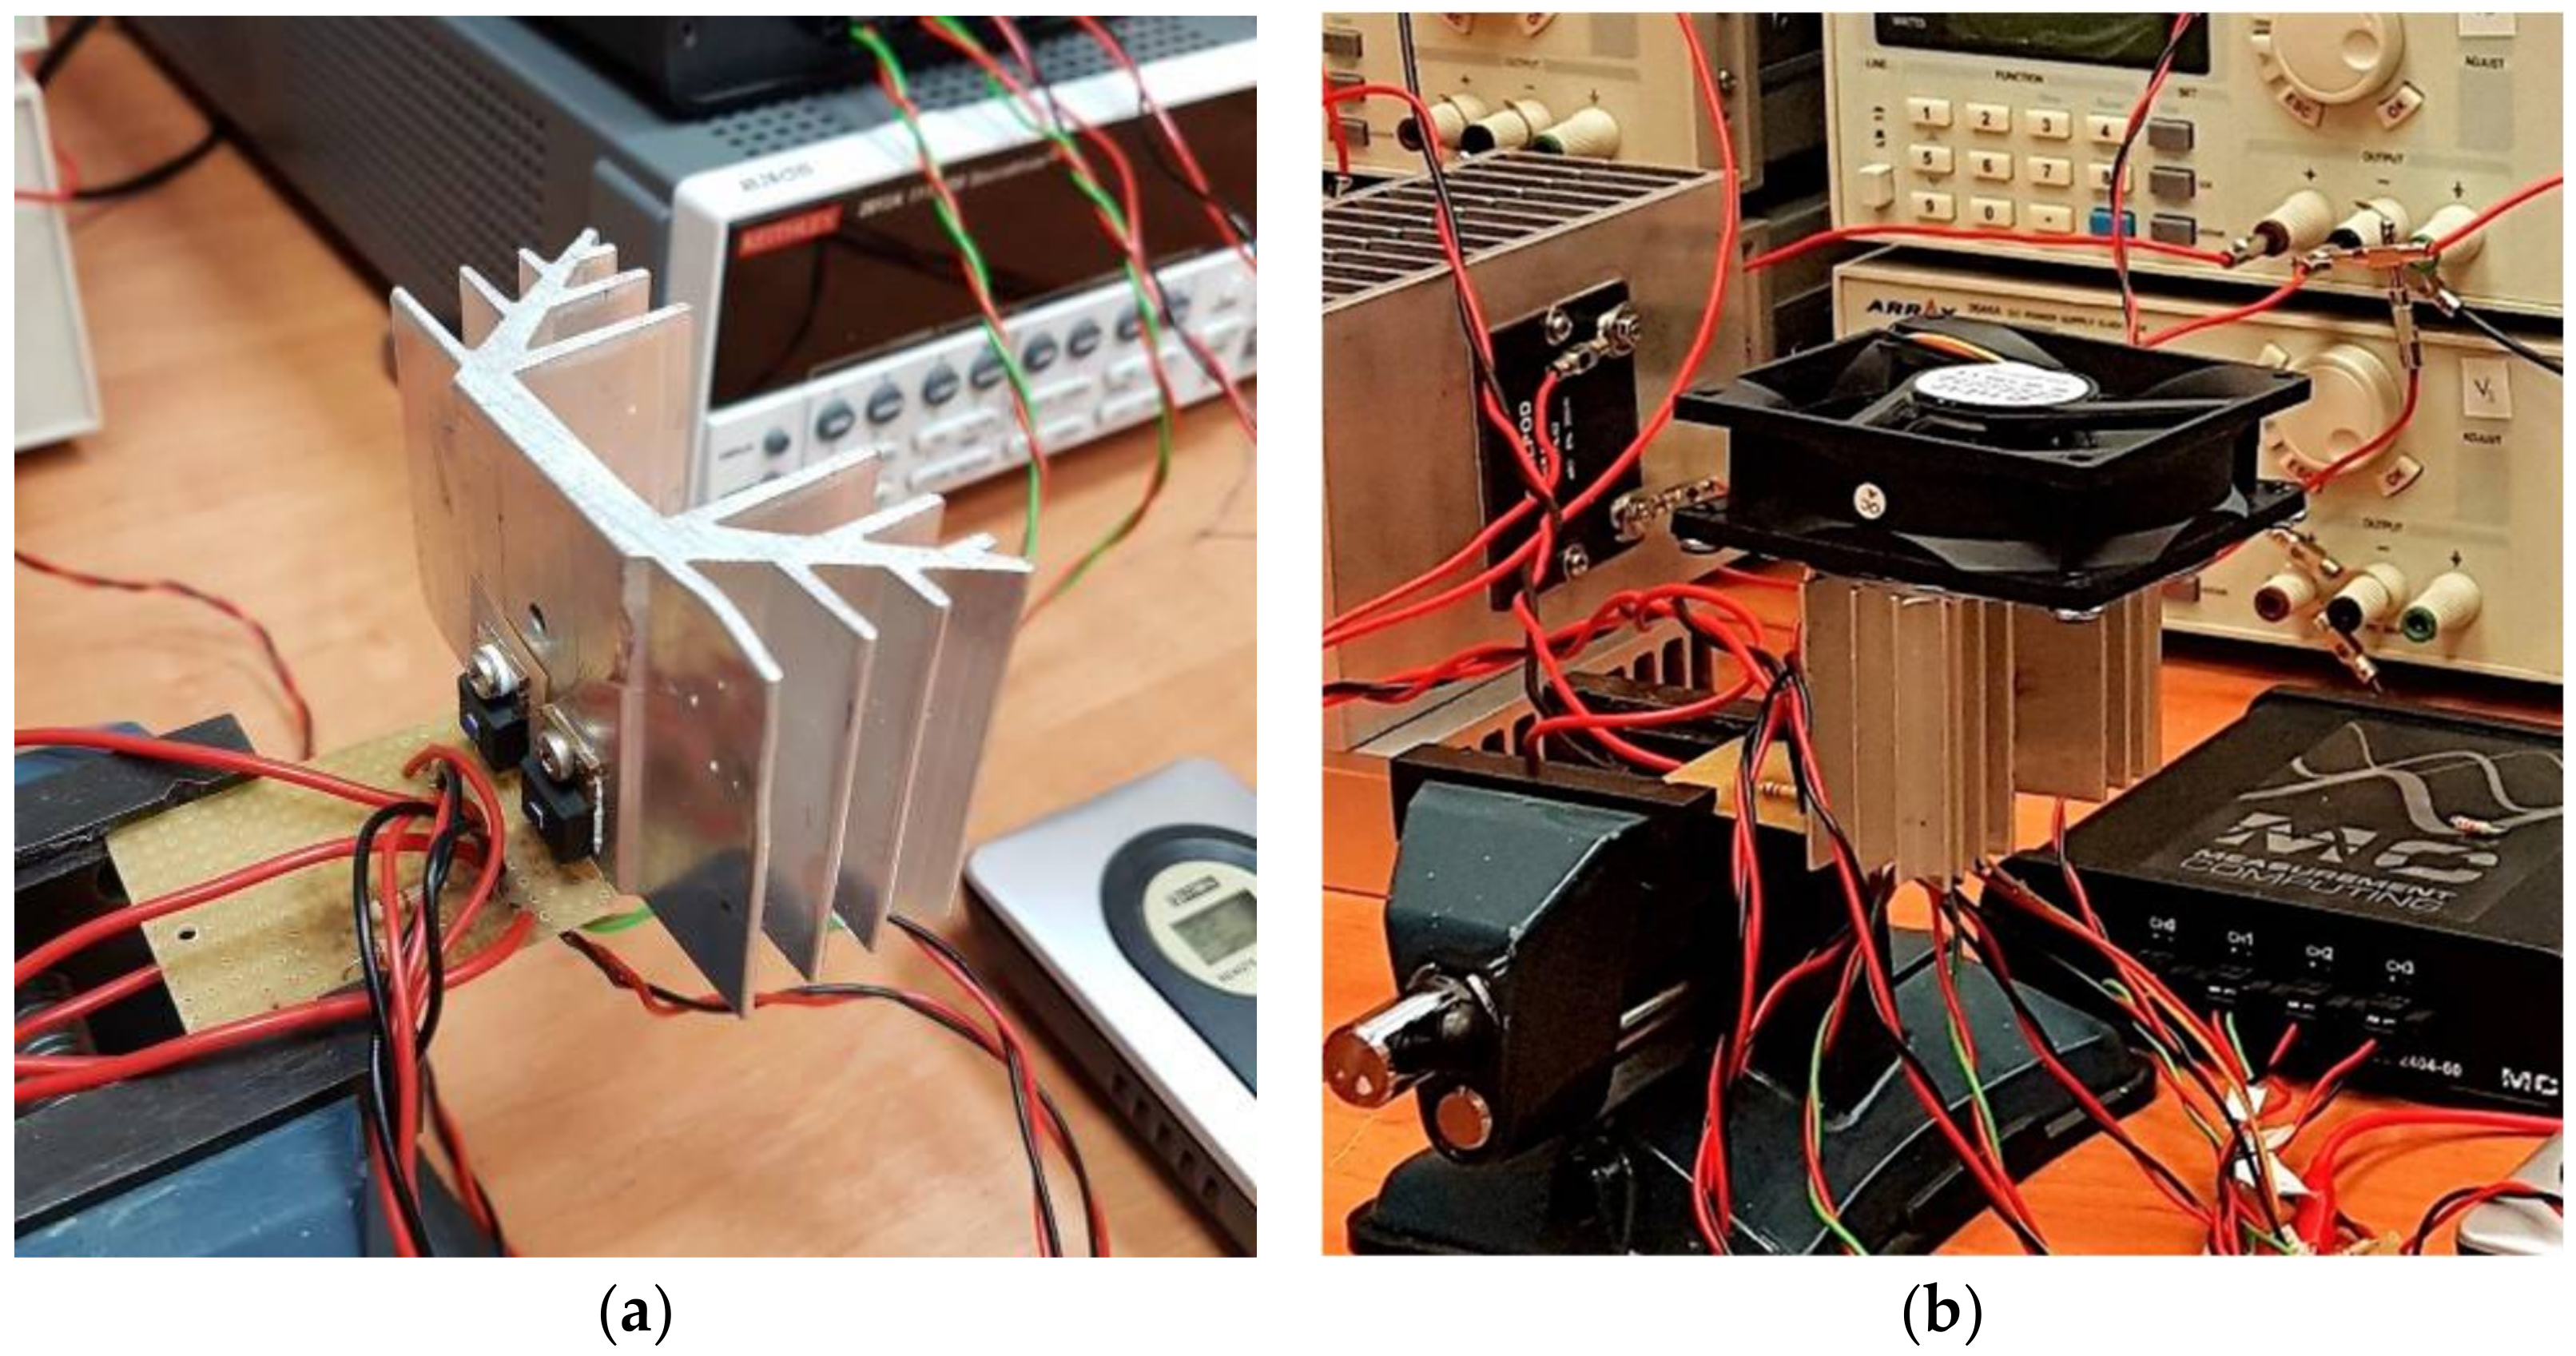
  • Extruded heat sink made of aluminium.
  • Extruded heat sink with a fan.
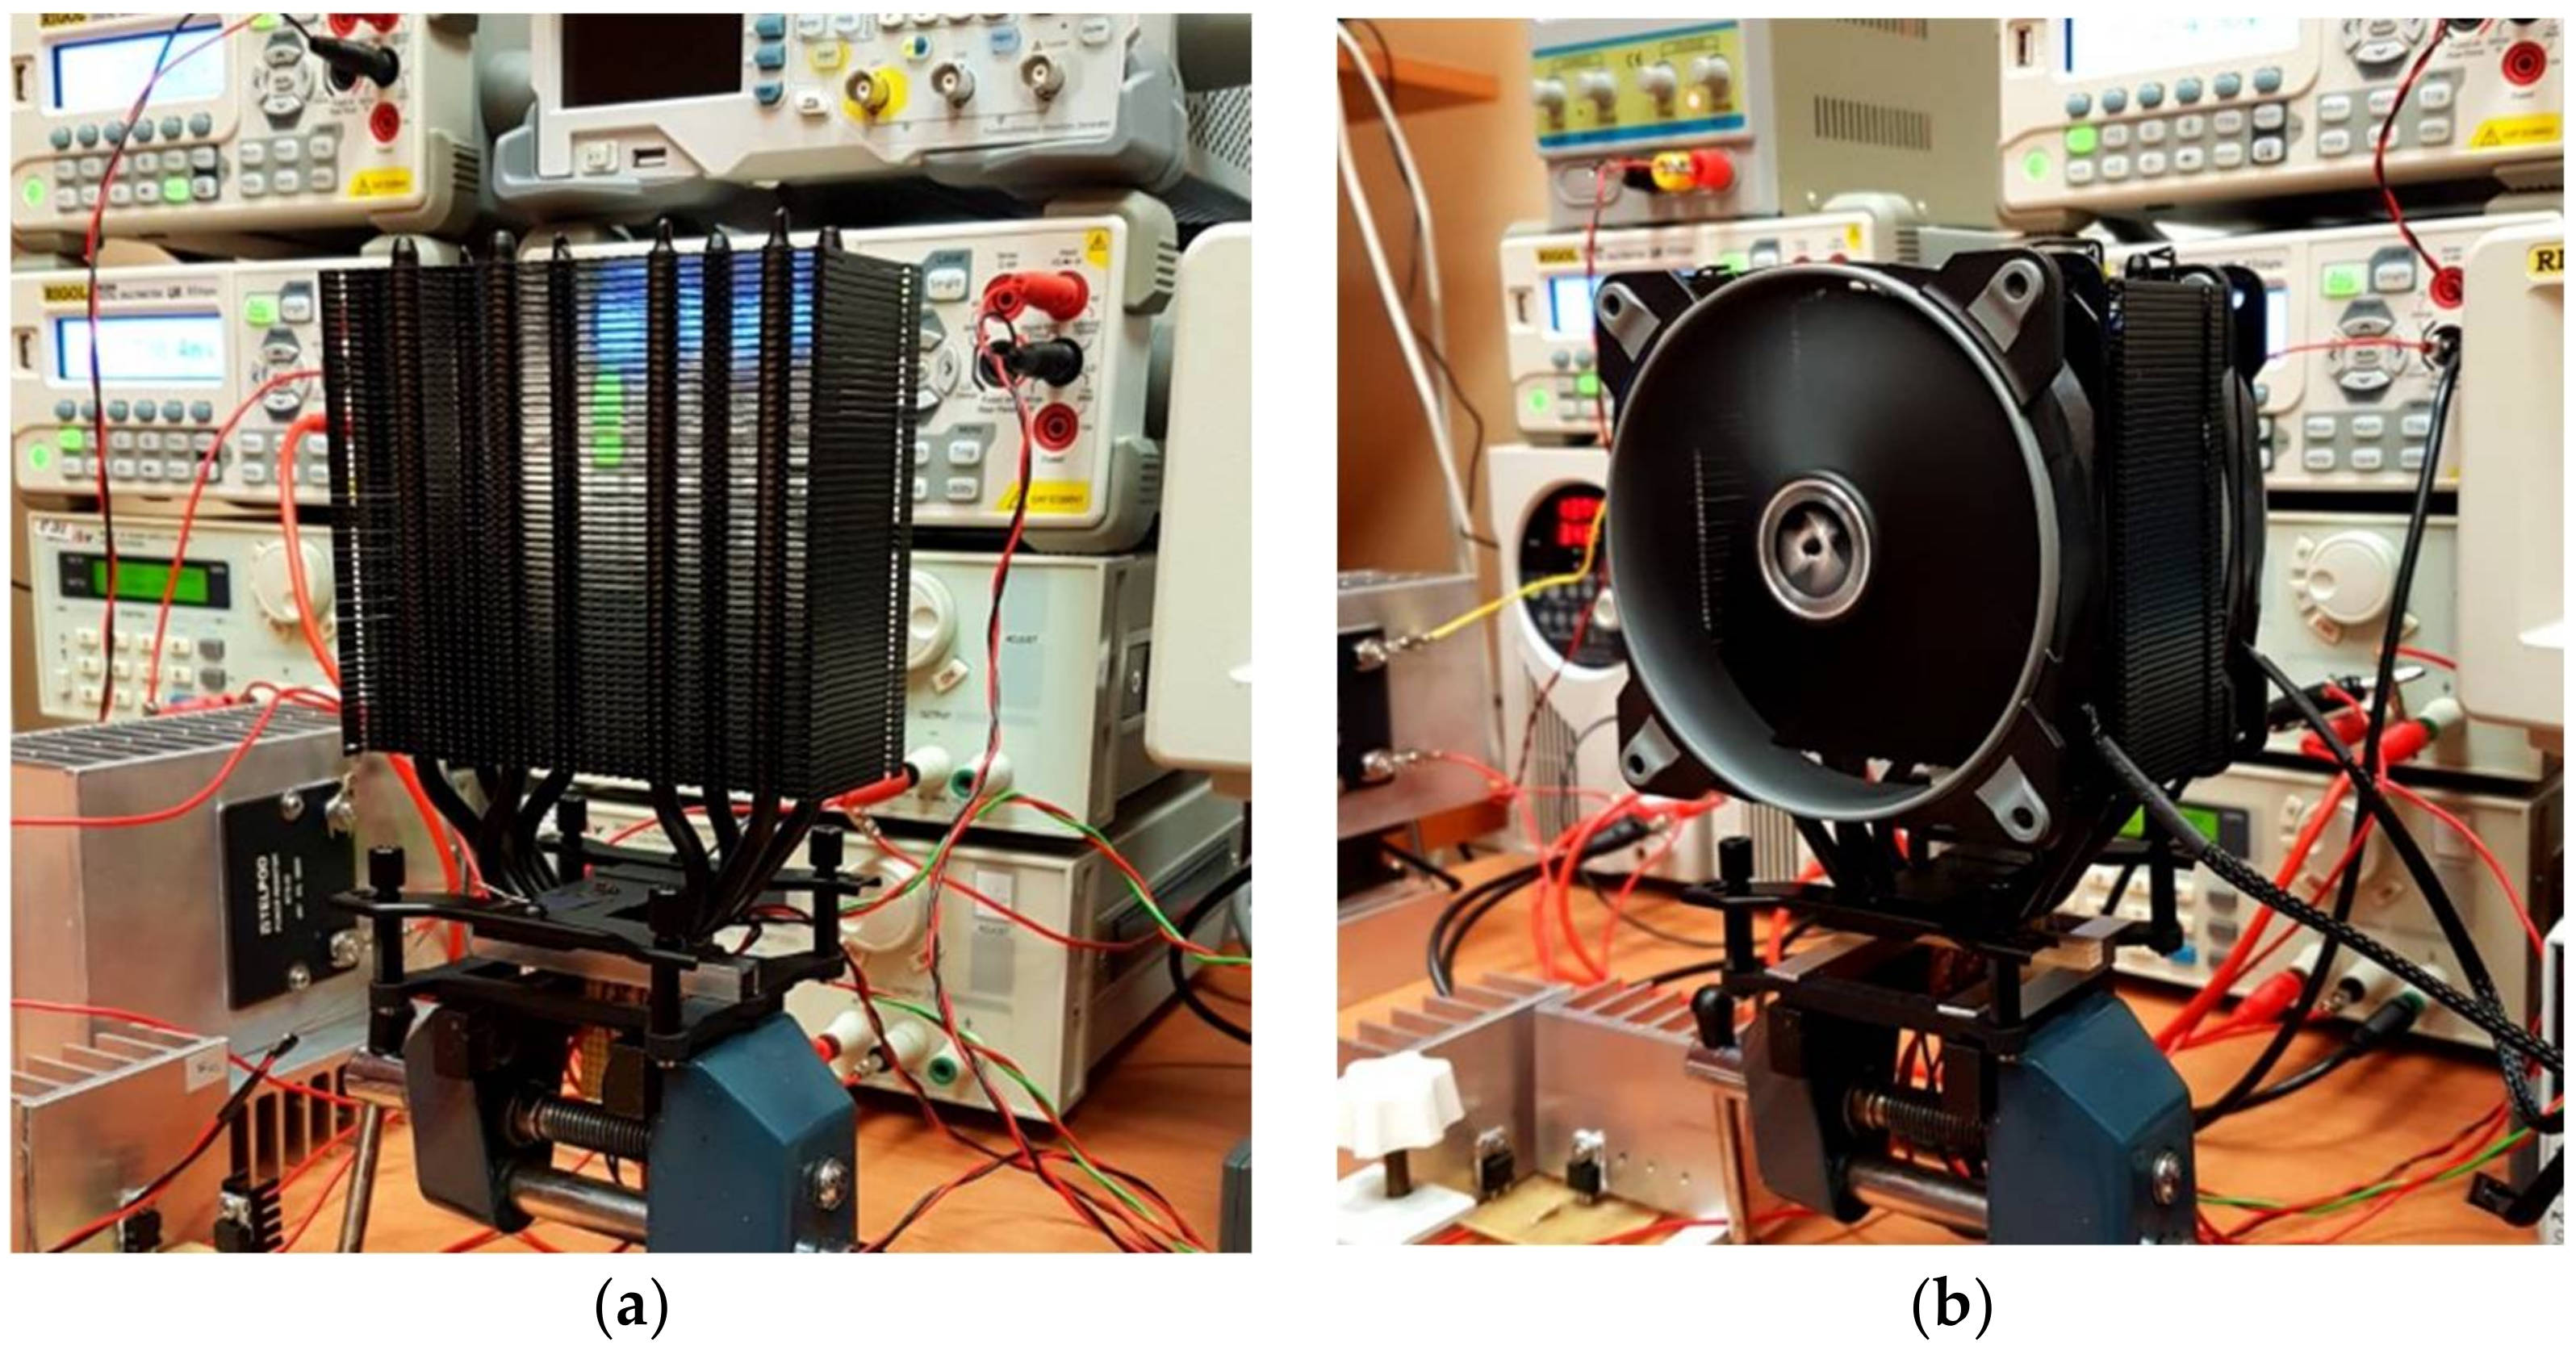
  • Heat pipes with an aluminium heat sink.
  • Heat pipes with an aluminium heat sink and two fans in push-pull configuration.
  • Liquid cooling system.
The detailed description of the listed cooling systems is given in Section 3.1, Section 3.2, Section 3.3 and Section 3.4.

3.1. Cooling Systems A, B and C

In the present paper, the packages of the investigated transistors with no additional devices attached to them are referred to as cooling system A. In cooling systems B and C, a fan that forces a flow of air around the MOSFETs packages was used. Cooling systems A–C are shown in Figure 2.
Systems B and C differ between each other with regard to the location of the fan in relation to the transistors. In system B, the fan was placed with the intake side facing the transistors, whilst in system C, the fan was placed with the exhaust side facing the transistors. The fan that was used is the Titan TFD-8025H12C (Titan Polska, Cracow, Poland). Its rated supply voltage is 12 V, its supply current is 0.16 A and its power consumption is 1.92 W. The fan’s nominal rotational speed is 3000 rpm, which ensures airflow of 36.48 CFM (61.98 m3/h), static pressure of 0.14 inch-H2O (34.8 Pa) and a generated noise level that is below 33 dBa. This fan has the dimensions 80 × 80 × 25 mm [19].

3.2. Cooling Systems D and E

Systems D and E are shown in Figure 3a,b. In system D, the transistors were cooled with an extruded heat sink made of raw aluminium [20]. The heat sink has the dimensions 74 × 50 × 30 mm and a mass of 96 g.
In system E, the fan that was described in the Section 3.1 was added. The fan was placed on top of the heat sink with the air intake facing the heat sink. In both of the systems the transistors were fixed to the heat sink with M3 bolts using torque that was equal to 1 N∙m. As a thermal interface between the package of transistor M1 and the heat sink, the thermal compound Electrolube HTC (Ashby de la Zouch, UK) was used [21]. The thermal conductivity of the compound is equal to 0.9 W/(m∙K). Due to the different polarisations and different drain potentials of the transistors M1 and M2 during the measurements, M2 was electrically insulated from the heat sink with the thermal pad Fischer Elektronik KAP 220 G (Lüdenscheid, Germany) [16] and a Teflon separator. The thermal pad is composed of a polyimide-carrier foil with a silicone-free phase changing the thermal conductive layer that is completely coated on both sides. The overall thickness of the pad is 77 μm, with a substrate that is 50 μm thick. The thermal conductivity of the pad substrate is equal to 0.45 W/(m·K) [22]. The thermal resistance of the pad is equal to 0.15 K/W (at an area that is equal to 1 inch2 = 6.45 cm2).

3.3. Cooling Systems F and G

In systems F and G, the cooling set Arctic Freezer 34 eSports Duo (Brunswick, GA, USA) [23], which is dedicated for use in CPU cooling, was used. In system F, only the heat pipes with a heat sink were used, whilst in system G a fan on each side of the heat sink was added. The cooling systems that have been described here are shown in Figure 4.
The Arctic cooling set is constructed from four 6 mm diameter copper heat pipes, to which a stack of 54 aluminium fins is attached. The fins are 0.4 mm thick. In order to maximise the heat conduction from the heat source to the heat sink, the heat pipes in the base of the system are shaped and machined into a flat surface that adheres directly to the CPU that is being cooled. In heat pipe applications this is the so-called direct contact technique (DCT). Additionally, the set is equipped with two 120 mm fans working in a push-pull configuration that are attached to each side of the heat sink. The fans are PWM signal-controlled in a range of the rotational speed 200 rpm to 2100 rpm. The nominal supply conditions are 12 V DC and 0.13 A. The thermal design power (TDP) of the system is equal to 210 W. The dimensions of the complete set are 124 × 103 × 157 mm. The net weight is 764 g.
The manner of attaching the investigated transistors to the base of the cooling system is shown in Figure 5.
Both of the transistors were insulated from the base of the system with the pads that are described in the Section 3.2. In both of the cooling systems that were considered, in order to fix the transistors to the base of the system a back frame that came as a part of the Arctic cooling set and a pine wood profile of a rectangular cross section were used.

3.4. Cooling System H

As cooling system H, the Enermax ELC-AQF120-SQA All-in-One (AiO) (Taoyuan, Taiwan) [24] CPU liquid cooling system was used. The view of the system and a manner of attaching the investigated MOSFETs to the water block is shown in Figure 6.
The system is composed of two main parts—a water block and a radiator, which are connected with two rubber hoses of 400 mm in length.
The water block is built from a coolant pump and a cold plate, which in the typical working conditions of the system comes into contact with the surface of a CPU that is being cooled. The cold plate is made of copper and has a skived heat sink that is positioned on a coolant chamber side. This heat sink is divided into two parts with a shunt channel located in the middle. The coolant that comes from the radiator is delivered centrally and flows through the fins of the radiator in the outwards direction absorbing the heat. Such construction ensures the shortening of the path of the coolant flow and improves heat dissipation from the cold plate. The warm coolant is pushed away by the pump to the radiator, where it gets cooled. In order to improve heat dissipation, the system is equipped with a 120 mm diameter fan that is fixed onto the radiator.
The rated pump supply conditions are vP = 12 V and iP = 0.7 A, which allow the pump to work with a rotational speed of 3100 rpm. The nominal supply conditions for the fan are vFn = 12 V, iFn = 0.38 A. The PWM control signal allows the adjustment of the fan to a rotational speed in a range from 500 rpm to 2000 rpm. The fan produces air flow in the range 39–79.8 CFM (66.26–135.58 m3/h) and static pressure between 0.67–3.6 mm-H2O. The thermal design power of the system is 300 W and its net weight is 0.9 kg.
As is illustrated in Figure 6b, the transistors were fixed to the water block in a similar manner as in the case of systems F and G using the parts that were delivered with the cooling system that has been described.

4. Results

In order to investigate the influence of the selection of a cooling system on the thermal parameters of the investigated transistors, measurements at different values of power as well as various supply conditions of the active parts of the cooling systems were performed. The measurements were carried out using the setup that was described in Section 2.
The results of the measurements are presented and discussed in Section 4.1, Section 4.2, Section 4.3 and Section 4.4. In Section 4.1, the influence of the power that was dissipated in transistor M1 on the waveforms of its self-transient thermal impedance Zth(t) as well as the waveforms of transfer-transient thermal impedance Zthm(t) of transistor M2 in the considered cooling system are shown. In Section 4.2, the quantity of the thermal time constants characterising the waveforms of Zth(t) and Zthm(t) in the investigated cooling systems are discussed. The influence of the supply conditions of the active parts of the considered cooling systems is illustrated in Section 4.3.

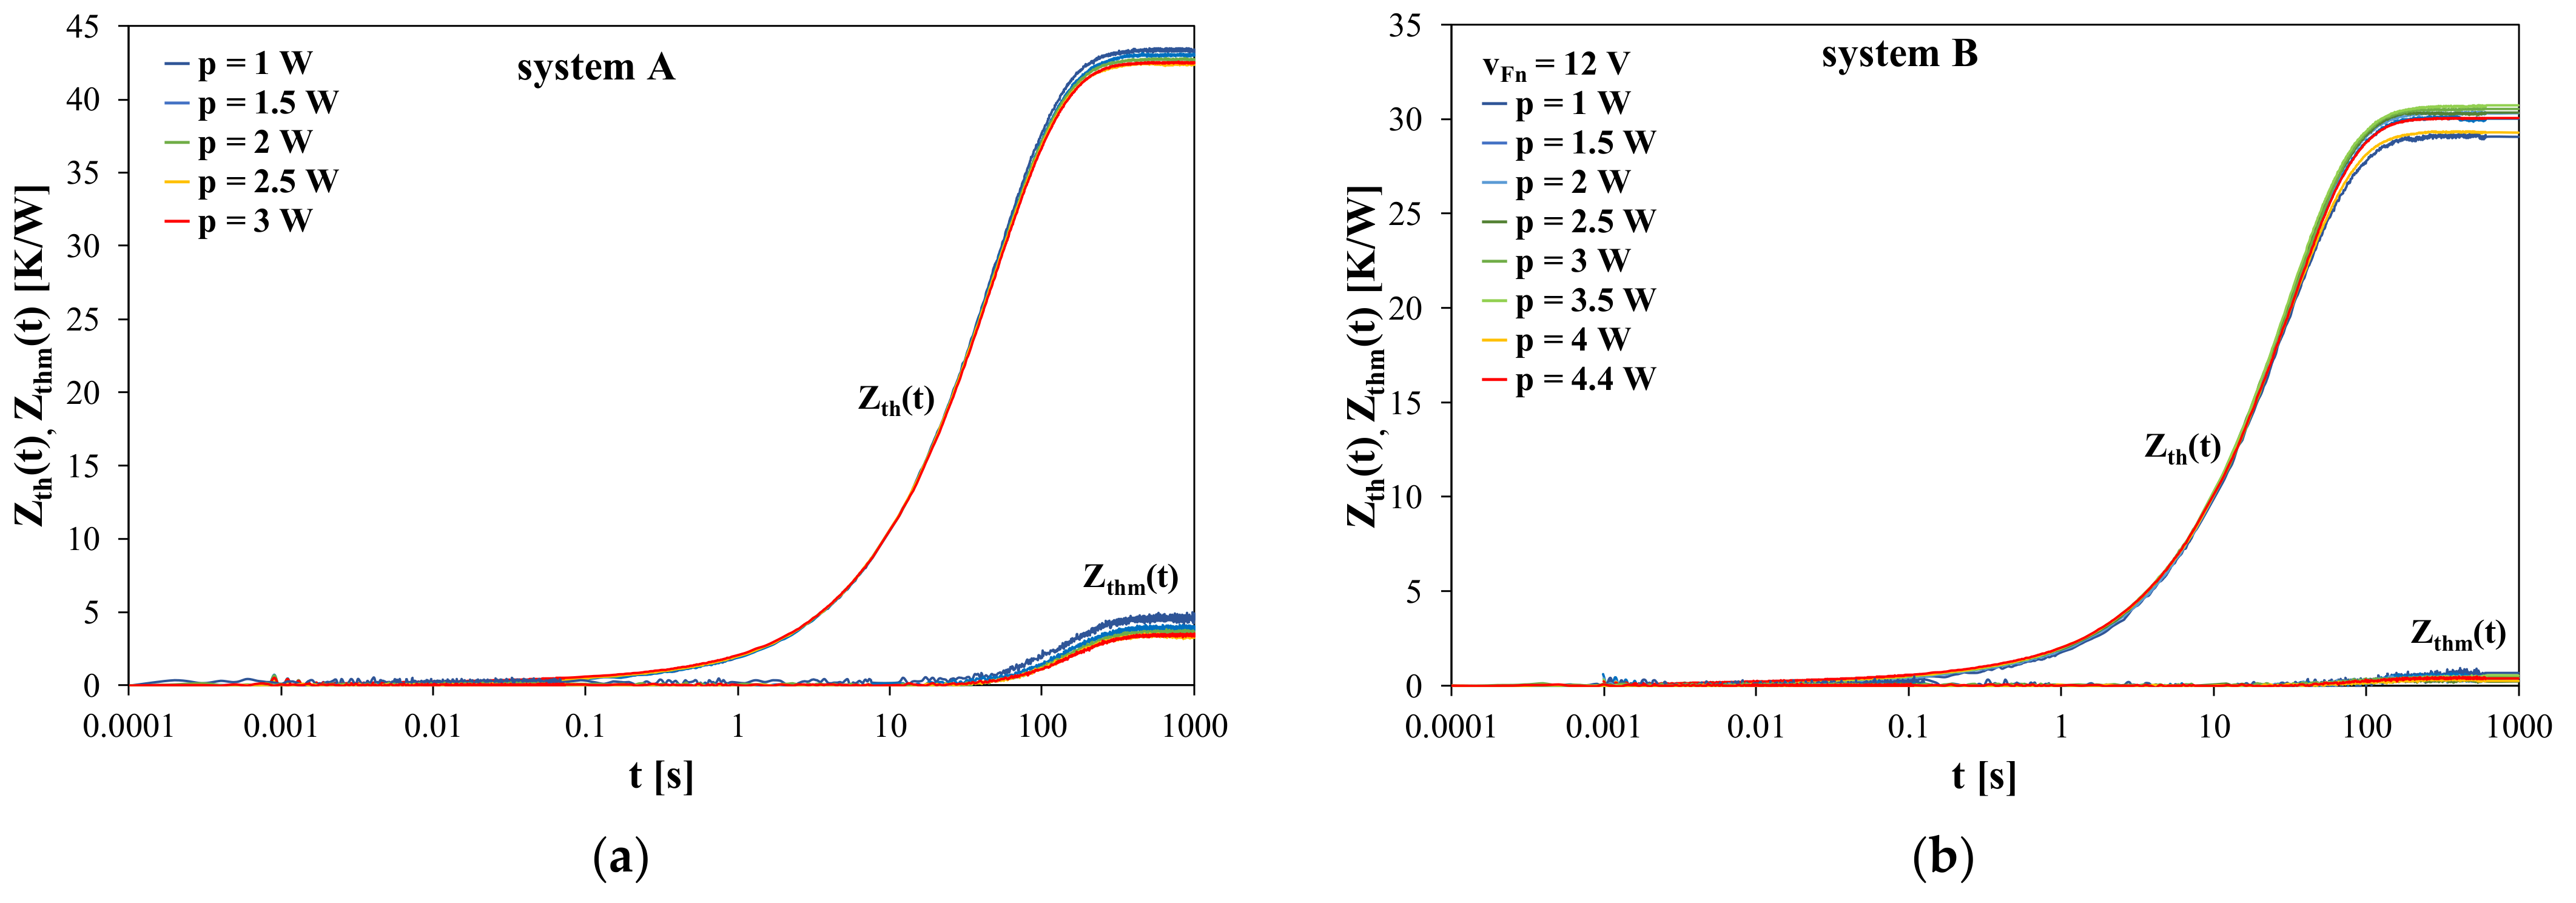
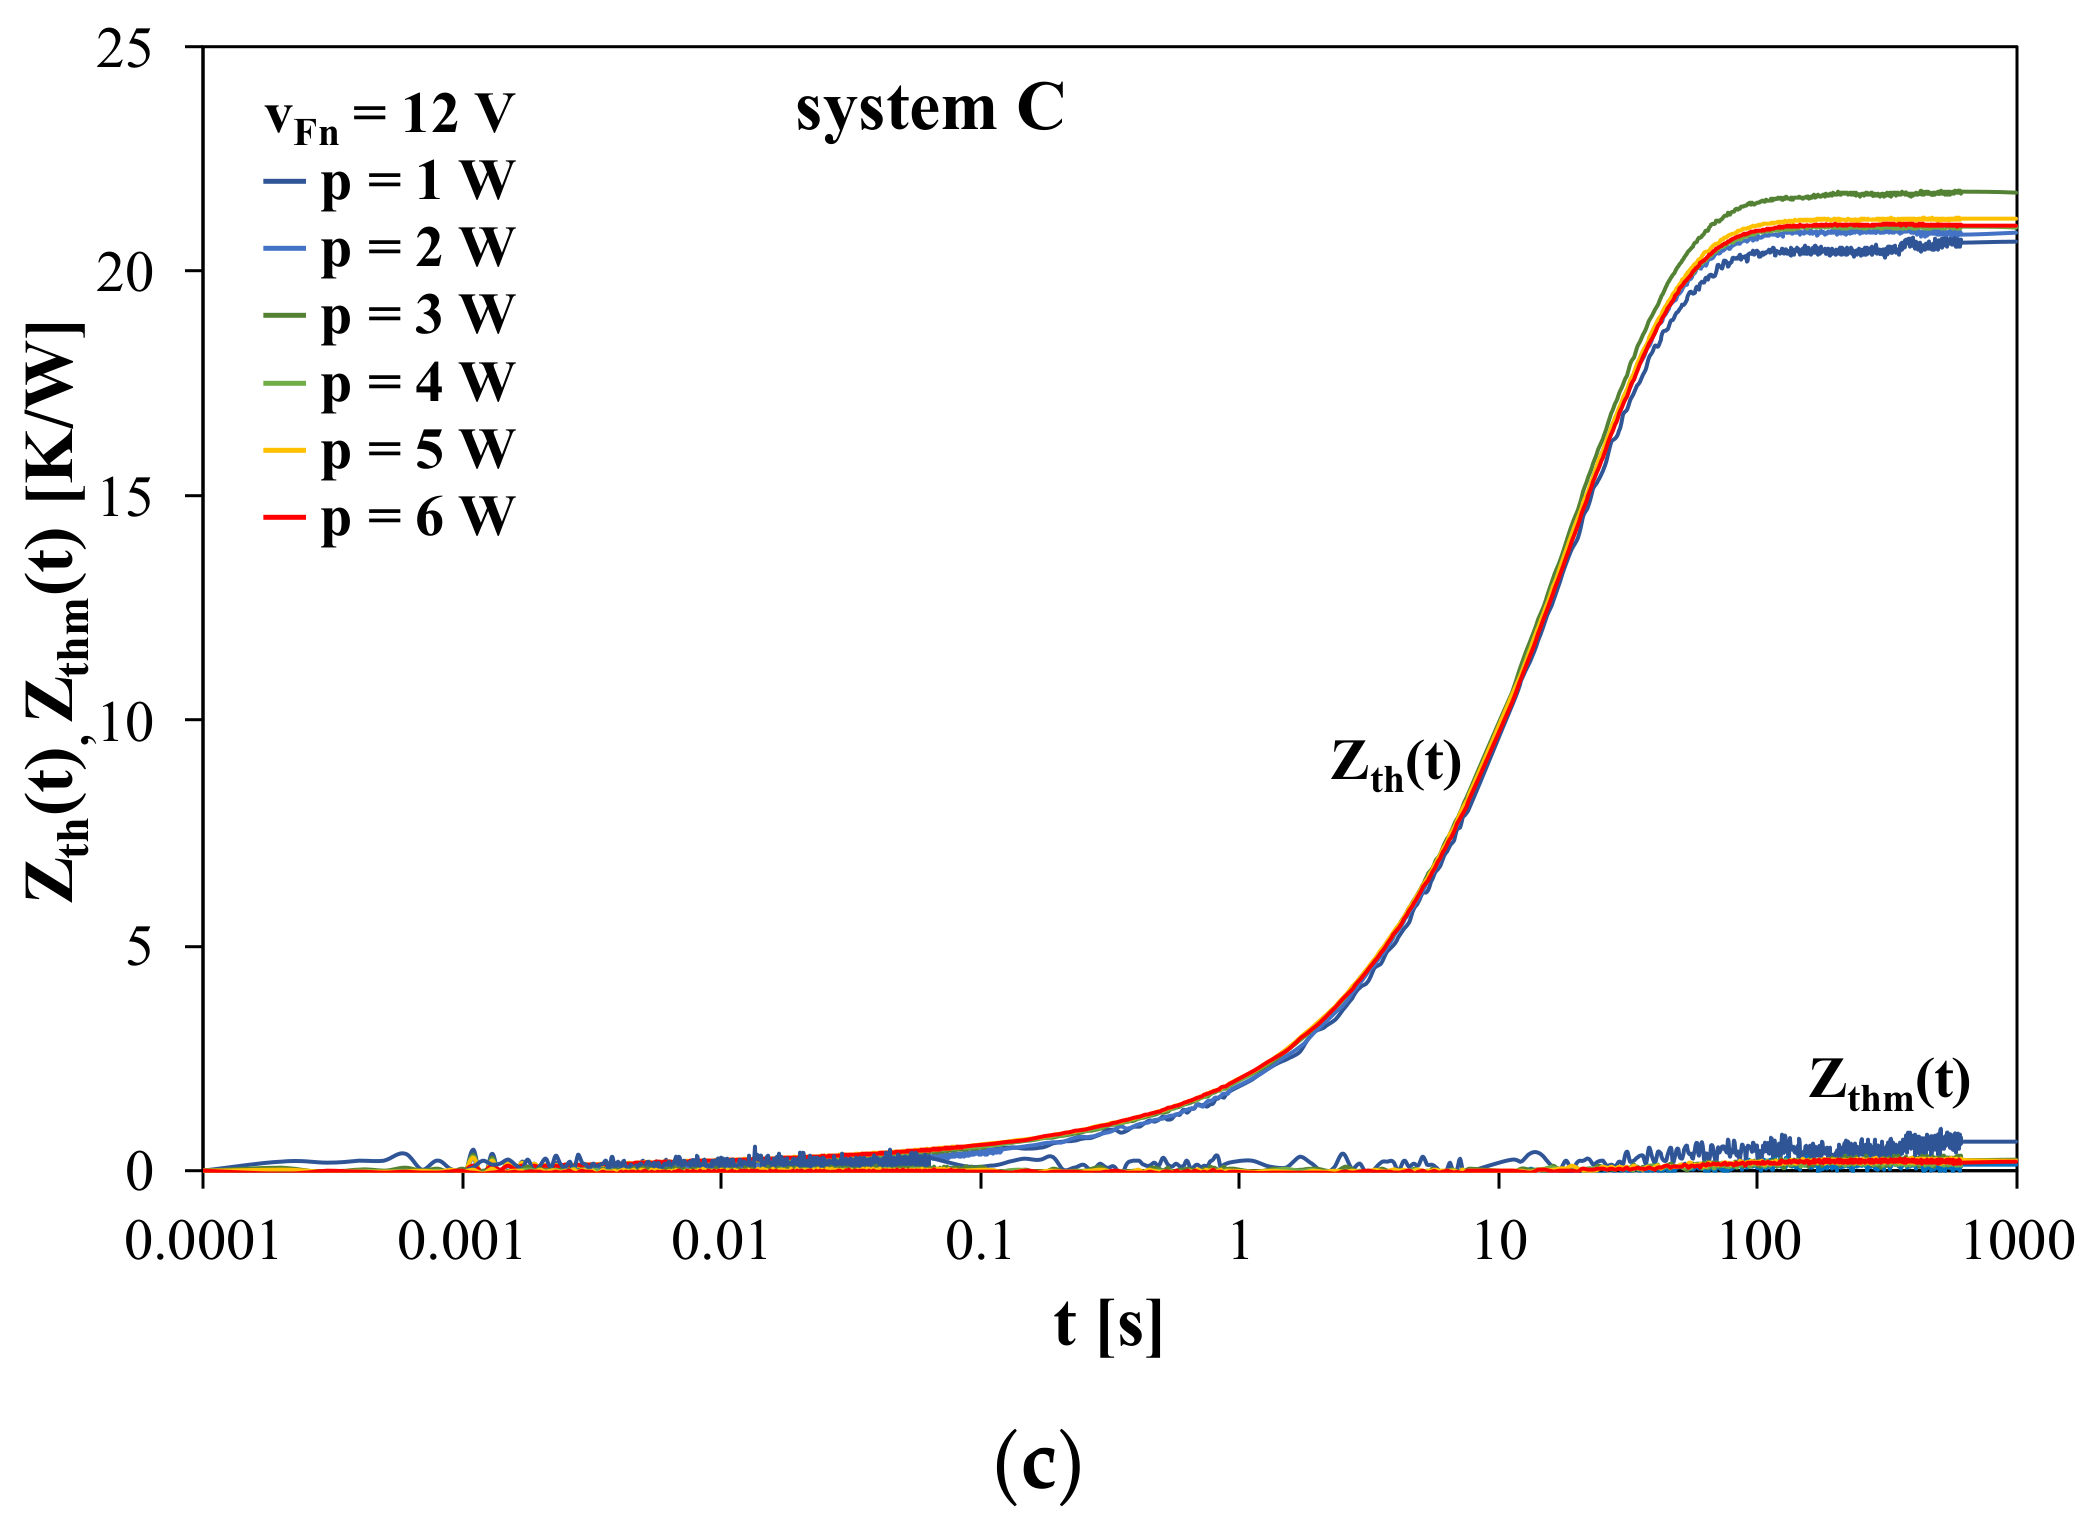
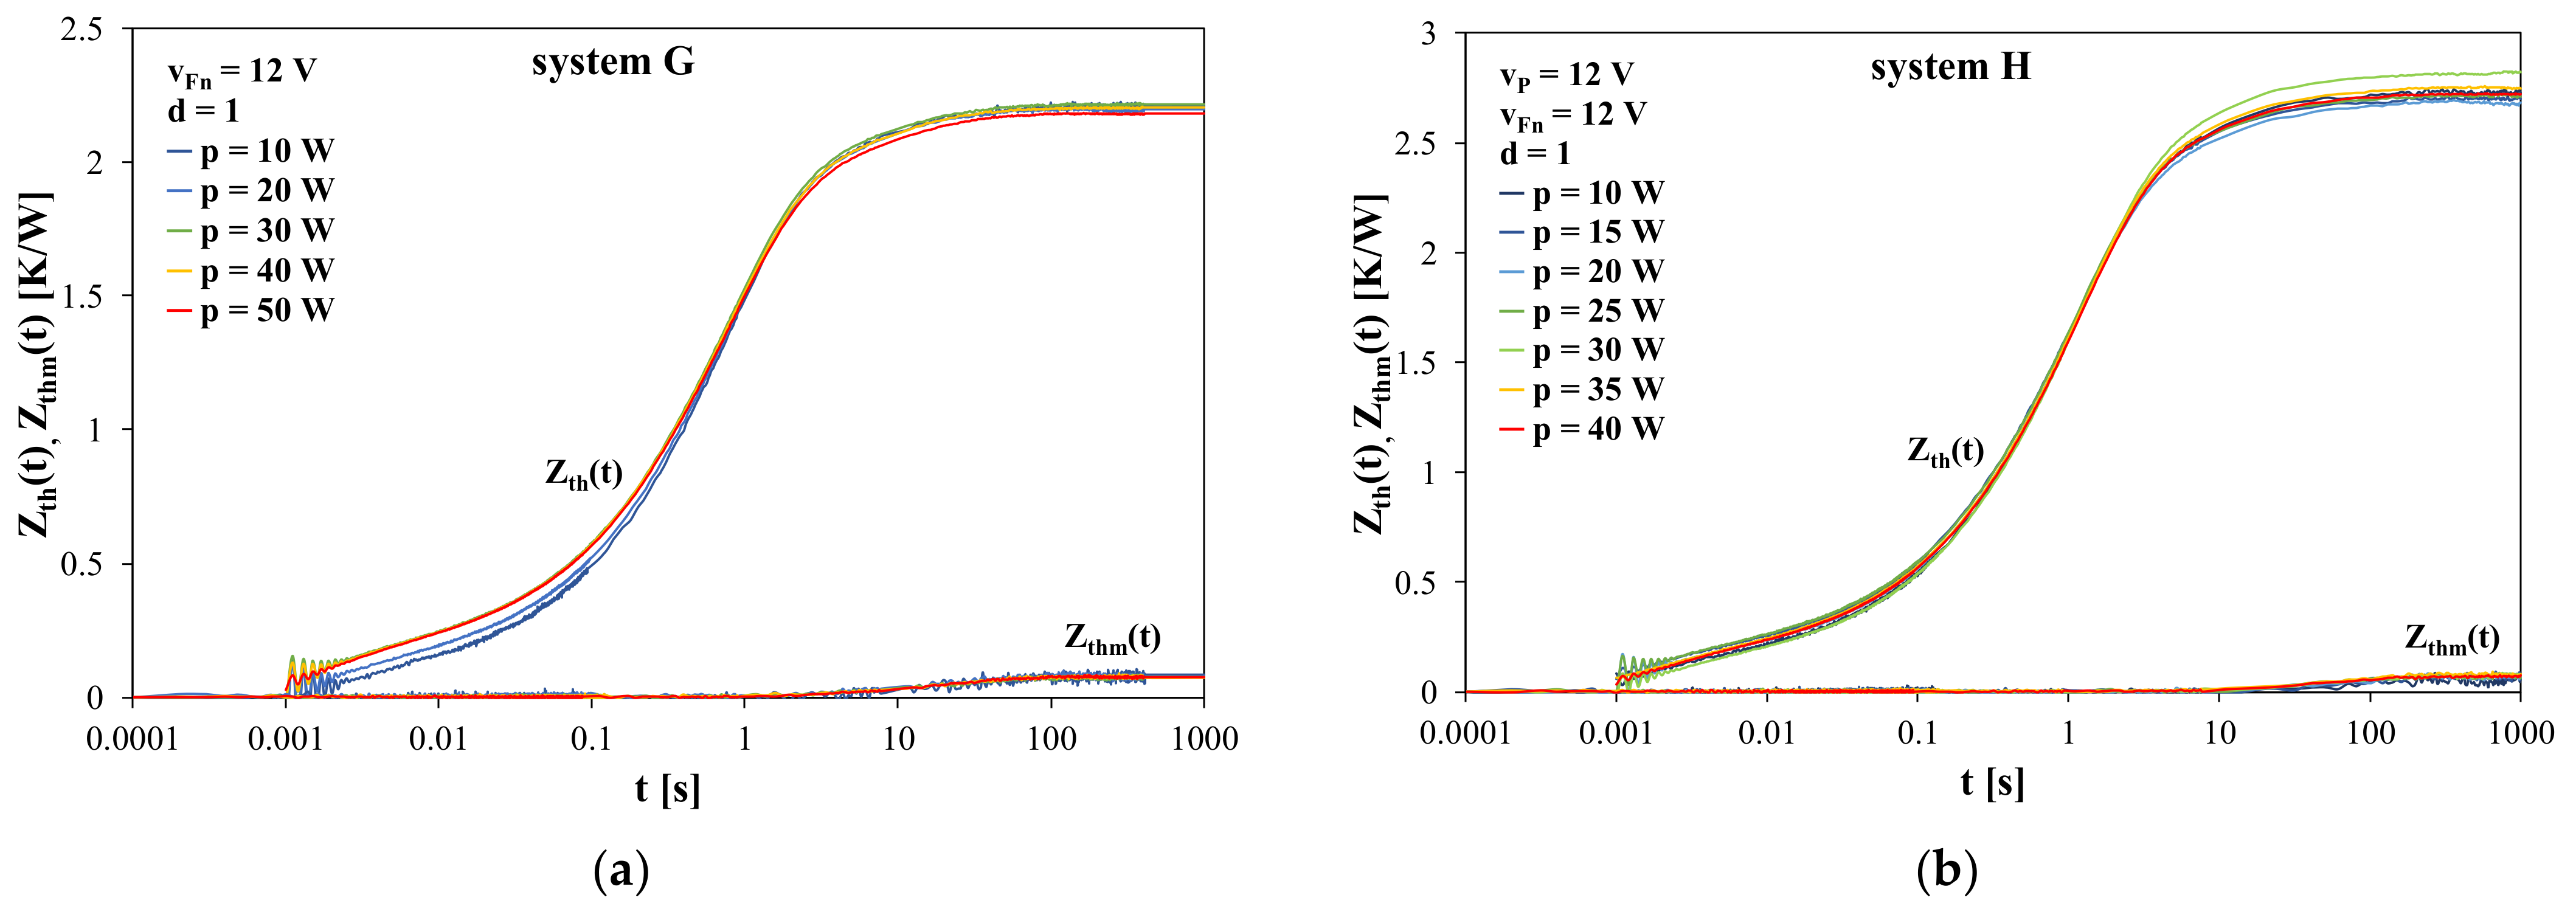
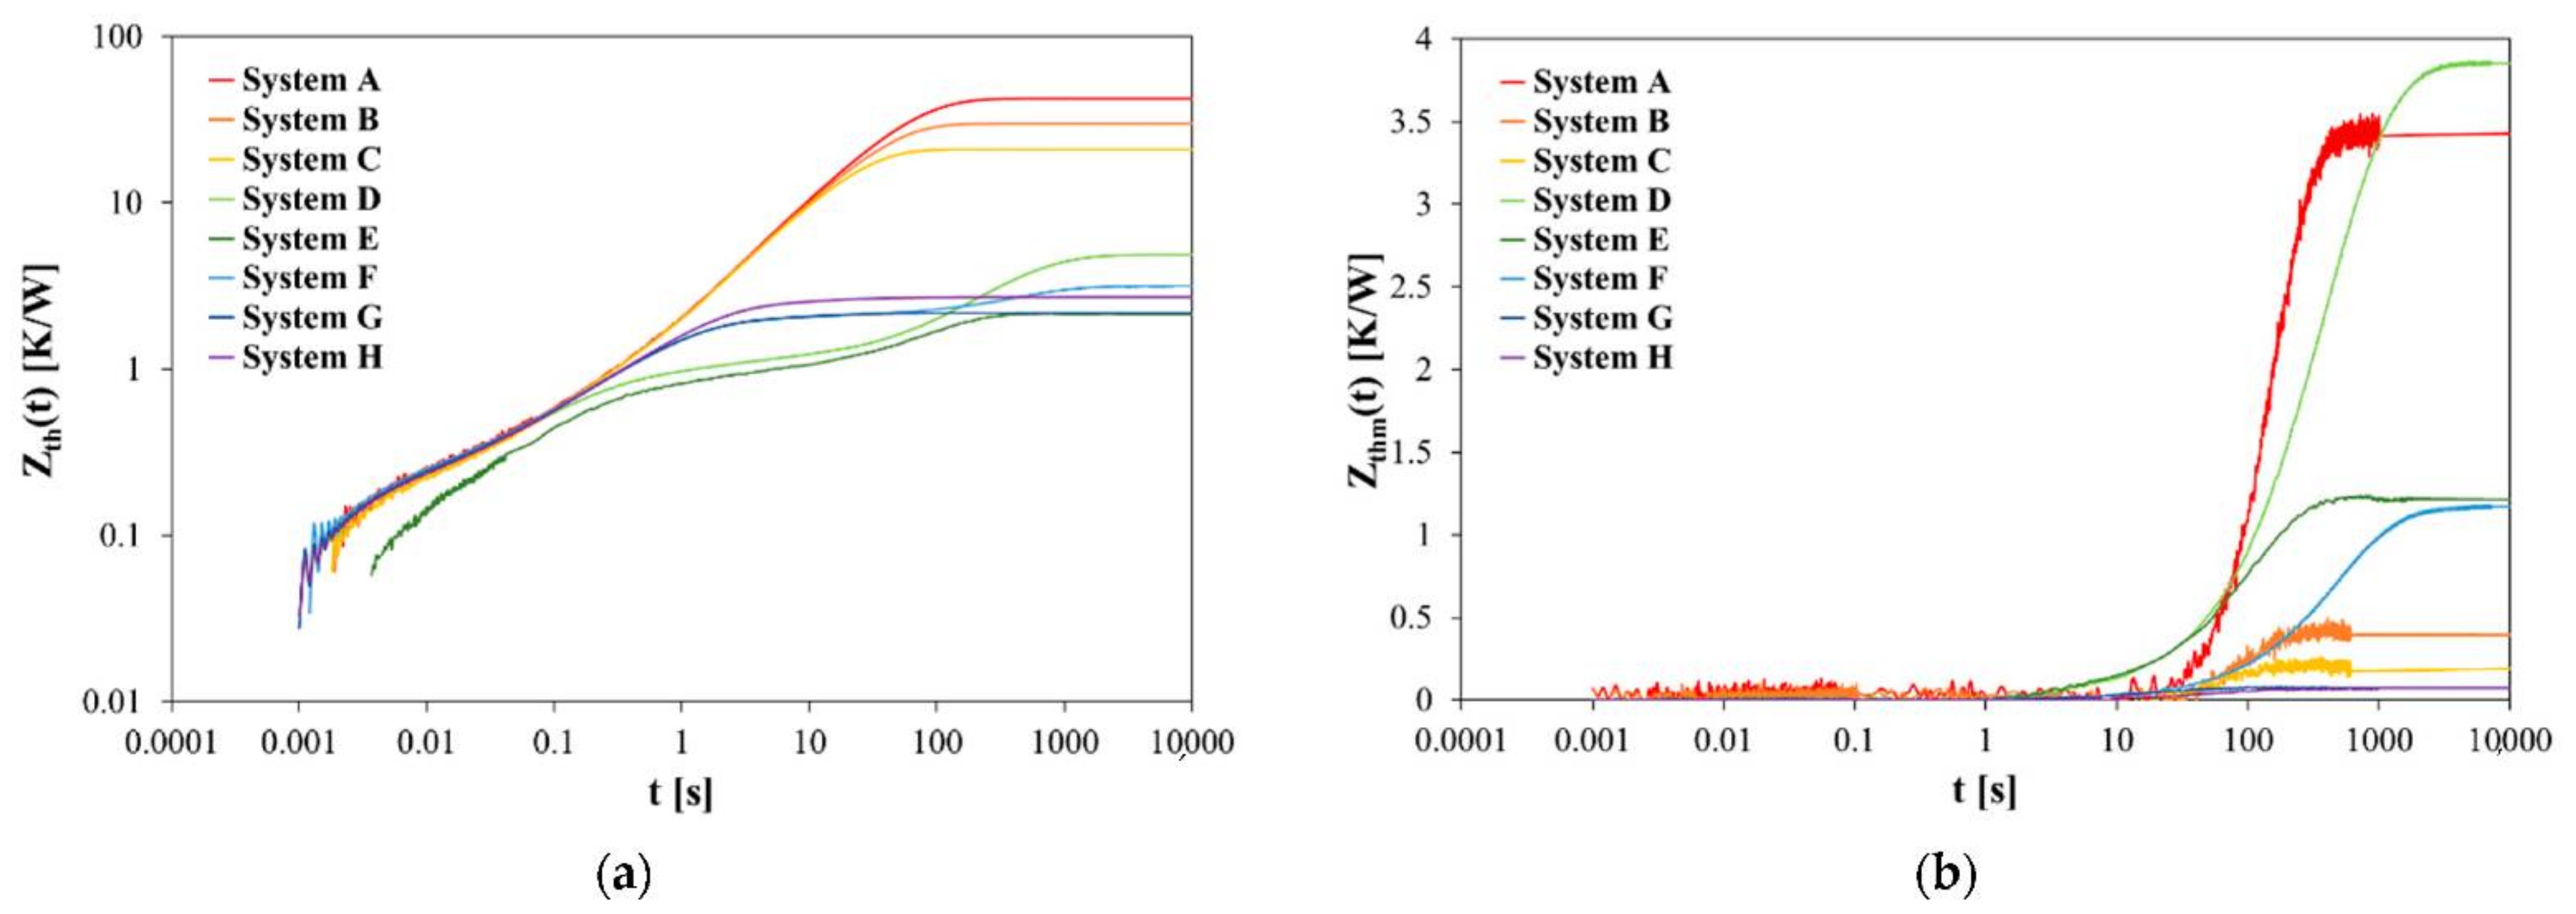
4.1. Waveforms of Transient Thermal Impedances Zth(t) and Zthm(t) of the Investigated MOSFETs

The waveforms of the self- and transfer-transient thermal impedances, Zth(t) and Zthm(t), of the investigated MOSFETs working with different cooling systems and measured at various levels of power dissipated in transistor M1 are presented in Figure 7, Figure 8, Figure 9 and Figure 10.
Figure 7 shows the waveforms of Zth(t) and Zthm(t) for the cooling systems A–C. In all three of these cooling systems, the tested transistors were connected to each other only through the PCB, to which they were soldered.
As can be seen, in all three of these cooling systems there is a slight influence of power on both the Zth(t) and Zthm(t) waveforms for the time t > 20 s. For time t < 20 s in each of the tested systems, the waveforms Zth(t) coincide and the effect of the power that was dissipated is not visible. It should be assumed that in this time interval the conductivity was the dominant mechanism of heat dissipation from the transistor die. For t > 20 s, with an increase in temperature, the convection and radiation were seen to be more and more important.
The weak dependence of Rth on the dissipated power is probably due to the small heat transfer area from the transistor case. This has little influence in increasing the convection efficiency as the temperature difference between the case surface and the surroundings increases. The influence of the level of power on the values of Rth and Rthm will be discussed in detail in Section 4.4.
The thermal coupling between the transistors was strongest in system A and definitely weaker in systems B and C. This is due to the fact that the transistors are thermally coupled mainly through the board, to which they are soldered. In systems B and C, the forced convection with a fan caused very effective cooling for both the transistor cases and the PCB on which they are mounted. The heat that dissipated in transistor M1 was removed mainly by this convection and very little of this heat was removed by heat convection via the PCB. Therefore, the increase in the internal temperature of transistor M2 was very small in these systems.
The heating of transistor M2 began only after a time that was equal to several tens of seconds from the beginning of the power dissipation in transistor M1. The time of establishing the waveform in each of the considered systems was shorter for Zth(t) than for Zthm(t) and the differences were as high as 50%. The settling time for all of the waveforms decreased with an increase in the cooling efficiency and was the shortest for system C. At the steady state, the values of Zth(t) were the highest in system A and the lowest in system C. These values differ by almost double. The steady-state values for the waveforms Zthm(t) changed similarly, but for system C they were twenty times lower than those of system A.
In systems D and F–H, the tested transistors were mounted on a common substrate with thermal conductivity that was much greater than the thermal conductivity of the laminate, to which they were soldered. In systems D and F, the heat sinks were cooled with the use of free convection and in systems G and H the cooling was forced by the operation of the fans. Figure 8 shows the waveforms Zth(t) and Zthm(t) of the tested transistors in systems D and F and the waveforms of systems G and H in Figure 9.
As can be seen in Figure 8a, similarly to systems A–C, the power that was dissipated in transistor M1 did not affect the value of Zth(t) for time t < 200 s and likewise in system E for time t < 1 s. In system D there was a strong influence of power on both Zth(t) and Zthm(t) at the steady state. This is because the heat was conducted through the heat sink material and dissipated away from its large surface area. In this case, the effectiveness of free convection increased with the temperature of the heat sink [14]. The high value of Zthm(t) is due to the heat transfer between the transistors through the heat sink. On the other hand, in system F, the influence of the power on Zth(t) and Zthm(t) was much weaker than in system D. This is probably due to the fact that heat was much more efficiently removed from transistor M1 as a result of the phase transformation that was taking place in the thermal tubes. This heat was carried from the area of transistor M1 in the form of vapor to the condenser section, where it was released to the surroundings. In such a situation, despite mounting both of the transistors on a common PCB, the heat was conducted from transistor M1 to M2 mainly through the thin tube walls and the capillary structure with which the tubes were covered on the inside. The temperature of transistor M1 was set in system D after approx. 2000 s and in system F after approx. 1000 s.
In turn, as shown in Figure 9, the power that was dissipated in transistor M1 did not significantly affect the waveforms Zth(t) or Zthm(t) in the whole considered power range. Despite the fact that both of the tested transistors were mounted on a common base, the thermal coupling of transistors M1 and M2 is very weak. The time that was indispensable to obtain the steady state of the temperature of transistor M1 was much shorter in the systems that are under consideration compared to systems A–D and F. This time amounts to approx. 100 s. The internal temperature of transistor M2 in system G increased for time t > 2 s and in system H for t > 10 s.
In order to compare the dynamic properties of all of the considered cooling systems, the measured waveforms of Zth(t) and Zthm(t) are shown in Figure 10. For each cooling system, the waveform of the measured parameter was selected at the power value corresponding to the highest value of the internal temperature that was obtained in the considered cooling system.
As can be seen in Figure 10a, for time t < 0.2 s, the waveforms Zth(t) for all of the cooling systems practically coincide. This is justified, because in this respect the cooling process is determined by the thermal properties of the case of the tested transistors. The settling time of the waveform of Zth(t) was the shortest in systems G and H which were using liquid cooling and is only 2 s. The longest settling time of about 1000 s was obtained with system F that was operating with free cooling. It can also be seen that when the considered cooling systems were used it was possible to obtain the values of the thermal resistance in the range from 1.5 K/W for system G to over 40 K/W for system A.
In Figure 10b, it can be seen that the waveform in the delay time Zthm(t) with respect to Zth(t) ranges from 1 s for system G to 20 s for system F. The steady state values of Zthm(t) include ranges from 0.1 K/W for system H to 3.8 K/W for system D.

4.2. The Influence of the Fans’ Supply Conditions on Thermal Parameters of the Investigated MOSFETs

In systems B, C and E, the parameter that was determining the fan’s supply conditions was its supply voltage vFn and in system G it was the duty cycle d of the PWM signal that was supplying the fan. Both of these parameters determine the fan’s rotational speed ω and the air flow speed that is cooling the tested transistors. Such dependences are presented in Figure 11. The speed of the air flow is linearly dependent on the rotational speed of the fan.
Figure 12 shows the effect of the fan’s supply voltage in systems B and C on the waveforms Zth(t) and Zthm(t).
As can be seen, the fan’s supply voltage significantly influenced the waveforms Zth(t) for time t > 10 s. This is due to the increased efficiency of the convection with an increase in the air flow velocity. With an increase in the voltage that was supplying the fan for both of the transistors, the time to reach the steady state was also shortened.
The influence of voltage vFn on waveforms Zthm(t) is also important. In the tested cooling systems, the forced air flow significantly weakened the thermal coupling. In system B, the thermal coupling between the transistors can be considered negligible at voltage vFn > 6 V and in system C at vFn > 4 V. It is also worth noting that the value of Zth(t) in the steady state changed twice when changing the fan’s supply voltage in system C.
Figure 13a shows the influence of the fan’s supply voltage in system E and Figure 12b shows the effect of the duty cycle of the PWM signal that was supplying the fans in system G on waveforms Zth(t) and Zthm(t).
As can be seen in Figure 13, in both of the considered cooling systems, the fan supply conditions did not affect the waveforms Zth(t) or Zthm(t) in the time interval t < 50 s in system E and t < 20 s in system G. The fan’s power supply was important for time t > 50 s in system E and t > 20 s in system G. With an increase in the voltage vFn, the time for determining the considered waveforms of transistor M1 in system E was significantly reduced—from approx. 2000 s to approx. 800 s. Similarly, an increase in the value of the duty cycle d shortened the settling time in system G from approx. 2000 s to 80 s. It is also worth noticing that a change in the fan’s supply voltage in the considered range caused very big changes in the value of Zth(t) and Zthm(t) at the steady state in both of the considered cooling systems. Particularly big changes concern the value of Zthm(t). This change reached 400% in system E and as much as 1300% in system G.

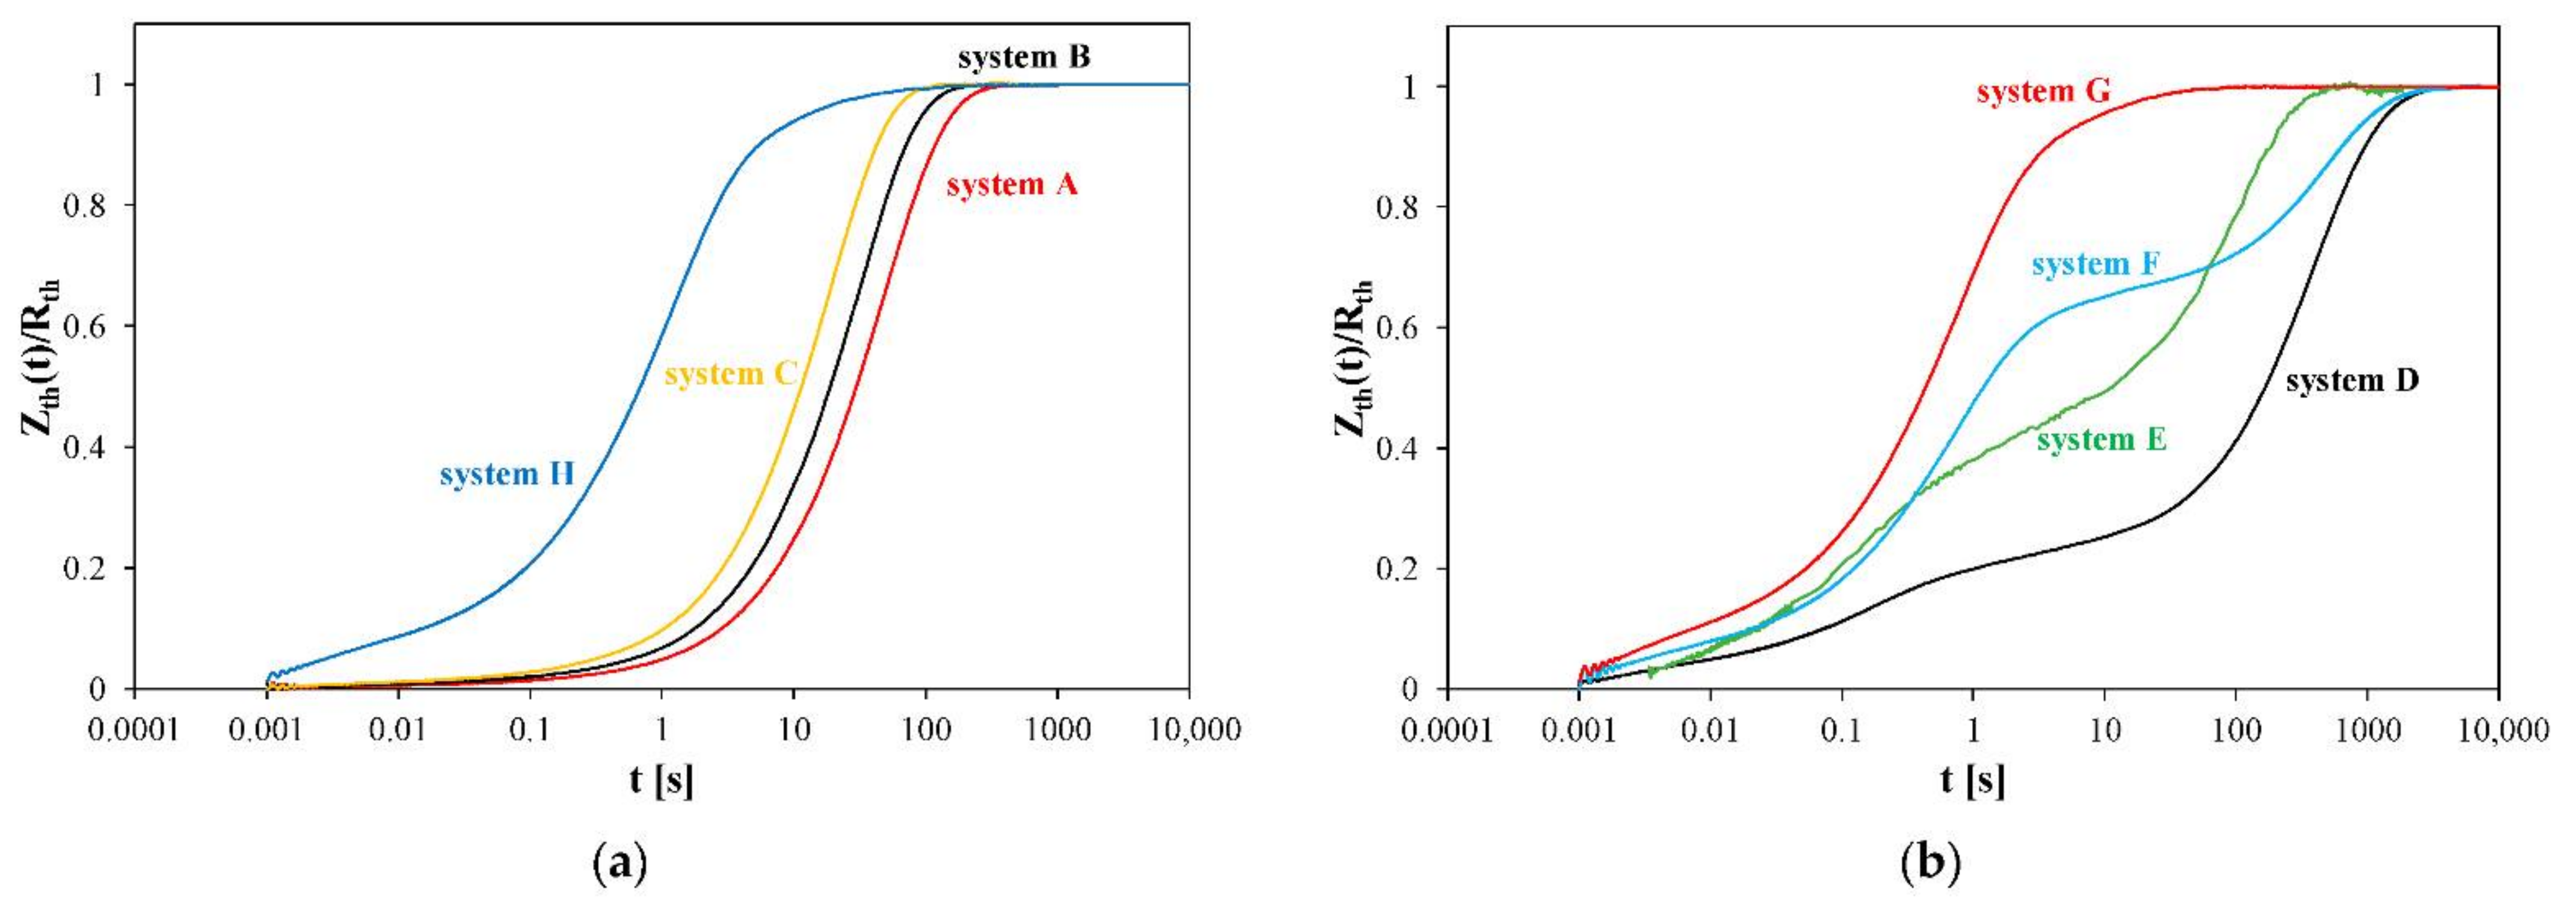
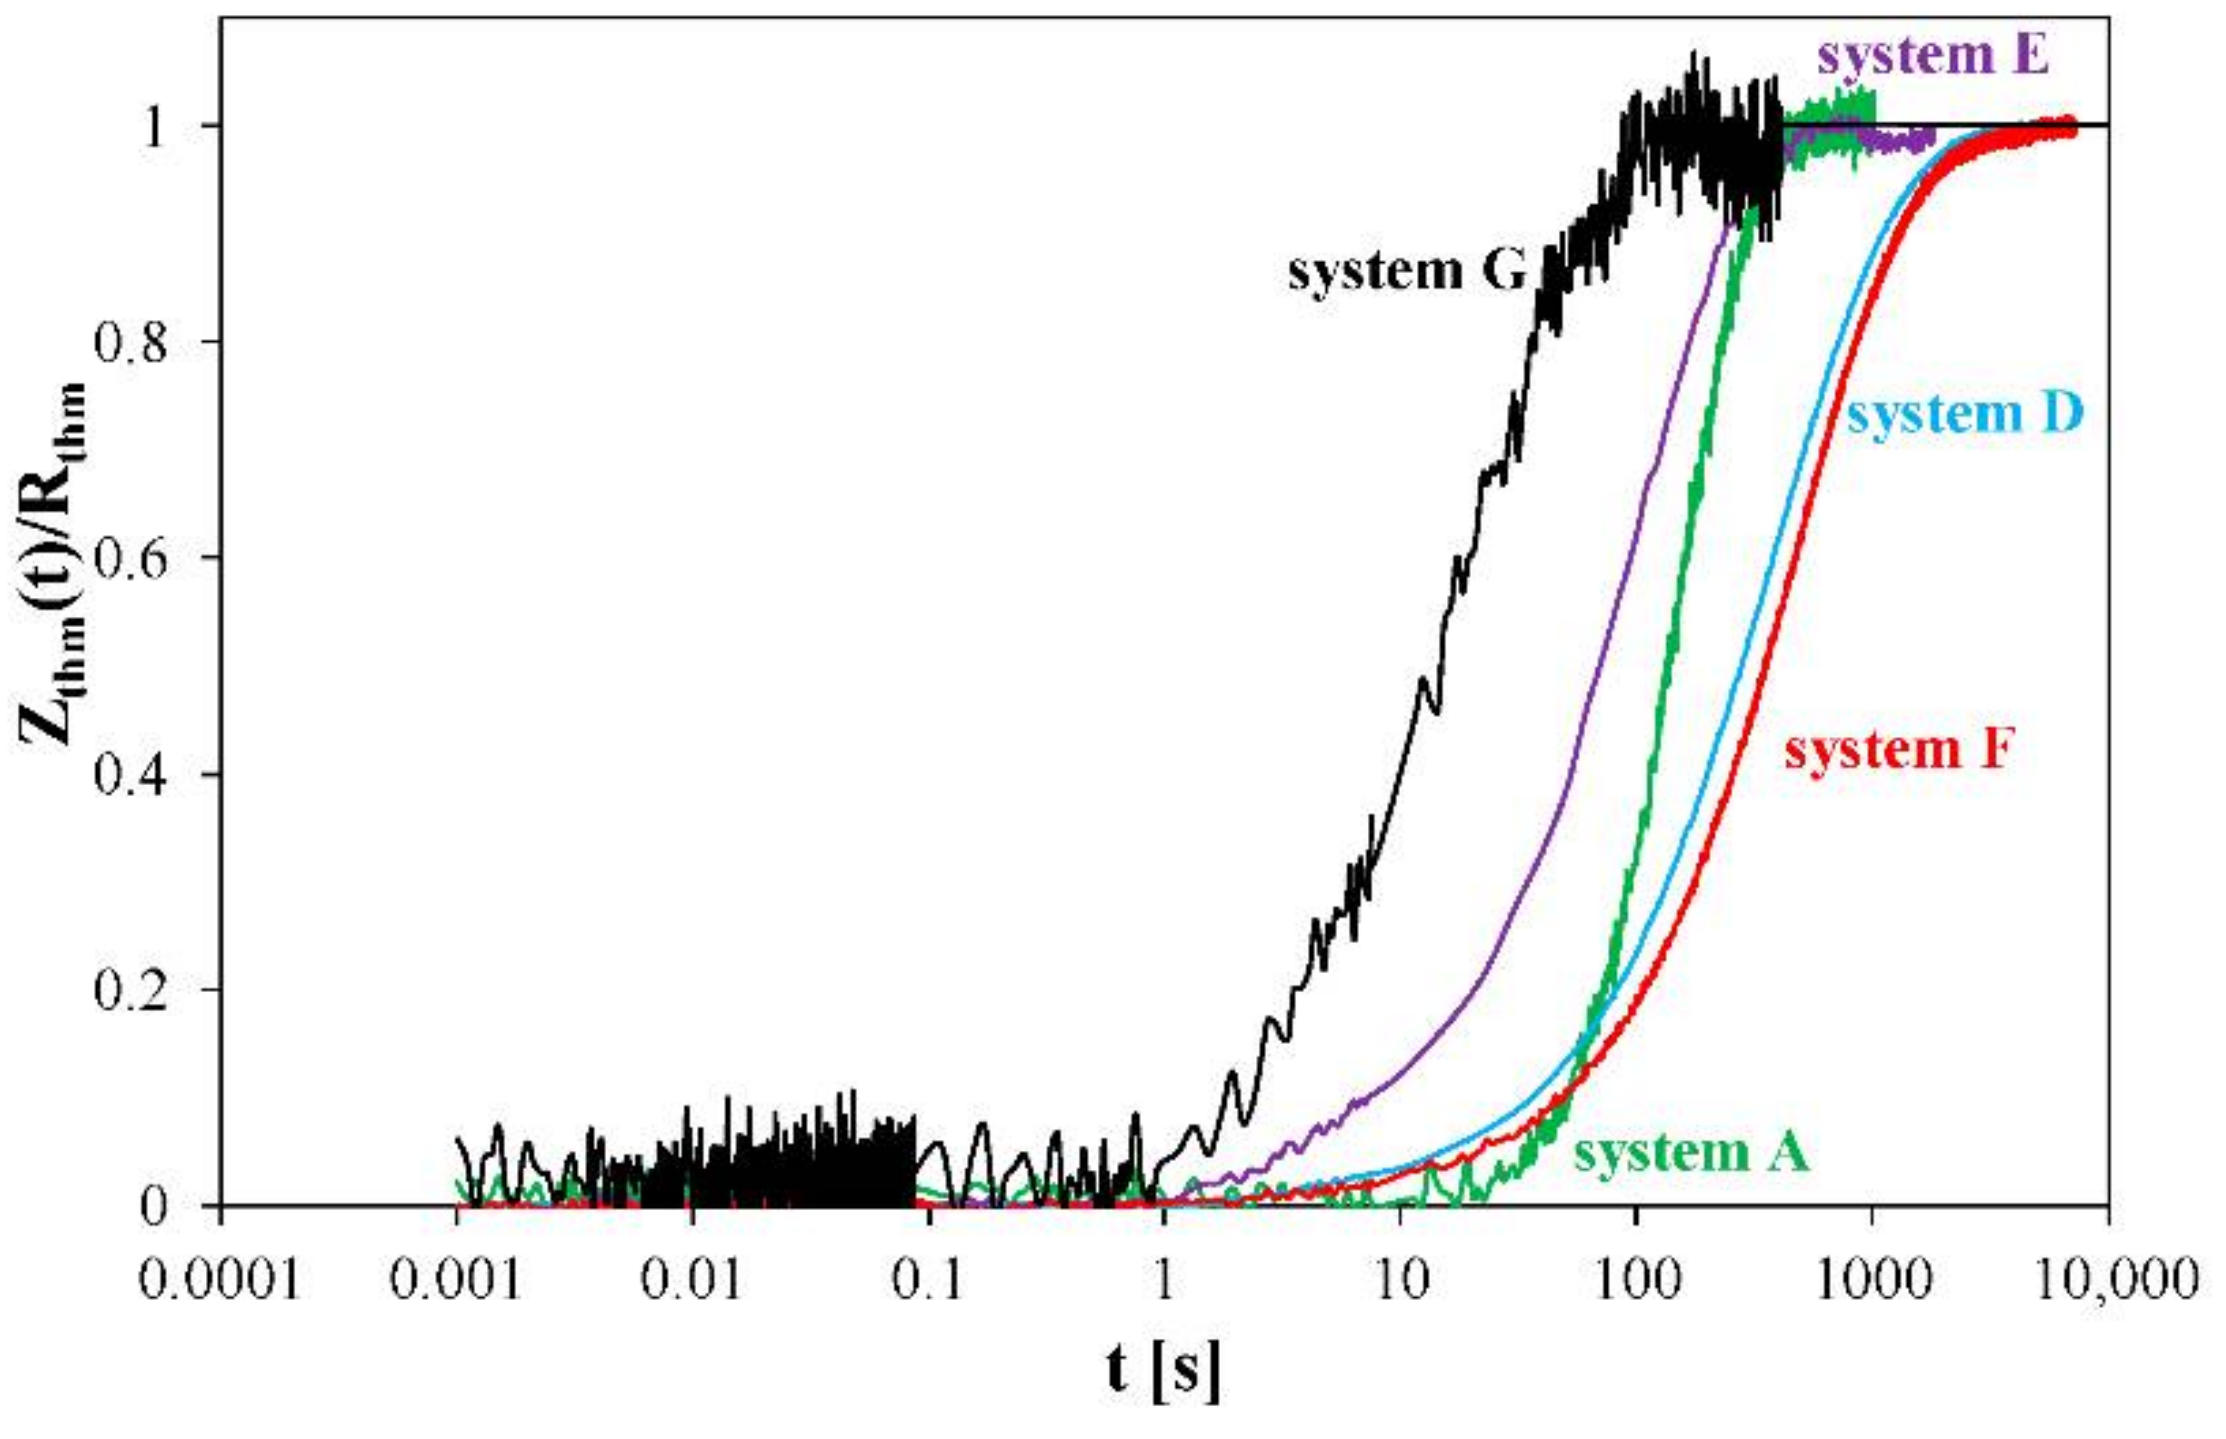
4.3. Influence of the Cooling System on Thermal Time Constants

In order to compare the influence of the cooling system on the thermal time constants that occurred in the description of Zth(t) of the cooling systems that are under consideration, the waveforms Zth(t) in the cooling systems normalised to Rth are shown in Figure 14.
As can be seen in Figure 14a, the normalised waveforms Zth(t)/Rth that were determined for cooling systems A–C and H have very similar shapes. This proves that an identical number of thermal time constants describing these waveforms and the visible shifts between these waveforms indicate the differences between the values of these time constants. Regarding the dominant thermal time constant, to which the ai coefficient corresponds, its highest value occurs for system A and its lowest for system H.
In turn, it can be seen in Figure 14b that there are additional thermal time constants for cooling systems DF. The number of thermal time constants was reduced when using system G, which can be seen in Figure 14b.
Figure 15 shows the waveforms of the transfer-transient thermal impedances Zthm(t) normalised to the transfer thermal resistance Rthm.
For all of the considered cooling systems, the delay of the waveforms Zthm(t)/Rthm in relation to the waveforms Zth(t)/Rth, ranging from 1 to several seconds, is visible. This results from the thermal inertia that is caused by the transistor case. It can also be seen that, in the description of the waveforms Zthm(t), there is one dominant thermal time constant, the value of which depends on the cooling system that was used, and it ranges from a few to several hundred seconds.

4.4. Influence of Selected Factors on Thermal Resistance

The thermal properties of the considered thermally steady state transistors are characterised by their self- (Rth) and transfer-thermal (Rthm) resistances. The values of these parameters depend on the cooling system that was used, the power conditions for the tested transistors and the power supply conditions for the active components of the cooling system. These relationships for the individual cooling systems are shown in Figure 16, Figure 17 and Figure 18.
Figure 16 shows the dependences of the Rth and Rthm of the tested transistors on the power p that was dissipated in transistor M1. In these figures, the relationships Rth(p) are marked with continuous lines and relationships Rthm(p) are marked with dashed lines. The presented dependences are determined for the different ranges of the changes of the power p that was dissipated in transistor M1. This range was limited at the bottom by the minimum power value ensuring an acceptable measurement error value that was determined in accordance with the considerations given in [31]. In turn, the maximum value of the power p was determined by the maximum permissible value of the internal temperature of the tested transistors that was provided by the manufacturer. The results that are presented for systems G and H refer to the maximum considered rotational speed of the fan.
When analysing the presented research results, it is worth noting that in systems A, D and F the relationships Rth(p) and Rthm(p) are decreasing functions. The greatest changes in the values of Rth and Rthm were obtained for system D—they reached up to 20%. For systems B and G, the considered dependences are increasing functions. In systems C and H, the power had a slight influence on the values of Rth and Rthm. It is also worth noticing that for systems B, C, G and H the values of Rthm were much lower (more than twenty times) than the values of Rth. In such a case, it can be concluded that, for these cooling systems, the mutual thermal couplings between the tested transistors can be ignored, because the temperature increase inside the transistor that is caused by these couplings does not exceed 3 °C.
The dependence of the considered thermal resistances on power p and the rotational speed of the fans ω can be described by the empirical formula of the form:
R th = R th 0 + R th 1 · exp p p 0 · 1 + β th ω · exp ω ω 0
where Rth0, Rth1, βthω, p0 and ω0 are the model parameters. The values of parameters Rth0, Rth1, p0, βthω and ω0 depend on the configuration of the investigated cooling system. For the passive cooling systems, βthω was equal to zero and the formula became much simpler.
The values of the parameters describing the relationships Rth(p, ω) and Rthm(p, ω) are collected in Table 1 and Table 2.
As is visible in Table 1 and Table 2, the values of the parameter Rth0 that are describing self-thermal resistance are much higher than those of this parameter that are describing transfer-thermal resistance, by up to 70 times. The highest values of this parameter were obtained from the characterisation of Rth in system A. Parameter Rth1 describes the range of the change values of Rth and Rthm at the changes in the value of the dissipated power. The values of this parameter were higher for the cooling systems without any fan (systems A, D, F and H). The parameter p0 characterizes the slope of the dependences Rth(p) and Rthm(p). In turn, parameter βth0 describes the range of change values of Rth and Rthm at the changes in the rotational speed of the fan, whereas ω0 characterizes the slope of these dependences. The values of parameter βth0 were higher (in the case of system G, much higher) for the dependence Rthm(ω) than for Rth(ω).
Figure 17 shows the dependences Rth(p) and Rthm(p) that were calculated from the formula Equation (4) (denoted by lines) and measured (denoted by points) and Figure 18 shows the relationships Rth(ω) and Rthm(ω) for the tested cooling systems.
As can be seen, good agreement was obtained between the results of the calculations and measurements for all of the considered cooling systems. For the results that are presented in Figure 17, the differences between the measured and computed values do not exceed 3% (for system B) for Rth and 6% (for system F) for Rthm. In turn, for the results that are presented in Figure 18, the differences between the results of the measurements and computations do not exceed 5% and are the greatest for system B.
It is worth noticing that the use of an appropriate cooling system enables the reduction of the thermal resistance value from over 40 K/W to only 2 K/W, which is only 1 K/W higher than the thermal resistance that is declared by the manufacturer between the semiconductor die and the case. In Figure 17 it can be seen that the influence of the power p on the value of Rth depends on the cooling system that was used. Figure 17b shows that Rthm is a strongly decreasing power function.
In turn, Figure 18 indicates that an increase in the fan’s rotational speed caused a significant decrease in Rth and Rthm. For systems B and C, this change amounted to 30%, for system E it amounted to 50%, and for system G it amounted to 30%. In the case of systems B, C and G, the value of Rthm was much lower than the value Rth, while for system E the difference between Rth and Rthm was constant and equal to the value Rthj-c of the tested transistors.

5. Conclusions

In the present paper the results of the investigations concerning the selection of a cooling system on the thermal parameters of two thermally coupled power MOSFETs are presented. The investigations were performed using transistors in TO-220 cases mounted on the common PCB. These transistors were cooled by different passive and active cooling systems. With the use of the indirect electrical method the waveforms of the self and transfer transient thermal impedances of these transistors were measured. The influence of each cooling system on the thermal parameters of these transistors is presented and discussed. Additionally, the influence of the dissipated power and the rotational speed of the fan was investigated in each cooling system.
On the basis of the obtained measurement results, an analytical formula describing the influence of the dissipated power in passive systems as well as the influence of the power and the rotational speed of the fans at work in active cooling systems was proposed. The correctness of the proposed formula was verified experimentally for each of the considered cooling systems. The proposed formula allows the description of both the self- and transfer-thermal resistances of the investigated transistors. A very good match of the results of the measurements to the calculations was obtained.
It was shown that for some cooling systems the influence of thermal couplings can be omitted due to a very low value of transfer thermal resistance. This is true especially in the case of active cooling systems with a fan that is operating at a high rotational speed. The use of modern cooling systems that are based on heat pipes makes it possible to reduce the value of the thermal resistance by up to 20 times. Such systems allow the reduction of the value of the junction-ambient thermal resistance to a value that is about two times higher than the maximum value of the thermal resistance junction-case of the investigated transistors as declared by the producer.
The results of the investigations that are presented in the present paper can be applied to other power semiconductor devices. These results can be used by designers of power electronic circuits and designers of cooling systems of power semiconductor devices. By using the proposed dependence and the obtained results of the investigations it is possible to reduce the exploitation cost of the considered active cooling systems by limiting the power that is consumed by the fans. For each of the analysed systems, the maximum value of the rotational speed ω of the fan was observed over which a decrease in the thermal resistance was not observed. Limiting the value of ω can reduce the considered cost.
The investigations, the results of which were presented in this study, should be continued in two directions. Firstly, the parameters occurring in Equation (4) should be described by the mechanical parameters of the considered cooling systems. Secondly, the results that were obtained using the compact thermal model should be compared to the results of computations that are performed using the finite element method.

Author Contributions

Conceptualisation, K.G.; methodology, K.G. and K.P.; validation, K.G. and K.P.; investigation, K.P.; writing—original draft preparation, K.G. and K.P.; writing—review and editing, K.G. and K.P.; visualisation, K.P.; supervision, K.G. All authors have read and agreed to the published version of the manuscript.

Funding

This project was financed within the program of the Ministry of Science and Higher Education called “Regionalna Inicjatywa Doskonałości” in the years 2019–2022, under project number 006/RID/2018/19 and with a sum of financing 11 870 000 PLN.

Institutional Review Board Statement

Not applicable.

Informed Consent Statement

Not applicable.

Data Availability Statement

Data available by request.

Conflicts of Interest

The authors declare no conflict of interest.

Nomenclature

a1, b1coefficients of the function approximating the thermometric characteristic Tj(vGS)
a2, b2coefficients of the function approximating the thermometric characteristic Tj(vF2)
aiweight coefficients related to thermal time constants τthi
I1drain current of transistor M1
iFncurrent supplying the fan
iPcurrent supplying the heat-pump
Nthe number of thermal time constants
ttime
ppower dissipated in transistor M1
p0, Rth0, Rth1, βthω, ω0parameters describing the dependence Rth(p,ω)
Rthself-thermal resistance
Rthmtransfer-thermal resistance
Taambient temperature
Tjdevice internal temperature
VDS1drain-source voltage of transistor M1
vGSgate-source voltage of transistor M1
vF2forward voltage of the body diode of transistor M2
vFnvoltage supplying the fan
vPvoltage supplying the heat-pump
Zth(t)self-transient thermal impedance
Zthm(t)transfer-transient thermal impedance
τthithermal time constants
ωrotational speed of the fan

References

  1. Perret, R. Power Electronics Semiconductor Devices; John Wiley & Sons: Hoboken, NJ, USA, 2009. [Google Scholar]
  2. Rashid, M.H. Power Electronic Handbook; Academic Press: Cambridge, MA, USA; Elsevier: Amsterdam, The Netherlands, 2007. [Google Scholar]
  3. Kazimierczuk, M.K. Pulse-width Modulated DC-DC Power Converters; John Wiley & Sons, Ltd.: Hoboken, NJ, USA, 2008. [Google Scholar]
  4. Avenas, Y.; Dupont, L.; Khatir, Z. Temperature measurement of power semiconductor devices by thermo-sensitive electrical parameters—A review. IEEE Trans. Power Electron. 2012, 27, 3081–3092. [Google Scholar] [CrossRef] [Green Version]
  5. Górecki, P.; Górecki, K. Methods of Fast Analysis of DC-DC Converters—A Review. Electronics 2021, 10, 2920. [Google Scholar] [CrossRef]
  6. Górecki, P.; Górecki, K. Measurements and computations of internal temperatures of the IGBT and the diode situated in the common case. Electronics 2021, 10, 210. [Google Scholar] [CrossRef]
  7. Schweitzer, D.; Ender, F.; Hantos, G.; Szabo, P.G. Thermal transient characterization of semiconductor devices with multiple heat-sources—Fundamentals for a new thermal standard. Microelectron. J. 2015, 46, 174–182. [Google Scholar] [CrossRef]
  8. Bagnoli, P.E.; Casarosa, C.; Ciampi, M.; Dallago, E. Thermal resistance analysis by induced transient (TRAIT) method for power electronic devices thermal characterization. IEEE Trans. Power Electron. 1998, 13, 1208–1219. [Google Scholar] [CrossRef]
  9. Castellazzi, A.; Kraus, R.; Seliger, N.; Schmitt-Landsiedel, D. Reliability analysis of power MOSFET’s with the help of compact models and circuit simulation. Microelectron. Reliab. 2002, 42, 1605–1610. [Google Scholar] [CrossRef]
  10. Ciappa, M.; Carbognami, F.; Cora, P.; Fichtner, W. A novel thermomechanics-based lifetime prediction model for cycle fatigue failure mechnisms in power semiconductors. Microelectron. Reliab. 2002, 42, 1653–1658. [Google Scholar] [CrossRef]
  11. Szekely, V. A new evaluation method of thermal transient measurement results. Microelectron. J. 1997, 28, 277–292. [Google Scholar] [CrossRef]
  12. Blackburn, D.L. Temperature measurements of semiconductor devices—A review. In Proceedings of the Twentieth Annual IEEE Semiconductor Thermal Measurement and Management Symposium, San Jose, CA, USA, 11 March 2004; pp. 70–80. [Google Scholar]
  13. Posobkiewicz, K.; Górecki, K. Influence of selected factors on thermal parameters of the components of forced cooling systems of electronic devices. Electronics 2021, 10, 340. [Google Scholar] [CrossRef]
  14. Liebhard, J.H., IV; Liebhard, J.H., V. A Heat Transfer Textbook, 3rd ed.; Phlogiston Press: Cambridge, MA, USA, 2008. [Google Scholar]
  15. Scognamillo, C.; Catalano, A.P.; Lasserre, P.; Duchesne, C.; D’Alessandro, V.; Castellazzi, A. Combined experimental-FEM investigation of electrical ruggedness in double-sided cooled power modules. Microelectron. Reliab. 2020, 114, 113742. [Google Scholar] [CrossRef]
  16. Vassighi, A.; Sachdev, M. Thermal and Power Management of Integrated Circuits; Springer Science & Business Media: New York, NY, USA, 2006. [Google Scholar]
  17. De Mey, G.; Kos, A.; Górecki, K. Optimal temperature regulation of integrated circuits with Peltier heat pumps. Energies 2022, 15, 1125. [Google Scholar] [CrossRef]
  18. Zając, P.; Napieralski, A. Novel thermal model of microchannel cooling system designed for fast simulation of liquid-cooled ICs. Microelectron. Reliab. 2018, 86, 245–258. [Google Scholar] [CrossRef]
  19. DC Cooling Fan with 80 mm × 80 mm × 25 mm Series; TITAN Technology Ltd. Available online: https://www.titan-cd.com/en/product/DC-Cooling-Fan-with-80mm-x-80mm-x-25mm-Series/TFD-8025xxxx.html (accessed on 7 February 2022).
  20. Technical Data of Extruded Heat-Sink Stonecold. Available online: https://www.tme.com/jp/en/details/rad-a4240_50/heatsinks/stonecold (accessed on 7 February 2022).
  21. Technical Data of Electrolube HTC Heat Transfer Compound. Available online: https://electrolube.com/product/htc-non-silicone-heat-transfer-compound (accessed on 7 February 2022).
  22. Datasheet of Thermally Conductive Pad Fisher Elektronik KAP 220 G. Available online: https://www.fischerelektronik.de/web_fischer/en_GB/$catalogue/fischerData/PR/KAP220G_/datasheet.xhtml?branch=heatsinks (accessed on 7 February 2022).
  23. Specification Sheet of Freezer 34 eSports DUO. Available online: https://www.arctic.de/media/44/41/f0/1584088927/spec_sheet_Freezer_34_eSports_DUO_191106_r3_EN.pdf (accessed on 7 February 2022).
  24. Available online: https://www.enermaxeu.com/products/cpu-cooling/liquid-cooling/aquafusion/aquafusion-models/black/aquafusion (accessed on 7 February 2022).
  25. Górecki, K.; Zarębski, J. Modeling the influence of selected factors on thermal resistance of semiconductor devices. IEEE Trans. Compon. Packag. Manuf. Technol. 2014, 4, 421–428. [Google Scholar] [CrossRef]
  26. Catalano, A.P.; Scognamillo, C.; d’Alessandro, V.; Castellazzi, A. Numerical Simulation and Analytical Modeling of the Thermal Behavior of Single- and Double-Sided Cooled Power Modules. IEEE Trans. Compon. Packag. Manuf. Technol. 2020, 10, 1446–1453. [Google Scholar] [CrossRef]
  27. Chang, Y.; Li, W.H.; Luo, H.Z.; He, X.N.; Iannuzzo, F.; Blaabjerg, F.; Lin, W.X. A 3D Thermal Network Model for Monitoring Imbalanced Thermal Distribution of Press-Pack IGBT Modules in MMC-HVDC Applications. Energies 2019, 12, 1319. [Google Scholar] [CrossRef] [Green Version]
  28. Górecki, K.; Zarębski, J.; Górecki, P.; Ptak, P. Compact thermal models of semiconductor devices—A review. Int. J. Electron. Telecommun. 2019, 65, 151–158. [Google Scholar]
  29. Yener, Y.; Kakac, S. Heat Conduction; Taylor & Francis: Boca Raton, FL, USA, 2008. [Google Scholar]
  30. Górecki, K.; Górecki, P. Nonlinear Compact Thermal Model of the IGBT Dedicated to SPICE. IEEE Trans. Power Electron. 2020, 35, 13420–13428. [Google Scholar] [CrossRef]
  31. Górecki, K.; Posobkiewicz, K. Selected problems of power MOSFETs thermal parameters measurements. Energies 2021, 14, 8353. [Google Scholar] [CrossRef]
  32. Górecki, K.; Dziurdzia, B.; Ptak, P. The influence of a soldering manner on thermal properties of LED modules. Solder. Surf. Mt. Technol. 2018, 30, 81–86. [Google Scholar] [CrossRef]
  33. Pietruszka, A.; Górecki, P.; Wroński, S.; Illés, B.; Skwarek, A. The Influence of Soldering Profile on the Thermal Parameters of Insulated Gate Bipolar Transistors (IGBTs). Appl. Sci. 2021, 11, 5583. [Google Scholar] [CrossRef]
  34. Technical Data of Data Acquisition Device Series Measurement Computing USB 2404. Available online: https://www.mccdaq.com/PDFs/specs/USB-2404-series-data.pdf (accessed on 29 January 2021).
  35. Posobkiewicz, K.; Data, A.; Górecki, K. Realizacja praktyczna układu do pomiaru parametrów cieplnych tranzystorów MOS mocy. Przegląd Elektrotechniczny 2022, 98, 143–146. [Google Scholar] [CrossRef]
  36. Datasheet of IRF840 HEXFET Power MOSFET. Available online: https://datasheet.octopart.com/IRF840PBF-Vishay-datasheet-35178.pdf (accessed on 7 February 2022).
Figure 1. Diagram of the measurement setup.
Energies 15 02923 g001
Figure 2. Cooling systems (a) A and (b) B and C.
Energies 15 02923 g002
Figure 3. Cooling system (a) D and (b) E.
Energies 15 02923 g003
Figure 4. Cooling system (a) F and (b) G.
Energies 15 02923 g004
Figure 5. Manner of attaching the investigated MOSFETs to the base of the cooling systems F and G.
Energies 15 02923 g005
Figure 6. Cooling system (a) H and (b) the manner of attaching the investigated MOSFETS to the water block of this system.
Energies 15 02923 g006
Figure 7. Self- and transfer-transient thermal impedances Zth(t) and Zthm(t) of the investigated MOSFETs with the cooling system (a) A, (b) B and (c) C.
Energies 15 02923 g007aEnergies 15 02923 g007b
Figure 8. Transient thermal impedances Zth(t) and Zthm(t) of the investigated MOSFETs with the cooling systems (a) D and (b) F.
Energies 15 02923 g008
Figure 9. Transient thermal impedances Zth(t) and Zthm(t) of the investigated MOSFETs with the cooling system (a) G and (b) H.
Energies 15 02923 g009
Figure 10. The (a) self- and (b) transfer-transient thermal impedances of the investigated MOSFETs with all the cooling systems.
Energies 15 02923 g010
Figure 11. Dependences of the rotational speed of the fan (a) used in cooling systems B, C and E on its supply voltage and (b) the fan used in system G on the duty factor of its PWM supply signal.
Energies 15 02923 g011
Figure 12. Transient thermal impedances Zth(t) and Zthm(t) of the investigated MOSFETs with the cooling system (a) B and (b) C.
Energies 15 02923 g012
Figure 13. Self- and transfer-transient thermal impedances of the investigated MOSFETs with the cooling system (a) E and (b) G.
Energies 15 02923 g013
Figure 14. Self-transient thermal impedance waveforms normalised to self-thermal resistance of the investigated MOSFETs for the investigated cooling systems: A, B, C and H (a), D, E, F, G (b).
Energies 15 02923 g014
Figure 15. Transfer-transient thermal impedances normalised to transfer thermal resistance of the investigated MOSFETs for the investigated cooling systems.
Energies 15 02923 g015
Figure 16. Dependences of Rth and Rthm of the investigated MOSFETs with cooling systems (a) A–C, (b) system D and (c) systems F–H on the power dissipated in transistor M1.
Energies 15 02923 g016
Figure 17. Measured and calculated dependences (a) Rth(p) and (b) Rthm(p) for the investigated cooling systems.
Energies 15 02923 g017
Figure 18. Measured and calculated dependences Rth(ω, p) and Rthm(ω, p) for the cooling system (a) B and C, (b) system E and (c) system G.
Energies 15 02923 g018aEnergies 15 02923 g018b
Table 1. Values of Rth(p, ω) model parameters for the tested cooling systems.
SystemRth0 [K/W]Rth1 [K/W]p0 [W]βthωω0 [1/min]
A41.5320-
B30.5110.974100
C21.2110.951020
D4.622.39.9--
E2.20-1.28940
F3.252.55--
G2.16−230.47350
H2.714.83--
Table 2. Values of Rthm(p, ω) model parameters for the tested cooling systems.
SystemRth0 [K/W]Rth1 [K/W]p0 [W]βthωω0 [1/min]
A3.355.70.65--
B0.430.10.57.51200
C0.3121.027.5350
D3.672.59.9--
E1.220-2.311040
F1.22.55--
G0.06−1318.5350
H0.113--
Publisher’s Note: MDPI stays neutral with regard to jurisdictional claims in published maps and institutional affiliations.

