1. Introduction
The growing significance of space cooling is gathering increasing attention [
1]. The demand for cooling is growing due to several factors. Increasing the living standards of the people living in the tropics means they have better access to the increased comfort provided by cooling systems [
2]. Meanwhile, the rise in global temperatures due to climate change creates cooling demand in areas where space cooling conventionally was not needed [
3]. The rise in cooling demand is especially notable in temperate climates such as central and southern Europe [
4]. Increasing urbanisation is likewise causing increased demand for cooling due to the urban heat island effect. The energy needed for space cooling is projected to triple globally between 2019 and 2070 [
1] and increase by 25–50% in Europe between 2010 and 2050 [
5]. Providing affordable, accessible and efficient cooling is, therefore, becoming increasingly important. A recent review article by Khosla et al. [
6] linked cooling to all 17 of the United Nations’ (UN) sustainable development goals (SDG). It should be noted that some of these connections have a negative correlation with one another. For example, improving the accessibility of cooling to boost well-being (SDG 3) and working conditions (SDG 8) can pose a burden on the goal of ensuring clean and affordable energy (SDG 7) [
6]. Balancing these goals is an important consideration from the level of policymaking down to system design.
Heat exposure has also been linked to reduced learning outcomes [
7] and economic productivity [
8,
9]. Three-quarters of humanity will face health risks from heat [
10]. Therefore, it is clear that more and more cooling apparatuses will be installed, not only in new constructions but also in existing buildings. The importance of retrofit projects is recognised in the European Union’s (EU) Green Deal, which lists increasing the energy efficiency of buildings as one of the six key actions required for reaching the EU’s target of climate neutrality by 2050 [
11]. Retrofitting solutions also have a central role in the International Energy Agency’s (IEA) report “Net Zero by 2050” [
12]. The report also stresses the importance of increasing the use of heat pumps and improving the efficiency of cooling systems. To this end, the EU has launched a renovation initiative, which aims to double the rate of energy renovations by 2030, cut buildings’ heating and cooling energy use by 18% and increase the use of renewable and waste heat from 33% to 38–42% from the current levels [
13].
Hot and humid climates have been indicated as an especially significant subject for study, as compounded latent and sensible heat loads pose a particular challenge for cooling systems [
14]. High relative indoor humidity can limit the cooling system’s performance, as was shown in our previous study [
15]. High relative indoor humidity has also been found to be detrimental to thermal comfort and productivity [
16]. While the active cooling technologies that currently dominate the market are well established and have comparatively lower upfront costs, they may come with long-term negative impacts on energy demand and greenhouse gas emissions [
6]. Especially in residential use, an overwhelming majority of cooling systems are split units [
17]. These units use low-temperature chillers that require high temperature lifts and consequently perform considerably worse than more innovative high-temperature cooling systems in terms of energy and exergy efficiency.
Radiant cooling (RC) systems offer a more efficient alternative to split units [
18]. Seshadri et al. [
19] showed that decreasing the chiller’s temperature lift from 29 °C to 21 °C results in a 29% increase in sensible cooling efficiency because the lower exergy destruction in the cooling process leads to an improved coefficient of performance (COP) of the chiller. This improved exergy efficiency is one of the most significant advantages of high-temperature cooling systems, such as RC systems [
14]. However, RC systems’ cooling capacity in humid environments is limited due to the risk of condensation on the panel surfaces [
20]. Several designs have been proposed to combine RC systems with dehumidification to expand their applicability [
20,
21,
22,
23,
24]. These systems can broadly be categorised into two groups: dedicated outdoor air systems (DOAS), where the supply air entering the conditioned space is dehumidified, and systems that include a separate condensing unit inside the conditioned space.
DOAS systems are often large, complex and have comparatively high material and installation costs [
21,
23], which means their application in small-sized buildings is challenging. They also often require embedding components into building structures [
25], limiting their application in retrofit projects. Separate condensing unit designs include an open collector for the condensed water in the conditioned zone, which poses a health hazard [
23]. Furthermore, the dehumidification unit can be positioned either horizontally (in the ceiling), which poses challenges for condensate collection, or vertically (on the wall), leading to suboptimal heat transfer and taking some valuable floor area in the conditioned space, which is inconvenient for the users [
21]. For these reasons, other dehumidification methods that are better suitable for small-scale retrofit projects are needed.
To overcome these shortcomings of radiant cooling systems combined with dehumidification (RCD), Chen and Norford [
26] propose a system where a ground heat exchanger supplies high-temperature cooling to radiant cooling panels to cover the sensible cooling load of the conditioned space. They then compare a range of designs for supply air dehumidification to cover the latent heat load. In the studied low-energy building, their approach provided a high level of thermal comfort with good energy and exergy efficiency, as the RC system covers the sensible cooling load with excellent efficiency. The dehumidification system significantly improves the thermal comfort performance of the system. However, the system’s suitability for older, less efficient buildings and especially in retrofit practice remains an open question. To answer this, a cooling system design following a similar approach is proposed in this study. In the studied system, the radiant cooling panels are supplied directly by the chilled water from the ground. A ground source heat pump served by the same ground heat exchanger supplies a condensing dehumidification system with chilled water.
In this study, the performance of the proposed system was assessed in a representative office building in the Mediterranean climate. The building in question is a small office building in Spain. This research is a part of the EU’s Horizon 2020 project, GEOFIT, and the studied building is one of the pilot sites in the project. This study aims to compare a conventional RC system with the proposed RCD system and quantify their thermal comfort performance as well as energy and exergy use in a typical Mediterranean climate. Finally, a sensitivity analysis is performed to quantify the effect of a number of building parameters on the RCD system’s performance to give guidelines for optimising the design and operation of the system.
2. Methods
2.1. Simulation Software
This study compares the performances of radiant cooling systems supplied by geothermal energy, with and without a dehumidification system. The comparison is conducted using dynamic building energy simulations. Simulations were conducted in IDA-ICE 4.8 (Indoor Climate and Energy) performance simulation program. The physical models of IDA ICE are compliant with industry standards [
27,
28], and the models are successful in replicating the measured values of the parameters of interest [
29,
30].
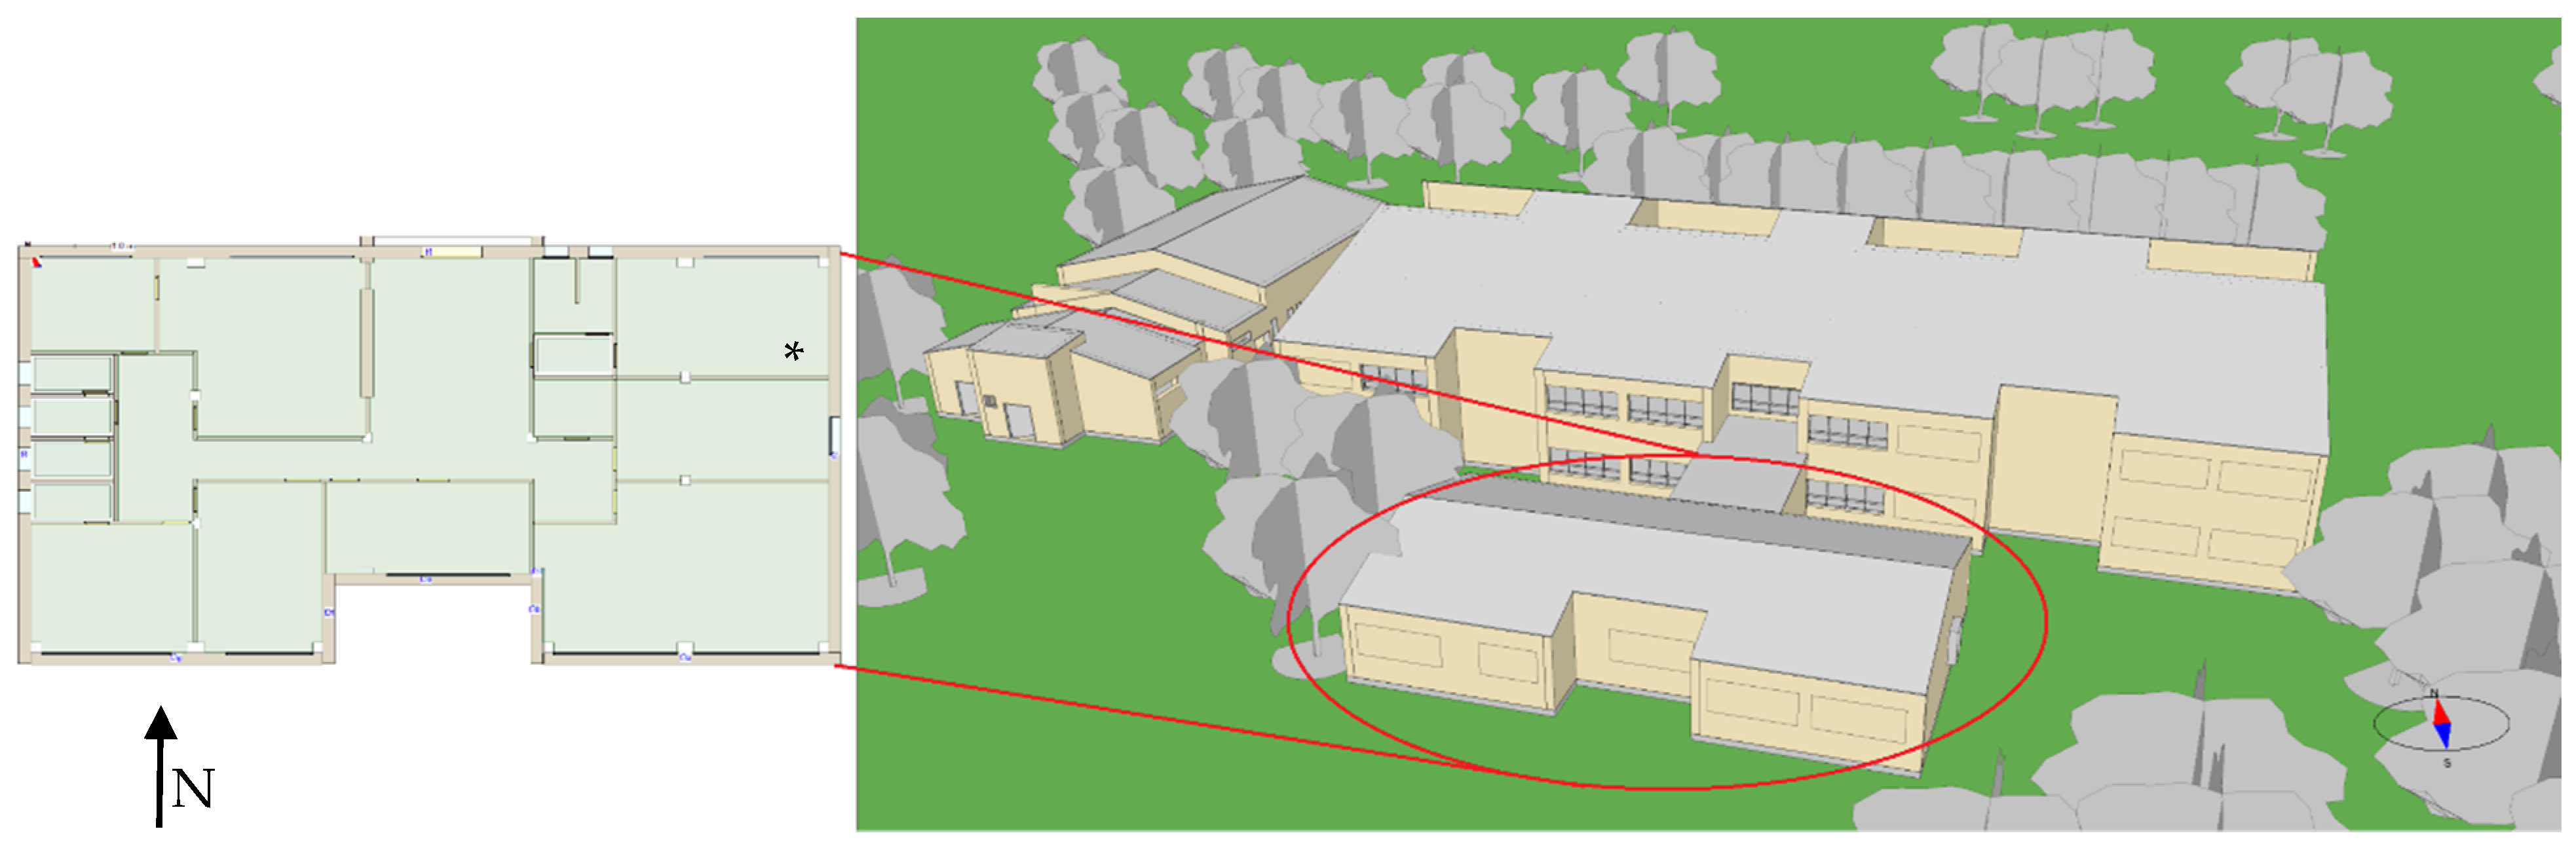
2.2. Building Data Inventory
The one-story office building modelled in the present study has a floor area of 288 m
2 and a conditioned volume of 922 m
3. The building is located in Sant Cugat near Barcelona in Spain and is a part of a three-building school complex. The building complex and the studied building’s floor plan are presented in
Figure 1. The envelope material is bricks, making it a representative sample of the local building stock [
31]. The external walls of the building have been retrofitted with increased insulation. The thermal properties of the building envelope are presented in
Table 1. As a part of the GEOFIT project, a geothermal heating and cooling system will be installed on the site, which presents an opportunity to study the performance of the RC system in practice. The ground heat exchangers are designed to supply heating for the entire building complex and cooling for the studied office building.
2.3. Determination of the Critical Parameters
The physical properties of the building, as well as other modelling parameters, were obtained through measurements and user interviews wherever possible. Where no data were available, the values for the modelling parameters were estimated based on standards and relevant literature. A sensitivity analysis was conducted to quantify the uncertainty related to these estimations. The critical parameters and their sources are presented in
Table 2. Further description regarding selecting the critical parameters can be found in our previous study [
15]. Coefficients for thermal bridges and pressure coefficients for the envelope sections were estimated using the reference values from IDA-ICE. The values used for thermal bridges are consistent with the values used by Evola et al. [
32] and pressure coefficients with those given in [
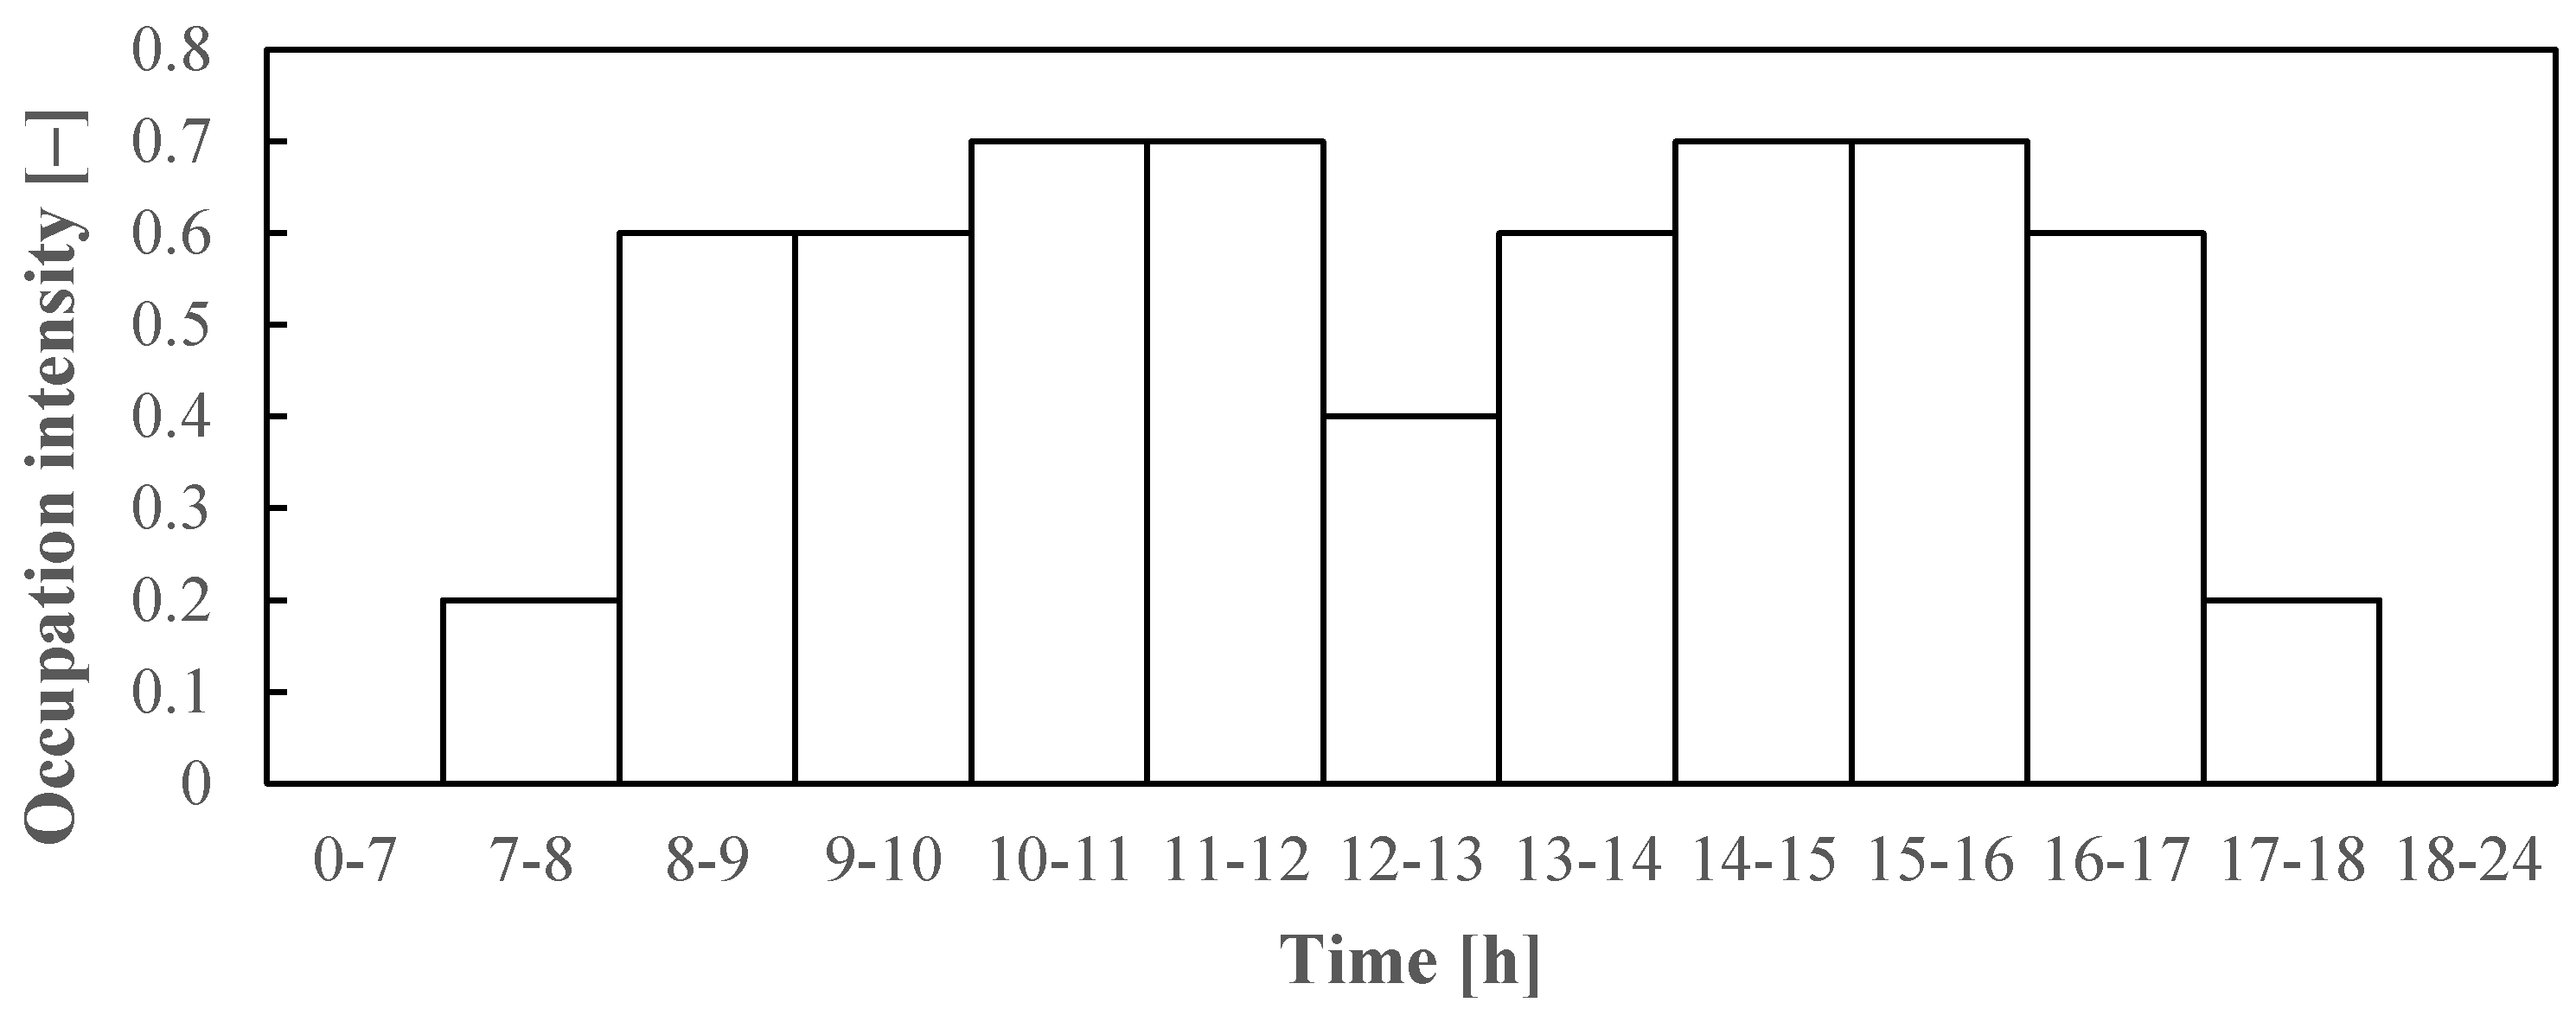
33]. The occupation profile of the building, presented in
Figure 2, is based on results of Ahmed et al. for an office building [
34]. The studied building is occupied during weekdays and empty during weekends.
2.4. Details of the Studied HVAC System
A geothermal energy system supplies the cooling for the studied systems. The geothermal system consists of a ground heat exchanger in a 120 m deep vertical borehole. The ground heat exchanger consists of a PE100RC double U-pipe with an outer diameter of 32 mm. In a thermal response test (TRT) conducted on the site in 2019, the undisturbed ground temperature below the surface layer was established to be stable at 16.6 °C. Based on the data from the TRT, a borehole model was constructed in IDA-ICE following the process described in [
40]. The borehole model of IDA-ICE has been found to be accurate by Arghand et al. [
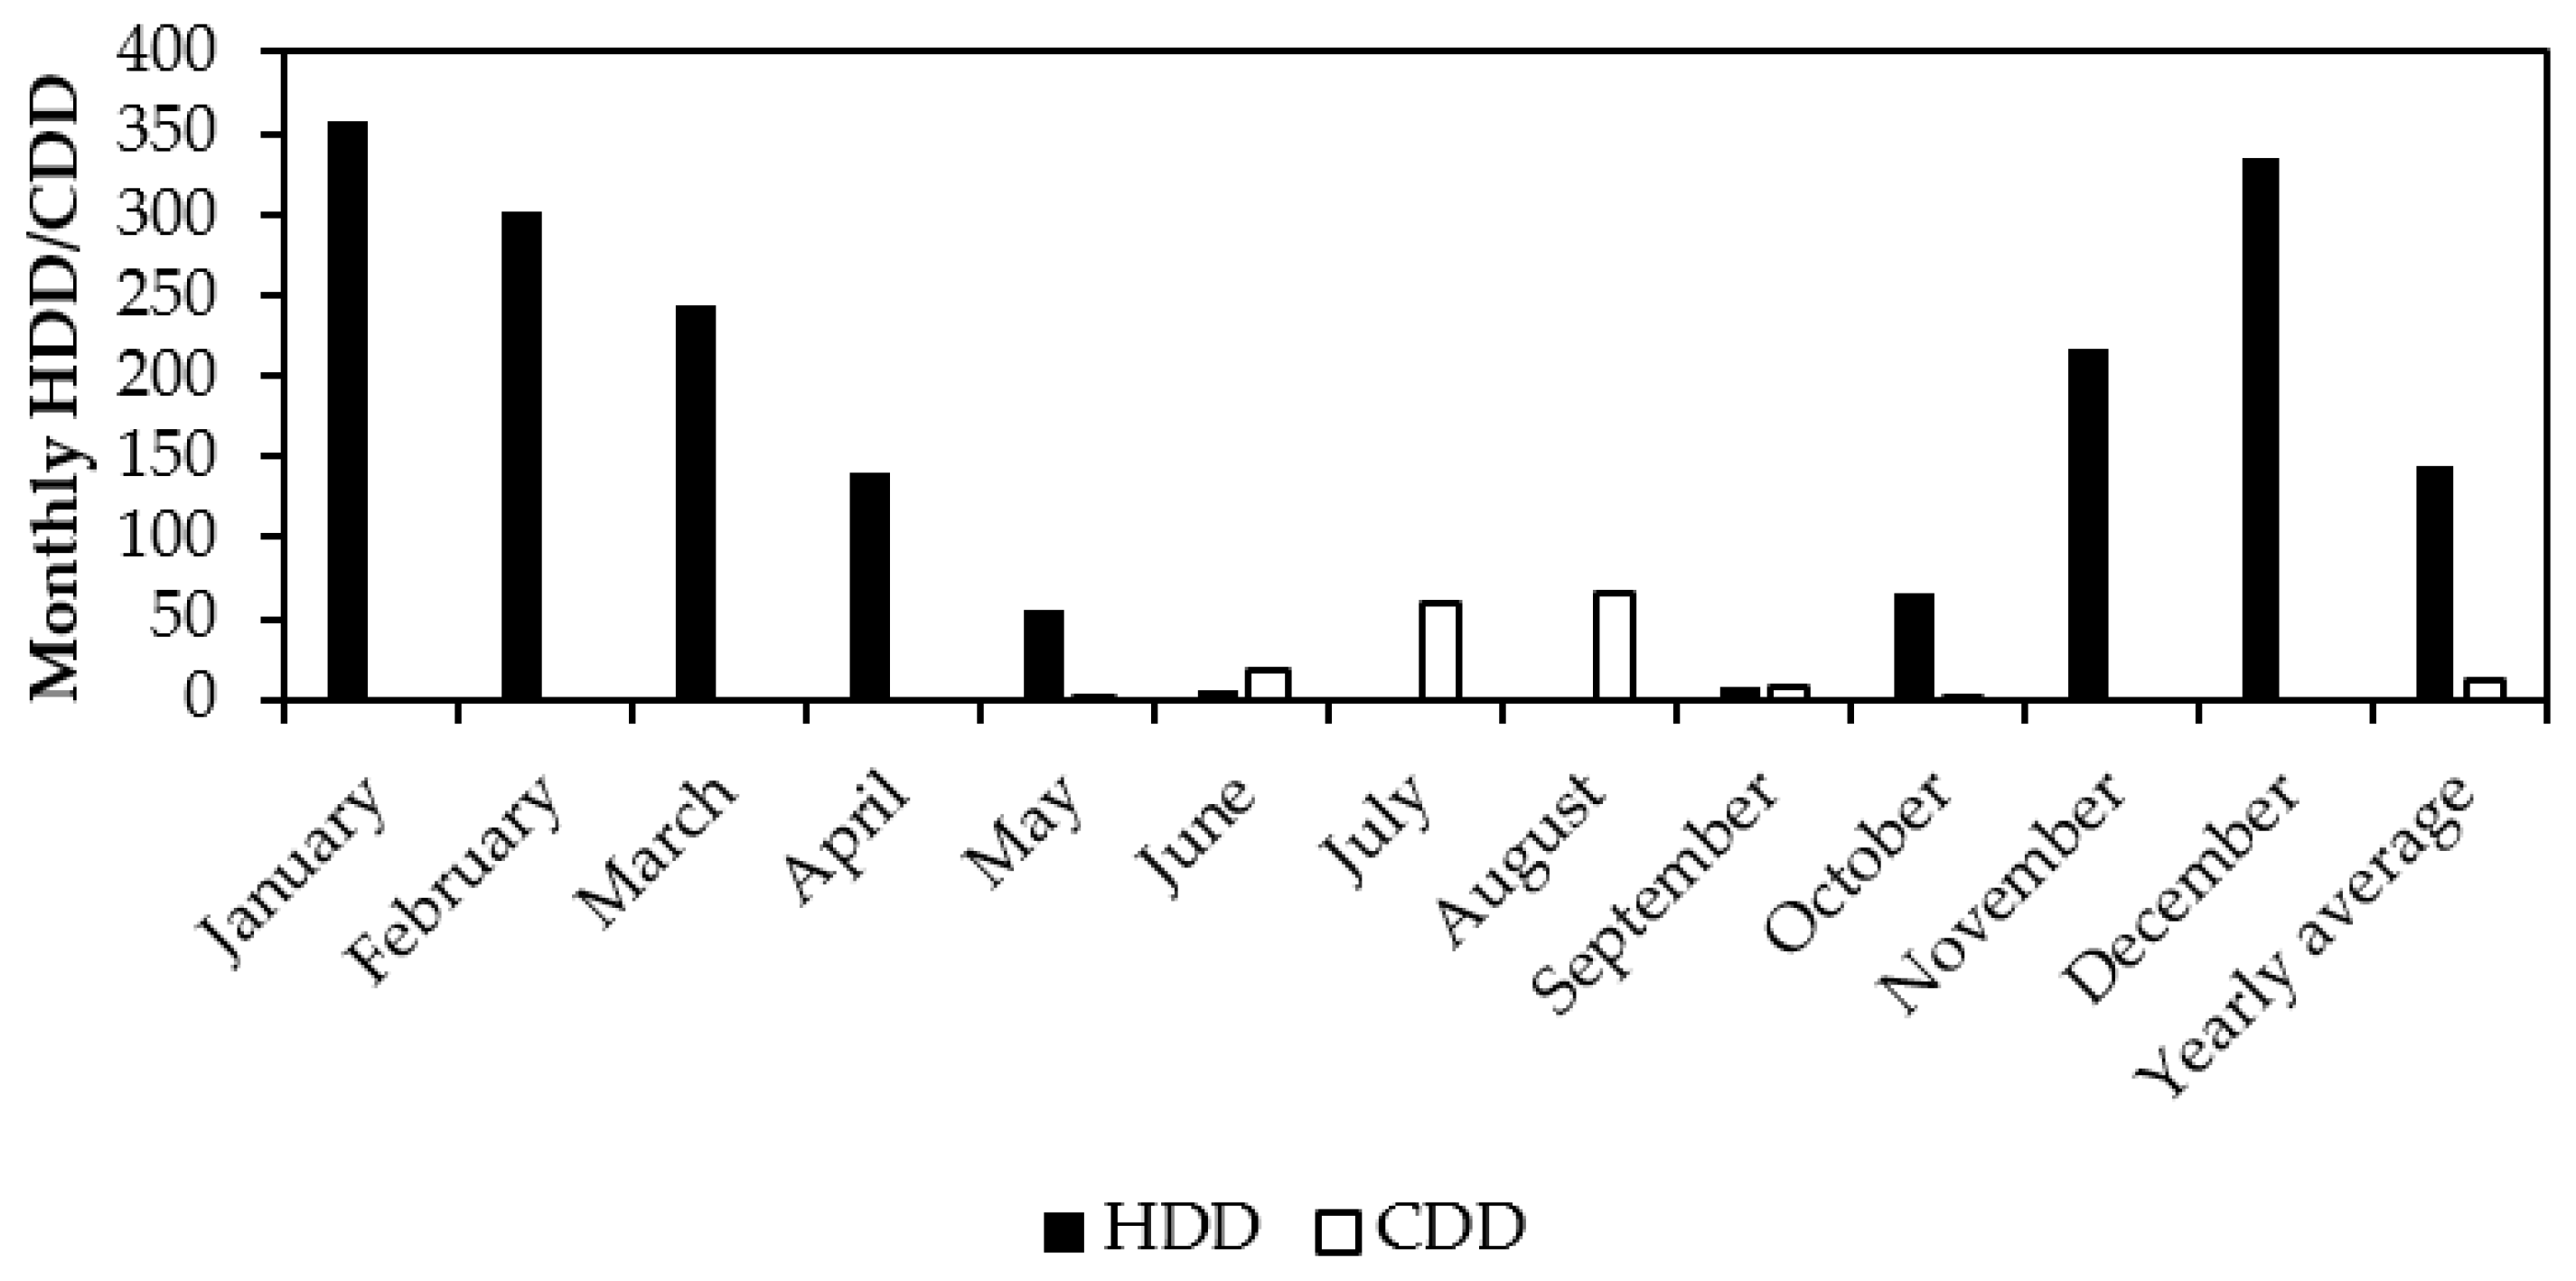
41]. Because the geothermal energy system is used for heating and cooling, and the heating demand on the site is much higher than the cooling demand, the heat extraction from the ground during heating operation will exceed the heat rejection into the ground during cooling operation. This is shown in
Figure 3, which presents the monthly heating and cooling degree days over a year based on Eurostat data from Barcelona between 2011 and 2020 [
42]. Therefore, the deterioration of the ground conditions for cooling over time is not considered in this study. A range of available supply temperatures was included in the sensitivity analysis to quantify the inherent uncertainty of the available cooling resource.
The studied cooling system is a radiant panel system, where the cooling is transferred to the conditioned space via ceiling cooling panels. The studied cooling panels’ technical parameters are based on performance data from a manufacturer of cooling panel products available on the market [
43]. With the baseline supply temperature of 18 °C, indoor temperature set point of 25 °C and the design supply water flow of 17.2 kg/(hm
2panel area), the panels’ cooling capacity is 40 W/m
2panel area according to manufacturer data. This value is in line with heat transfer coefficients found in the literature by Rhee et al. [
14], varying between 7.8 and 13.2 W/(m
2K). The total area of the cooling panels is 182 m
2, corresponding to approximately 70% of the building’s floor area. This yields a nominal cooling capacity of 7280 W (approximately 25 W/m
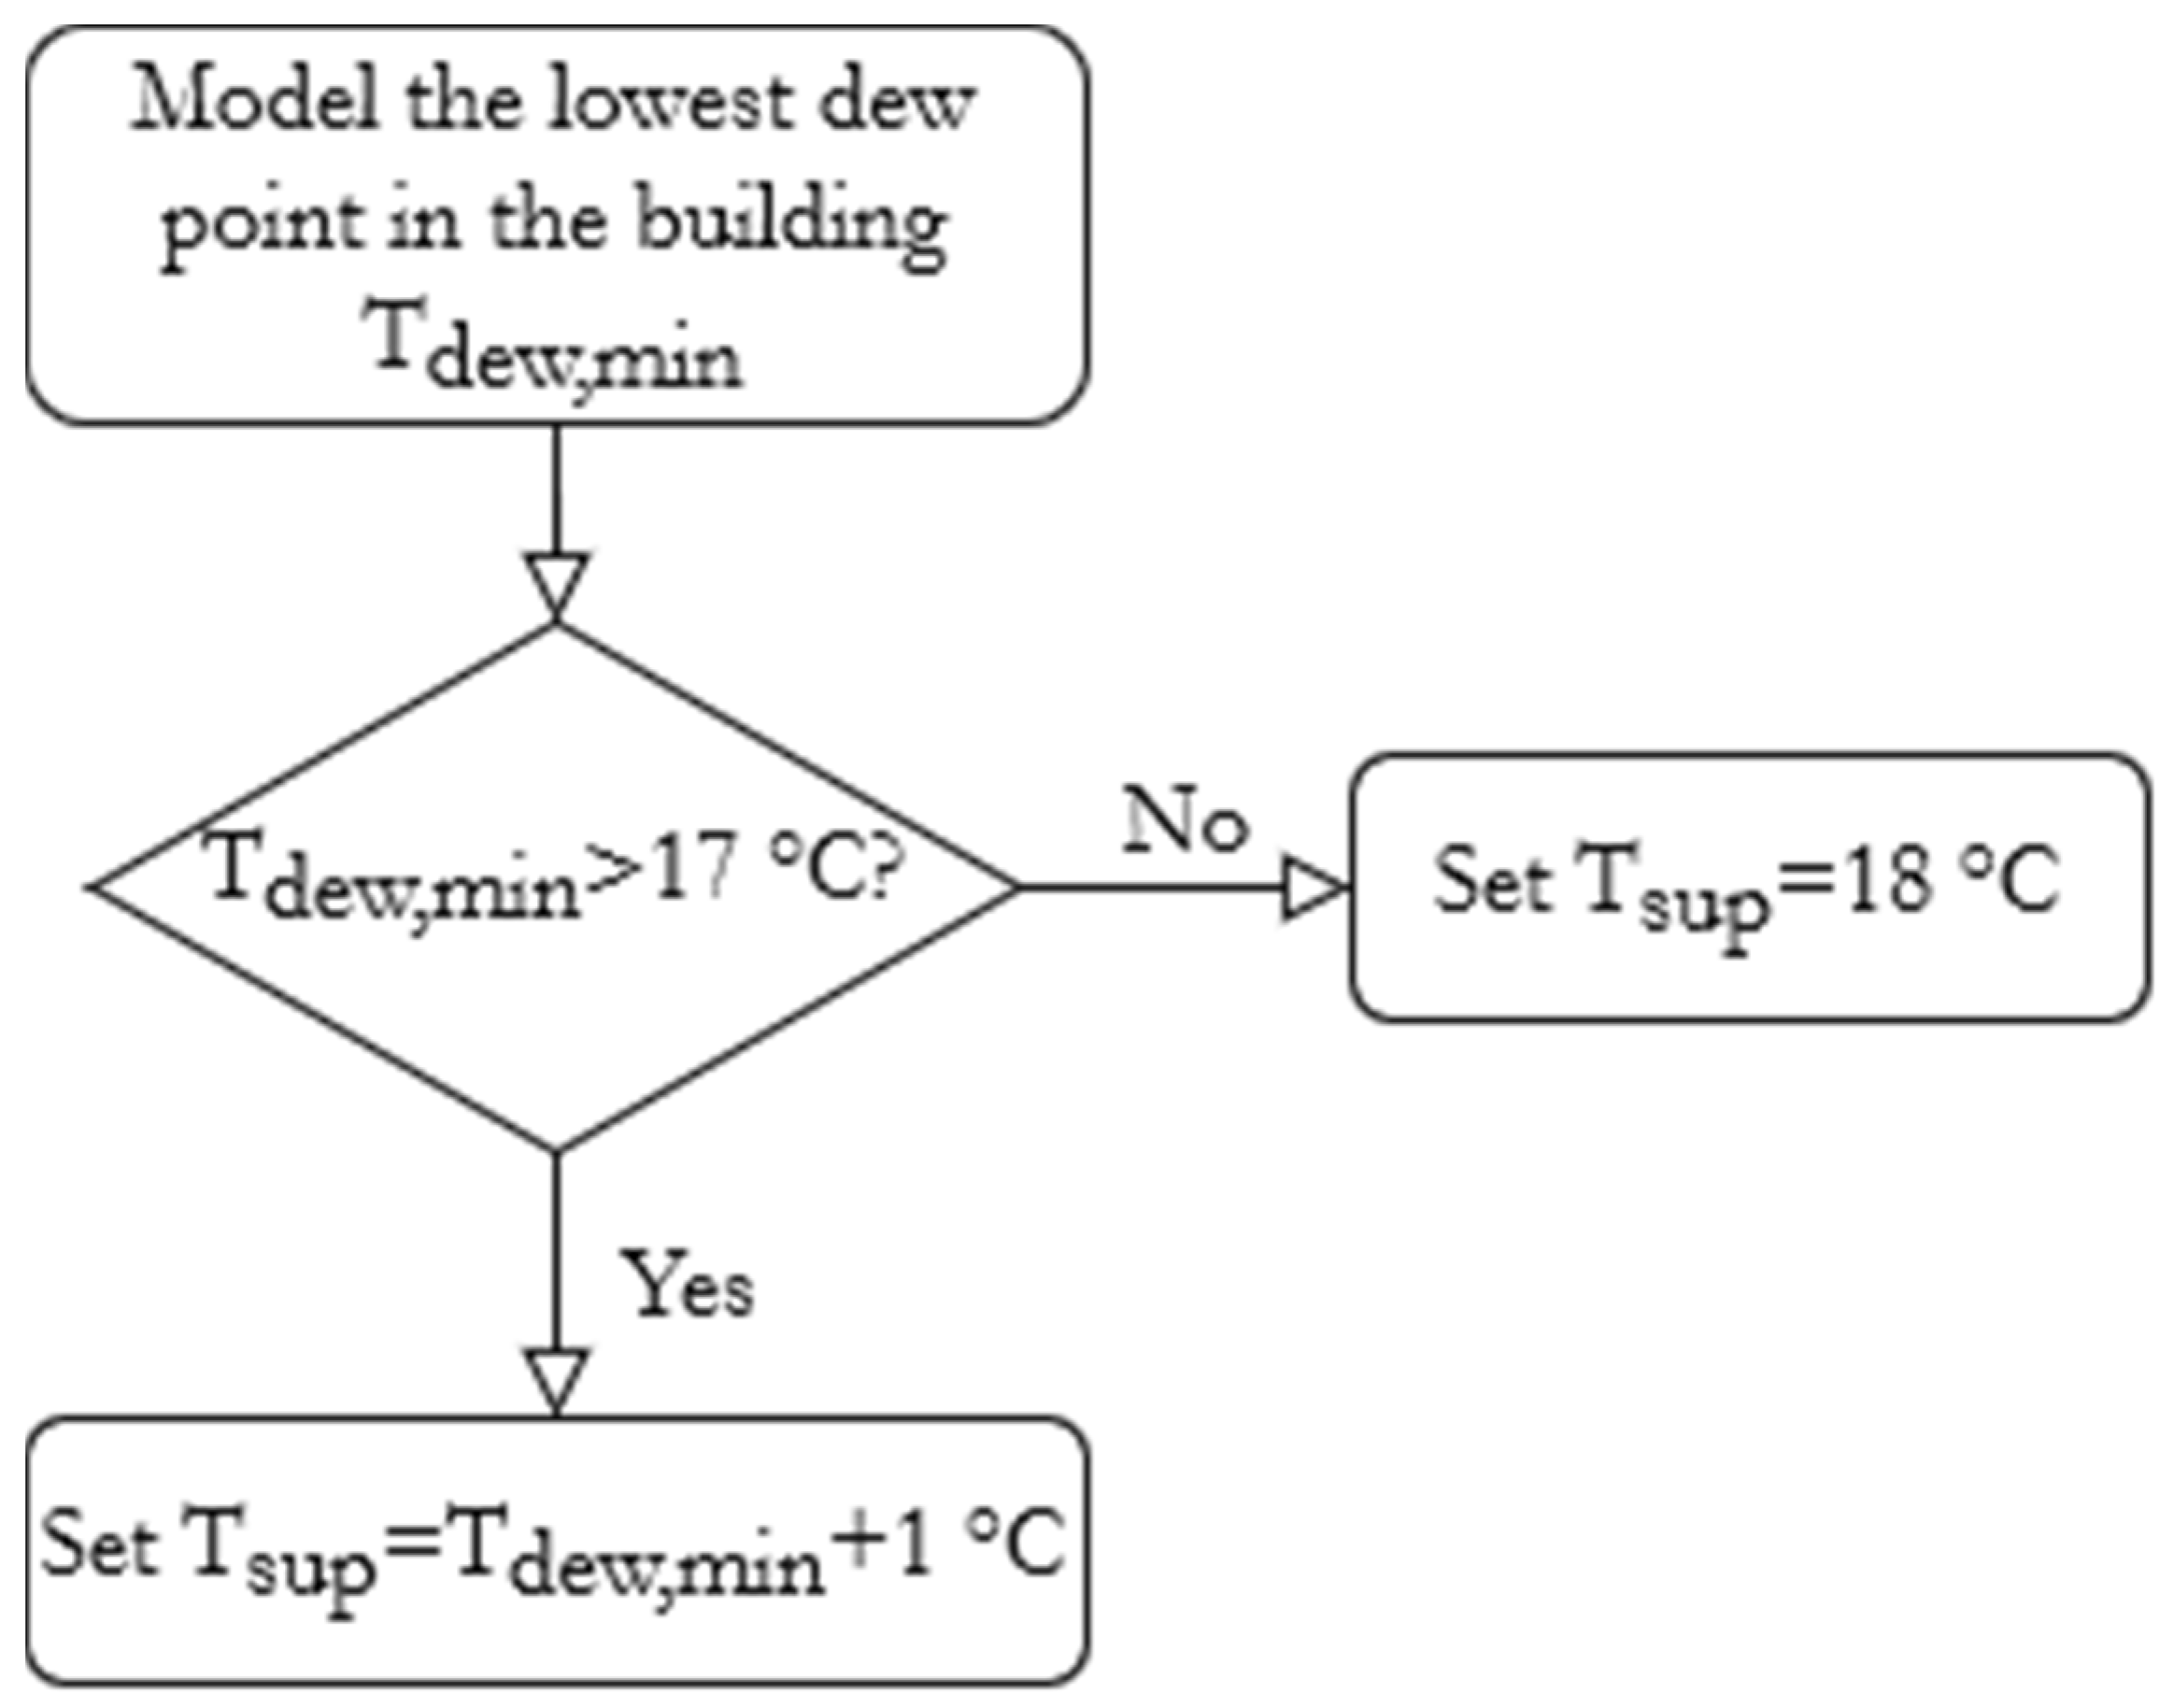
2floor area). The panel system is equipped with a recirculation shunt to reduce the risk of condensation. The supply water temperature to the cooling panels is maintained at least 1 °C above the dew point temperature in the room with the highest condensation risk. This approach is based on the findings of Hao et al. [
44]. During the unoccupied time, the cooling system is shut down, and the room temperature is allowed to drift. The control principle of the supply water temperature to the cooling panels is presented in
Figure 4.
An air handling unit (AHU) is also modelled to improve the indoor air quality in the building. Two types of AHU are considered: a simple fan system supplying untreated outdoor air as a reference system and a system that includes a dehumidification process to remove latent cooling load from the supply air. Henceforth, the two studied systems are referred to as radiant cooling (RC) and radiant cooling with dehumidification (RCD).
The ventilation demand for both modelled systems is calculated to be 0.6 l/(sm
2floor area) (0.53 ACH), according to category II of the EN 15251 standard for very low-polluting office buildings [
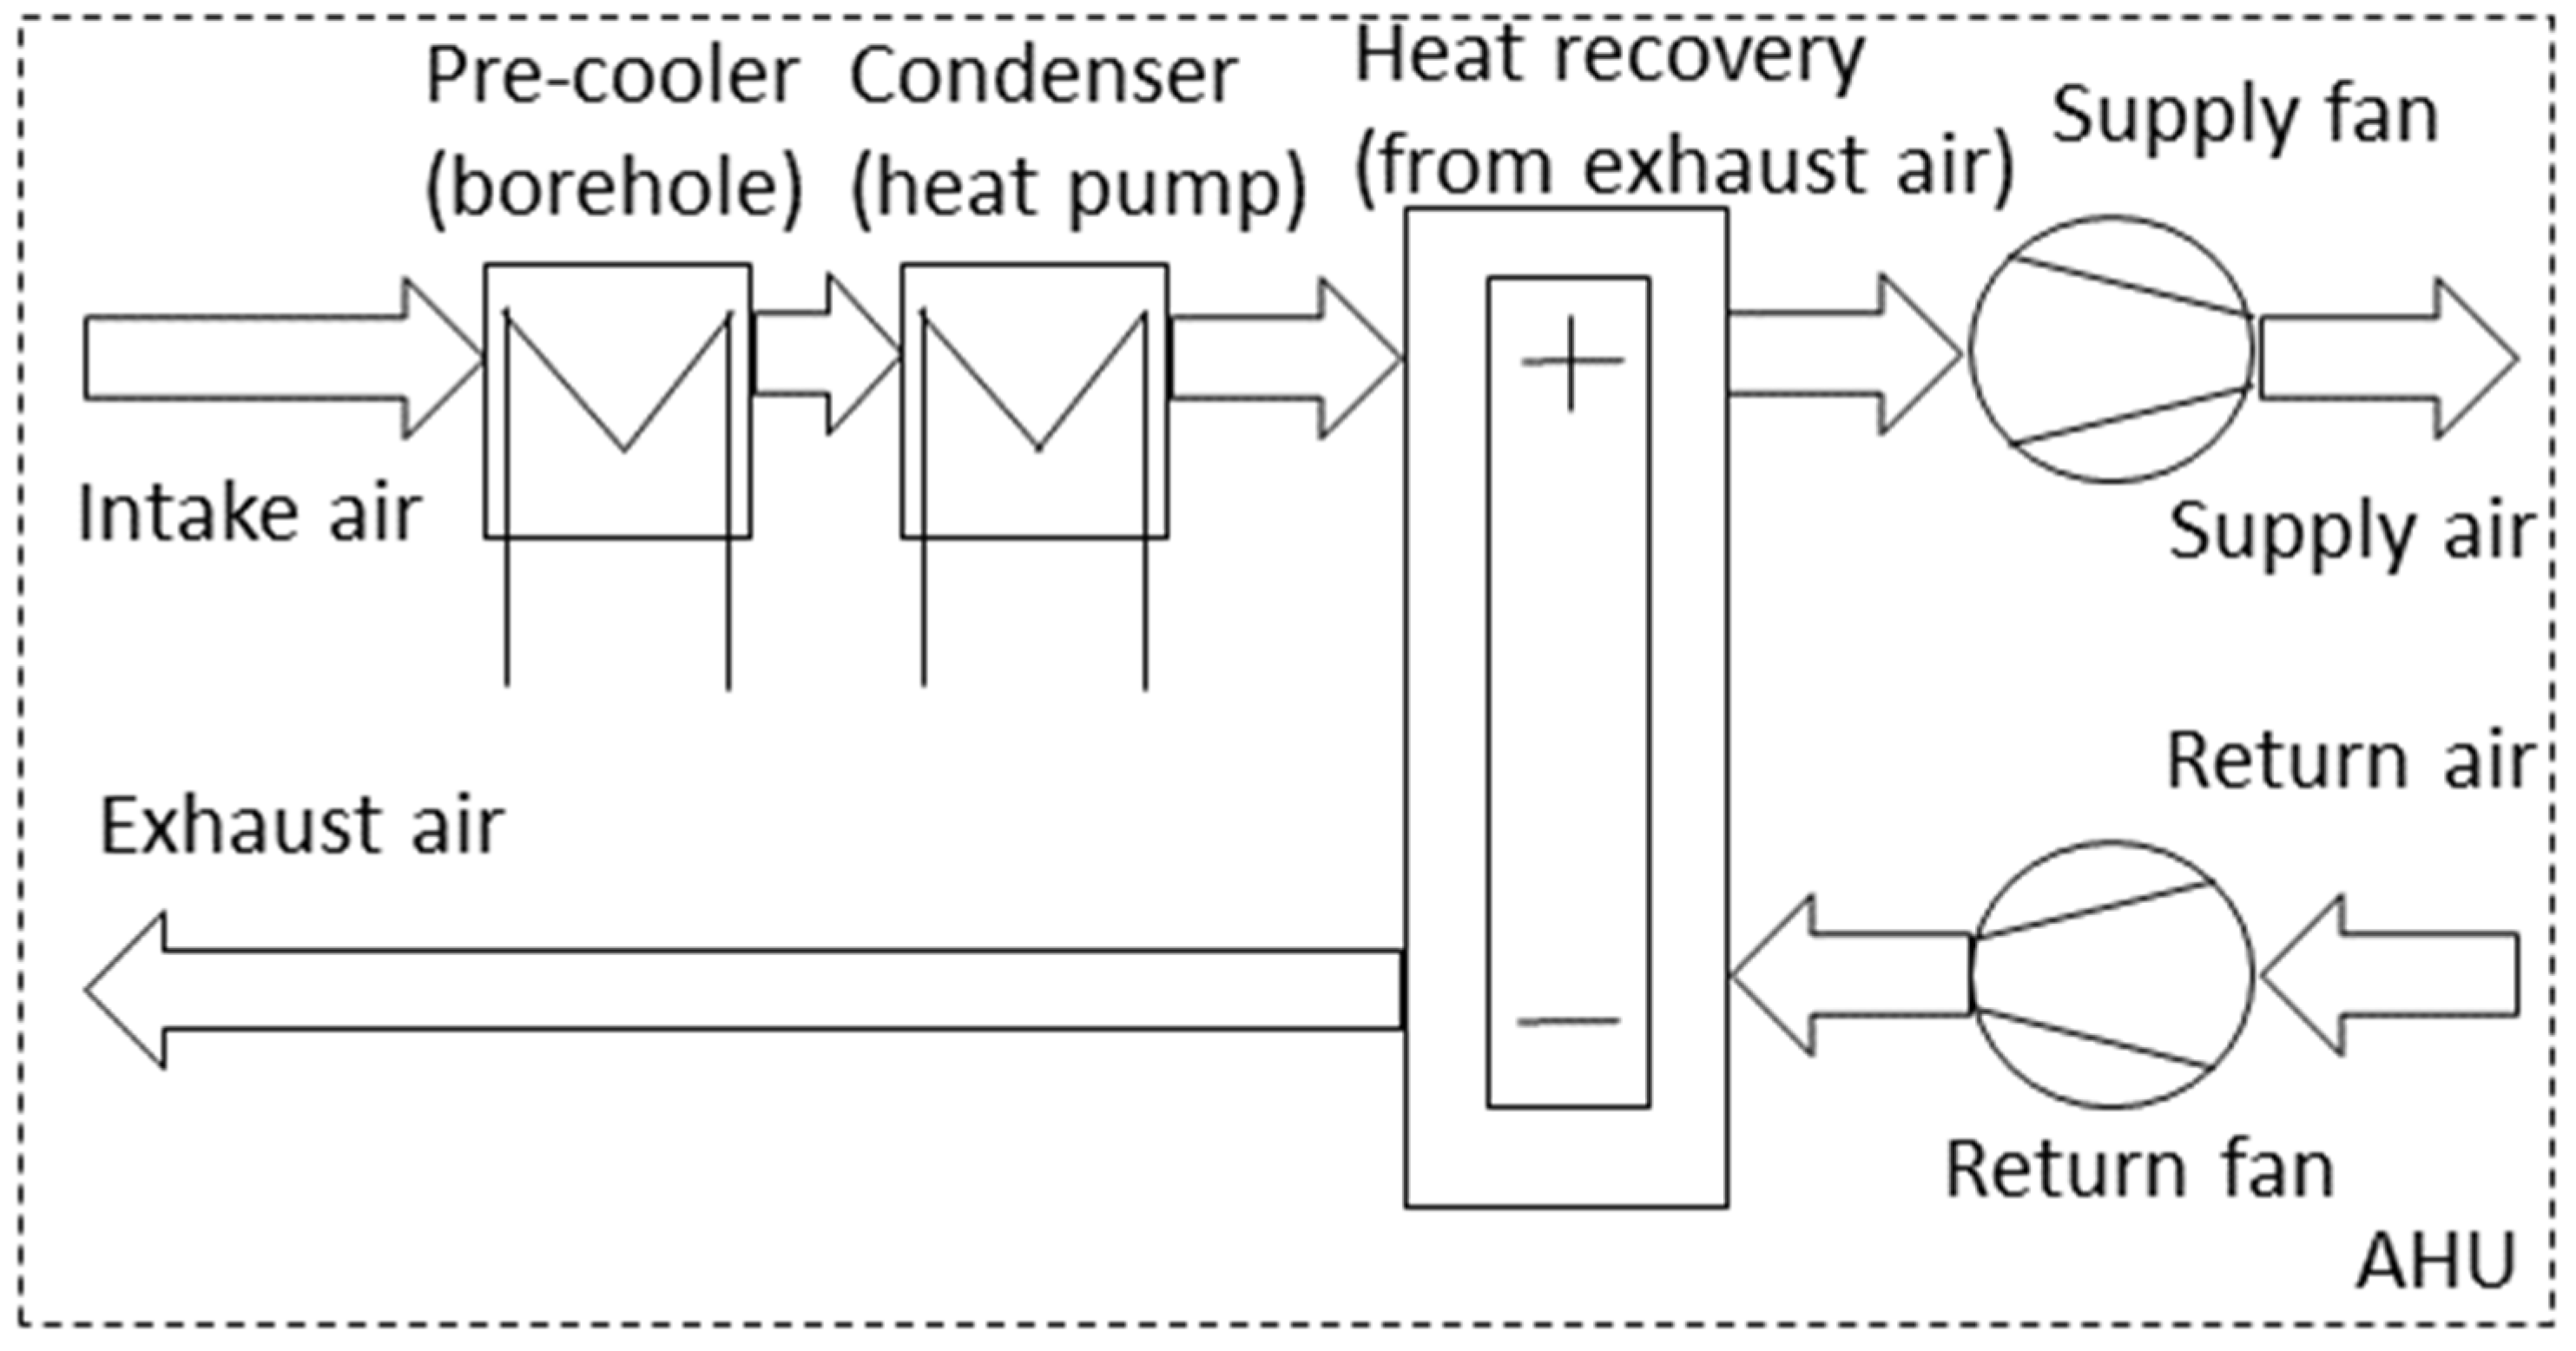
35]. The modelled AHU operation schedule follows the occupancy of the building, starting one hour before the first occupant arrives (6–18). The studied dehumidification system is a condensing dehumidifier. The intake air is cooled to 8 °C to cause excess moisture to condensate [
23], the condensate water is removed, and the supply air is finally reheated to 15 °C before it is delivered to the conditioned zone to avoid discomfort due to cold draught. The cooling is supplied using the geothermal cooling system complimented by a heat pump, and the reheating is done using heat recovery from the exhaust air. The use of heat pump for the condenser is necessary, as the temperature of the water coming from the ground heat exchanger is too high to sufficiently cool the supply air for moisture to condensate. A heat pump will be installed in the site for heating use, so utilising it as the cooling source is a practical solution. Other cooling sources could be used to reach similar performance. A schematic description of the system is presented in
Figure 5.
2.5. Model Validation
The simulated building model was validated by comparing the simulation results with measured indoor temperature data from the studied building. The location of the Netatmo temperature sensor [
45] is indicated by a star (*) in
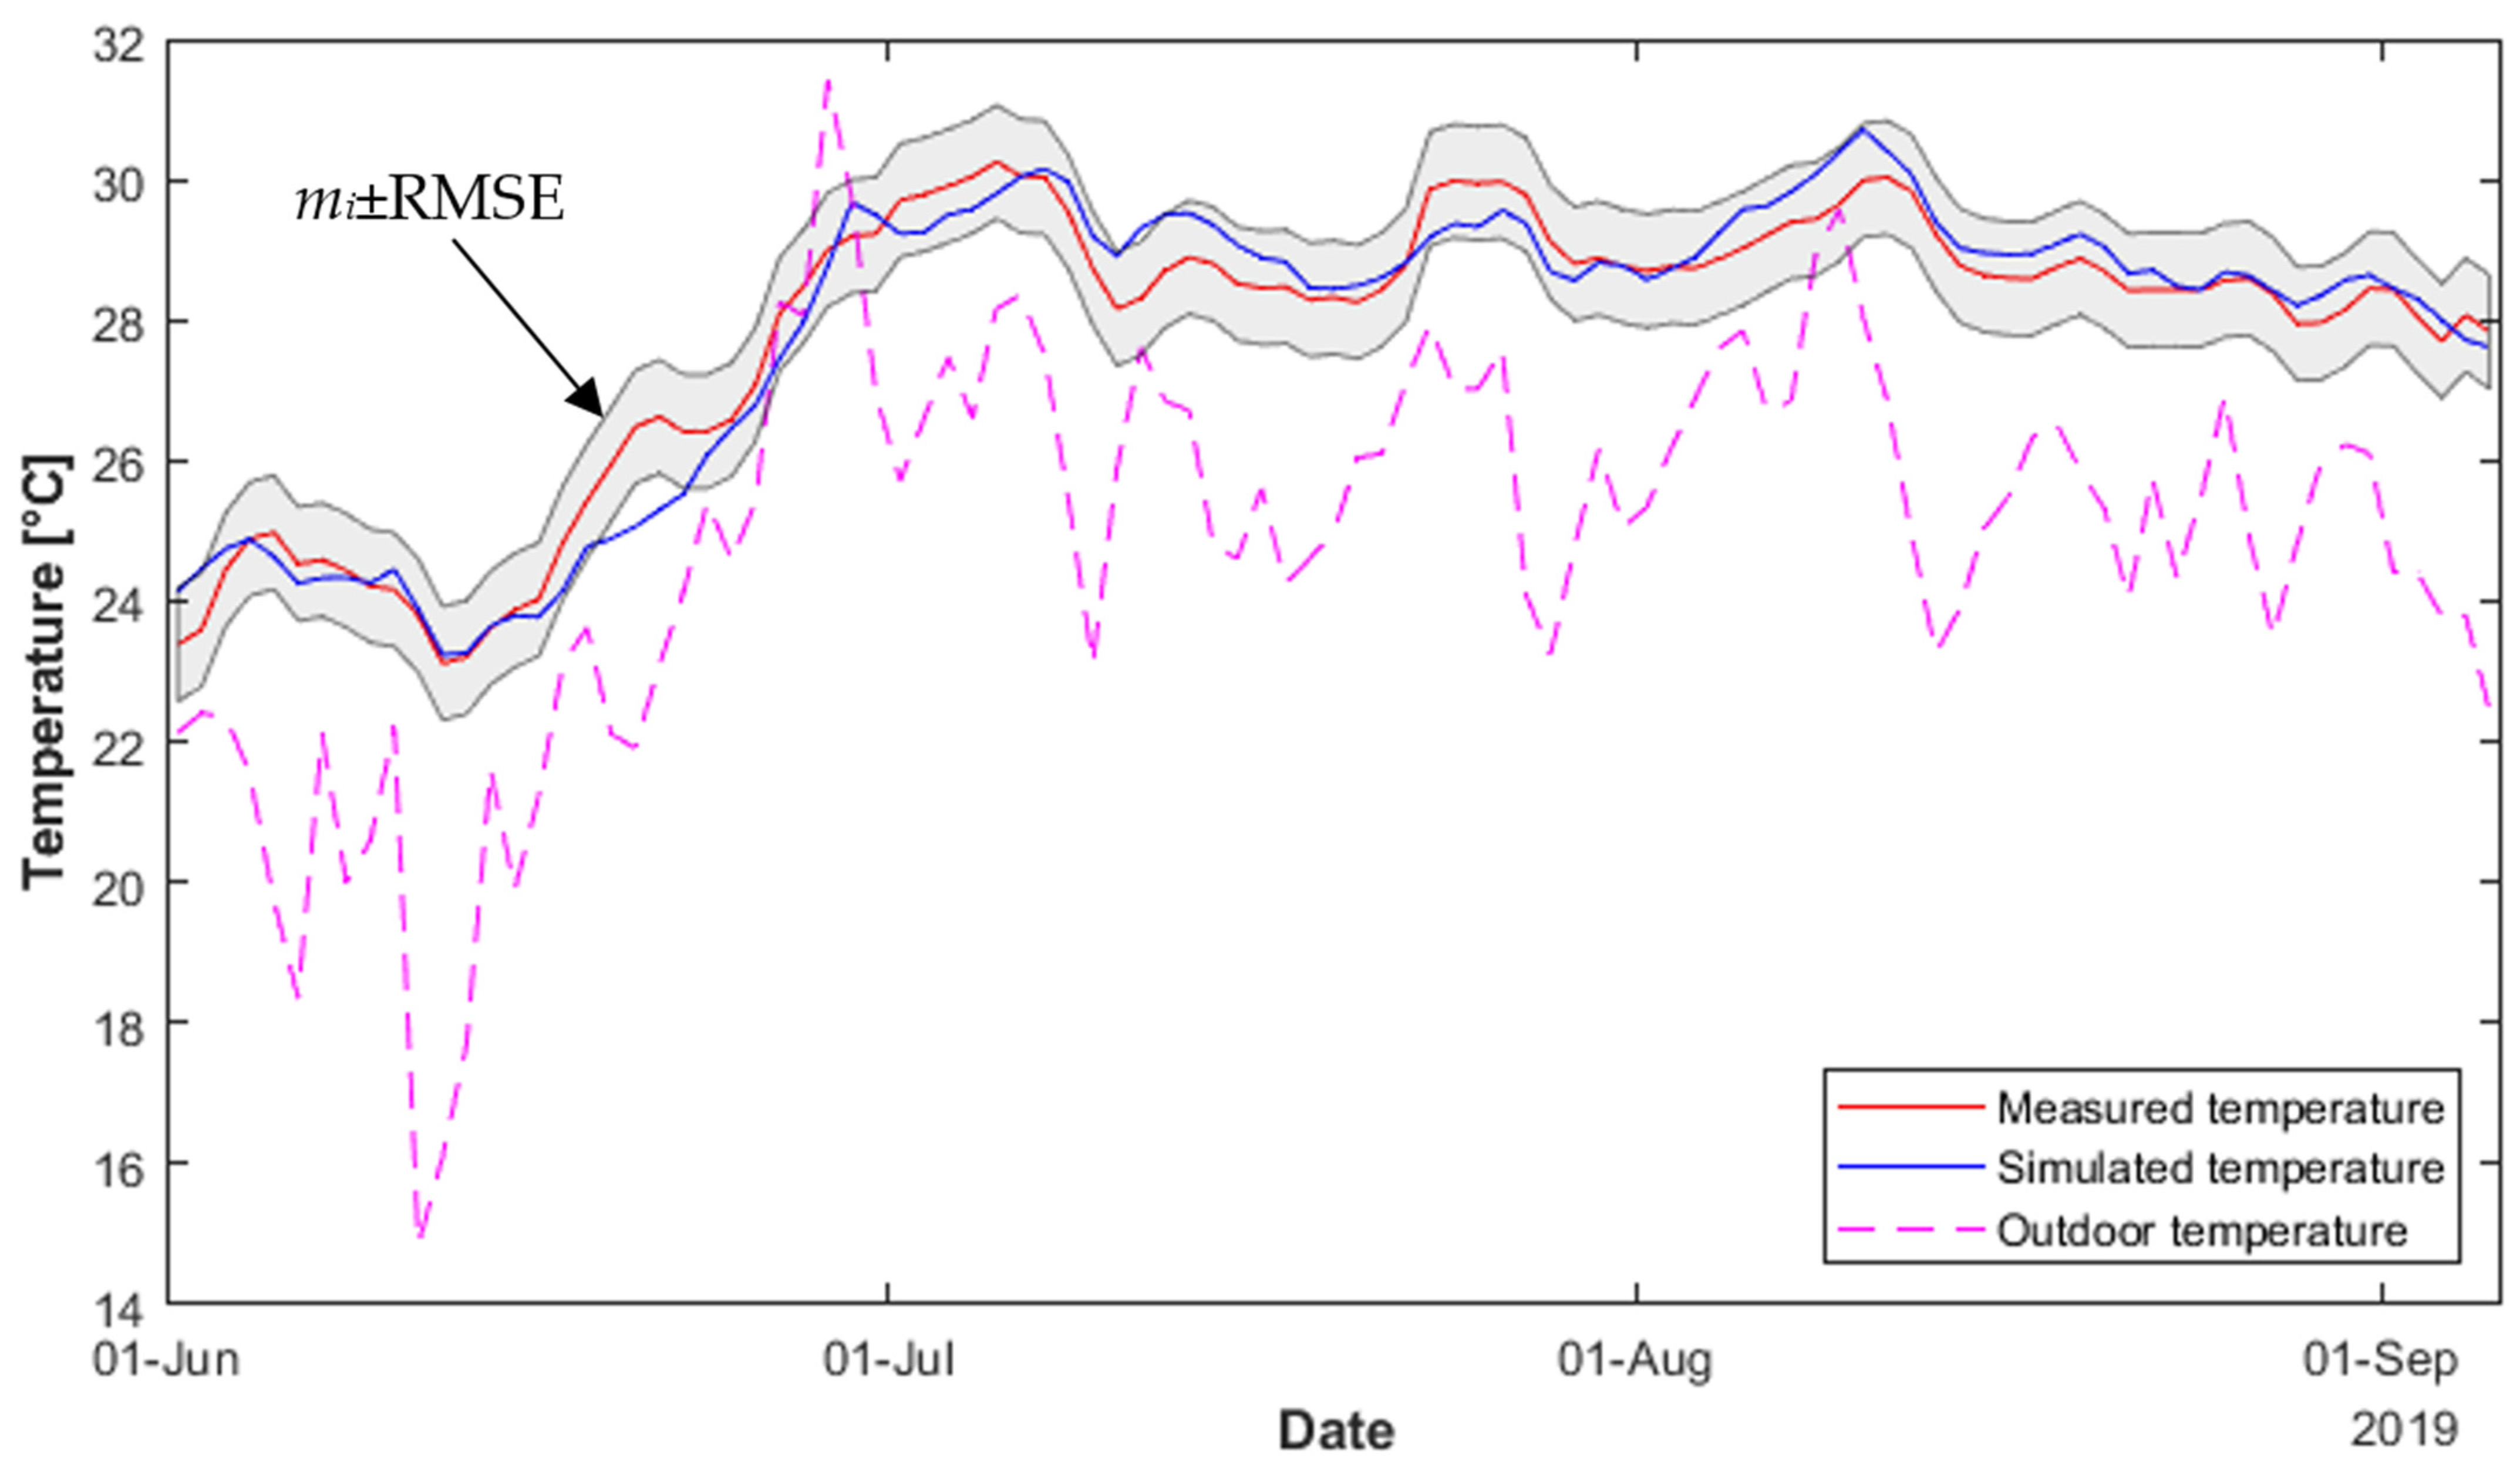
Figure 1. The building in its current state does not have a cooling or ventilation system, which is reflected in the validation model. The validation model was simulated using on-site measured outdoor temperatures as a boundary condition. The measured period was between June 1 and September 5, 2019. Simulated and measured indoor temperatures and the difference between them, as well as the outdoor temperatures used in the validation, are presented in
Figure 6. To confirm the validity of the model, the coefficient of variation of the root mean square error (CV(RMSE)) is calculated using hourly measurement and simulation data. The formula for CV(RMSE) is given in Equation (1):
where
are the measured indoor temperatures,
are the simulated indoor temperatures,
is the arithmetic mean of measured indoor temperatures and
is the number of data points in the validation period. The resulting CV(RMSE) is 2.9%, well within the limit of 30% suggested in ASHRAE guideline 14–2002 [
46]. To visualise the uncertainty of the prediction, the RMSE (Equation (1) without the 1/
term) is often used. The uncertainty band of
mi ± RMSE is presented as the grey area in
Figure 6. The simulated operative temperatures fit well within the uncertainty band, as can be observed from
Figure 6. These small differences between the simulated and measured data suggest that the building model created in IDA ICE is valid. A more detailed description of the validation process is available in [
15].
2.6. Exergy Destruction in the Evaluated Cooling Systems
The concept of cool exergy, introduced by Shukuya [
47], is a vital concept for the analysis of cooling systems. Exergy flow is defined as the flow of thermal energy contained by the system to disperse into the environment. Cool exergy flow reverts this process for the purpose of studying cooling systems. Therefore, cool exergy is a measure of energy flows from the environment into to system, which is undesirable in cooling applications.
To assess the effectiveness of the studied cooling systems, the exergy destruction in the heat exchangers
(ground heat exchanger, cooling panels and dehumidifier in the AHU, respectively) was calculated based on the concept of cool exergy as presented in [
48]. The exergy destruction in the ground heat exchanger
was calculated using Equation (2):
where
and
Here is the cool exergy flow rate from the ground to the brine, is the exergy consumption rate in the ground circuit, is the rate of heat removed from the anti-freeze mixture to the ground, is the ground temperature is the ambient outdoor air temperature, is the brine mass flow in the ground heat exchanger, is the specific heat capacity of the brine, is the temperature of the brine coming out from the ground, is the temperature of the brine going into the ground and is the length of the simulation time step.
The exergy destruction in the cooling panels
was calculated using Equation (5):
where
and
Here is the exergy supplied from the cooling system to the indoor space, is the exergy consumption rate in the cooling water circuit, is the rate of heat removed from the circulation fluid into the conditioned zone, is the average temperature of the ceiling cooling panel surface, is the cooling supply water mass flow in the cooling panel circuit, is the specific heat capacity of water, is the temperature of the cooling supply water going into the cooling panel circuit and is the temperature of the cooling return water coming out from the cooling panel circuit.
The exergy destruction in the AHU
was calculated using Equation (8):
Here is the net exergy input by the cooling water to the AHU-cooling coil, and is the cool exergy flow rate to the supply air. Equation (7) can be adapted for both of these, replacing the values of mass flow, specific heat capacity and respective temperatures from water to air where necessary.
2.7. Uncertainty Quantification
Building energy modelling includes inherent uncertainty in a number of input parameters that are required for the construction of the building model. To quantify the effect of this uncertainty on selected thermal comfort and energy related output variables, a sensitivity analysis was conducted. The first step of the sensitivity analysis was determining the expected variance of seven selected model input parameters: indoor temperature setpoint (
Ti), dehumidification temperature (
Td), available supply temperature from the ground heat exchanger (
Ts,G), internal heat gain from lighting and equipment (
), solar heat gain coefficient (
SHGC), infiltration rate (
) and ventilation rate (
). The parameters were selected among the parameters that have been found to have a high significance in building energy modelling [
49,
50,
51], choosing parameters that involve either high uncertainty in the source data (
Ts,G, , ) or important design or operation decisions (
Ti,
Td,
SHGC,
). The selected parameters, their type of distribution, the mean values and variances (where applicable) and studied ranges are presented in
Table 3. Three parameters (
Ti,
Td,
) are user-controlled. Therefore, a uniform distribution is used, as the user can set these parameters to the desired level. A further three parameters, (
Ts,G, , SHGC) were assumed to be normally distributed, a typical approach for physical properties of the ground or the building [
49]. Finally, (
) was best fitted to source data [
39] assuming a lognormal distribution because the observed infiltration values in the dataset are concentrated on the lower end of the distribution but cannot be negative.
As the building energy model is computationally intensive, the Latin Hypercube Sampling (LHS) method was used to generate a stochastic input parameter dataset to reduce computation time compared with a simple Monte Carlo sampling [
53]. Following the process presented by Helton and Davis [
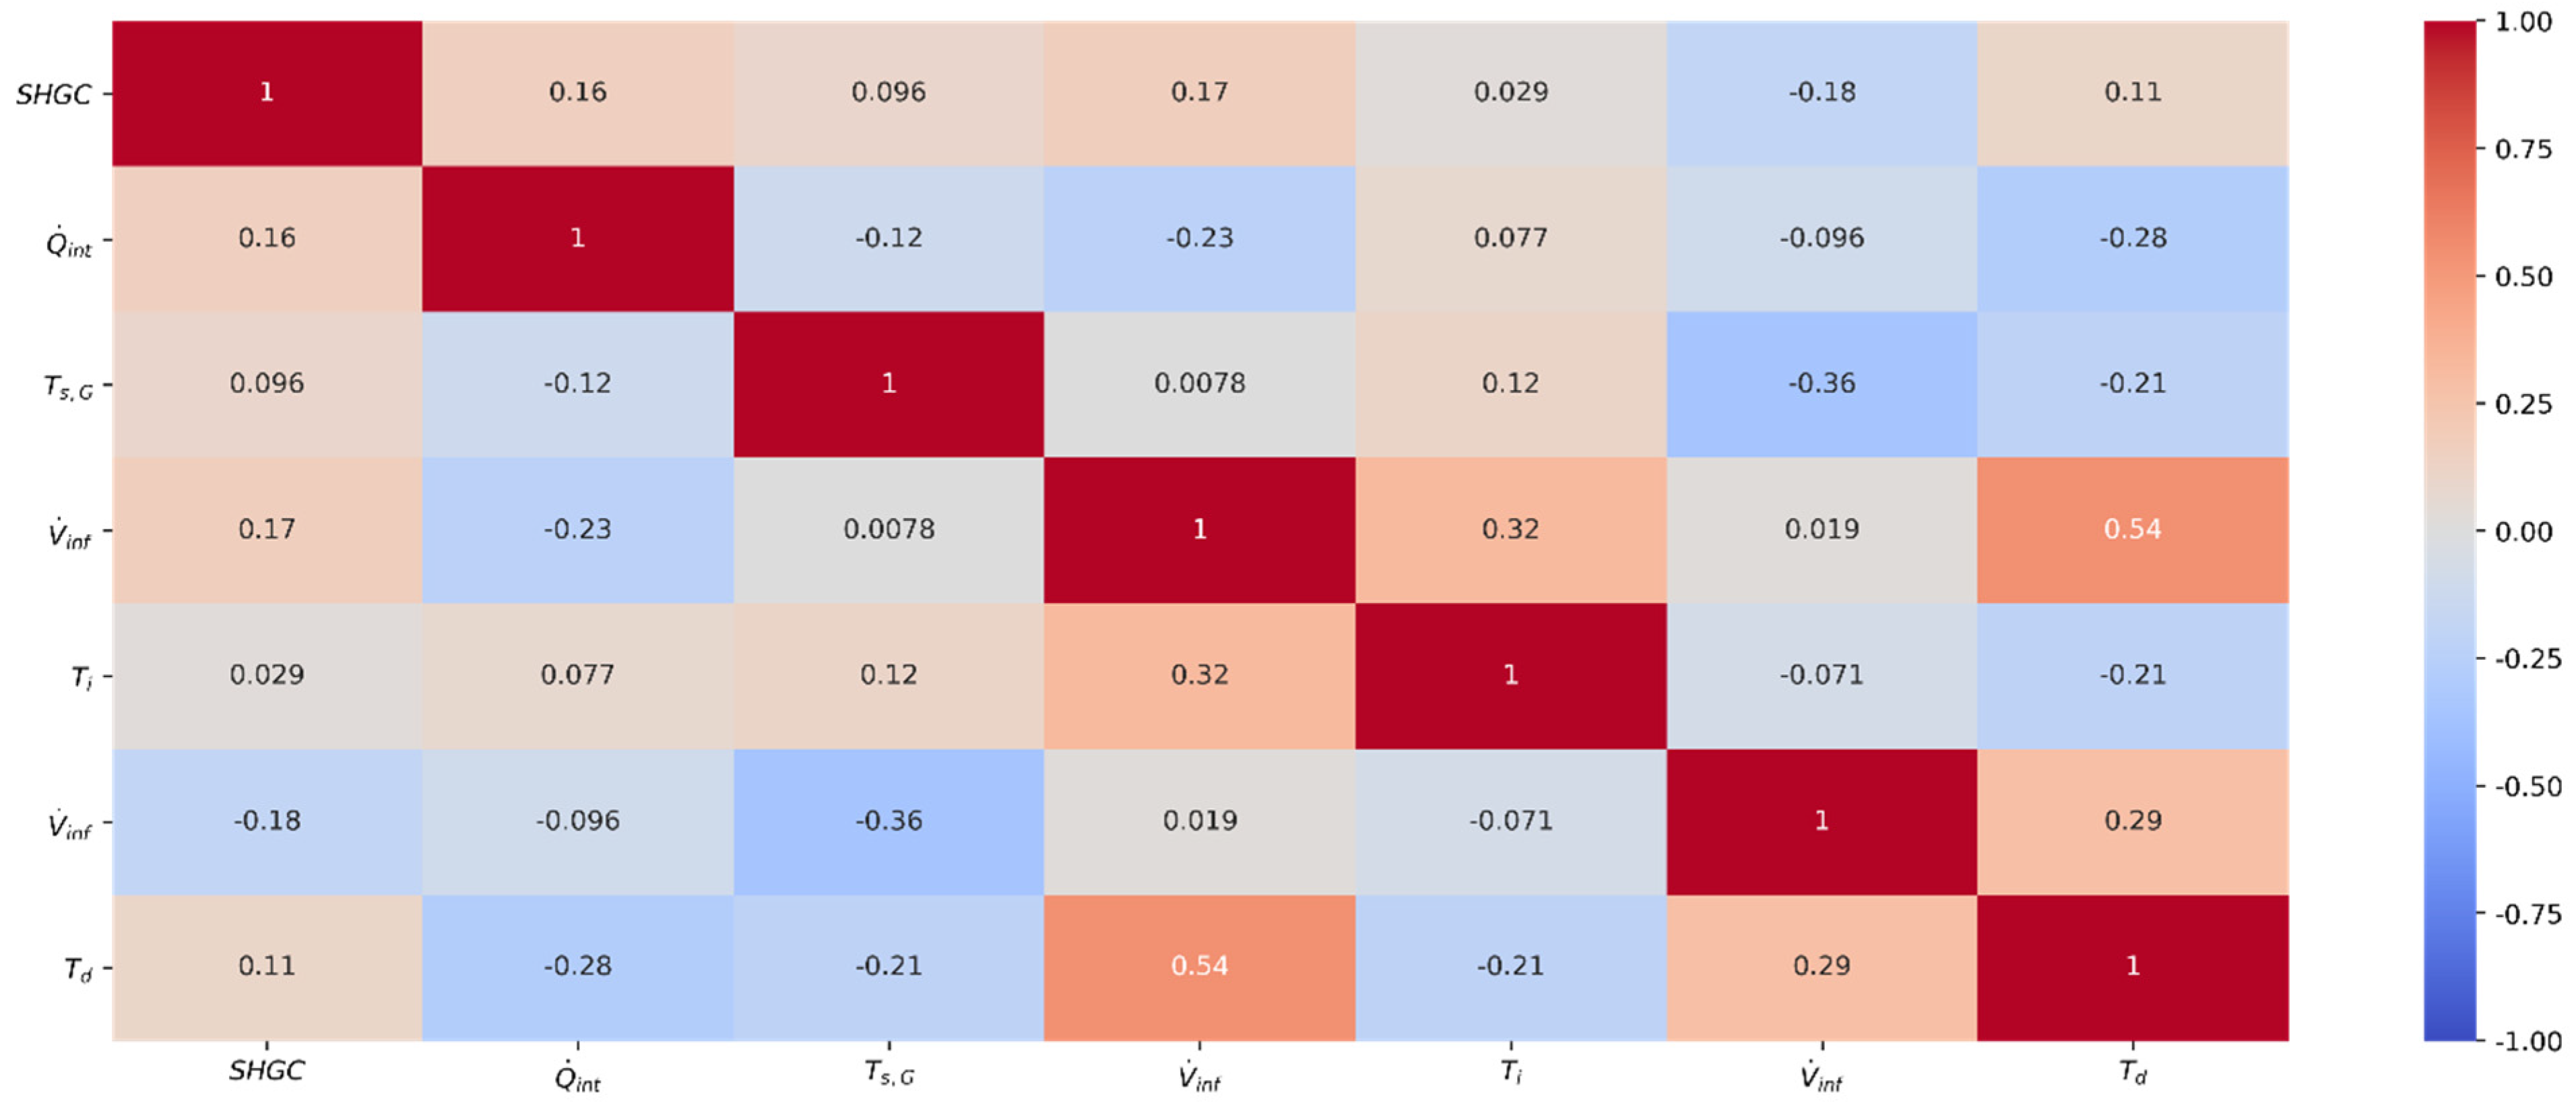
53], each input parameter was divided into three sampling strata: low-, medium- and high scenarios. This process yielded a total of 7 × 3 = 21 samples, organised into a 7 × 21 model input matrix. The model was simulated with the 21 input parameter samples. To confirm that the generated input parameter samples are independent, Spearman’s rank correlation coefficients between the input parameters were calculated. The results are presented in
Figure 7. A Spearman’s rank correlation coefficient higher than 0.6 is generally regarded to be the limit for a strong correlation between parameters [
54,
55]. As the highest observed coefficient between the input parameters is 0.54, the studied input parameter samples can be considered independent.
Five output variables were selected to assess the results. This study aims to compare the two studied systems in terms of their ability to provide thermal comfort and their energy use. Therefore, the selected output variables are the most important thermal comfort parameters (predicted mean vote (PMV), RH% and
Top) and the primary thermal energy uses (
Qc and
Qd) [
49]. A linear regression model was created to assess each output variable’s sensitivity to the input parameters. The sensitivity analysis provides valuable information for the system design regarding the inherent trade-offs between the systems’ thermal comfort and energy use goals. It helps to identify which design parameters should be addressed to affect a given output variable and quantify the effect that the uncertainty in the input parameters has on the output variables.
3. Results
3.1. Thermal Performance
The studied systems are compared in terms of the most significant thermal comfort parameters to assess their performance. The comparison results are presented in
Table 4. In the table, maximum values during the occupied time are presented for PMV, operative temperature and relative indoor humidity. The table also presents how long the values of these parameters exceed the limits of the highest and the second-highest comfort categories as defined in relevant standards. For operative temperature and PMV [
56] these are categories A and B of ISO 7730 and for relative humidity they are categories I and II of EN 16798 [
57]. PMV is defined in the ISO 7730 standard as “an index that predicts the mean value of the votes of a large group of persons on the 7-point thermal sensation scale based on the heat balance of the human body”. It is dependent on a number of factors including air temperature (which should be between 10 and 30 °C), mean radiant temperature (10–40 °C), air velocity (0–1 m/s), the occupant’s activity level (0.8–4.0 met) and clothing (0–2 clo). A full list of considered parameters and the equations for calculating PMV are available in the ISO 7730 standard.
Results show that the RCD system reaches significantly lower maximum relative indoor humidity than the RC system, as is to be expected. The RCD system also keeps the relative indoor humidity within the limits of category II of the EN 16798 standard for 93.9% (868 h) of the occupied time (935 h). In contrast, the RC system reaches this category for 44.4% (415 h) of the occupied time.
The combination of chilled supply air and the resulting lower indoor relative humidity allows the RCD system to maintain a higher cooling capacity than the RC system, which needs to modulate the supply water temperature to avoid condensation. The higher cooling capacity enables the RCD system to keep the operative temperature within category B of the ISO 7730 standard for 99.7% (932 h) of the occupied time. In comparison, the RC system reaches this category for 63.5% (594 h) of the occupied time. Most notable is the difference in operation under peak load conditions. With the RC system, the operative temperature reaches up to 28.3 °C, 2.3 °C higher than the upper limit of category B, the longest overshoot period being 32 h (during three days). The highest operative temperature reached by the RCD system is 26.4 °C, overshooting category B by just 0.4 °C. The duration of the overshoot is 0.75 h.
The lower relative indoor humidity and operative temperature generate higher perceived thermal comfort for the occupants. The higher thermal comfort is clearly shown in the PMV performance of the RCD system, which reaches the maximum value of 0.4 (neutral). In contrast, the RC system reaches PMV values up to 1.2 (slightly warm). The RCD system can maintain the thermal comfort conditions within category B during the entire cooling season. In comparison, the RC system satisfies this category for 68.7% (642 h) of the occupied time. Therefore, it is safe to conclude that the RCD system performs better in terms of thermal comfort than the RC system.
3.2. Energy and Exergy Performance
The thermal energy use of the studied systems is compared in
Table 5. The table presents a clear difference between the systems in the energy use in the AHU. In the RCD system, energy is used for cooling the supply air to dehumidify it in two stages, first with direct ground cooling and then further assisted with a heat pump to reach temperatures that are low enough to dehumidify the supply air. Finally, the supply air is reheated back to 15 °C through heat recovery from the return air, to avoid the unpleasant feeling of draught. The AHU’s direct ground cooling covers approximately 23% of the AHU’s cooling energy use and 8% of the total cooling in the building. The heat pump assisted dehumidifier covers 77% of the AHU’s cooling energy use and 26% of the total cooling in the building. The remaining 66% of the building’s total cooling energy use is covered by the radiant cooling system.
In the RC system, the heat removed by the AHU is considerably lower as the heat pump assisted dehumidifier is omitted. The direct ground cooling system covers approximately 10% of the total cooling energy use, while the remaining 90% is covered by the radiant cooling system. The total cooling energy use with the RC is lower, as the condensation control limits the cooling capacity of the radiant cooling system. The results show that the improved thermal comfort performance of the RCD system requires 1.5 times the RC system’s thermal energy use. Especially significant is the 4.41 kWh/m2 floor area used by the dehumidifier, as that must be produced by the heat pump necessitating the use of high exergy value electricity.
The thermal exergy consumption of the studied systems is compared in
Table 6. With the RCD system, the vast majority, 78%, of the thermal exergy destruction occurs in the dehumidifier. This is due to the large temperature difference between the supply air and chilled water required for dehumidification. The ground heat exchanger and cooling panel are responsible for 10% and 12% of the cumulative thermal exergy destruction, respectively. With the RC system, the thermal exergy destruction in the ground heat exchanger is only 64% of the RCD system, as less heat is extracted from the ground. The thermal exergy destruction in the cooling panel is 5% higher than in the RCD system, as the radiant cooling panels provide slightly more cooling energy. In total, the thermal exergy destruction using the RC system is only 19% of the thermal exergy destruction of the RCD system. This result clearly shows the exergy inefficiency of the dehumidification process.
3.3. Sensitivity Analysis
The results of the sensitivity analysis are presented in
Figure 8,
Figure 9,
Figure 10,
Figure 11 and
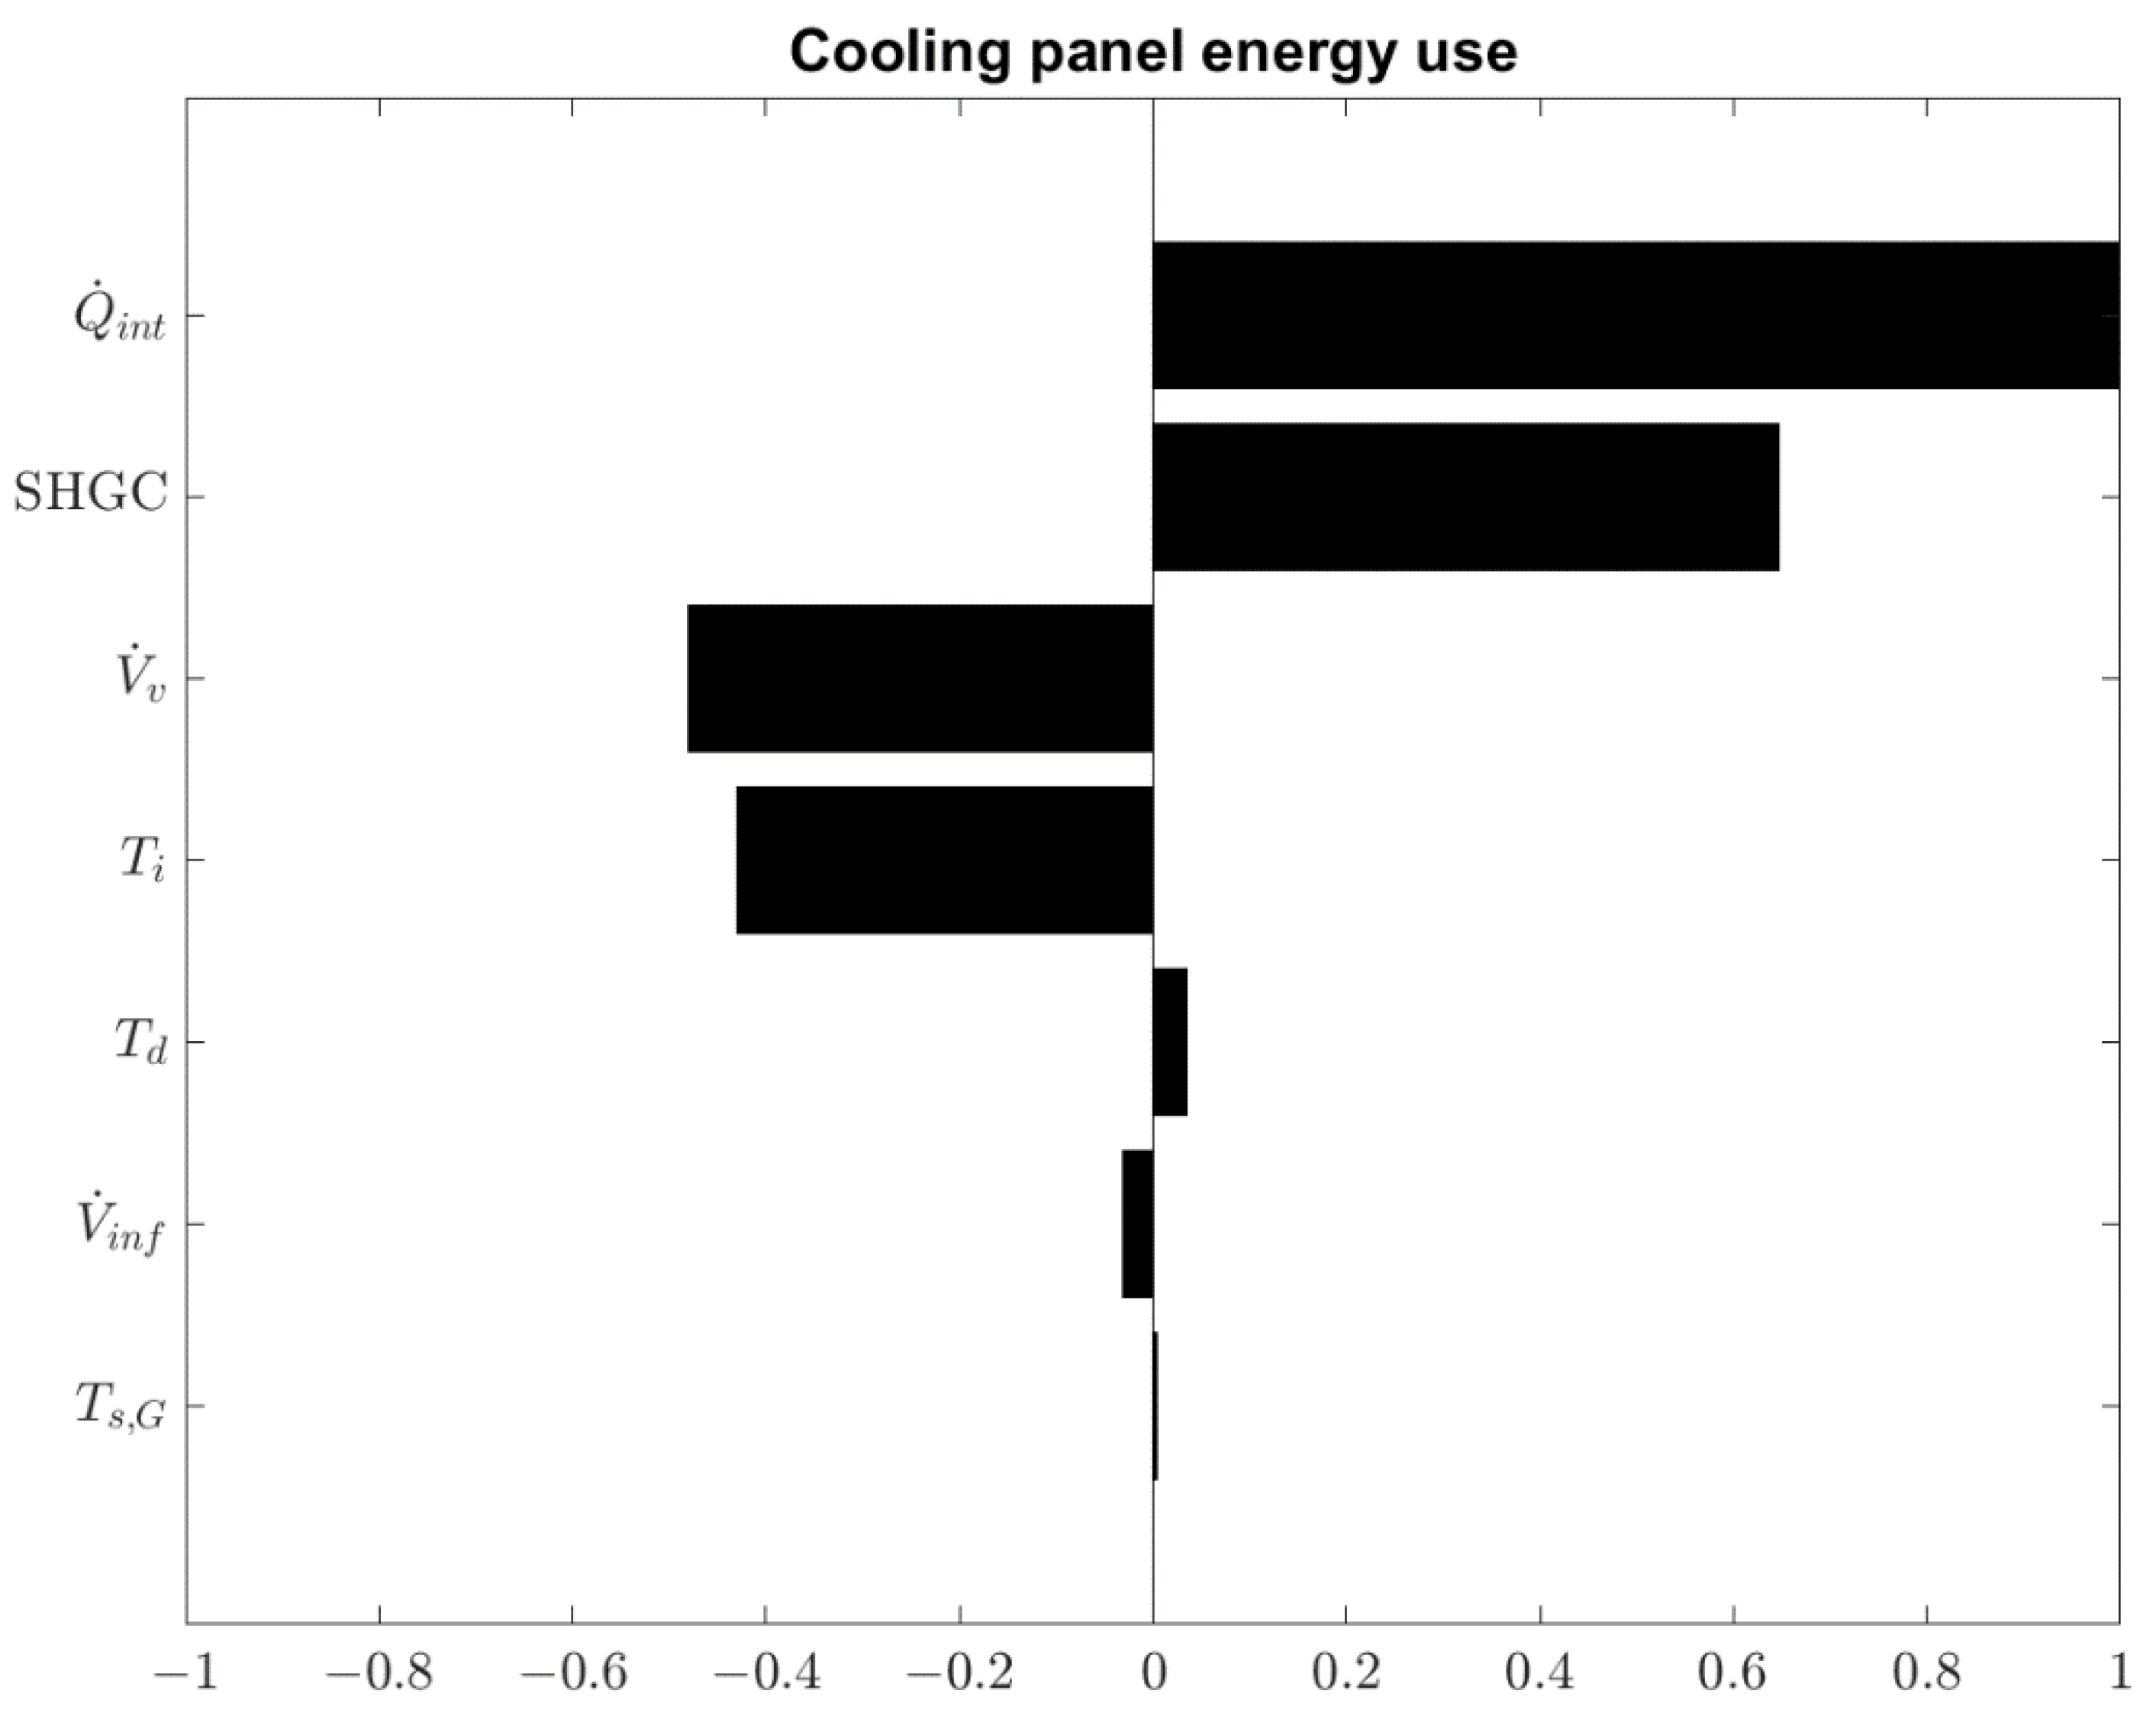
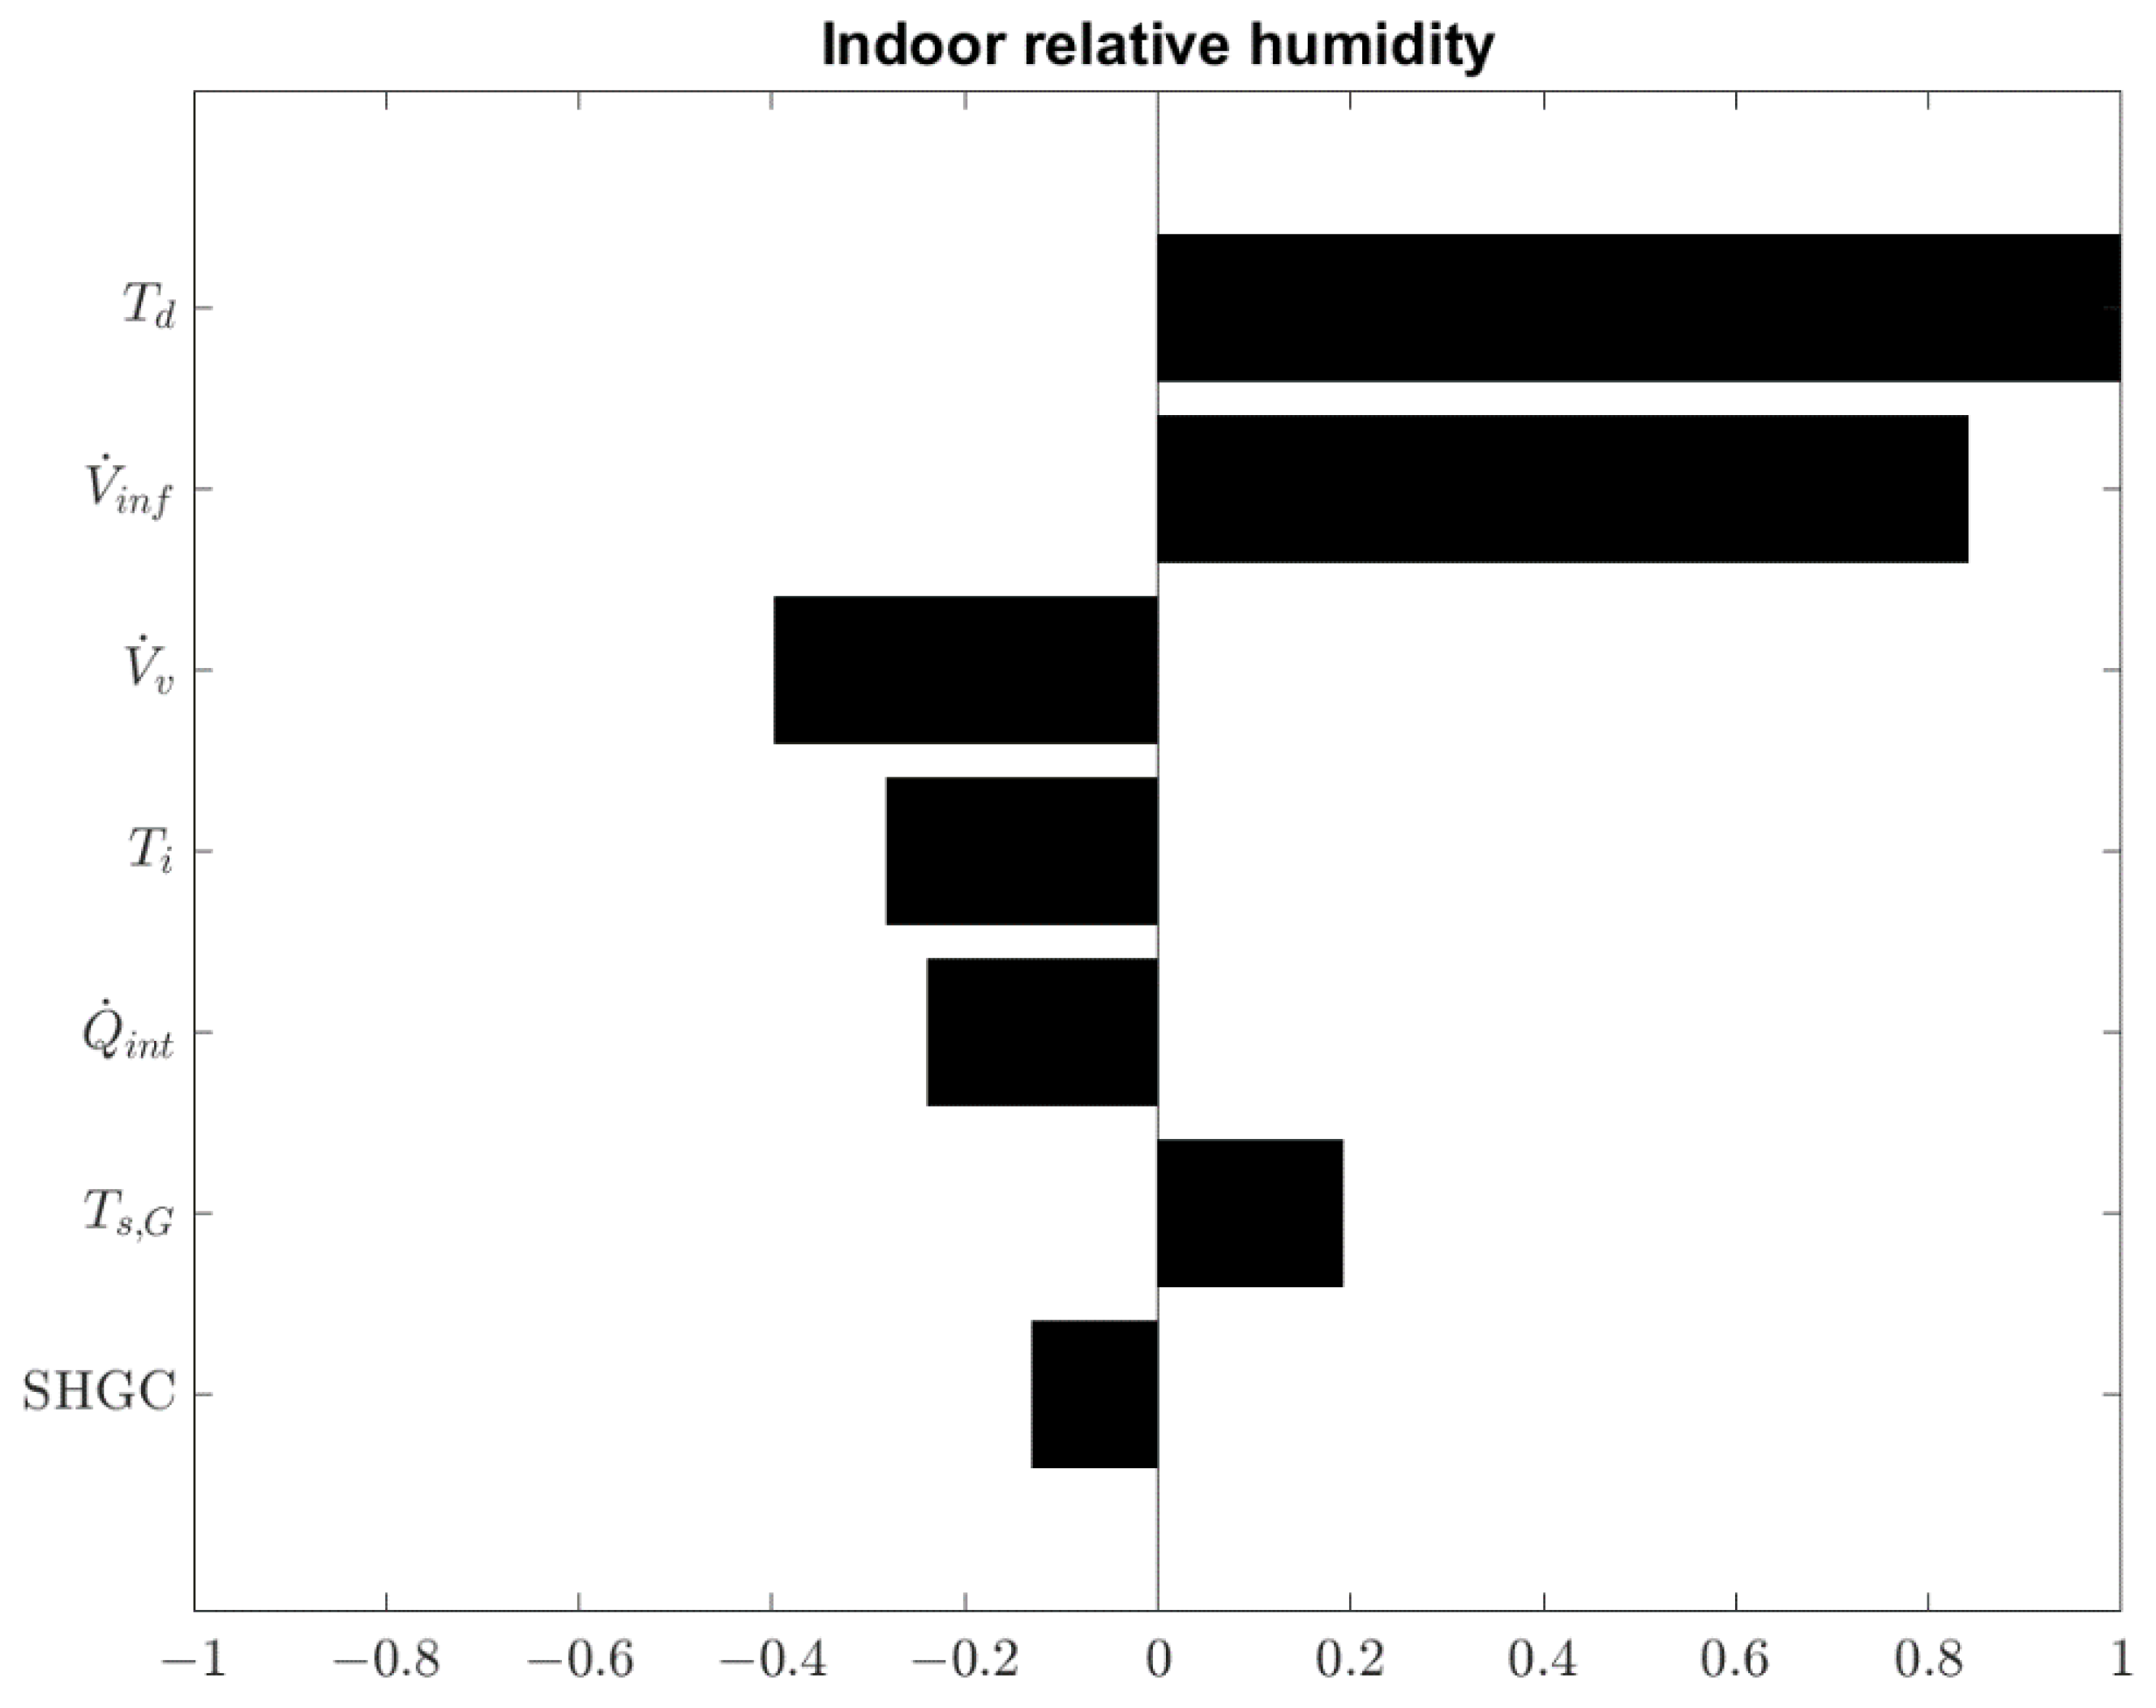
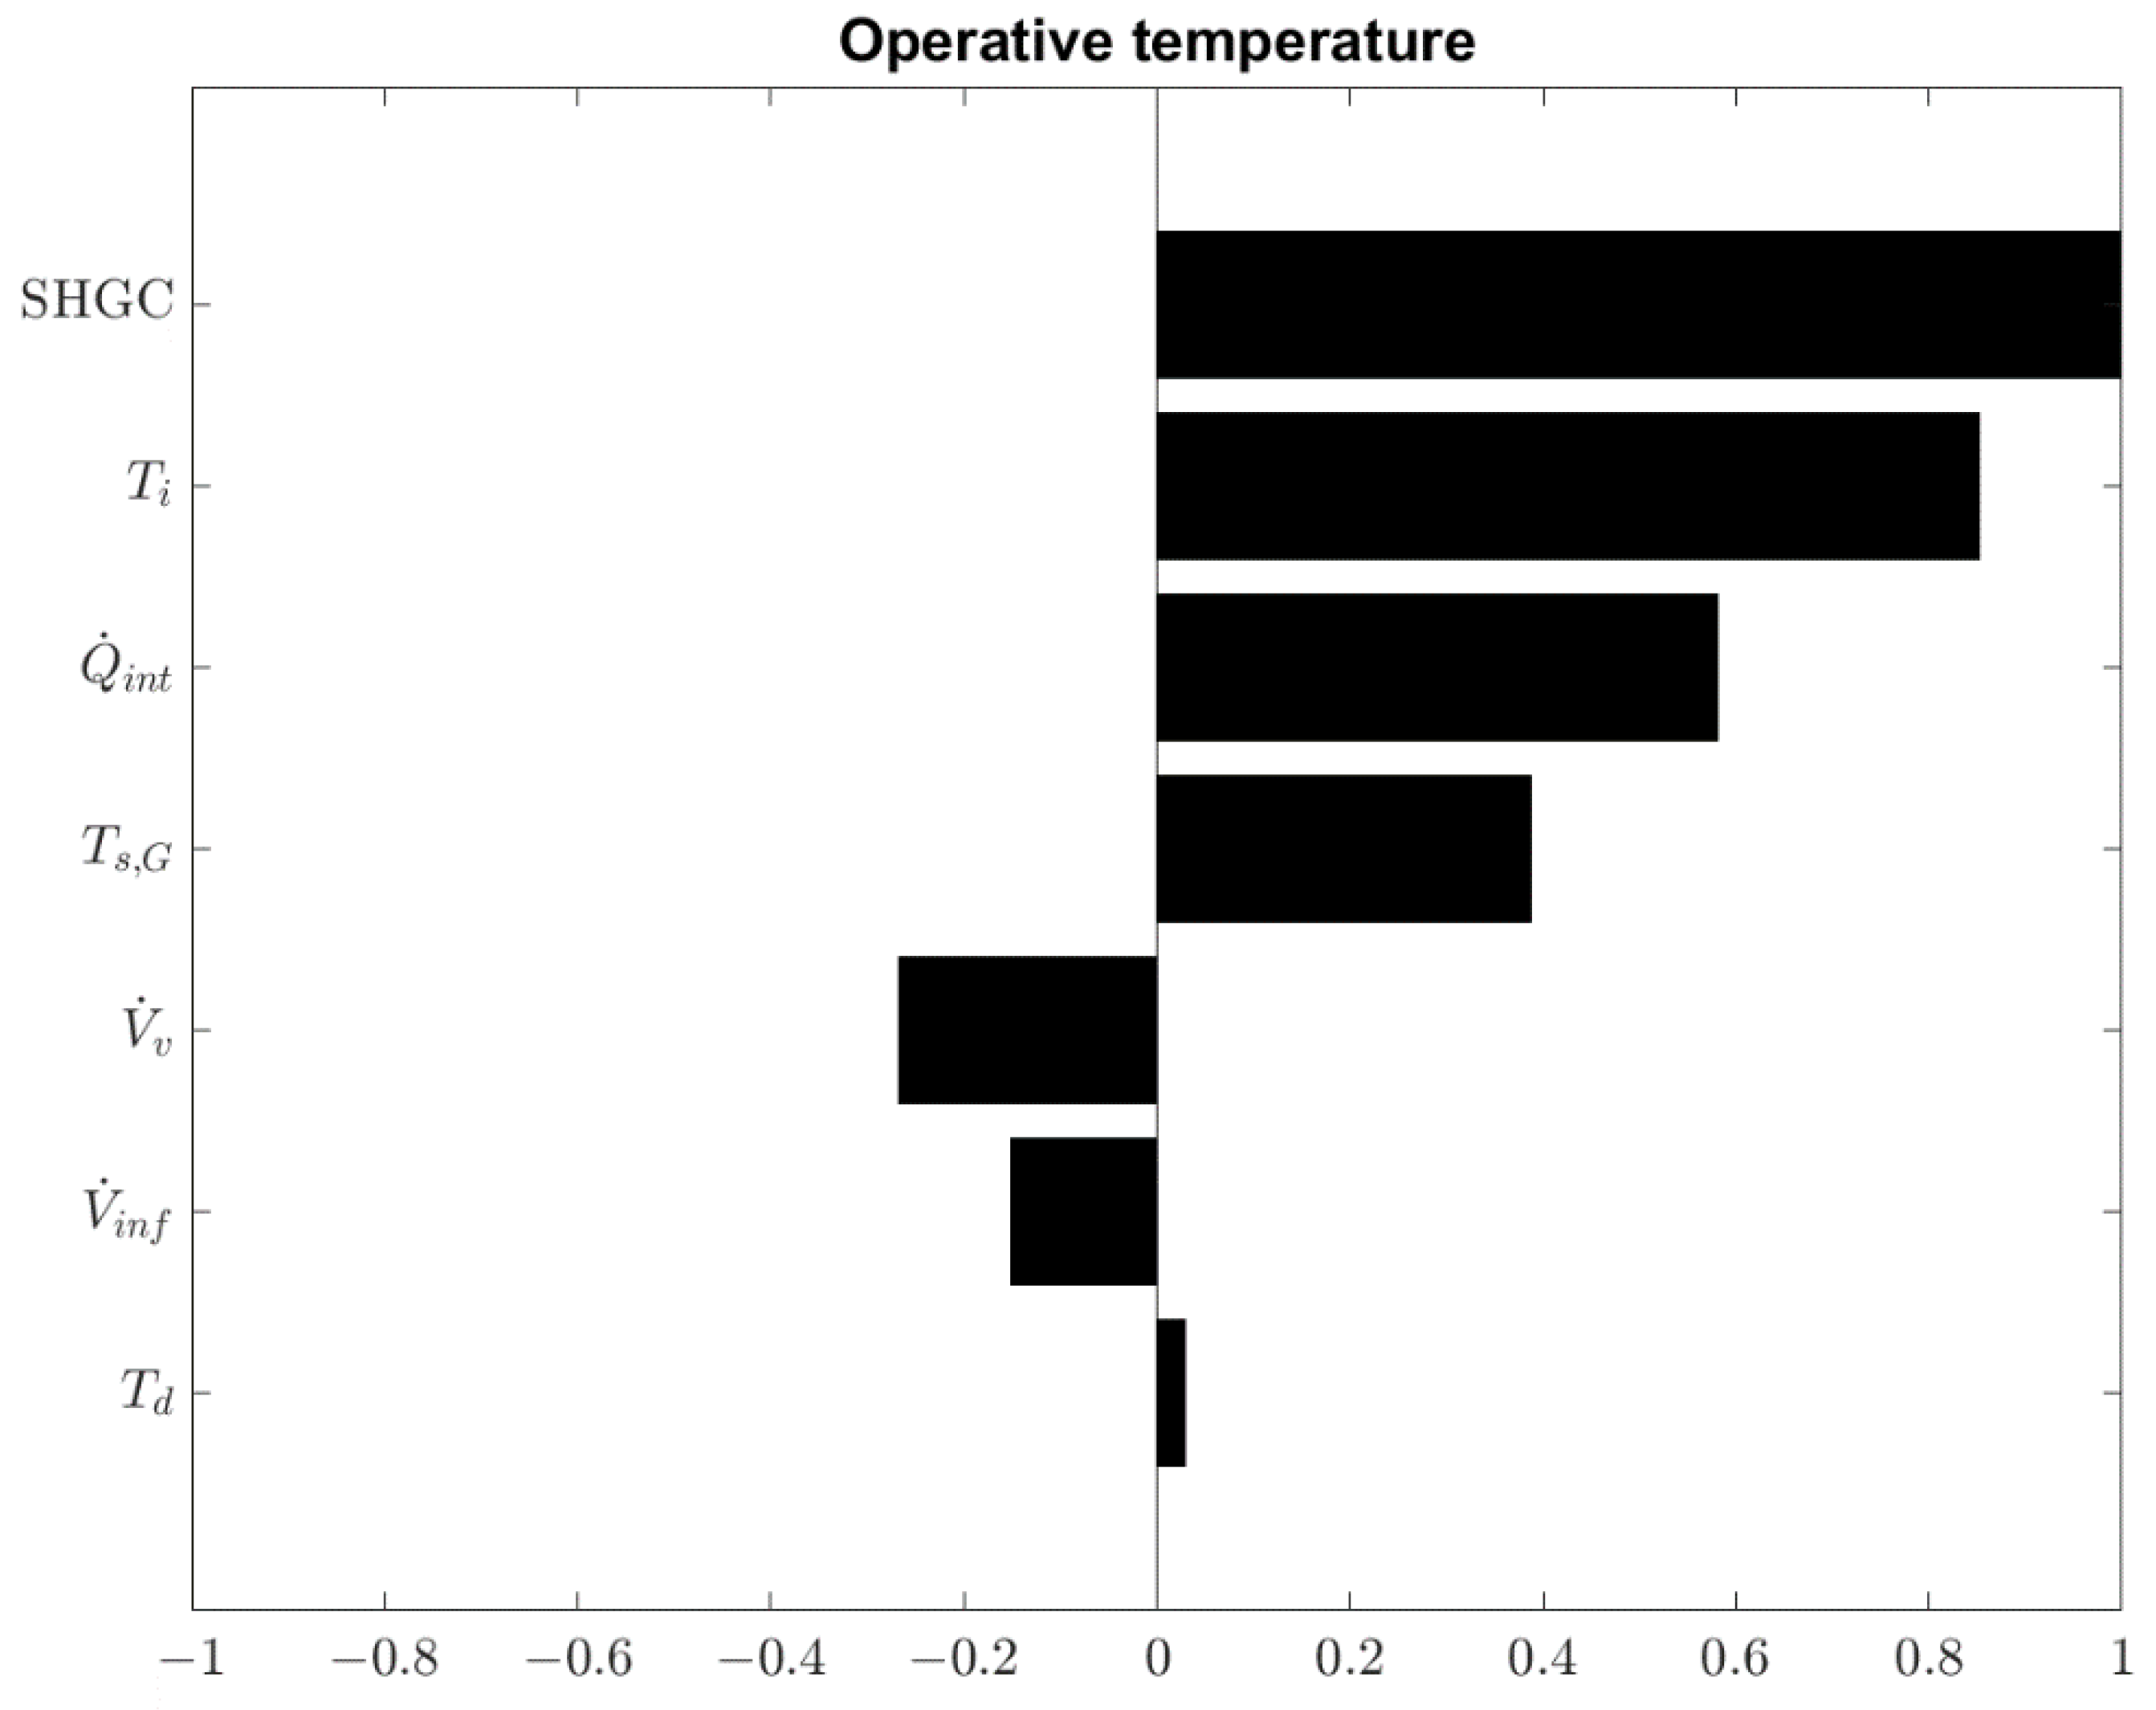
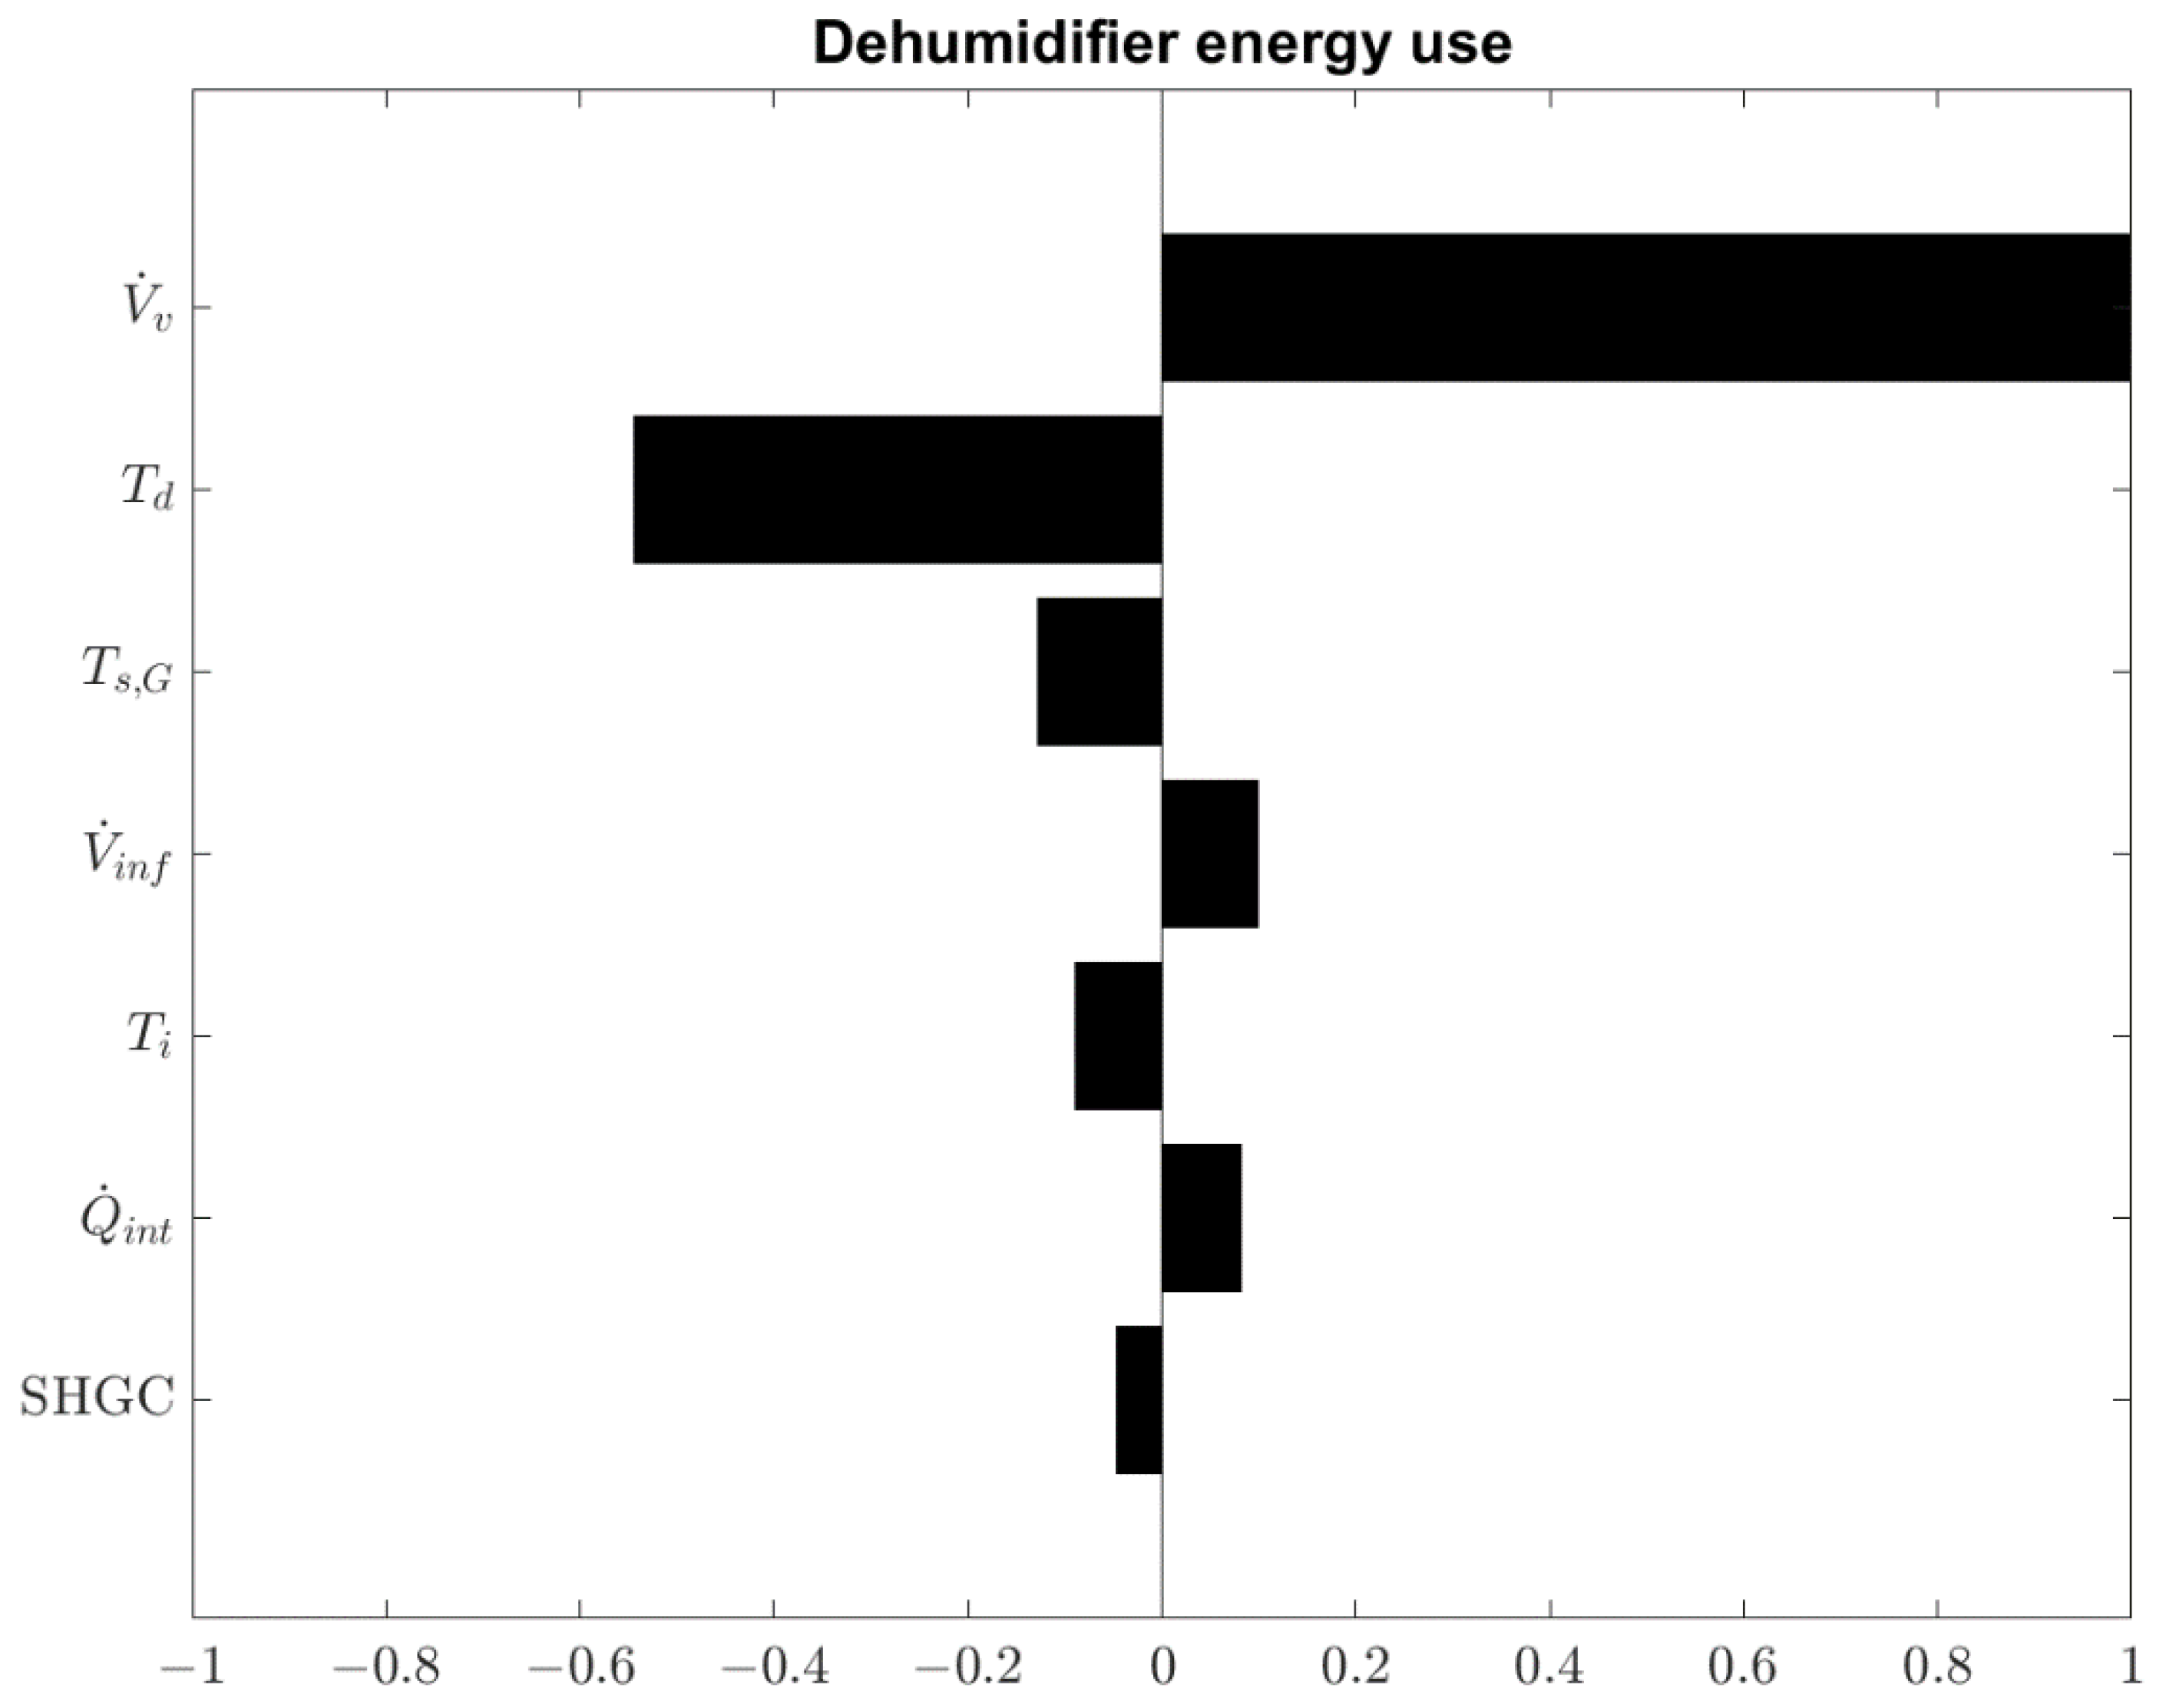
Figure 12. Each of the five figures present the importance of the input parameters, in order from most to least important, for one of the output variables selected for investigation. The input parameter’s importance is defined as its effect on the relevant output variable, meaning the most important input parameter has the largest effect and the least important input parameter has the smallest effect on the output variable in question. The importance is based on the input variable’s correlation coefficient. Positive values indicate a positive correlation, meaning increasing the value of the input parameter increases the value of the output variable, and negative values indicate a negative correlation, meaning increasing the value of the input parameter decreases the value of the output variable. Importance values of the input parameters are then normalised by dividing with the most important parameter for each studied output variable.
The results show that solar heat gain coefficient and indoor temperature setpoint are the most important input parameters for PMV and operative temperature. This indicates that a significant part of the cooling load is caused by solar radiation coming through the windows, even as the windows are equipped with polyvinyl chloride (PVC) shutters to reduce direct radiation. The most significant parameters for indoor relative humidity are the dehumidifier temperature setpoint and air infiltration through the building envelope. The dehumidifier temperature setpoint determines the humidity of supply air entering the building: a lower dehumidification temperature results in a higher latent cooling load removal rate. Infiltration through the building envelope allows humid outdoor air to pass into the building untreated, which leads to a higher latent cooling load. The most significant parameters for thermal energy use in the cooling panels are internal heat gains and solar heat gain coefficient, i.e., the two studied input parameters directly linked to the sensible cooling load of the building. Finally, the most significant variables for the dehumidifier energy use are the ventilation flow rate and the dehumidifier temperature setpoint. A higher flow rate requires more outdoor air to be treated, resulting in higher energy use. In contrast, low dehumidification temperature means a higher portion of the latent load per unit of supply air is removed, thus requiring more energy. The results are quantified in
Table 7. The table shows the most important input parameter for each output variable and the value of the output variable with the lowest and highest value of the most important input parameter within the studied range keeping the other input parameters fixed at the baseline values presented in
Section 2.3 and
Section 2.4.
The results show that the relative importance of the input parameters varies significantly between the five studied output variables: the only input parameter that is not among the two most important for at least one of the considered output variables is the available supply temperature from the ground. The figures also present significant correlations between some of the output variables: a high ventilation rate increases the energy use in the dehumidifier but decreases the energy use in the cooling panels, as the ventilation system accounts for a higher portion of the sensible cooling load. It is, therefore, clear that the building must be holistically considered when designing retrofit actions.


