Article

Design and Techno-Economic Analysis of a Novel Hybrid Offshore Wind and Wave Energy System

Marine Offshore Renewable Energy Lab (MOREnergy Lab), Department of Mechanical and Aerospace Engineering, Politecnico di Torino, 10129 Turin, Italy
*
Author to whom correspondence should be addressed.
Energies 2022, 15(8), 2739; https://doi.org/10.3390/en15082739
Submission received: 7 March 2022 / Revised: 1 April 2022 / Accepted: 6 April 2022 / Published: 8 April 2022

Abstract

:
In the past few years, advanced technologies such as floating offshore wind turbines (FOWT) and wave energy converters (WECs) have been developed. As demonstrated by the innovative hybrid platform Poseidon, the feasibility of combining floating wind turbines and wave energy converters has already been explored. Furthermore, diversification of offshore renewable energy technologies reduces power fluctuations and lowers investment costs. This paper focuses on the development of an integrated wind and wave platform and the creation of a numerical model to evaluate the system performance for the Belmullet site. The novel concept consists of the semi-submersible Nautilus platform, integrated with four-point absorbers. A hydro-servo-aero time-domain model, combining WEC-Sim with an in-house wind turbine model, simulated the device motion and estimated the power generated. The performance of the Wave Energy Converters (WECs) was optimised based on their Power Take Off (PTO) damping. Finally, the hybrid concept was compared with the simple FOWT concerning the energy produced, Levelized Cost of Energy (LCOE) and hydrodynamic stability. The hybrid configuration proved to be a promising solution with 10% lower LCOE and improved hydrodynamic stability evaluated in terms of nacelle acceleration and platform pitch motion. These results show that wind and wave could be one of the best solutions for the future of the marine energy sector and the energy transition.

1. Introduction

Due to problems such as pollution, energy crisis and sustainable development, the use of offshore energy is being driven by the global quest for renewable energy. For almost 2.4 billion people [1], corresponding to 40% of the world’s population, living within 100 km of the coast, ocean energy presents a convenient solution to tackle climate change while contributing to a more sustainable future. Coastal areas provide renewable energy sources in the form of wind, ocean currents, and waves. The theoretical resource potential of ocean energy could meet present and projected global electricity demand, as it is about 130,000 TWh of electricity per year [2], more than twice the current global electricity demand. Different technologies have been developed to harness renewable offshore energy. Wave and offshore wind energy are examples of marine renewables that could play an important role in the EU’s electricity mix. They are expected to meet 15% of European electricity demand by 2050 and up to 20% of national demand in some countries [3]. Emissions are planned to be reduced by at least 55% compared to 1990 levels, as defined in the 2030 climate target, while biodiversity will be protected [4]. Indeed, Europe has an offshore wind energy industry that has achieved remarkable developments throughout its supply chain, with large marine areas facing 89,000 km of coastline. Today’s installed offshore wind capacity is 12 GW and the European Commission estimates that an installed capacity of 300 GW for offshore and 40 GW for marine energy should be reached by 2050 [5]. EU policy also supports the development of an offshore renewable energy industry. For example, the “NextgenerationEU” Economic Recovery Plan has allocated 37% of EUR 672.5 billion for the green transition to a more sustainable future [6].
There are different types of support structures for offshore wind turbines: ground-fixed and floating support structures [7]. The floating support structure has the advantage that it can be used in water depths of more than 50 m where a larger amount of energy can be harvested [8]. The fixed bottom structure is replaced by the floating structure, which is cheaper in deep waters and can be deployed in a larger permitted marine space. However, FOWTs are usually subject to significant motions that can affect the aerodynamic performance of the turbine and cause additional structural loads [9]. One possible solution to this problem could be the use of damping systems [10] that passively dissipate the energy induced by the waves and improve the stability of the whole platform. Another solution is not to dissipate the energy induced by the waves, but to absorb the wave loads through wave energy converters (WECs) [11] and integrate them into the offshore wind power structure.
It has been proven that the combination of wave and wind energy:
  • brings better utilization of marine space;
  • reduces shared costs, such as installation and maintenance costs;
  • reduces offshore floater motion;
  • increases overall power generation, improving the use of the natural resource;
  • reduces the variability of the energy generated, as waves have less variability and are more predictable than wind [12].
Several commercial projects for hybrid wind and wave systems have been developed, such as Floating Power Plant’s Poseidon project, which consists of a floating triangular foundation [13], in which multiple pivoting absorbers convert energy into rotational energy. The WECs activate hydraulic cylinders that drive an electric generator, while the large stable platform is used as a floating foundation for wind turbines. Another floating hybrid system project is the W2Power power plant developed by Pelagic Power AS [14]. A triangular floating structure supports 3 MW wind turbines at each corner in the front while multiple oscillating body WECs placed on the three sides of the structure produce around 2–3 MW. The Kriso semi-submersible multiunit floating offshore wind turbine is another type of platform, which is quadrangular and equipped with four offshore wind turbines and wave energy converters (WECs) buoys on the sides [15]. The WEC buoys move vertically along the waves to absorb the energy, thereby producing electrical power from the hydrodynamic loads. SeaForLife [16] is developing an innovative device that combines a bottom-fixed wind turbine with a gravitational wave energy absorber named WEGA. The WindWaveFloat is another type of hybrid device that combines the WindFloat floating wind turbine developed by Principle Power with different types of WECs [17]. However, a preliminary investigation in 2011 showed that the wave energy conversion hardly affected the motion of the platform. Finally, the DualSub, developed by Marine Power Systems Ltd., captures both wind and wave energy from a single wind turbine and the orbital motion of three submerged floats. The first commercial DualSub platform is estimated to have a rated power of about 15 to 20 MW as wave energy and wind turbine technology evolves [18].
Numerical modelling of marine technologies can range from high fidelity models to low fidelity models. In general, there is also a trade-off between accuracy and computational cost. Computational Fluid Dynamics (CFD) are often very accurate, but are used to analyse local effects and do not consider a large number of simulations. For example, the winglet aerodynamics of the NACA 0017 aerofoil were analysed in [19], while the blades of a vertical axis wind turbine (VAWT) were analysed in [20]. More complex systems, such as a tidal array layout, could be also analysed with CFD, but at the expense of some approximations, such as assuming the turbines as generalized actuator disks [21]. Other approximations such as the use of a linear potential flow theory for estimating hydrodynamic loads can be also assumed, especially in optimisation studies and complex multi-body systems in which a low computational cost is required [22,23,24].
The integration of wind and wave technologies has also been explored in several scientific publications. Peiffer and Roddier [25] provided a detailed description of the numerical modelling and experimental testing of the hybrid platform consisting of the Wind Float structure and an Oscillating Wave Surge Converter (OWSC). Michailides et al. [26,27,28] proposed a combined semi-submersible flap system and performed an integrated time-domain numerical analysis of this system and related experiments. Muliawan et al. [29] demonstrated the benefits in total capital cost and power generation by installing an axi-symmetric WEC on a floating wind turbine. This approach also led to the patent for the Spar Torus Combination WEC [30]. Lee et al. [31] investigated in the frequency domain the performance of multiple heaving WECs placed on a floating semi-submersible platform that can be used as a support structure for multiple wind turbine. In [32,33], the WindWEC system combining the spar floating wind turbine and an oscillating WEC buoy was proposed and numerically investigated in the time domain. Finally, the Windfloat platform was investigated in combination with multiple heave point absorbers in [34]. The WECs were found to reduce the maximum horizontal force and the pitch moment on the platform, while increasing the maximum heave force.
Previous works [25,26,27,28,29,30,31,32,33] show that a hybrid system can increase the energy output of the system and actively reduce the global motions of the platform in general. Since the WECs use the same infrastructure, lower grid connection and mooring system costs can be expected for the same amount of energy from a FOWT. This paper proposes a preliminary assessment of a novel hybrid offshore wind and wave energy system that combines the Nautilus FOWT with four heave point absorbers. The preliminary assessment shows the feasibility of the proposed new technology, which makes this new concept very interesting for further investigation. This paper also provides an estimate of the energy production of the Belmullet site, where the WECs are optimised for optimal performance. The proposed methodology based on linear potential flow theory and an aero-hydro-servo time-domain model is particularly suitable for the large number of simulations required for this study. The hybrid system has several advantages compared to a pure FOWT, such as higher stability of the platform, higher power generation and cost sharing.
The paper is organized as follows: the Materials and Methods (Section 2) describes the floating foundation and integration of WEC. The Methodology (Section 2.2) explains the chosen design process. In particular, 
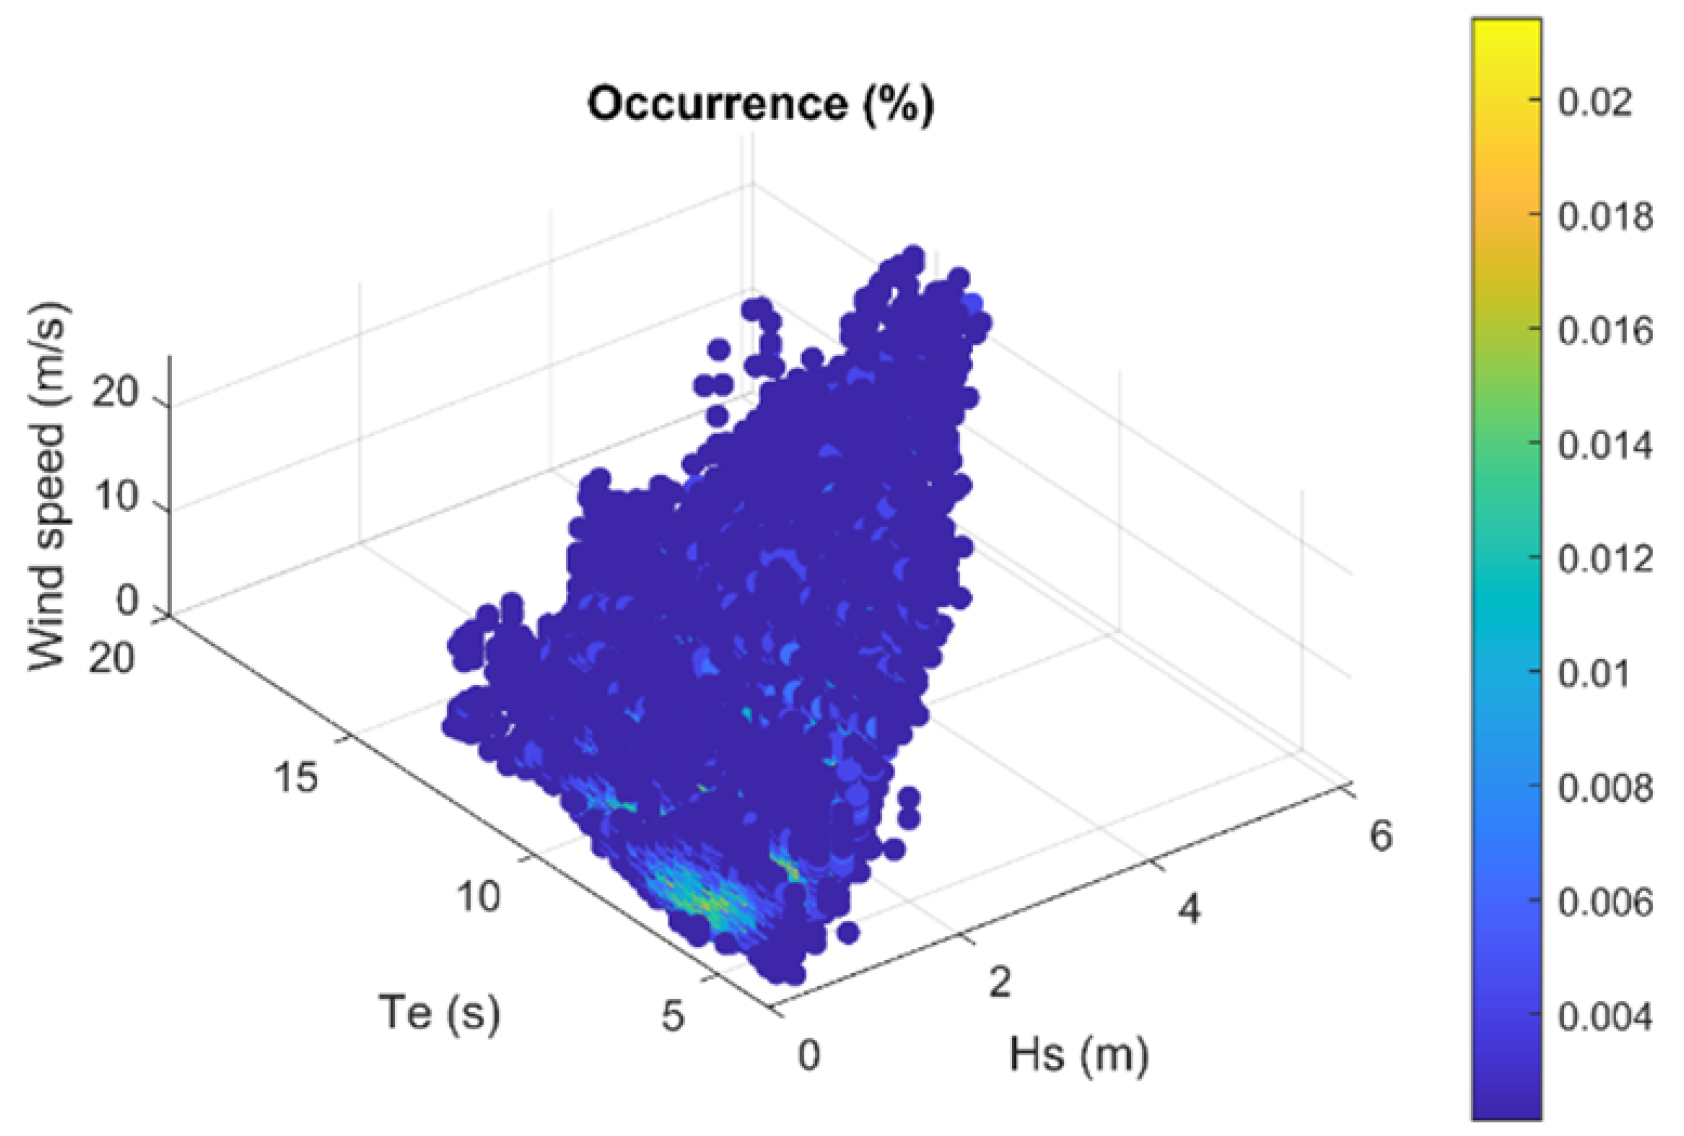
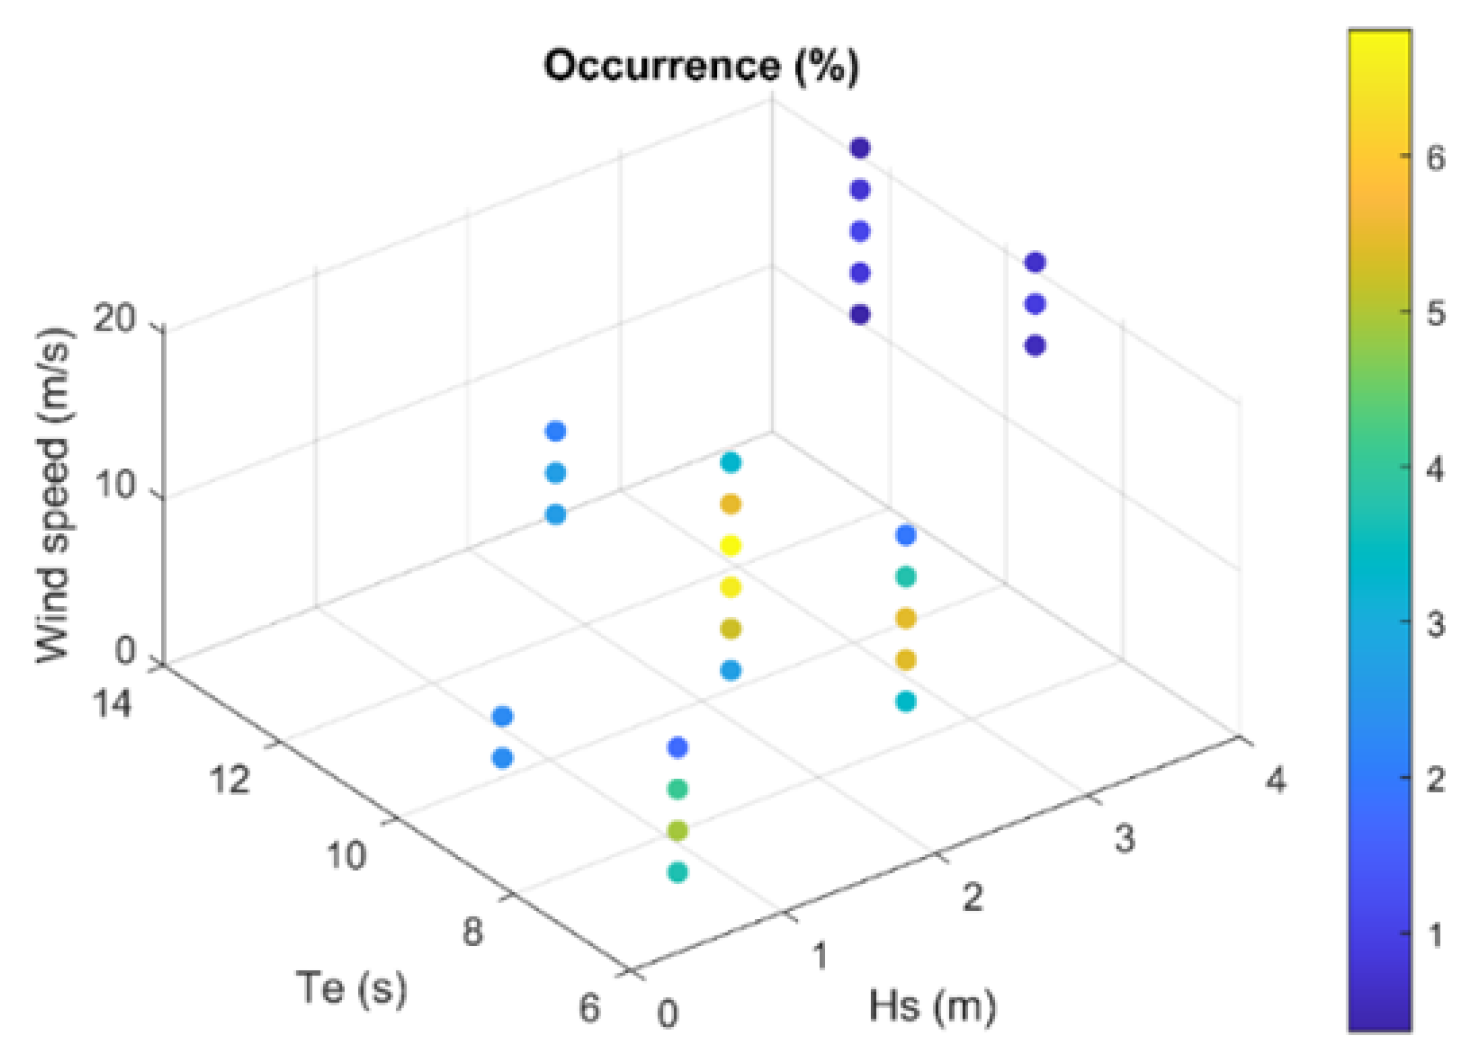
Section 2.2.2 describes the method of data extraction used to obtain the environmental conditions; 
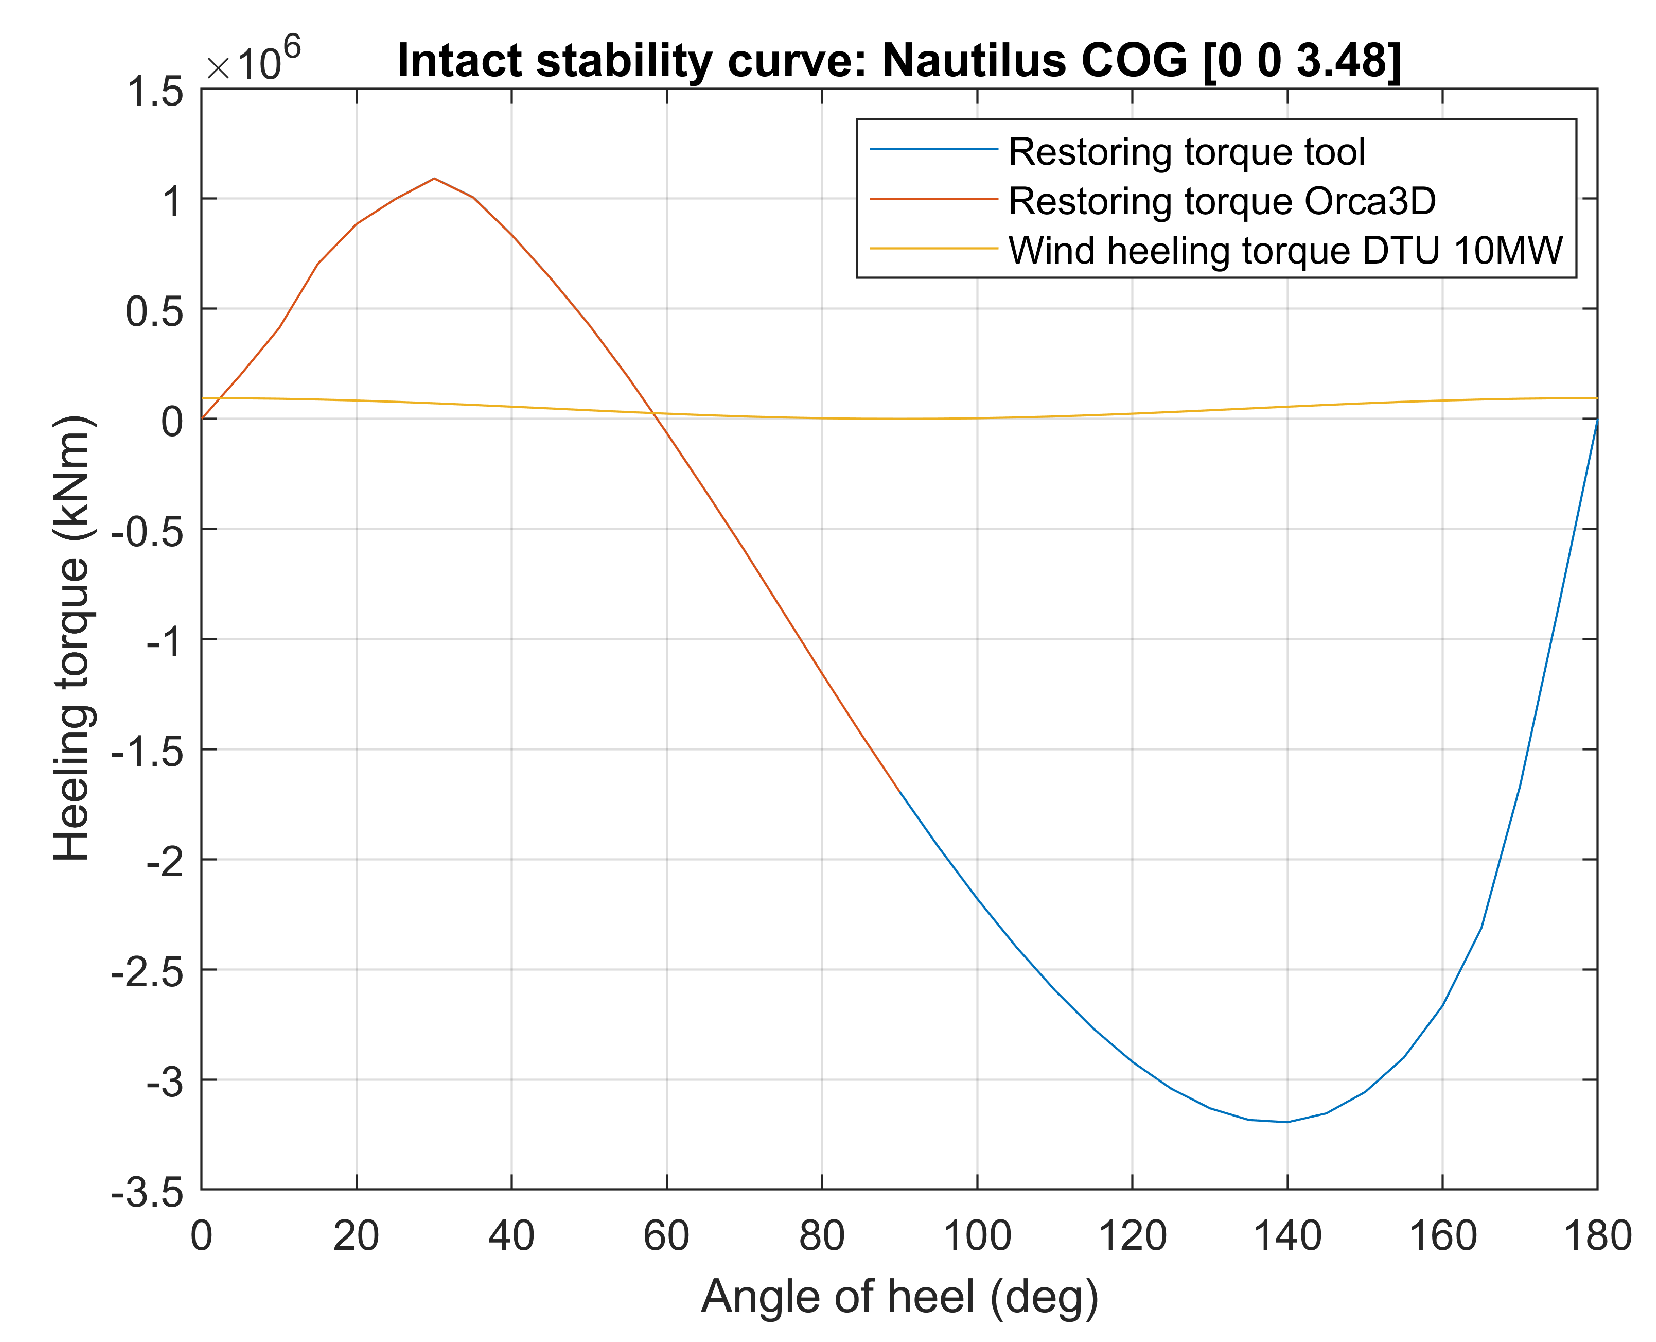
Section 2.2.3 shows the modeling framework to verify the static stability; Section 2.2.6 addresses the hydrodynamic modelling of the hybrid system; Section 2.2.7 analyses the mooring loads acting on the floating platform; Section 2.2.8 explains the method used for the control and for the calculation of the aerodynamic loads; Section 2.2.5 describes the time-domain modelling of the device; and, lastly, Section 2.2.9 describes the economic analysis. 
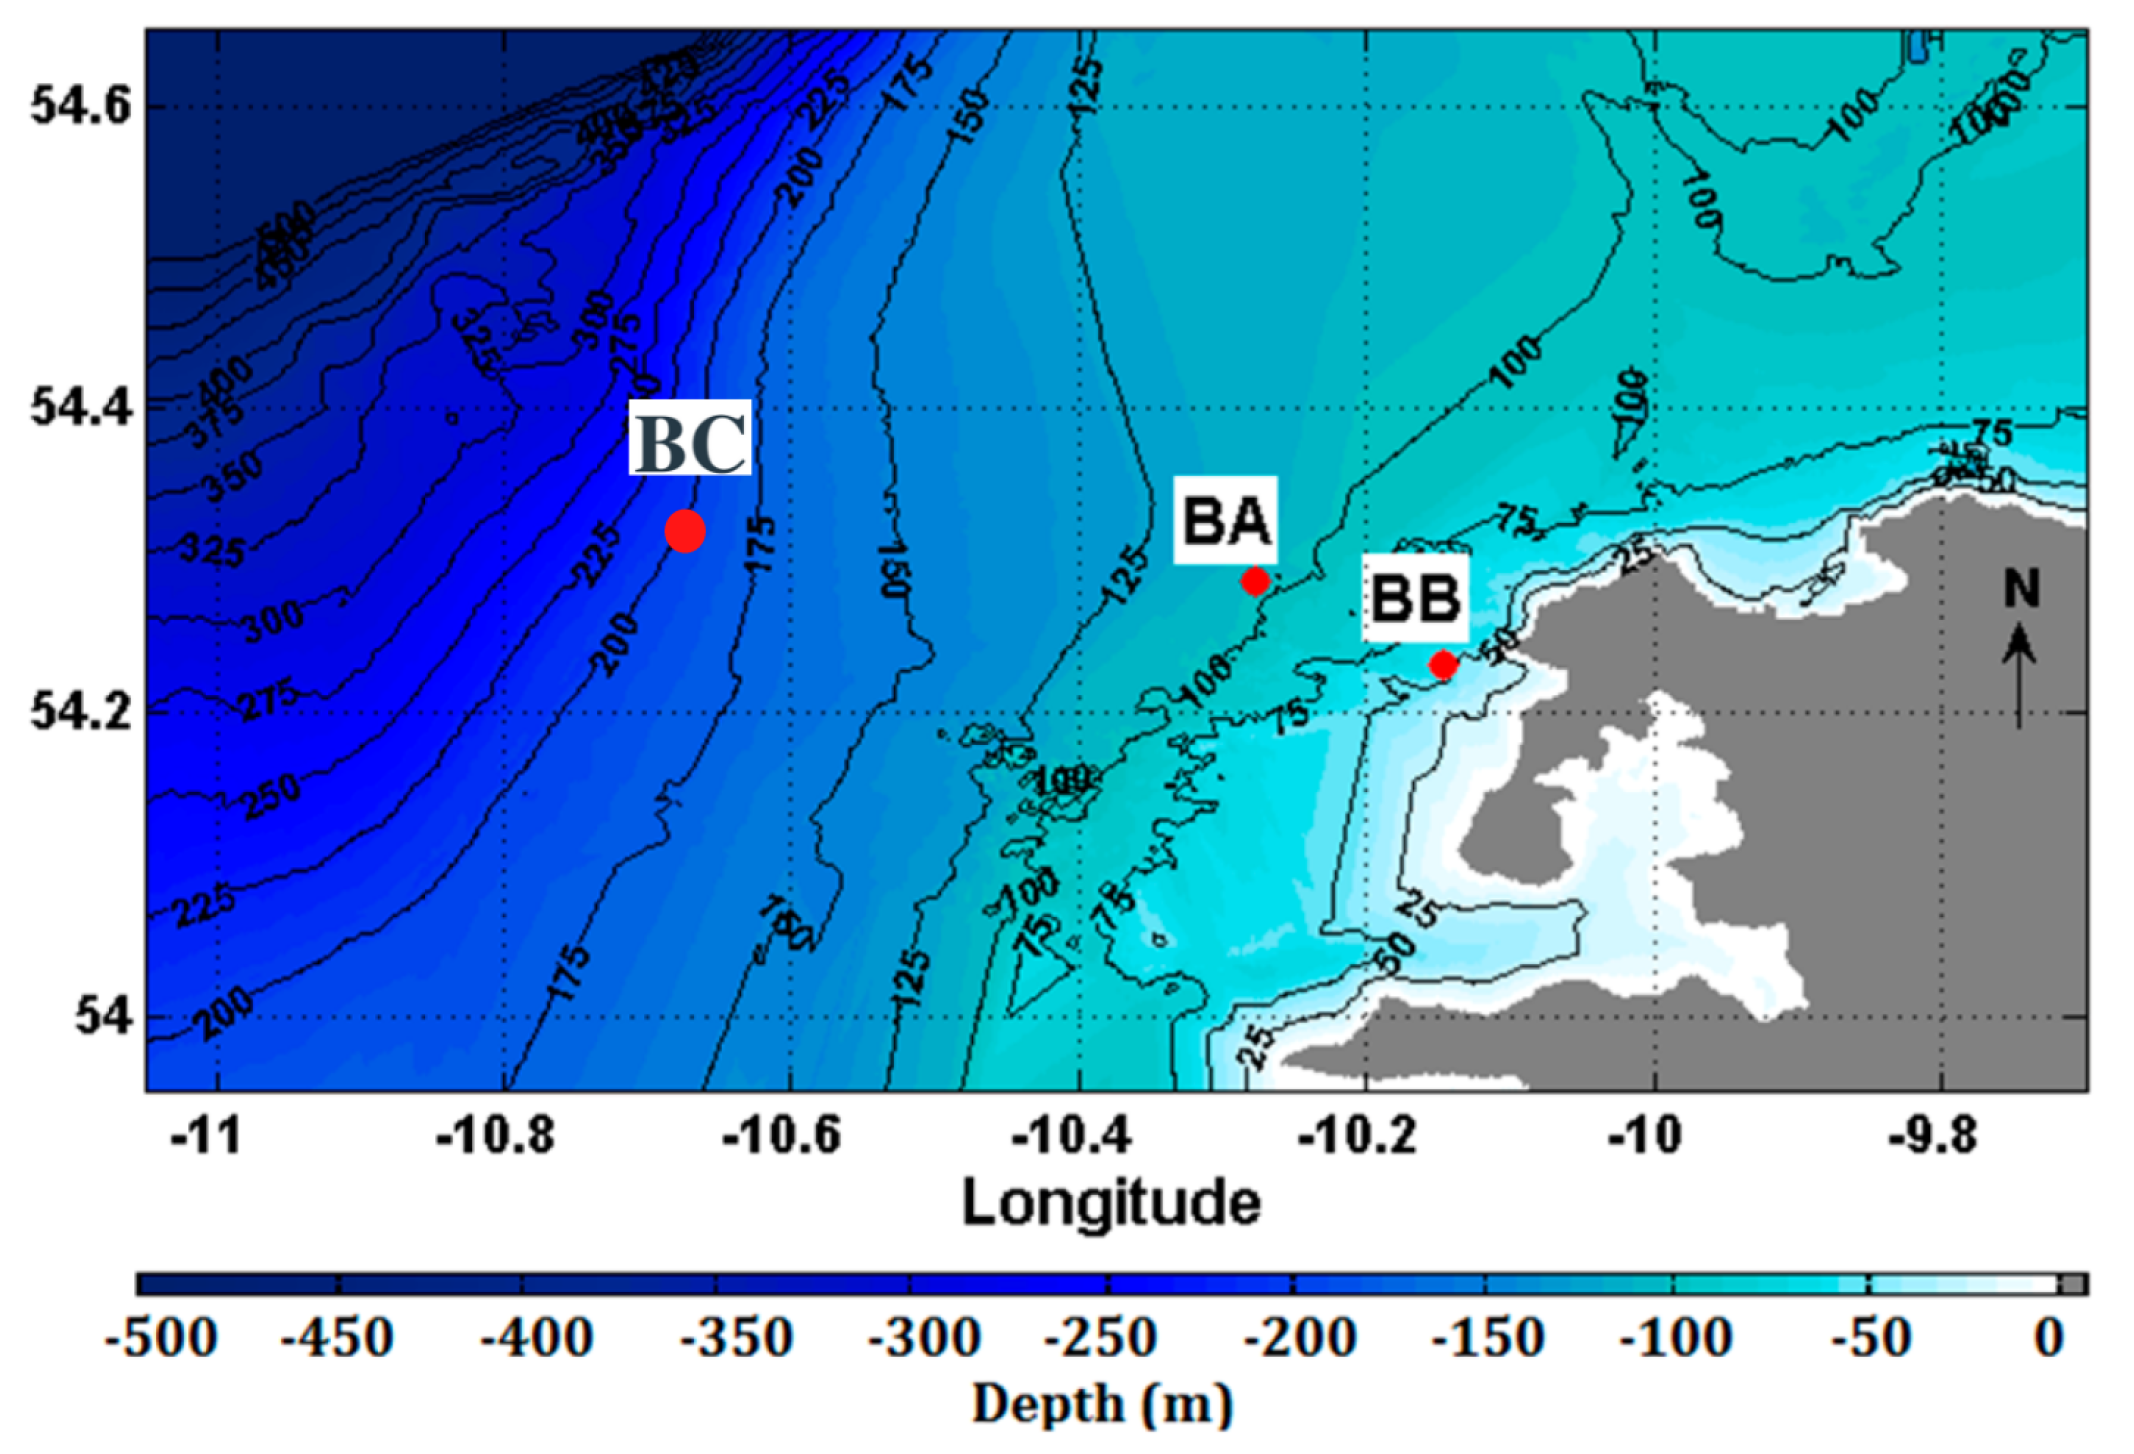
Section 2.2.1 provides the basis for determining the installation site; Section 3.2 describes the results of the data extraction;
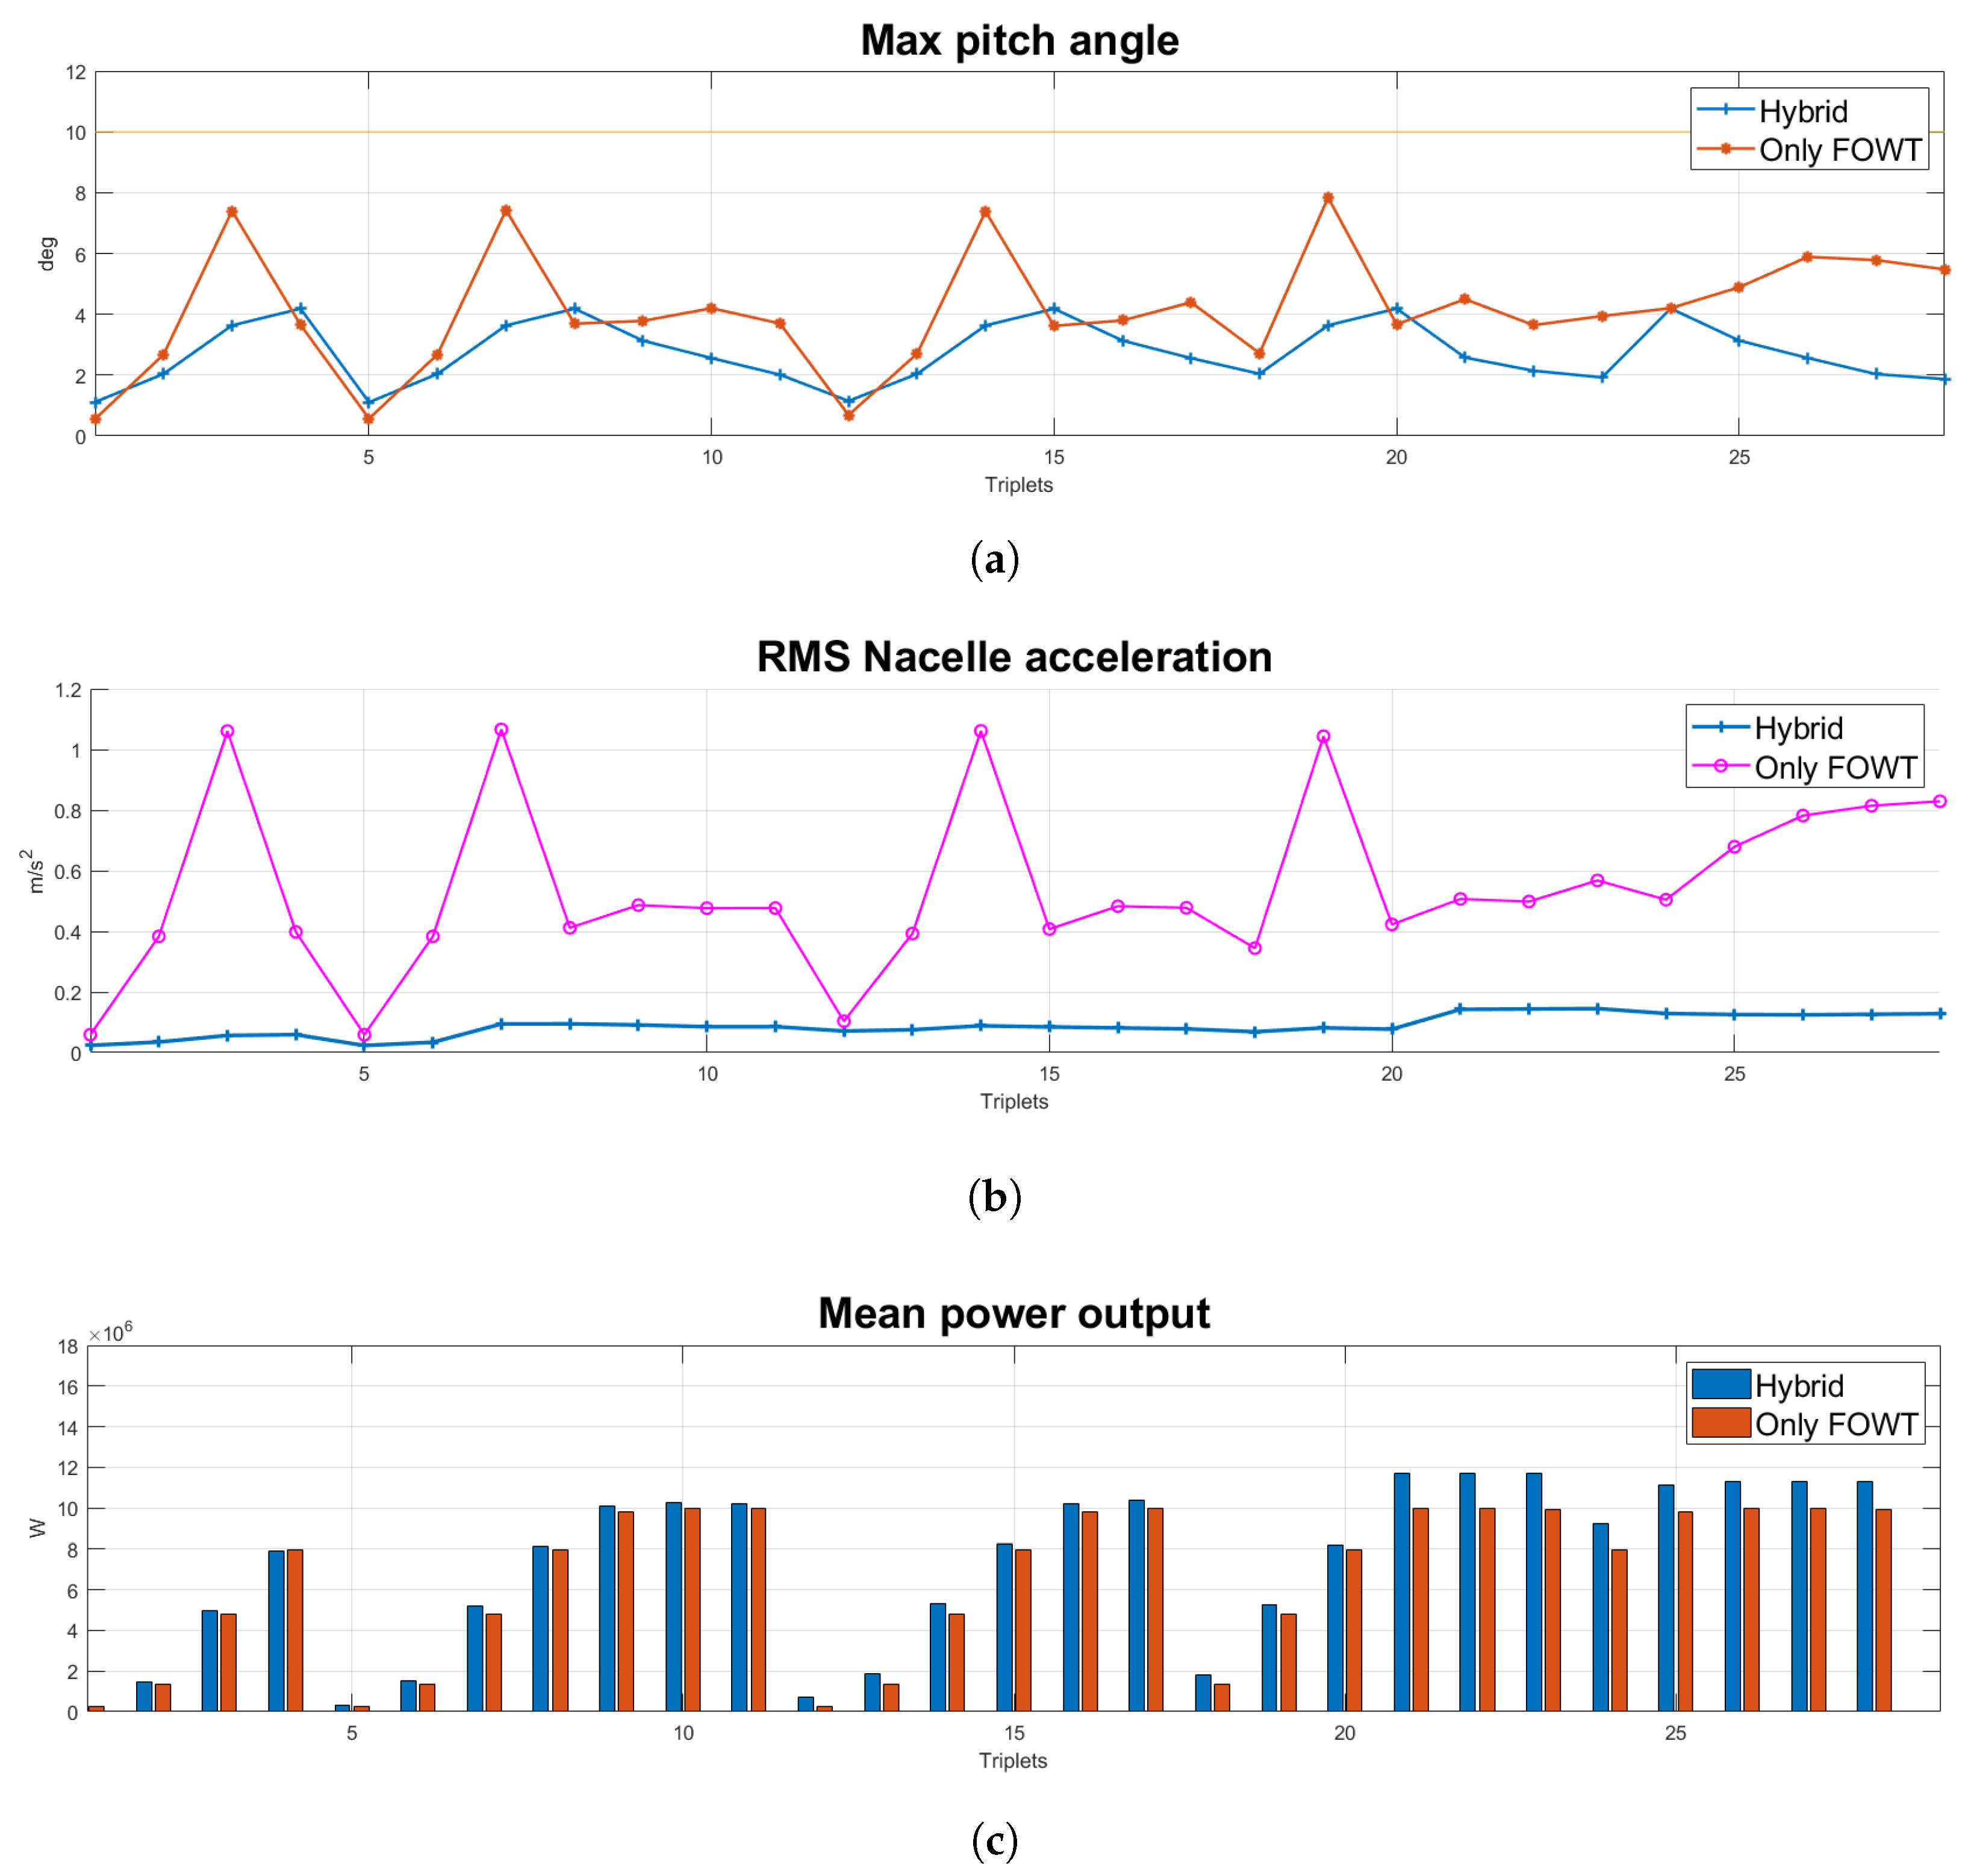
 Section 3.3 and Section 3.4 compares the hybrid and the FOWT in terms of dynamic stability, power extraction and economic assessment. Section 4 discusses the limitations of the study and compares it with other studies. Finally, Section 5 provides some conclusions.

2. Materials and Methods

2.1. Design of the Hybrid System

This section presents the main components of the hybrid model, which consists of the following subsystems: platform “Nautilus”, wind turbine DTU 10-MW and 4 RM3 point absorbers. In order to obtain a benchmark of the hybrid model, an equivalent FOWT model was created, consisting of the same turbine and the same concept of the platform.

2.1.1. Wind Turbine

The reference turbine developed by Danmarks Tekniske Universitet (DTU) is used in this project as information on commercial wind turbines is not not easily available. The DTU 10 MW Reference Wind Turbine (DTU 10 MW RWT) [35] was selected so that the substructure can be designed accordingly. The DTU 10 MW RWT serves as a basis for new optimised rotors, so that simulation tools for, e.g., structural simulations can be compared. The following Table 1 lists the most important information:

2.1.2. Point Absorber

The selected WEC device is the Reference Model 3 (RM3) described by the U.S. Department of Energy (DOE) (Figure 1). The DOE conducted a study [36] on the different types of marine energy converters (MECs) and spent several years developing a methodology to compare their performance. The RM3 device is a two-body point absorber that converts wave energy into electrical power from the relative heave motion between the two bodies. The float is designed to oscillate vertically along a column spar buoy, which connects to a reaction plate. The power conversion chain consists of a hydraulic system located inside the vertical spar column. The dimensions and mass properties of the full-size RM3 are shown in Table 2.

2.1.3. Floating Platform

The Nautilus platform is a semi-submersible floating platform designed by Nautilus Floating Solution [37]. It consists of a square submerged plate at the bottom and a cross plate at the top. The two plates are connected at the corners with four columns, while the wind turbine structure is placed in the middle of the cross plate. It is assumed that most of the structure is made of stainless steel. The platform is anchored to the seabed with a mooring system with four lines and is suitable for a sea depth of more than 150 m. First, the original reference platform [38] from the paper was considered for the design of the platform of a 10 MW wind turbine. The main geometric parameters are shown in Figure 2a. A counterweight pendulum attached to the platform with 4 tendons was added in both configurations. The design of the hybrid device shown in Figure 2b considers the integration of WECs in the Nautilus platform. The hybrid solution required some modifications to the original Nautilus concept [38]. The diameter of the columns was resized, to match the internal floater diameter (Figure 1). In contrast to the original RM3 concept, the reaction plate body was avoided. Thus, the torus-shaped float is directly connected to the column of the Nautilus platform. The final shape of the platform resulted from a parametric analysis of the main geometric features of the platform, checking hydrostatic equilibrium and DNV regulations. Figure 3 shows the coordinate system used in the numerical modelling of the floating system. The origin of the three-dimensional coordinate system is on the waterline. The z-axis points upwards, and the right-hand rule defines the y-axis of the system.

2.2. Methodology

The methodology used for the design process is shown in Figure 4. First, a static analysis is evaluated calculating hydrostatic parameters such as the minimum required draught, the maximum pitch angle, the metacentric height and the GZ-curves [39]. Then, the dynamic stability is checked considering the results of the hydrodynamic simulations, the mooring and the wind turbine. Hydrodynamic tools such as Ansys Aqwa can be used to determine the hydrodynamic coefficients that take into account the effects of the waves on the structure [40]. The dynamic simulation was made in a MATLAB/Simulink environment and considering the effects of both wind turbine and WEC dynamics [41]. The wave energy converters (WECs) were modelled using WEC-Sim, an open source software for MATLAB/Simulink. Aerodynamic modelling was performed using the in-house MATLAB tool MOST, developed at Politecnico di Torino [42]. The in-house model MOST was verified with FAST [43], a computationally intensive simulator for floating offshore wind turbines [44]. The reliability of the in-house model was measured, obtaining an average RMSE (Root Mean Square Error) for the position and output power of less than 2%. Environmental conditions are expressed as a function of wind speed, significant wave height and wave energy period. The JONSWAP spectrum was chosen for the estimation of wave resources because it is a good choice for the North Atlantic [45,46]. For the optimisation of the PTOs of the WECs, the MATLAB function ’fminsearch’ was used for 10 iterations [47]. The simulation was performed using a ENVY HP ’s PC i7 processor and took almost 15 h. Then, the annual energy production (AEP) was used for the final economic evaluation. Finally, the Hybrid and FOWT solutions are compared in terms of cost and LCOE. A sensitivity analysis is performed to understand the economic influence of the number of units on the farms. The configurations considered are:
  • 20 MW of wind turbine nominal power (+8 RM3 for Hybrid solution);
  • 100 MW of wind turbine nominal power (+40 RM3 for Hybrid solution);
  • 250 MW of wind turbine nominal power (+100 RM3 for Hybrid solution).

2.2.1. Case Study

The Belmullet site in the north of Ireland was chosen as the case study for this work. The west coast of Ireland offers the best resource in Europe in terms of wave energy potential. The accessible wave energy resource (Figure 5) in Irish waters is estimated as 21 TWh per year (i.e., two thirds of Ireland’s energy demand). The Irish Government is promoting wave energy development, installing up to 1.5 GW of wave and tidal energy systems by 2030. An ambitious plan of 4.5 GW capacity for offshore wind turbines is also forecast in [48].
The proposed deployment site is located next to the Atlantic Marine Energy Test Site (AMETS) [51,52]. The proximity to existing grid connections and transmission lines avoids the need to invest in new infrastructure and increases the utilisation of these lines. For this research, the BC site (Figure 6) was selected to compare only FOWT and Hybrid configurations. The site is located about 41 km offshore at 200 m depth.

2.2.2. Environmental Conditions

To simulate the average occurring meta-oceanic conditions, a dataset was extracted from the ERA5 website [54] for the decade between 2010 and 2019. Groups of triplets were formed from all combinations of wave height (Hs), wave period (Tp) and wind speed V0 (V0), comprising a total of 14,640 records. Different classes were defined to reduce the number of triplets, but the quality of the original values was somewhat lost. The different classes are shown in Table 3. A post-processed dataset consisted of the three previous meta-oceanic values plus the value of the occurrence associated with the triplet. This made it possible to extract the scatter matrix of the site.
Then, to extract the most useful value of the conditions to be simulated, an order of 3 rankings was decided:
1.
Occurrences
2.
Energy potential from the annual wave [55]:
P w a v e H s 2 T e
3.
Wind potential [56]:
P w i n d 0.5 C p ρ a i r A V 3
where A is the circumference area of rotor from the center to the edge of the blade, V is the mean value of wind velocity, ρ a i r is the air density and C p is the power coefficient.

2.2.3. Hydrostatic Stability-GZ Curves

The CAD model of the platform and the DTU 10 MW was created using SolidWorks. The total mass and other relevant data, such as the moment of inertia and the centre of gravity, can be extrapolated once the material has been assigned. A parameterised model was created in Excel to optimise the internal pontoon length and also the mass distribution more quickly. The following checks were considered for each geometry configuration:
1.
Check of the buoyancy (calculation of immersed volume and total weight)
2.
Check of the maximum pitch angle from the hydrostatic stiffness matrix and the metacentric height.
The next diagram (Figure 7) shows the workflow considered to obtain the final design of FOWT system.
The static pitch angle is calculated for a thrust force equal to 1500 KN as [57]
α s t a t i c p i t c h M t h r u s t / C 55
where C 55 is the pitch hydrostatic stiffness of the floating system.
The thrust moment is calculated as [57]
M t h r u s t F t h r u s t d
where d is the heeling arm due to the wind thrust and corresponds to the distance between the Center Of Buoyancy (COB) and the hub.
Then an in-house MATLAB code was used to check the static stability using a non-linear hydrostatic calculation for each heel angle. The centre of buoyancy, which is the centre of the displaced volume, and the centre of gravity are updated for each heeling angle. The GZ distance indicates the restoring arm between the gravitational and buoyancy forces. The restoring moment is defined as [57]
M r e s t o r i n g = F B G Z ( η ) = ρ g V G Z ( η )
where η represents the heeling angle and so greater the righting arm is, greater is the ability of the system to return to the starting position [39].
Standard DNVGL C301 [57] specifies two conditions for floating stability:
  • The area under the righting moment curve up to the second point of intersection or up to the flooding angle, whichever is smaller, shall be at least 30 % greater than the area under the heeling moment curve in wind up to the same limiting angle.
  • The curve of the righting moment must be positive over the entire angular range from the perpendicular to the second point of intersection.

2.2.4. Platform Thickness Verification

One of the fundamental problems was the exact distribution of mass. The thickness of the main structural elements of the platform must be carefully considered. The proposed DNV-OS -J103 regulation allowed the computing of the structure’s thickness which must not be less than [58]
t = 14.3 t 0 f y d = 7 mm
where t 0 is assumed by the regulation equal to 7 mm and f y d is the ratio between the value of the minimum yield stress and material factor for steel ( γ m = 1.1). This result was compared to all the main thickness value, which was an order greater than the prescribed minimum.

2.2.5. Time-Domain Modelling

The time-domain simulation is performed in a SimMechanics environment, a MATLAB/Simulink solver for dynamic multibody simulations. WEC-Sim [59], an open-source simulation tool developed by NREL in collaboration with SNL, is used to simulate the hydrodynamic bodies (floating platform and WECs). The dynamic behaviour of a time-dependent system is studied by solving the equation of motion in six degrees of freedom for each body. A coupled dynamic analysis of the FOWT in the time domain was conducted, including the dynamics of the rotor blades, the control system, the mooring and the platform. Figure 8 shows the overall implementation of the complete system in Matlab-Simulink. This is divided into two macroblocks: hydrodynamics (the platform and WECs are integrated and held by a mooring) and aerodynamics (the turbine model [60]).
As shown in Figure 8, the system is composed by several blocks representing the different components:
  • Moorings: mooring loads in 6-DOFs due to the mooring lines acting on the hull are provided for each time step. Mooring loads depend on the position of the hull in the 6-DOF.
  • Wind turbine: aerodynamic loads in 6-DOFs acting on the wind turbine rotor are provided for each time step. A variable speed and a variable pitch-to-feather control are simulated.
  • Platform and WECs: hydrodynamic loads in 6-DOFs acting on each hydrodynamic body are calculated for each time step.
WEC-sim was used to perform the numerical simulations to obtain the power output of the turbine and of the WECs and to verify the hydrodynamic stability. The visualisation of the simulation was available in Mechanics Explorer providing the stl files of the various geometries. These were created with SALOME [61] (see Figure 9).
The PTO of the WECs is described as a WEC-Sim translational PTO, which can simulate the power absorption of the linear PTO (Figure 10). The value of the power absorbed by the PTO model follows
P W E C = c v 2
where c is the damping value and v is the relative velocity of the float body in heave direction. The optimisation of the PTO was performed using the Matlab function fminsearch [47] with 10 iterations. For each environmental condition, an optimal PTO damping coefficient was determined that maximises the generated power. The latter is based on the Nelder–Mead numerical method [47] to find the minimum of a multidimensional function. It is a direct search method that is often used for non-linear optimisation problems. The convergence of the optimisation function is shown in Figure 11.

2.2.6. Hydrodynamics

The hydrodynamics of the floating systems are simulated in WEC-Sim with the hydrodynamic coefficients derived from the commercial software package ANSYS AQWA. ANSYS AQWA is based on a boundary element method (BEM) theory and a linear potential flow theory. The assumptions of the theory are a fluid assumed irrotational (without vorticity), incompressible (constant density), and inviscid (zero viscosity). A fluid potential Φ is defined as a function of displacement x, y, z and time domain t to represent the velocity field of the fluid [62,63,64]. Φ must satisfy the above conditions and the conservation of mass and momentum. The equation for the conservation of mass and momentum under the given assumption is reduced to Laplace’s equation ( 2 Φ = 0). As a result, the total velocity potential can be expressed as a superposition of contributions of incident wave and disturbances of floating body presence and motion [62]:
Φ = Φ D + Φ I + Φ R
where Φ D is the diffraction potential, Φ R is the radiation potential, and Φ I is the incident wave potential. Hydrodynamic forces (radiation, excitation and hydrostatic restoring forces) acting on a body can be calculated by integrating the hydrodynamic pressure on the body surface. The forces depend on the shape of the body and the frequency and amplitude of the incoming waves. The motion of a hydrodynamic body with six degrees of freedom in the frequency domain can be described as follows [62]
[ ω 2 ( A ( ω ) + M ) + ω B ( ω ) + C ] X ( ω ) = F e ( ω ) η ( ω )
where M is the body mass, B( ω ) is the hydrodynamic damping, A( ω ) is the added mass, F e ( ω ) is the excitation force and η ( ω ) is the complex amplitude of the incident wave, C is the restoring force coefficient, X( ω ) is the body motion.
Hydrodynamic interaction affects the flow field of one body on that of another. Therefore, approaches based on three-dimensional potential theory are used in the Aqwa software [62] in hydrodynamic analyses of complex multibody systems. The total superposition of the fluid potential describes the hydrodynamic interaction of multiple structures. Once the fluid potential is calculated, the excitation forces and the added mass and damping coefficients associated with the radiation force are expressed as follows [62]
F e , j m = F I , j m + F d , j m = i ω ρ S 0 , m [ ϕ I + ϕ d ] n j m d S
A j m , k n + i ω B j m , k n = i ρ ω S 0 , m ϕ r k n n j m d S
where the subscripts m, n correspond to the m-th and n-th structures, the subscripts j, k refer to the motion modes. F I , j m is the Froude–Krylov force due to incident wave, F d , j m is the diffraction force due to diffraction wave. ϕ I is the incident fluid potential, ϕ d and ϕ r are the diffraction and radiation wave potentials. S 0 is the mean wetted surface of the body.
Both the hybrid and the simple floating wind turbine platform were simulated in Ansys AQWA as their geometry varied (see Figure 12). The first step consisted in importing the Solidworks CAD model as a STEP file and then customise the configuration by selecting different elements of the system, such as the WECs and the assembly in a specific “part”. The next step was to define the environment, e.g., the seabed, which was modelled as a 2000 × 2000 × 200 m water cube with a density of 1025 kg/m 3 , the mass and the absolute position of the centre of gravity.
Then the analysis is performed for four different wave directions covering 360°, namely −180°, −90°, 0°, 90° and 180°. The intervals for the regular wave frequencies and the intermediate values are defined, in this case from 0.1 to almost 3 [1/s], with intervals of 0.5 s to cover the typical spectrum of periods spanned by sea and ocean waves.

2.2.7. Mooring

A catenary mooring system was designed for the floating system. The MoorDyn solver, that is a dynamic solver, was chosen for the simulation of the dynamic system [65]. It uses a lumped mass approach that discretise the length of the mooring line into small segments. Each segment of the rope (Figure 13) has identical properties such as unstretched length, diameter, density, and modulus of elasticity. The input of the mooring simulation are described in Table 4.
The mooring lines were designed to verify the static strength test. The DNV [66] recommendation for mooring lines prescribes to keep the tension acting on the chains line equal to
N C a p a c i t y N L o a d e f f e c t > 0
where:
N C a p a c i t y = S m b s N l o a d e f f e c t = C l o a d e f f e c t S F
The C l o a d e f f e c t = 1692 kN is found from the max value of the output files of a Moordyn simulation for an extreme sea state while the safety factor ( S F ) is equal to 4. N c a p a c i t y is considered equal to the minimum breaking strength ( S m b s = 13,201 kN) for a corresponding diameter chain’s size [67].

2.2.8. Aerodynamics and Control

The aerodynamic forces are calculated using the blade element momentum theory as described in FAST’s aerodyn15 module [43]. The theory is based on a Blade Element Model (BEM) method developed by Glauert [68] and calculates the velocities and loads acting on the wind turbine rotor for a variety of wind speeds. First, the rotor blades are divided into small elements represented by a two-dimensional airfoil. The surface of the rotor disk (Figure 14) is divided into rings of thickness dr; each ring consists of Z blade elements of length dr. The force contributions of all rings are summed along the span of the blade to calculate the total load on the rotor. Then, the rotor behaves like an actuator disc (momentum theory), extracting kinetic energy from the wind and thus gradually decelerating the flow so that it becomes incompressible and frictionless. The momentum loss in the rotor plane is used to calculate the axial tangential velocities, which affect the forces calculated from the blade element theory.
Starting from the two-dimensional approach, this means that there is no pressure difference along the radial distance of the blades due to their symmetrical shape. The cross-section of an airfoil divides the incoming air into two streams that are forced to follow the curved shape. Since the direction of the momentum of the particles changes with the flow, there is a pressure gradient δ p δ r = ρ V 2 r > 0 from the lower to the upper surface, and since the pressure must be zero far from the blade, there is a pressure drop. The resulting general forces (Figure 15) are: drag D, which is parallel to V0 and carries the effect of friction caused by the air; the lift L, which is perpendicular to the direction of the undisturbed wind speed V0 and carries the effect of the pressure difference; and a moment M, which normally acts on a quarter of the length.
In the Simulink-MATLAB environment, the in-house model [42,60], calculate the aerodynamic forces using a look-up table.The contribution of each blade to the axial thrust force and torque is a function of three input variables: the average wind speed on the blade, the angular velocity of the rotor, and the blade pitch. The average wind speed is determined by interpolating four points in the wind grid along the length of the blade. The wind values are calculated using NREL’s Turbsim software [71]. The wind is represented by a two-dimensional grid of 270 m × 270 m with a discretisation of 17 × 17 points. The mean wind speed refers to the speed at 100 m above sea level. The coupling between the platform motion and the aerodynamic loads is taken into account, for example, by adding the horizontal hub speed to the wind speed, since the relative wind speed influences the aerodynamic loads. Finally, the aerodynamic forces do not consider the flexibility of the blade and tower (rigid body assumption), the deflection of the wake due to the rotor misalignment to the wind, and the wake dynamics. The aeroelastic behaviour of the wind turbine blades might be crucial in a fatigue analysis, but in this study only the power and platform motion were investigated.
The control system chosen for the DTU 10-MW wind turbine was a conventional variable speed, variable pitch-to-feather configuration [72]. It consists of two independently operating control systems: a generator torque controller is designed to maximise power extraction below the rated point; a full span rotor collective blade pitch controller is designed to control generator speed above the rated point. The rated or rated point is defined as the reference operating point for maximum continuous power conversion, towards which the control system steers.

2.2.9. Economic Assessment

A techno-economic analysis was carried out to compare the FOWT with the hybrid solution. CAPEX and OPEX of the hybrid system are assumed by [36,73]. Ref. [36] is a specific report that provides an economic analysis of the RM3 point absorber model. The economic hypothesis of the FOWT system were considered using [73].
The CAPEX of the wind turbine turbine and the platform ( C A P E X T P ) is obtained as follows
C A P E X T P = [ n d e v ( C t + C P + C m ) + C P C i L i ] + C P C t L t + C d e c
where n d e v is the number of the devices, C t is the turbine unit cost, C P is the cost of manufacturing of the floating platform and C m is the unit cost of the mooring system. C P C i is the specific cost in EUR /m of the internal array Power Cables and L i is its estimated length. C P C t is the transmission Power Cable specific cost in EUR /m and L t is the distance between the offshore power substation and the shore. C d e c corresponds to the decommissioning cost (3% of total CAPEX). The CAPEX for a single WEC is evaluated as follows
C A P E X W E C = [ ( C f + C P C C ) P W E C P o w e r ] + C d e c
where C f is the specific cost in EUR /kW of the float, C P C C is the specific cost in EUR /kW of the Power Conversion Chain (PCC). P W E C P o w e r is the rated power of the WEC assumed from [36].
The CAPEX of a farm with a certain number of devices ( n d e v ) is obtained as
C A P E X W E C s = 4 · C A P E X W E C n d e v S f
where S f is the scaling cost factor compared to a 20 MW farm, obtained from [36]. S f is assumed as
  • S f = 0.87 for a 100 MW farm;
  • S f = 0.77 for a 250 MW farm;
The total CAPEX of the farm for Hybrid and Only FOWT is obtained as
C A P E X H y b r i d = C A P E X W E C s + C A P E X T P
C A P E X O n l y F O W T = C A P E X T P
The manufacturing cost of the platform is calculated as
C P = m a s s p l a t f o r m p r i c e s t e e l + m a s s b a l l a s t p r i c e m a g n e t i t e
where p r i c e s t e e l = 3000 EUR /ton [74], p r i c e m a g n e t i t e = 150 EUR /ton [75]. m a s s p l a t f o r m of the FOWT and hybrid are, respectively, 16,332.8 ton and 11,339.0 ton. Only the floating torus structure, its electrical cables and the structural connection to the PCC system were taken from the RM3 design, as the other elements are already included in the platform. Cost reduction opportunities are determined for each farm configuration considering a scaling factor [36]. In fact, a cost reduction is possible as the 4 WEC units share the same site and a single monitoring can be carried out instead of 4 separate ones. A scaling factor has been used to represent this cost reduction, which is due to the absorption of the costs of the shared operations and maintenance teams. In particular, the O&M costs are assumed to be 2.5% of the CAPEX costs as described in [36].
A certain number of devices are used in a wind and hybrid farm ( n d e v ). The total annual energy production ( A E P ) of the wind turbines is thus calculated as [73]
A E P t u r b i n e = 8766 η l o s s n d e v i = 1 n P W T i f ( i )
where:
  • n = 28 is the number of environmental conditions;
  • η l o s s is the efficiency due to the electrical grid energy losses evaluated 3.6% [73];
  • f(i) is the occurrence;
  • P W T i is the total power produced by the wind turbine for a single device and for each environmental condition.
It was found almost the same A E P value related to turbine power output between the stand alone FOWT and the hybrid one. The A E P for W E C s is calculated as [36]
A E P W E C = 8766 η i n d e v i = 1 n P W E C i f ( i )
  • η i = 0.95 is the transmission efficiency [76];
  • P W E C i is the total power produced by the four WECs for a single device and for each environmental condition;
  • f(i) is the occurrence value.
Then, L C O E is used as a final stage to measure and evaluate the value of the investment for different power generation technologies. It is a measure of the average net cost of electricity generation for an electric production facility. It is described as [22]
L C O E = I 0 + t = 1 n A t ( 1 + t ) t t = 1 n M e l ( 1 + t ) t
where:
  • M e l is the total amount of Energy production;
  • A t is total OPEX value;
  • I 0 is total CAPEX value;
  • The operational lifetime (n) is 25 years, while an 8% value has been considered for the weighted average cost of capital (t), as proposed in the Offshore Wind Outlook [53].

3. Results

3.1. Hydrostatic Analysis

The model was verified by comparing the result of the simulation of the platform with the commercial software Orca3D [77], which is widely used. Figure 16 shows the validation of the in-house model compared to Orca3D result for the not yet optimized Nautilus’ platform. The platform parameters of this configuration are described in Table 5. Figure 17 shows the GZ curve of the optimised FOWT and hybrid platform with mass and geometry parameters described in Table 6. All the constraints of the DNV regulations mentioned above on the static stability are respected as the GZ curves are much larger than the wind heeling torque.

3.2. Data Extraction

Figure 18 shows a 3D representation of the original data set with almost 14,000 records. However, triplets were reduced as described in Section 2.2.2. Table 7 shows the final scatter matrix obtained as a result of the filtering steps. The selection of the dataset covered 76%, 77% and 78% of the total occurrence, wind energy and wave energy resource. A 3D visualization of the final data set is shown in Figure 19 where the color-bar legend on the side describes the occurrence for each triplet. The triplets are also listed in the Table A1 in the Appendix A.

3.3. Comparison between FOWT and Hybrid System

FOWT and the hybrid system are compared in terms of dynamic stability and power production. DNV regulations are considered to impose various constraints on a floating offshore wind turbine. The maximum value of the pitch angle for each triplet simulation is shown in Figure 20. A maximum pitch value of almost 8 was recorded for the single FOWT, which is twice the maximum result of the hybrid system (almost 4 ). Then, the values obtained from the nacelle acceleration were checked, using the same limit of 0.6 m/s 2 from the European project COREWIND [78]. Here, the root mean square (RMS) nacelle acceleration’s curve oscillates dramatically for the only FOWT system reaching a peak above 1 m/s 2 . In contrast, the curve described by the RMS nacelle acceleration of the hybrid system has a peak that is an order of magnitude lower than that of the previous system ( M a x R M S N a c e l l e A c c e l e r a t i o n = 0.14 m/s 2 ). As described in [79], it is crucial to control this parameter as its amplitude is directly proportional to the fatigue of the wind turbine tower and reduces the fluctuating load on the system. Figure 21 represents the pitch motion, nacelle acceleration and power output in the time-domain of the hybrid system against only FOWT system for the following triplet ( H s = 4 m; T p = 10 s; V 0 = 14 m/s). The pitch motion and nacelle acceleration are reduced for the hybrid system. The power produced from the wind turbine is similar but the hybrid system produces some further power from the WECs. Figure 20c describes the average power output of each triplet and compares the two systems. The amount of energy is extremely low in some cases because the average value of the wind speed for some triplets is 3 m/s, which means that the wind turbine does not operate most of the time or operates at a very low efficiency. There is a considerable difference between the two systems, especially in a windless scenario. For example, the generated power by the hybrid solution is 151% higher than FOWT for the 12th triplet. Overall, the hybrid solution generates 5.6% more energy against the FOWT solution. We can observe that the overall annual energy for the hybrid and the Only FOWT solutions is 43.3 GWh (of which 2.3 GWh from WECs) and 41 GWh, respectively.

3.4. Economic Assessment Results

3.4.1. CAPEX Analysis

The CAPEX of the hybrid wind and wave solution’s and the simple FOWT are shown in Figure 22 and Figure 23, respectively. The cost of the FOWT is similar between the two systems as the influence of the structural mass on the overall cost of the wind turbine is quite limited. The CAPEX of the WECs is influenced significantly by the manufacturing cost of the floats (around half) and then by installation and PCC costs.

3.4.2. LCOE Results

The LCOE of the hybrid configuration and the FOWT system are 146 EUR /MWh and 157 EUR /MWh, respectively. This means that the hybrid system is more competitive in the energy market than the FOWT system alone. Some reference values of [80] for power plants between 20 MW and 500 MW are considered in this work to investigate further reduction of LCOE. The results are presented in Figure 24. For both systems, a considerable reduction in costs is observed as the size of the farm increases. The C P C t , which represents the transmission power cables cost, is assumed constant. So, a LCOE reduction when the size of the plant is increased is justified by the different impact of this cost on the total CAPEX. In particular, the impact of C P C t will be reduced for a farm of 100 MW and 250 MW compared to a 20 MW farm. For the hybrid solution, there is a further reduction in the LCOE, taking into account the scaling cost factors of the WECs, as explained in Section 2.2.9. For the hybrid systems of sizes 100 MW and 250 MW, the LCOE is significantly lower compared to the power plant of size 20 MW, with a decrease of 16% and 20%, respectively. The relative difference between hybrid and FOWT power plants also increases with a larger plant (from 9% to 12%).
It is estimated that Ireland could achieve a 40% reduction in current costs. This is according to a 2020 study by Carbon Trust, which analysed the sectors of the Irish offshore wind market in the supply chain and examined the strengths and critical issues [81]. Ireland has also shown some interest in innovations related to the use of artificial intelligence, automated control and drones to improve turbine reliability and reduce maintenance costs [82]. Figure 25a shows the LCOE estimate for a floating wind farm for the year 2030. The report [81] also estimates that the value of the WACC would vary between 8% and 4% over the same period (Figure 25b).

4. Discussion

Preliminary evaluation of the hybrid solution presented in this study showed improved performance compared to a floating wind turbine alone. Our results are in good agreement with previous studies in which WECs help to reduce the motion of the platform. In [34], for example, the addition of WECs in the floating WindFloat structure helped to reduce the horizontal force and pitching moment of the platform.
The potential synergy of a wave energy converter on the floating WindFloat platform is also described in [25], while in [26,33] a power increase of 1–8% was identified for the hybrid system. A combined concept involving a spar-type FOWT and an axi-symmetric two-body WEC not only reduced the total capital cost but also increased the total electricity production [29]. However, another study [30] shows that the heave response of a hybrid platform of four 3 MW wind turbines is only slightly affected by the PTO damping of the WECs.
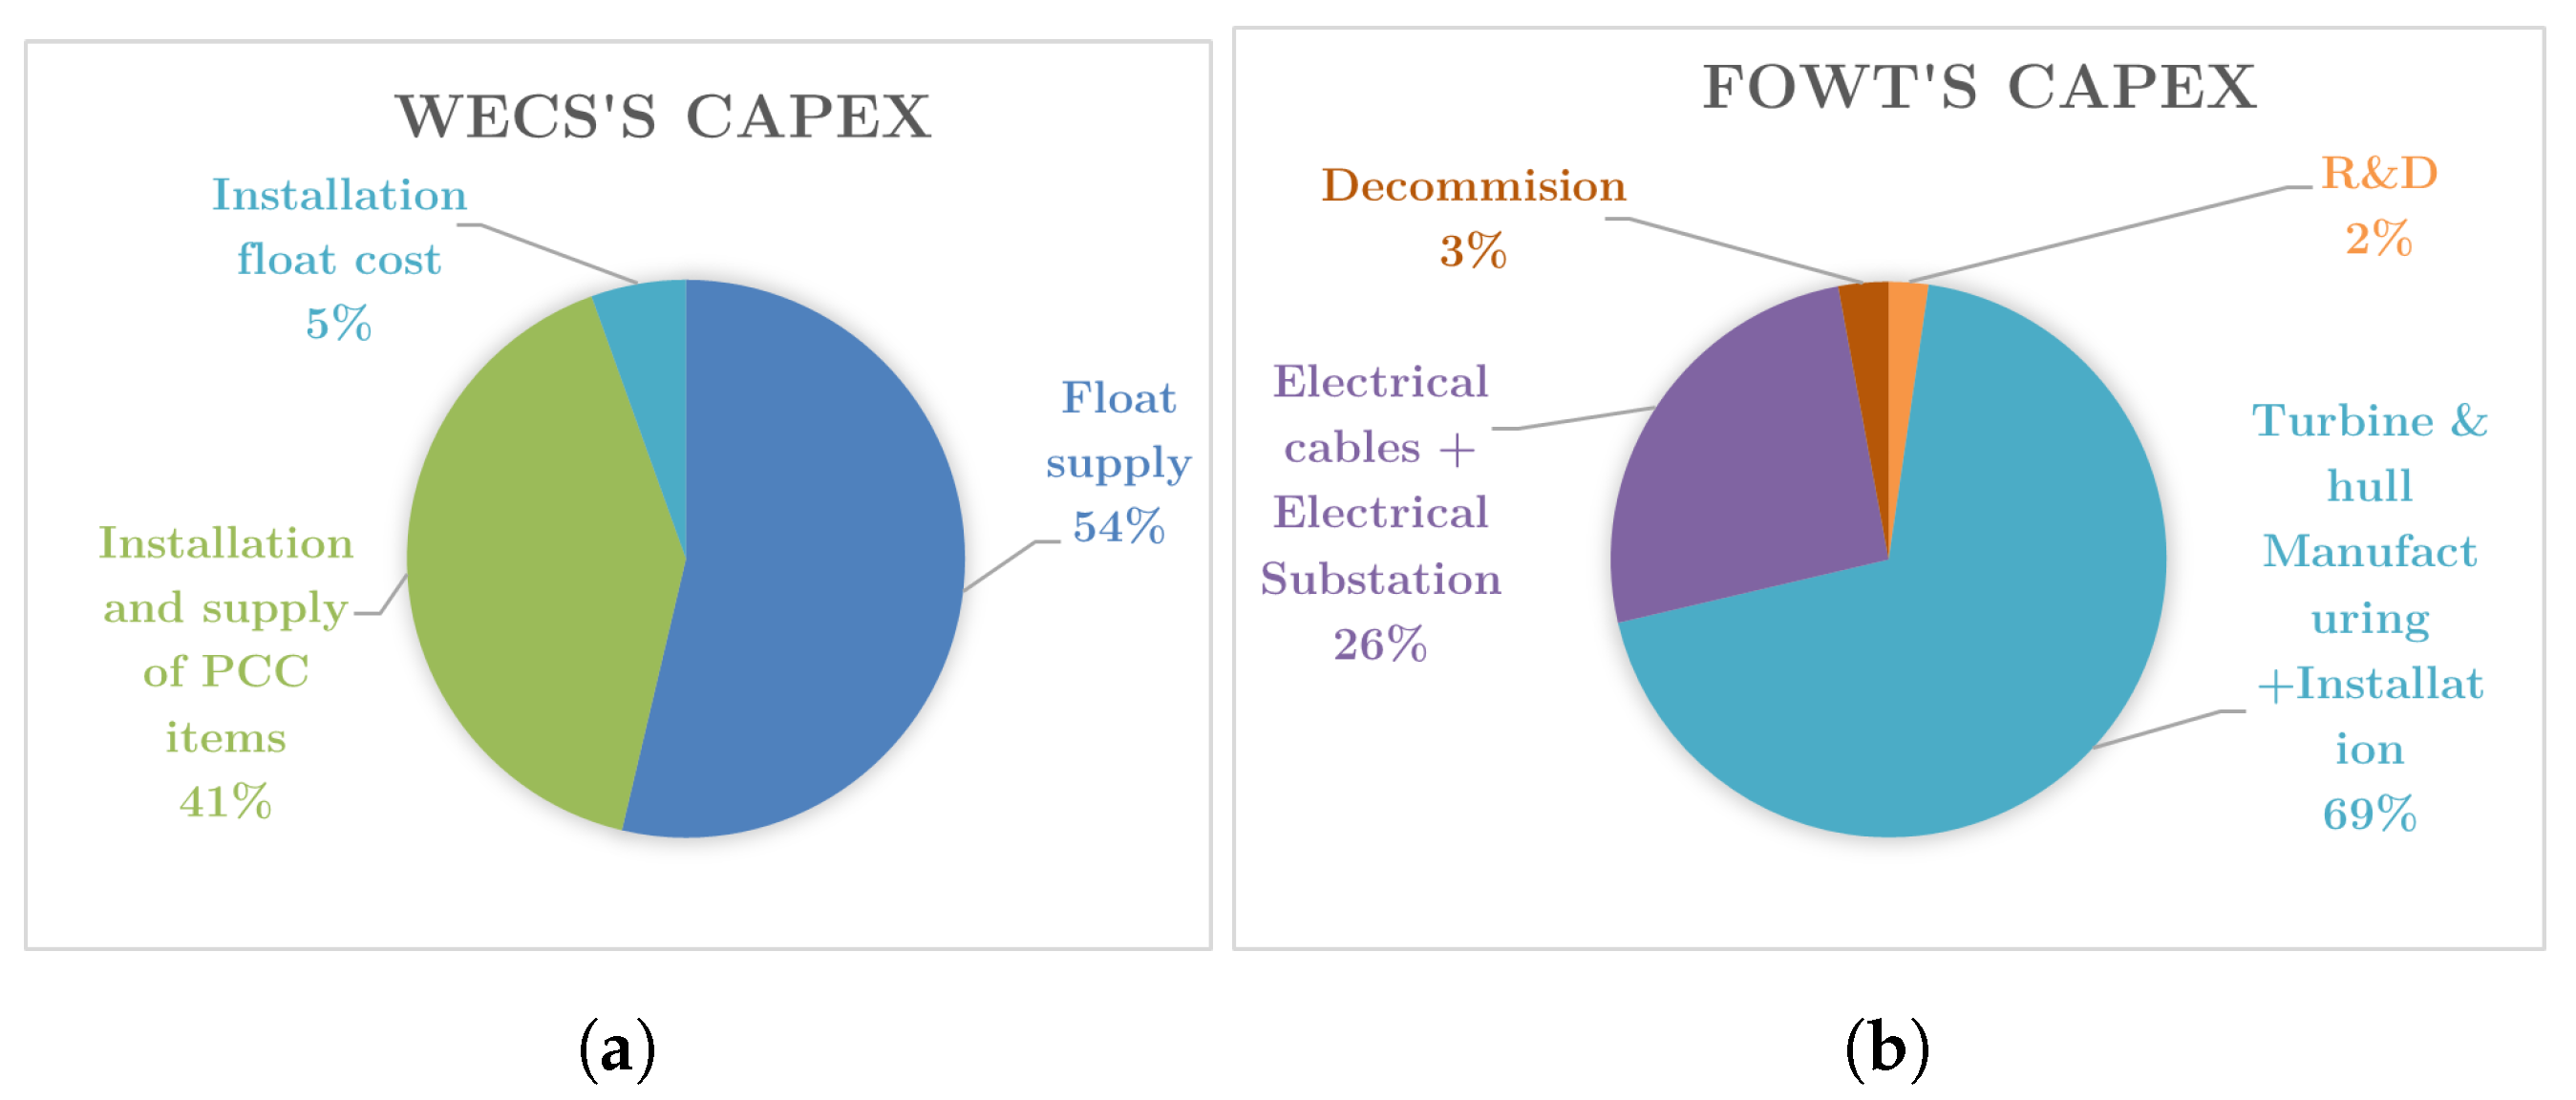
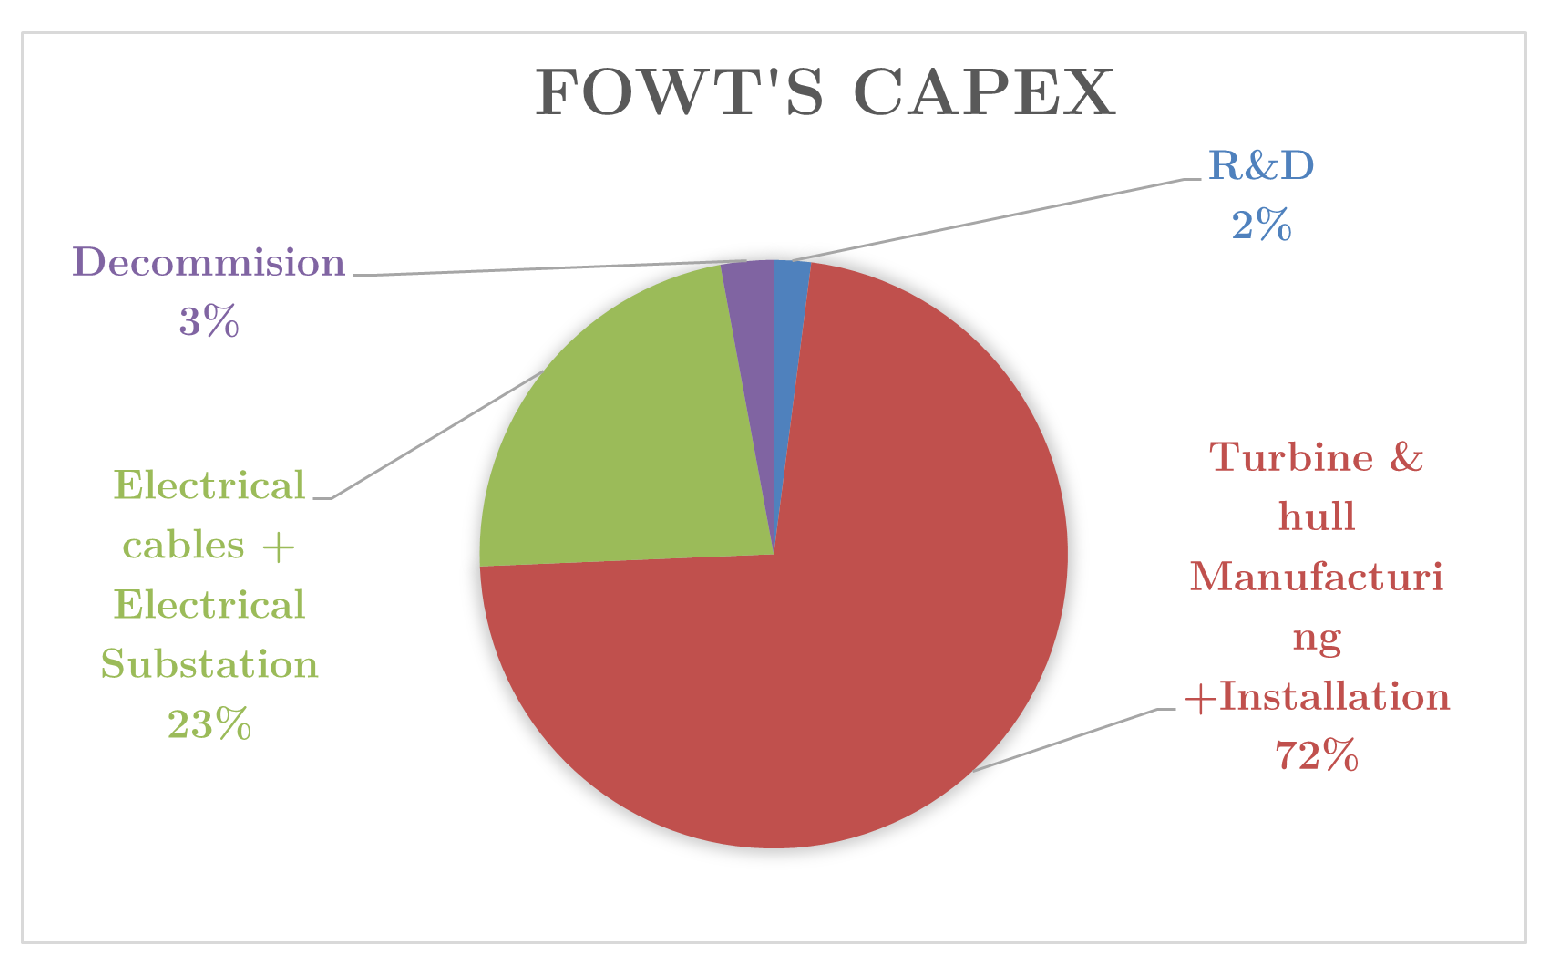
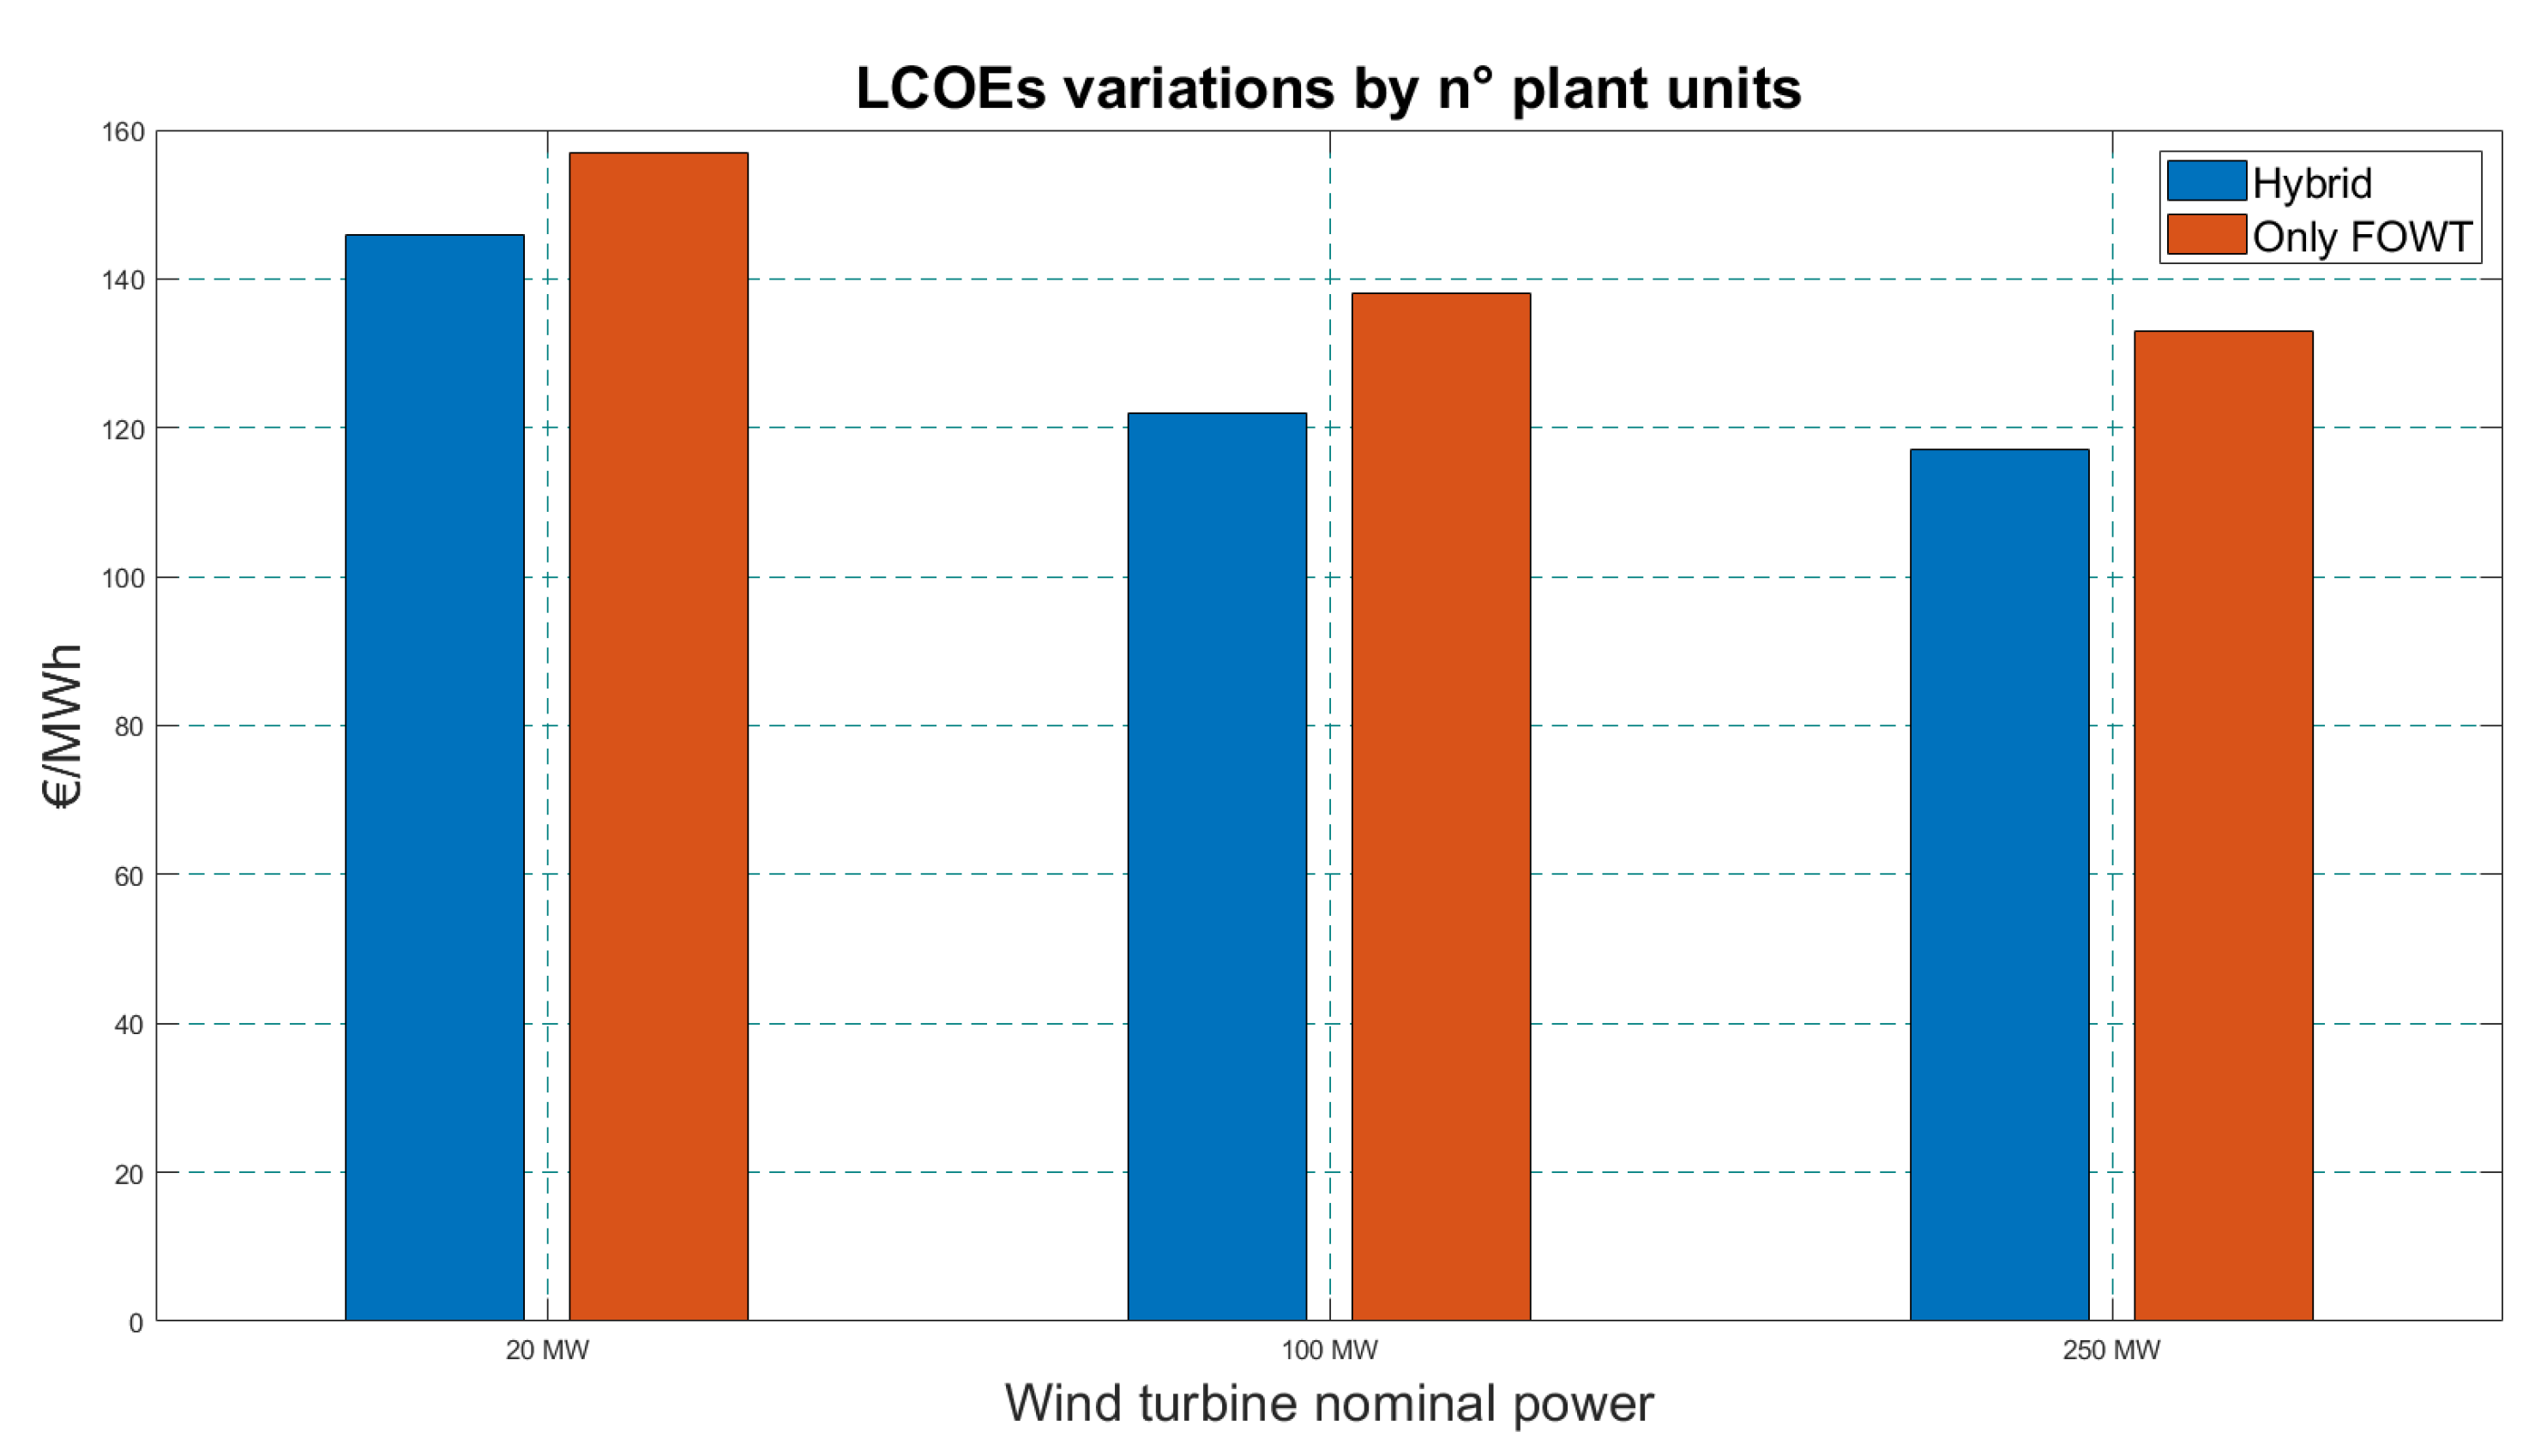
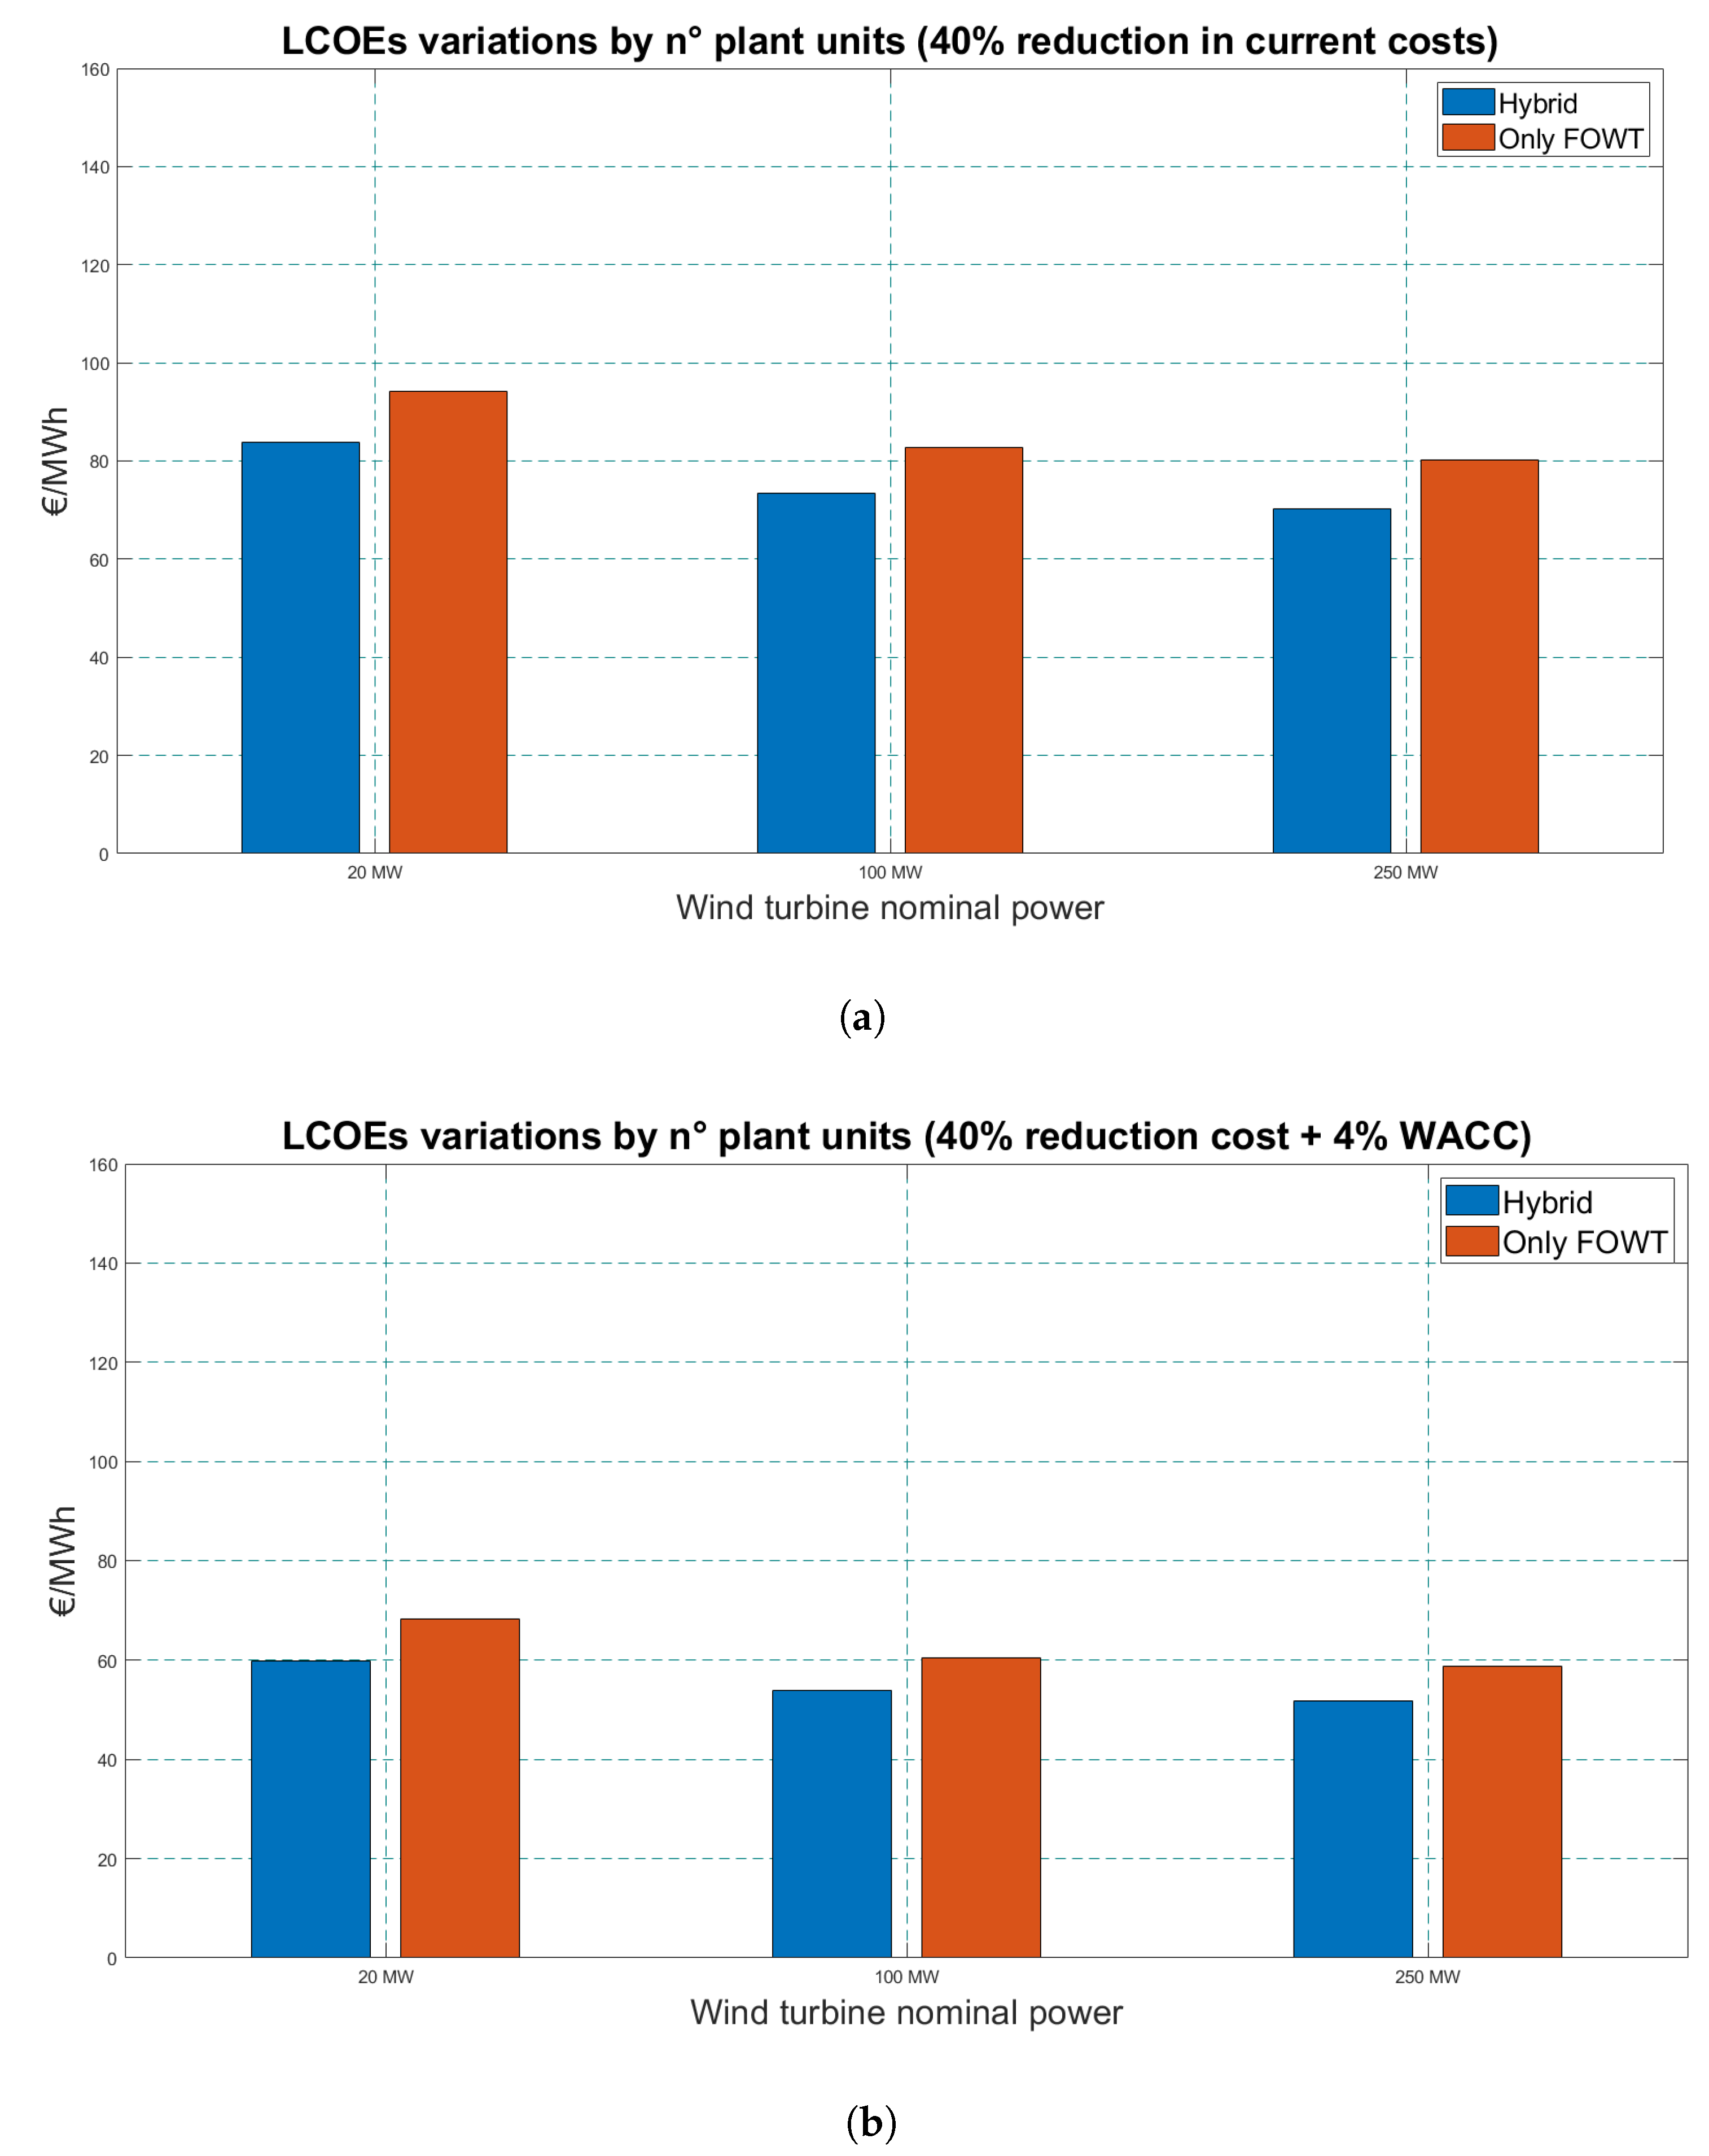
The LCOE of the hybrid solution from this study was 10% lower than that of the traditional system. The capital cost was 3% higher for the hybrid system, but the wind turbines contributed significantly to the power generated with a maximum relative difference of 151% for the hybrid system. However, some studies such as in [83] show that the best alternative regarding life-cycle costs and LCOE was the FOWT. The best alternatives for hybrid systems were given by Poseidon and W2Power for large and small systems, respectively.
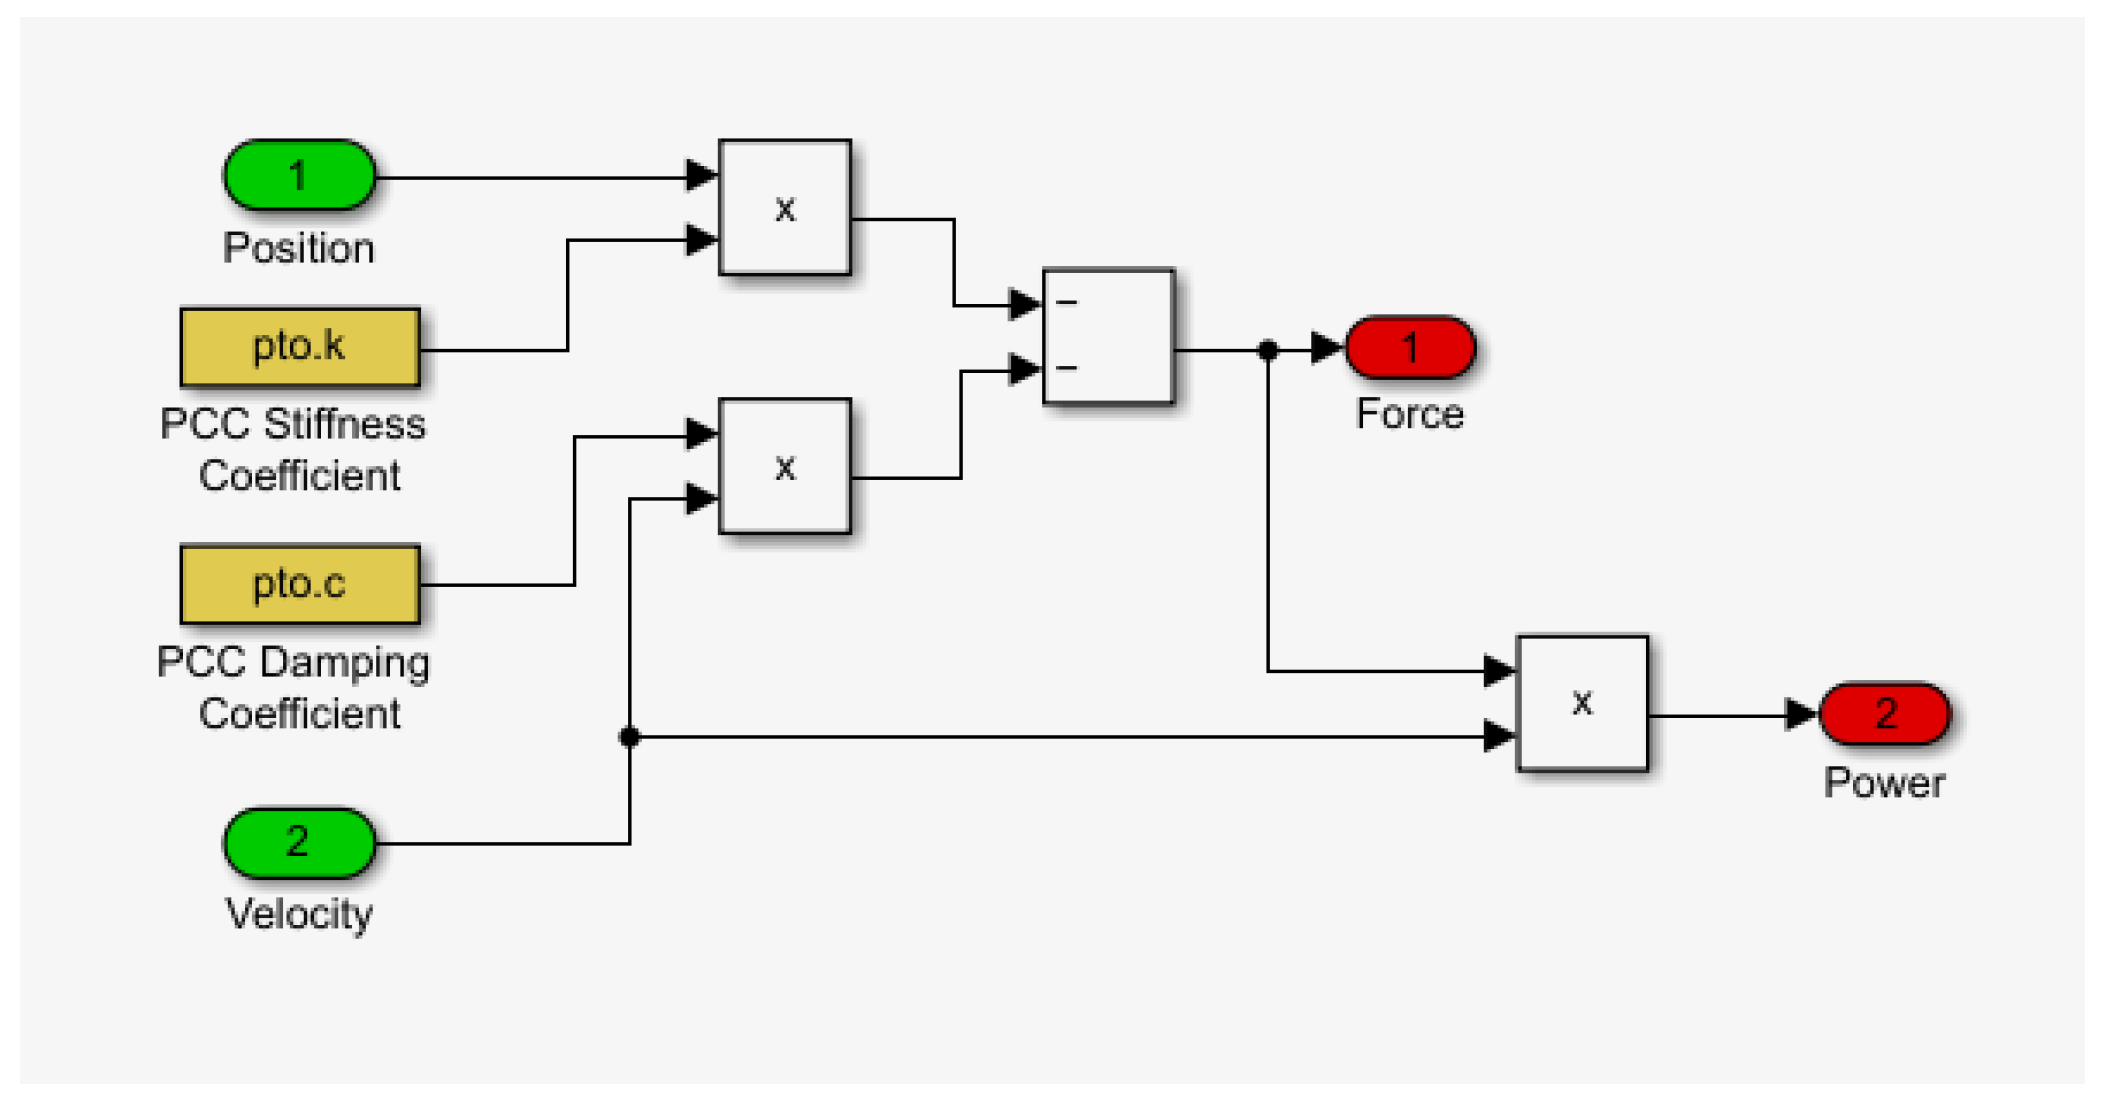
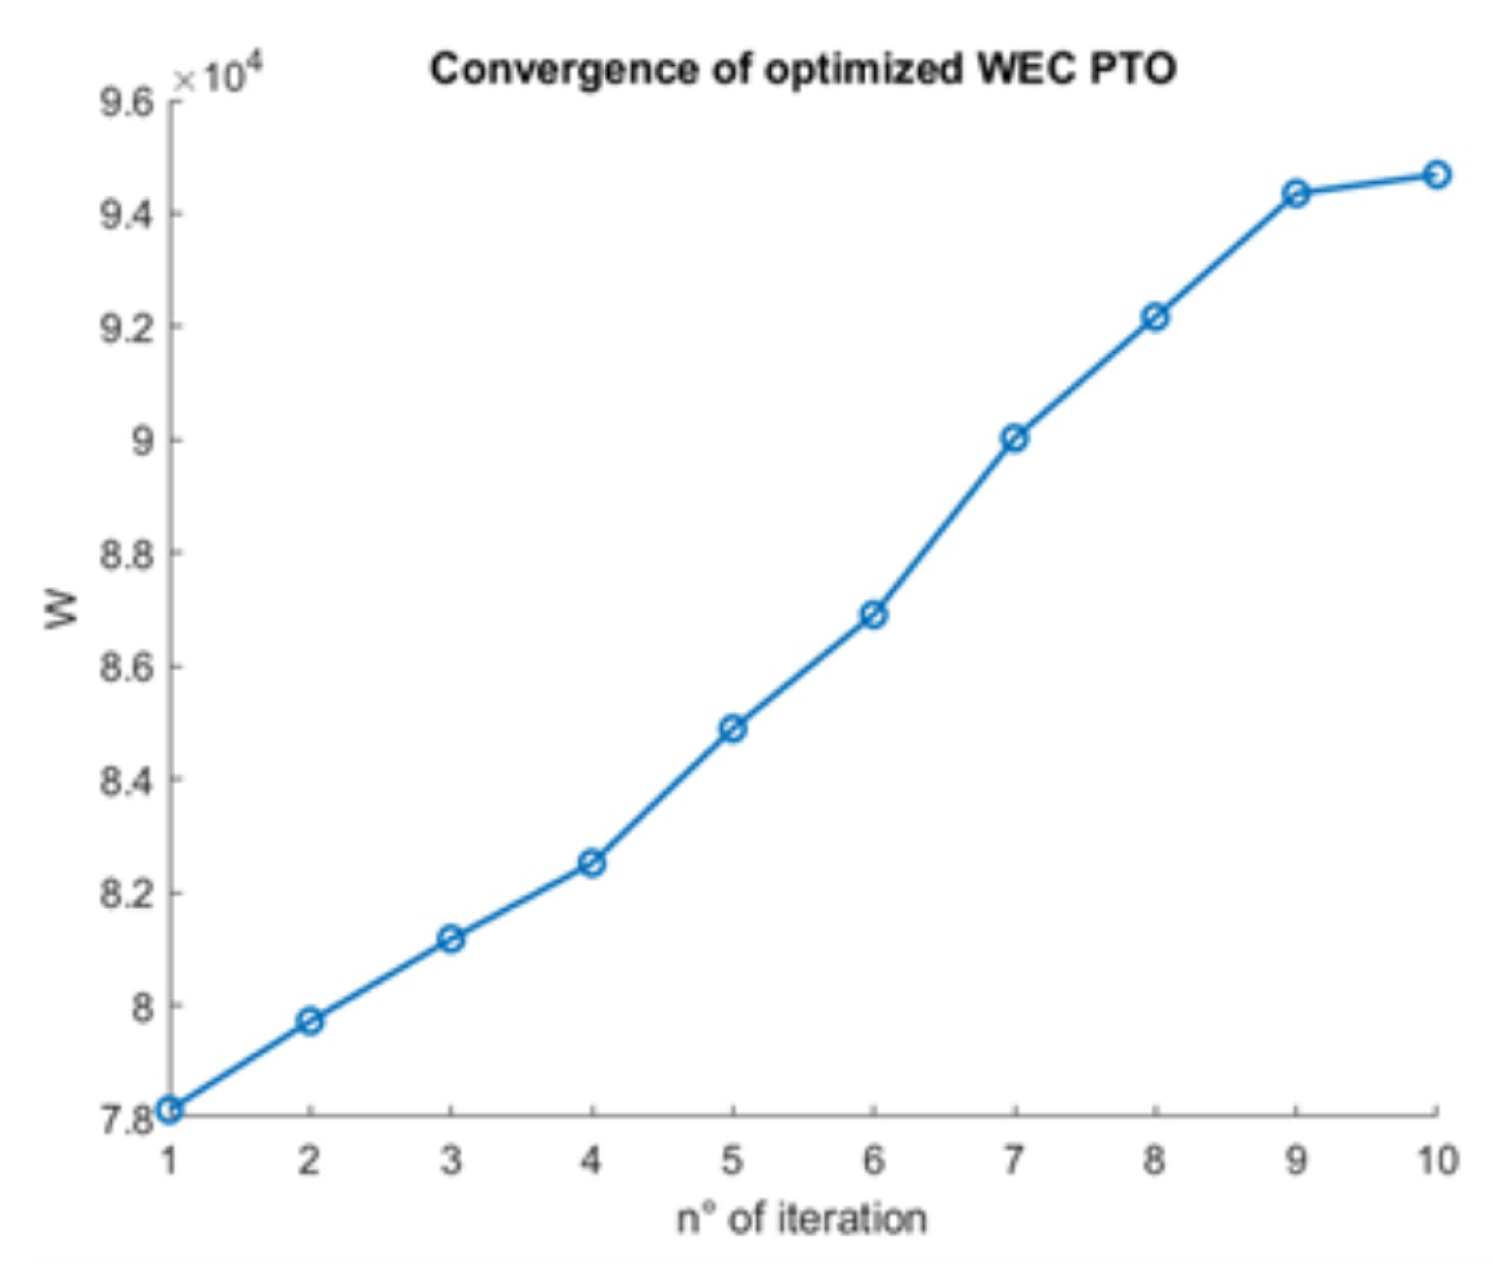
The first limitation of this study is the PTO of the WECs. A linear model was assumed to simulate their behaviour. This assumption was required to reduce computational time for the simulations. In fact, it was necessary to optimise the WECs for each environmental condition in order to obtain a realistic estimate of the energy generated. Linear PTO was also used in [45,84] to simulate the RM3 device, where similar energy production was obtained for similar wave conditions. A more realistic PTO is beyond the scope of this study.
Another limitation is related to the environmental conditions considered in a narrow range of triplets. The sensitivity of the generated energy at a wider range of triplets could be investigated in a further study to understand the influence on the results of this work. For example, in [45,84] a wider range of sea states was covered, giving more accurate results for AEP. The results of this work are also very sensitive to the site chosen. These results only apply to sites characterised by sufficient energy resource, where both wind and waves maximise the performance of the wind turbine and WECs. The design of the WECs is particularly limited to energetic sites, as their geometry has to be tuned to the sea conditions. Finally, the LCOE was estimated for a different number of devices. The reduction of costs due to an increased number of devices in the farm are assumed from [36]. The entire system has not been simulated in the time domain (due to the enormous computational effort and time required), so the interaction between devices is not accounted for in terms of energy. As a rule of thumb, it was assumed that the distance between the devices of the farm is equal to 6 times the rotor diameter to justify the absence of the wake effect [85].

5. Conclusions

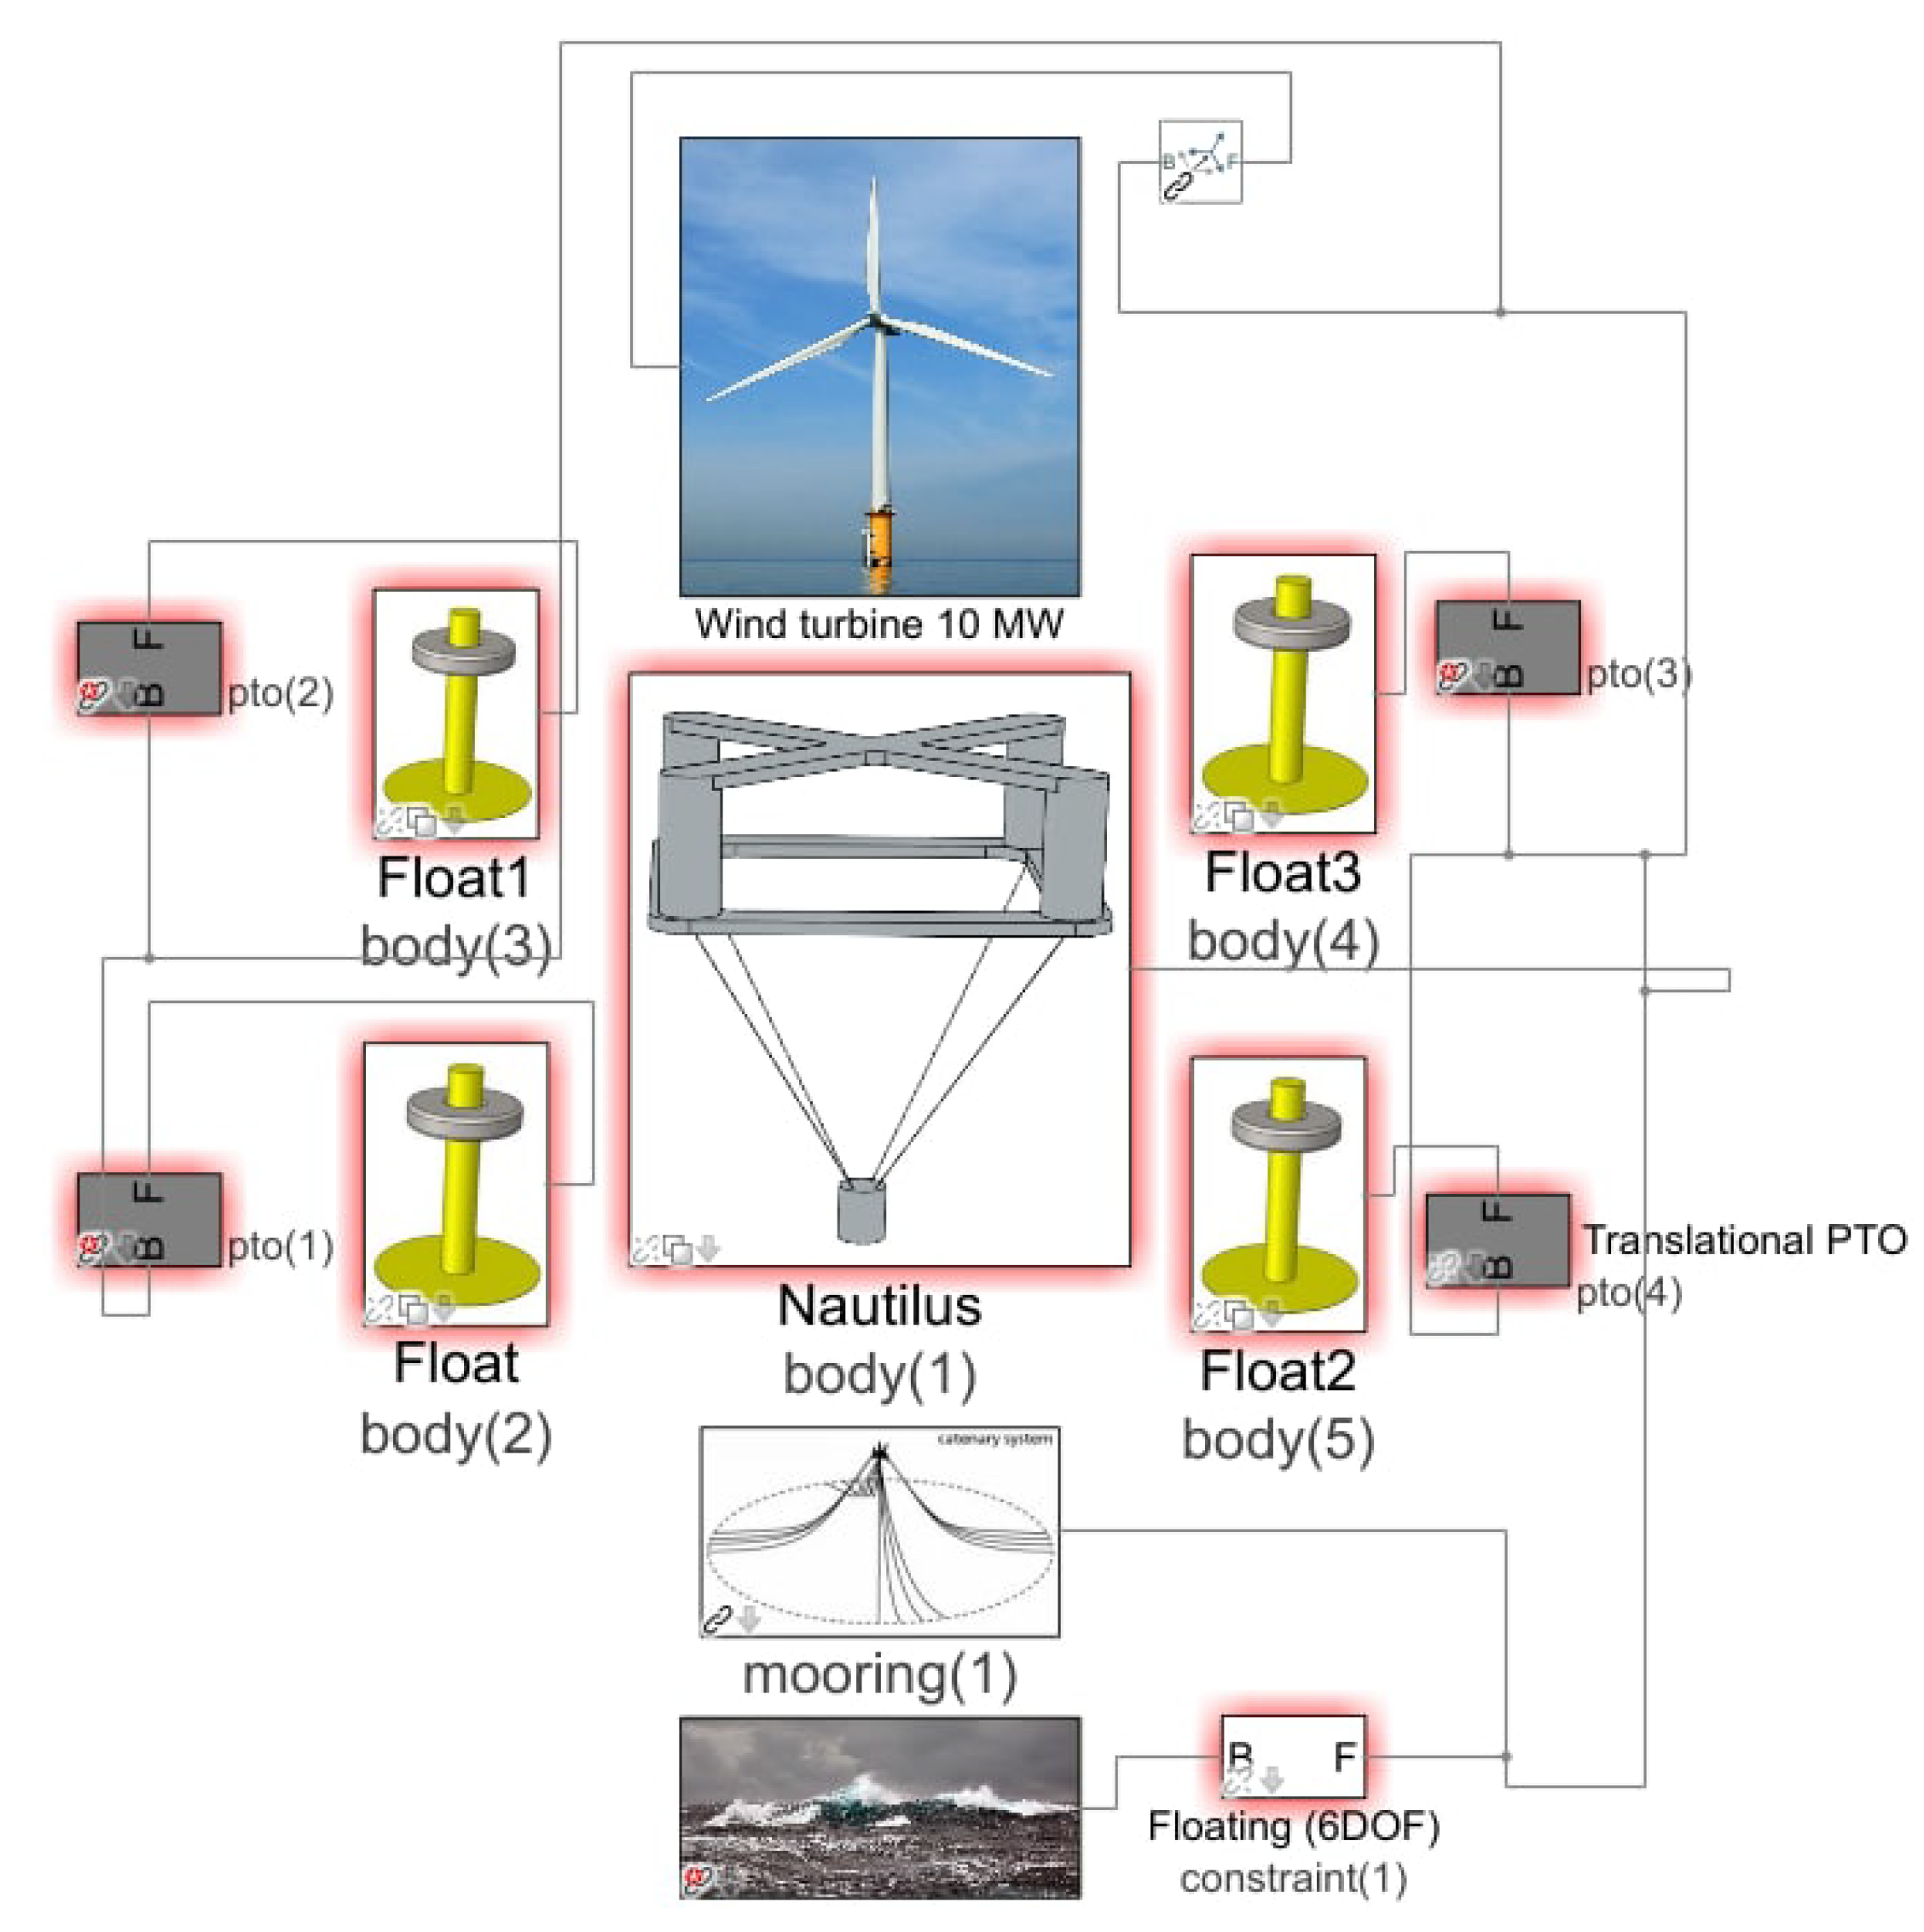
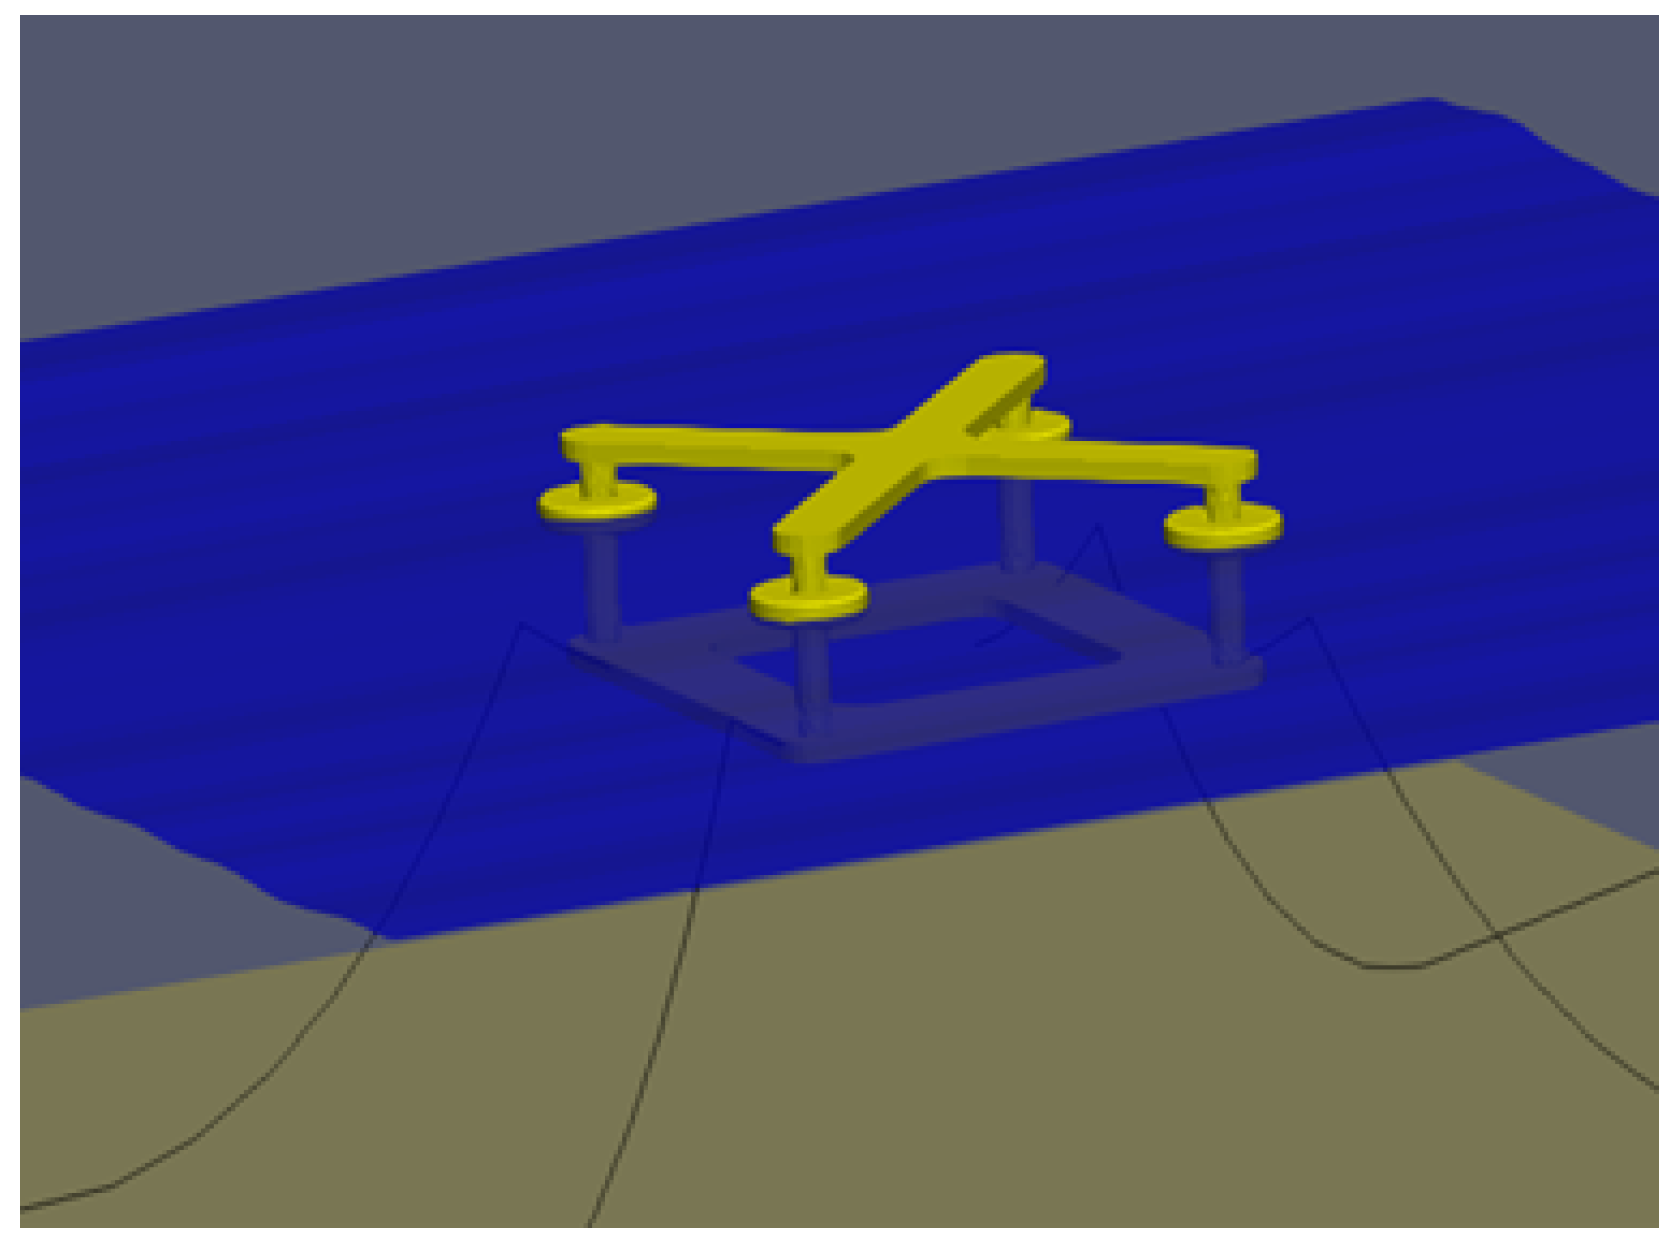
In this study, the novel hybrid concept of the Nautilus platform and four-point absorbers WECs was investigated. First, the various advantages of a multi-purpose platform combining wind and wave energy were discussed in comparison to a simple floating wind turbine. The different components of the hybrid system were identified: Wind turbine, WECs and the support platform. They were replicated individually and combined in the final hybrid system concept. Therefore, the single FOWT system was modelled using the same turbine and floating platform concept to compare the results of the hybrid system.
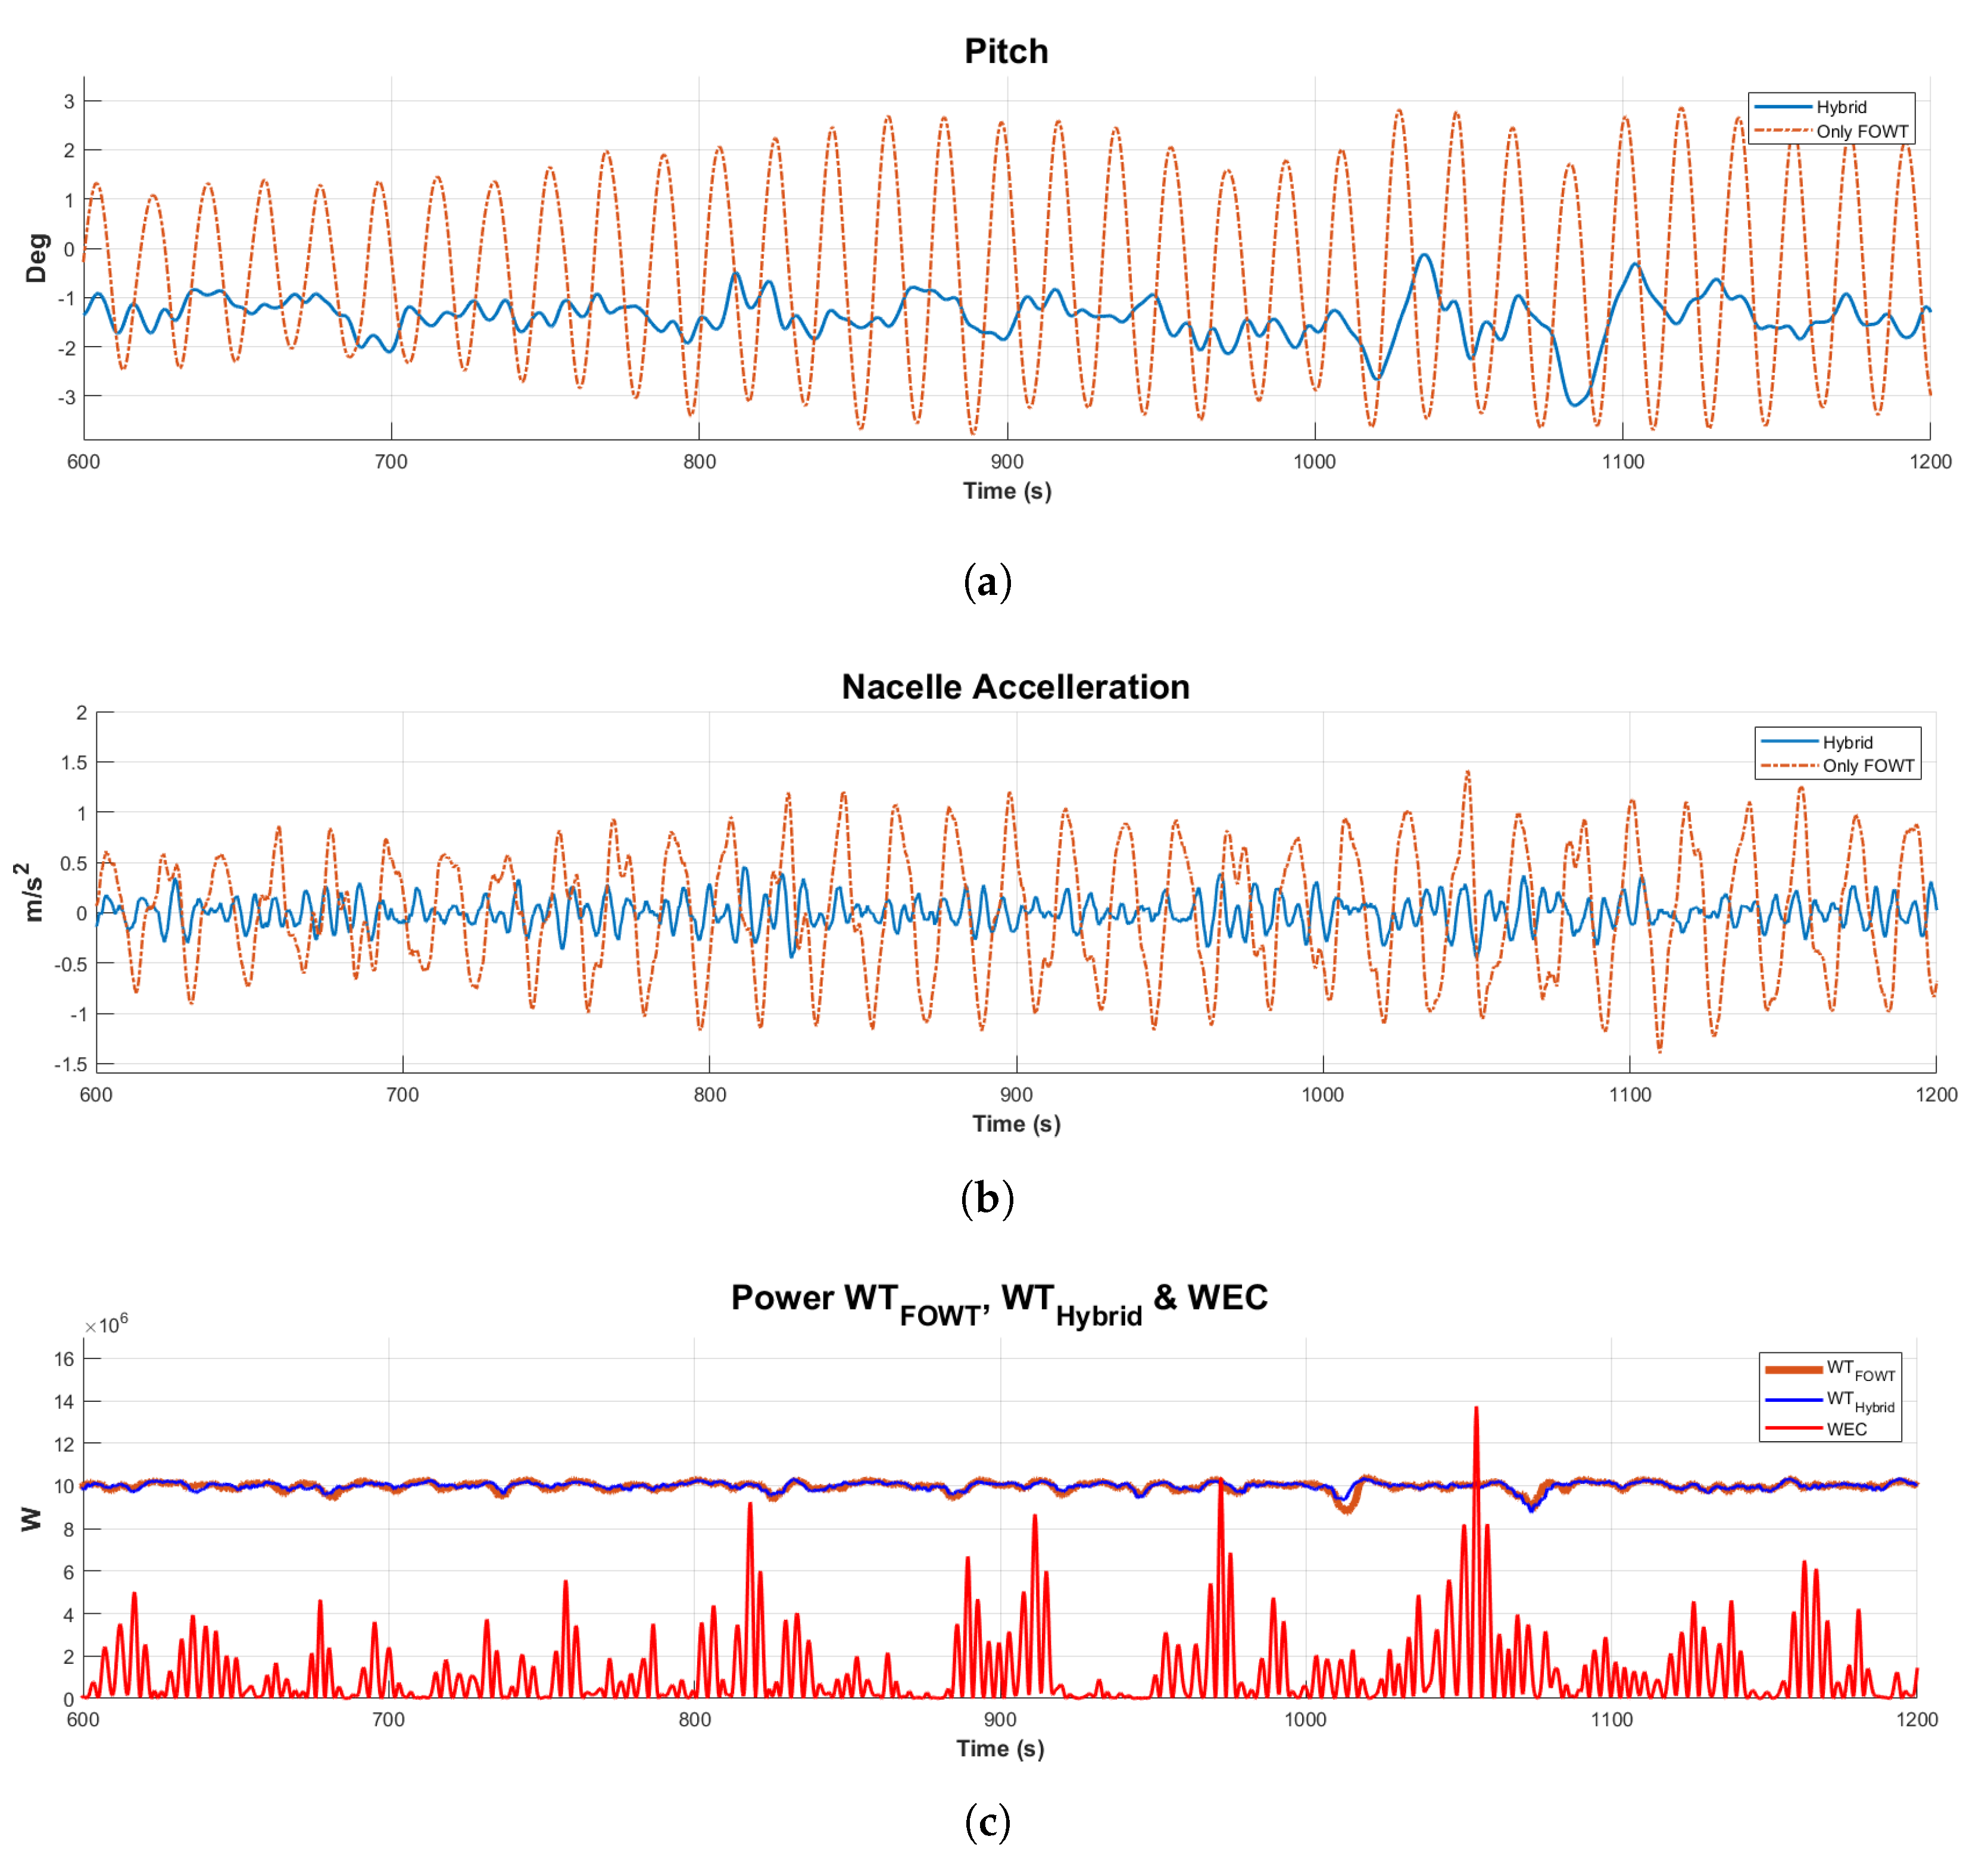
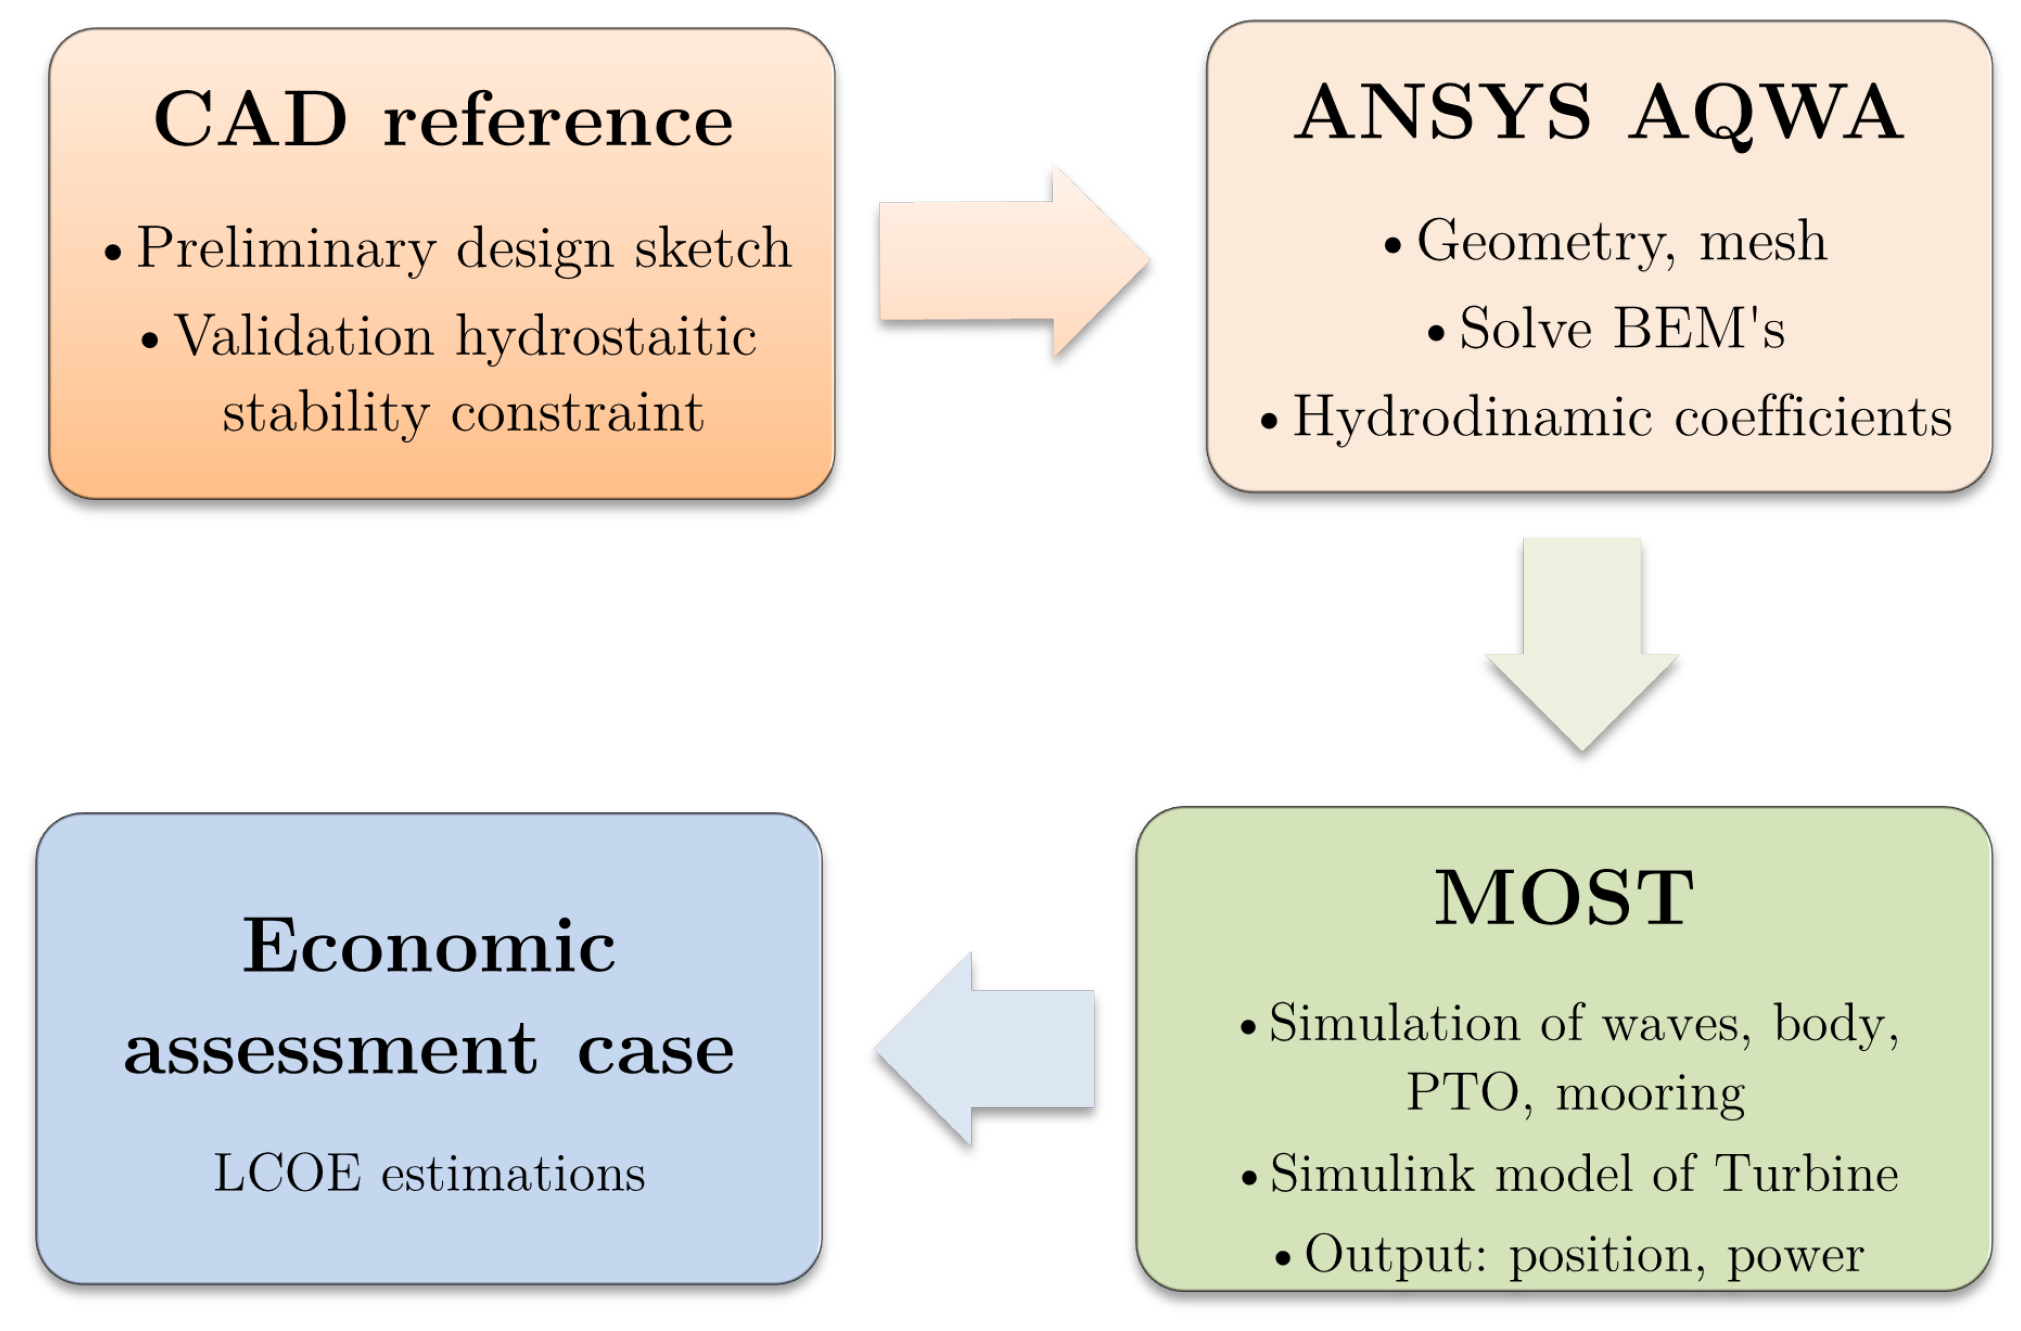
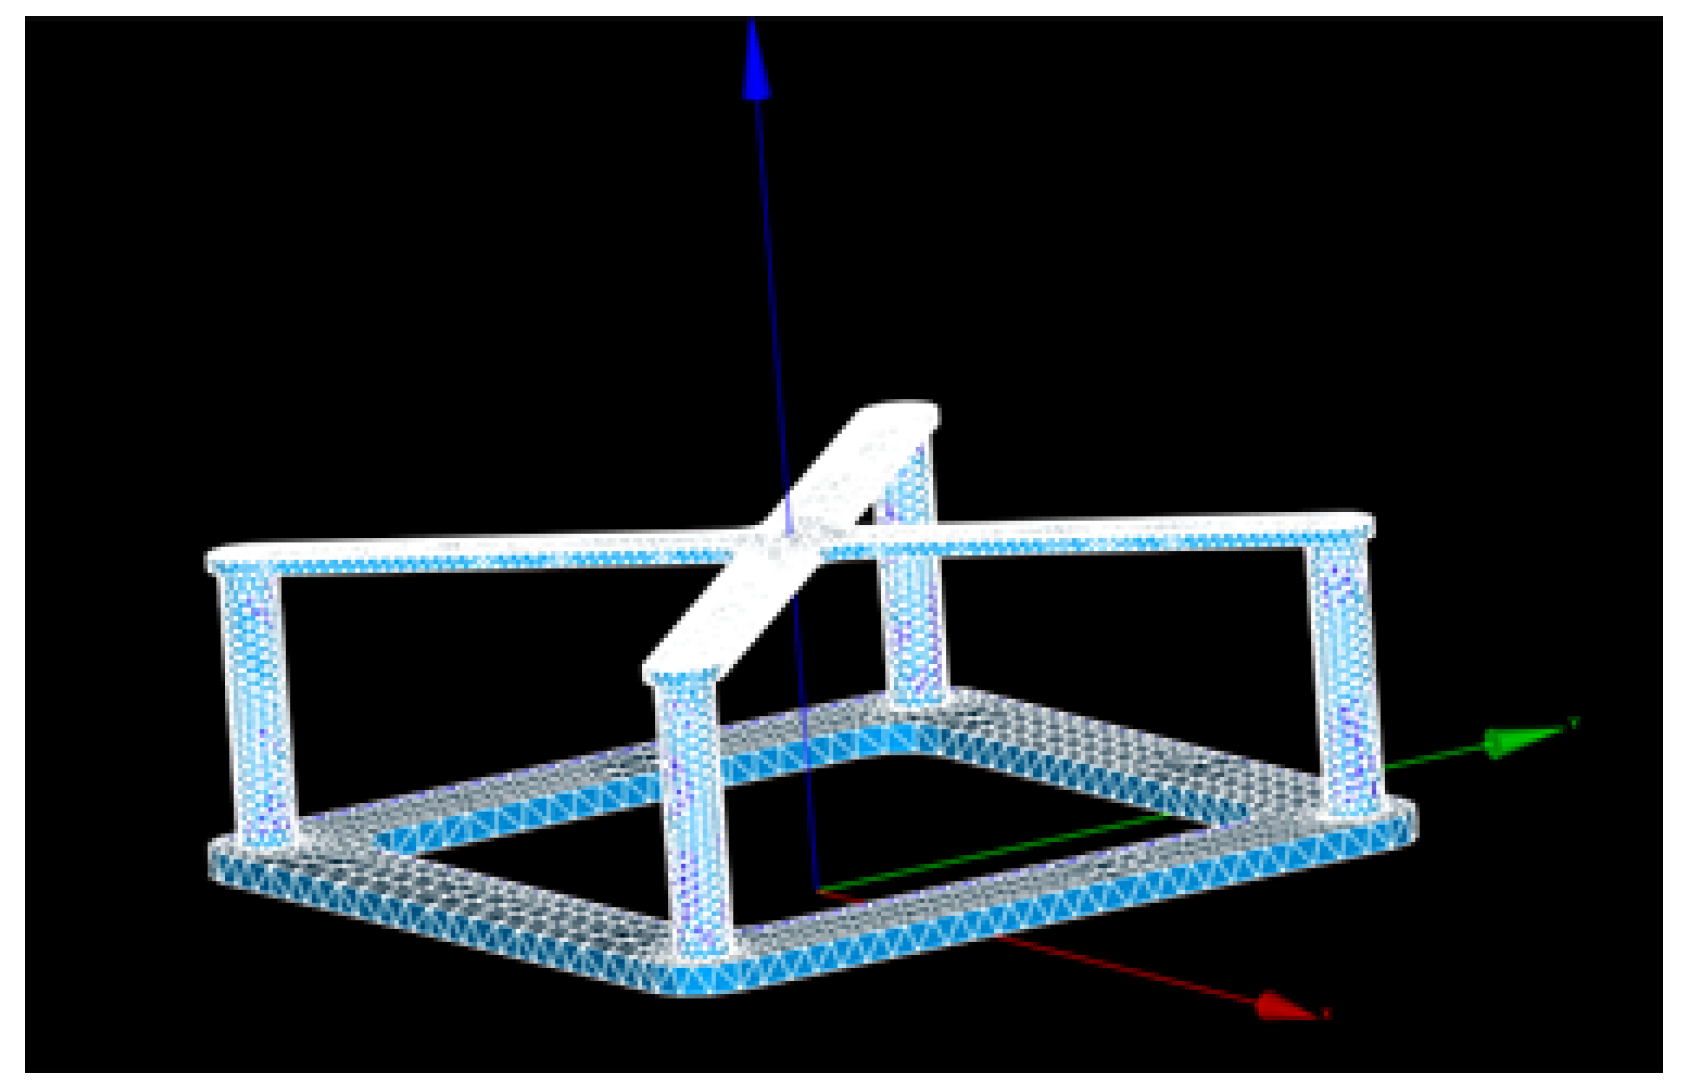
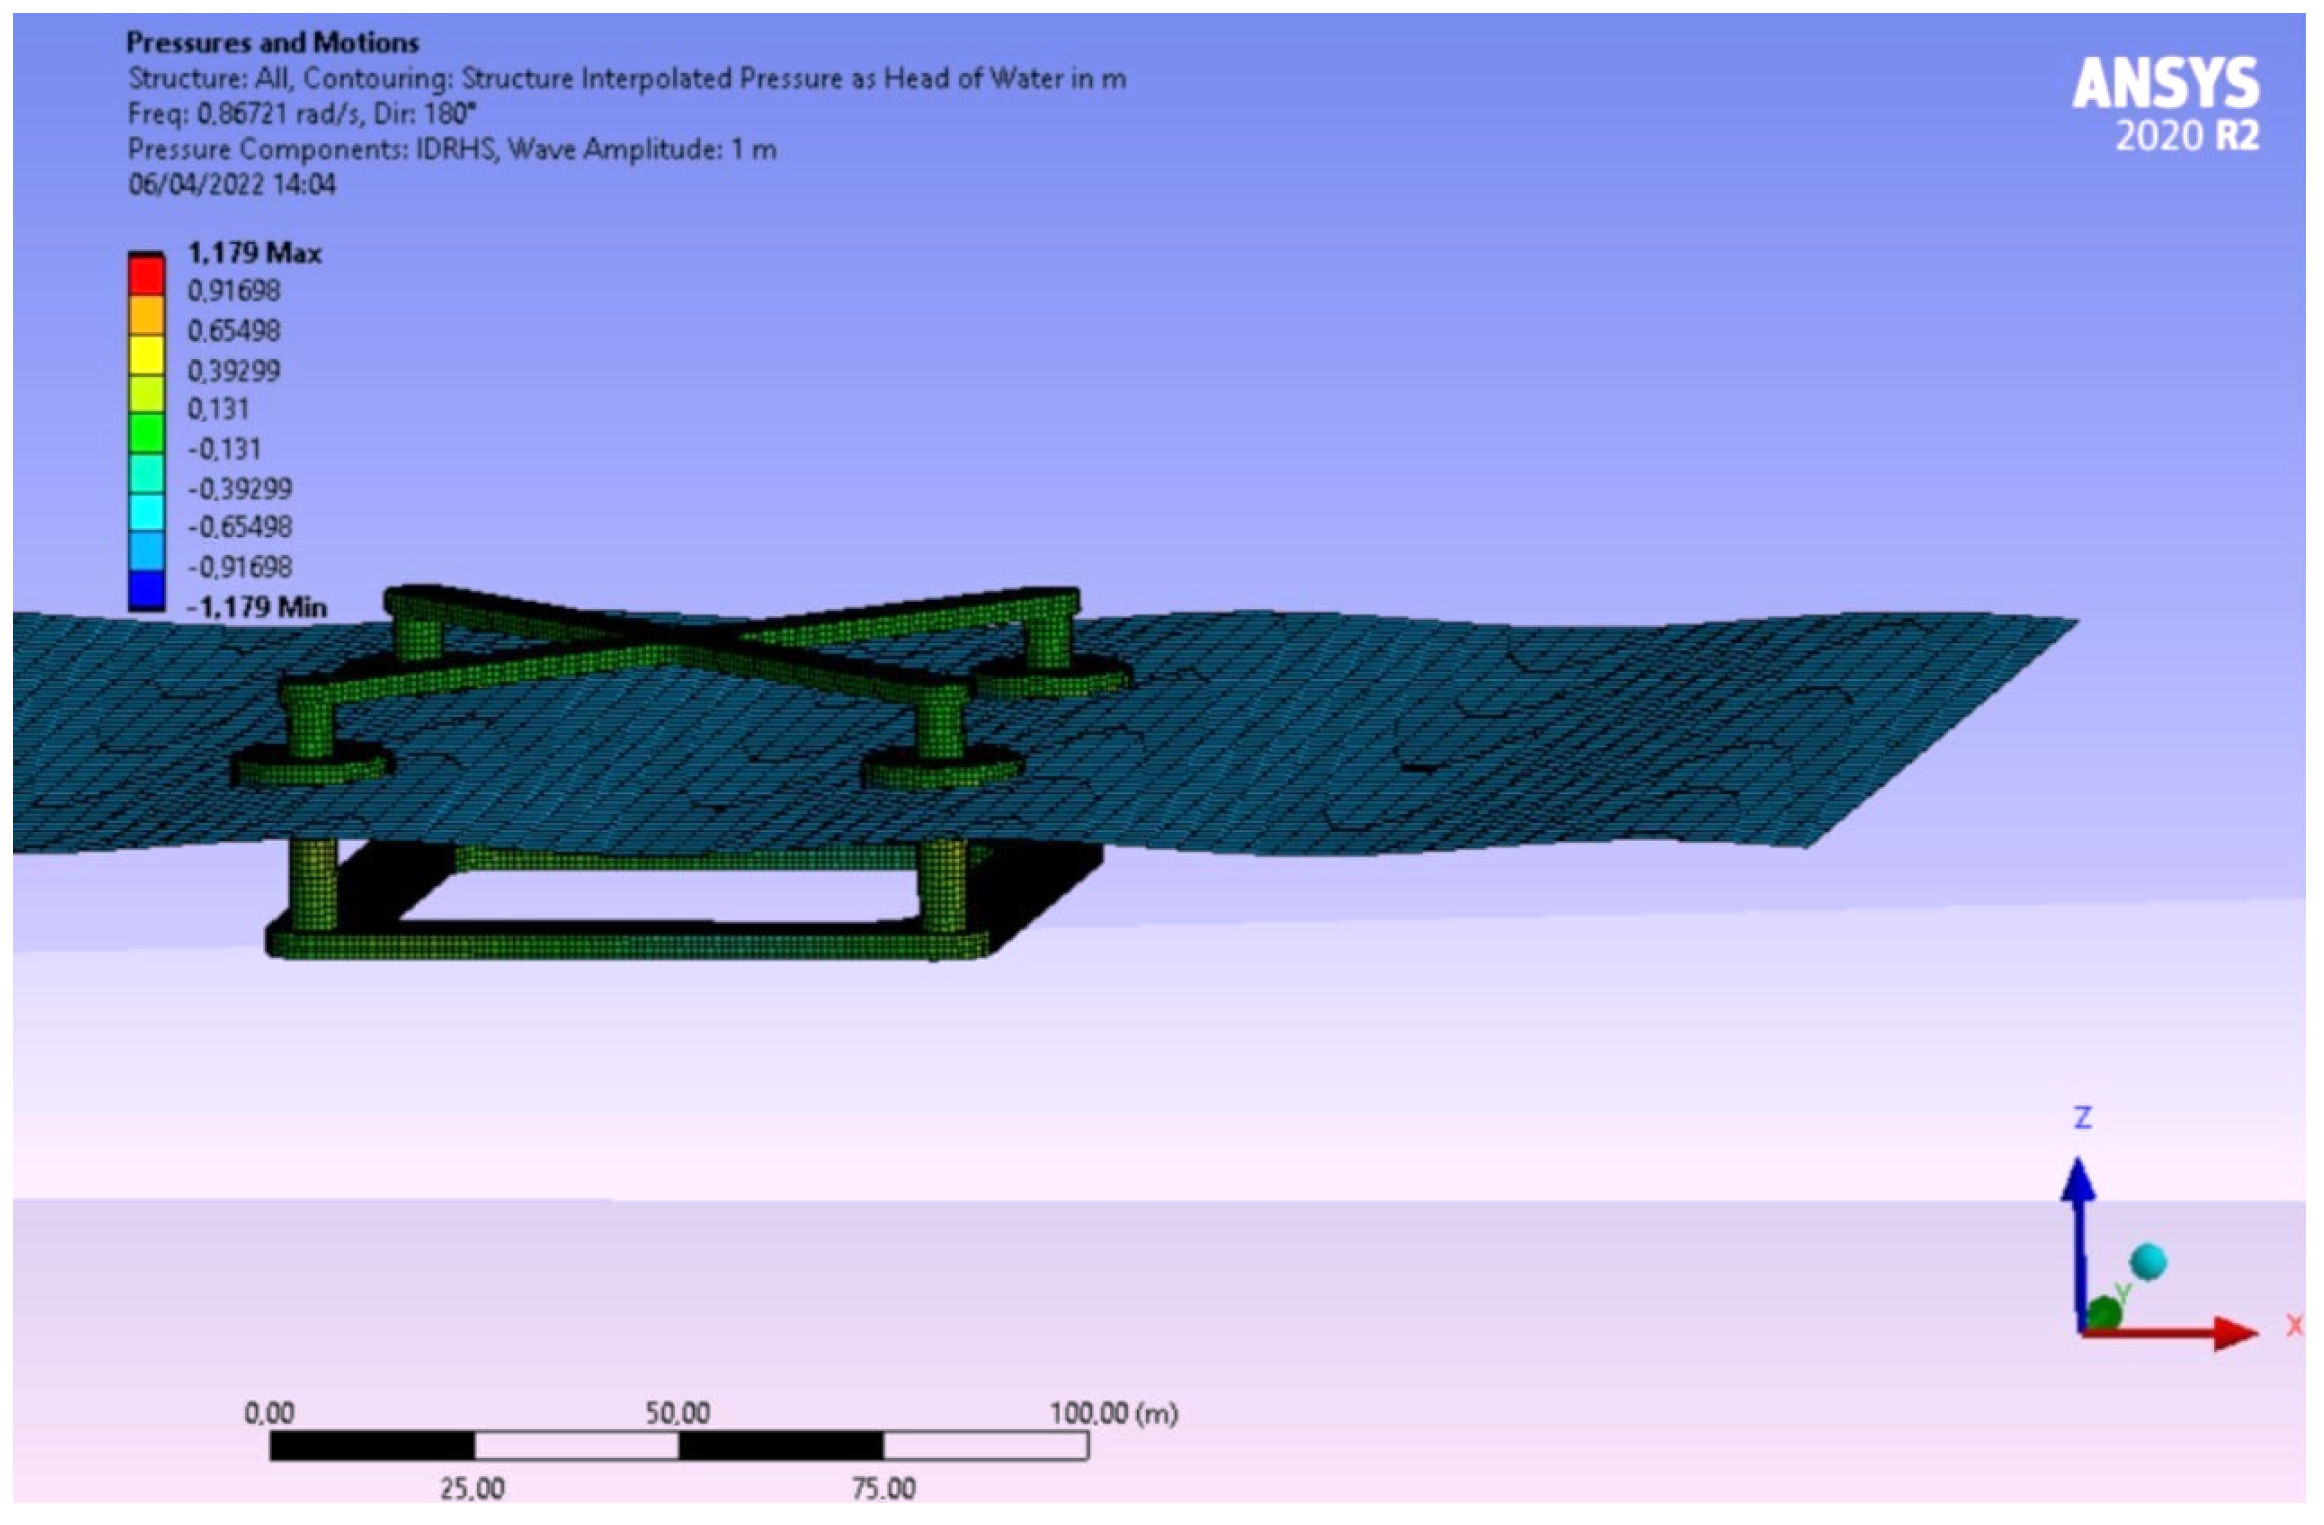
Both systems were designed in accordance with DNV regulations. The design model was created using the software package ANSYS AQWA, with the hydrodynamic coefficients extracted from the frequency domain analysis. The latter were imported into WEC-Sim, which can simulate hydrodynamic bodies and their interaction. A Simulink wind turbine model (WT) was coupled with the rest of the component system modelled in WEC-Sim (mooring lines, point absorbers, floating platform) to simulate the coupled dynamic system. The mooring lines are simulated in WEC-Sim in particular with the open source software Moordyn. The performance of the WECs was optimised as it is strongly influenced by the PTO parameters. Finally, the analysis of the Irish case study Belmullet was taken into account when estimating the energy production required for the techno-economic analysis. Environmental conditions were extracted from ERA5 using wind speed and wave parameters. The results show the CAPEX and the LCOE for the hybrid and the FOWT solution, as well as the key performance indicators (KPIs), such as pitch angle and nacelle acceleration. In summary, the hybrid solution is better in terms of both economic competitiveness and stability. The synergy of sources could be one of the best solutions for the future of the ocean energy sector and the energy transition.

Futher Work

Floating offshore wind turbines include a variety of physical components that can be designed to tune dynamic performance and energy productivity. Consequently, many aspects have not been addressed in this work such as: the implementation of a control system for the WEC devices that could improve energy production; simulation with a wide range of meta-oceanic data that could allow a more accurate evaluation of WEC performance.
It would also be helpful to define more accurate cost functions that take into account the manufacturing process and pure material costs. Operating and maintenance costs also need to be further investigated to obtain more accurate LCOE.

Author Contributions

Conceptualization, E.P., E.F., A.G., M.S. and G.B.; methodology, E.P., E.F. and A.G.; software, E.P., E.F., A.G. and M.S.; formal analysis, E.P., E.F. and A.G.; investigation, E.P.; resources, E.P., E.F., A.G. and M.S.; data curation, E.P.; writing—original draft preparation, E.P., E.F. and A.G.; writing—review and editing, E.P., E.F. and A.G.; visualization, E.P.; supervision, E.F., A.G., G.B. and G.M.; project administration, G.B., G.M.; funding acquisition, G.B., G.M. All authors have read and agreed to the published version of the manuscript.

Funding

This research received no external funding.

Conflicts of Interest

The authors declare no conflict of interest.

Abbreviations

The following abbreviations are used in this manuscript:
NRELNational Renewable Energy Laboratory
CAPEXCapital Expenditure
OPEXOperational cost Expenditure
LCOELeverage cost Expenditure
AMETSAtlantic Marine Energy Test Site
RM3Reference Model 3
AEPAnnual Energy Production
FOWTFloating offshore wind Turbine
WECWave energy Converter
DNVDet Norske Veritas
PTOPower take off
COBCenter of Buoyancy
COGcenter of gravity
BEMBoundary element method
DOFDegree of Freedom
WTWind Turbine
RMSRoot Mean Square
PCCPower Conversion Chain
KPIKey Performance Indicator
WACCWeighted Average Cost of Capital
WEGAWave Energy Gravitational Absorber
RMSERoot Mean Square Error

Appendix A

The appendix hold the record of the data-set of 28 triplets in Table A1.
Table A1. List of triplet used to perform dynamic simulations.
nH s [m]T p [s]V 0 [ m s ]f i
10.56.530.037
20.56.55.50.049
30.56.580.041
40.56.510.50.018
50.59.530.023
60.59.55.50.023
726.580.034
826.510.50.054
926.5130.054
1026.515.50.038
1126.5180.020
1229.530.027
1329.55.50.052
1429.580.066
1529.510.50.068
1629.5130.055
1729.515.50.033
18212.55.50.026
19212.580.027
20212.510.50.021
2149.515.50.005
2249.5180.009
2349.520.50.007
24412.510.50.004
25412.5130.008
26412.515.50.011
27412.5180.007
28412.520.50.004

References

  1. Bennett, N.J. Marine social science for the peopled seas. Coast. Manag. 2019, 47, 244–252. [Google Scholar] [CrossRef] [Green Version]
  2. International Renewable Energy Agency. Innovation Outlook: Ocean Energy Technologies; International Renewable Energy Agency: Abu Dhabi, United Arab Emirates, 2020; Chapter 2. [Google Scholar]
  3. Rousseau, N. Oceans of Energy—European Ocean Energy Roadmap 2010–2050. 2010. Available online: https://www.icoe-conference.com/publication/oceans_of_energy_european_ocean_energy_roadmap_2010_2050/ (accessed on 1 September 2021).
  4. European Commission. EU Biodiverity Strategy for 2030. In Bringing Nature Back into Our Lives; Communication from the Commission to the European Parliament COM/2020/380 Final Version; European Commission: Brussels, Belgium, 2020; p. 11. [Google Scholar]
  5. European Commission. Neutral future. In Communication from the Commission to the European Parliament; European Commission: Brussels, Belgium, 2020; pp. 1–2. [Google Scholar]
  6. European Commission. An EU Strategy to Harness the Potential of Offshore Renewable Energy for a Climate Neutral Future; Communication from the Commission to the European Parliament; European Commission: Brussels, Belgium, 2020; p. 19. [Google Scholar]
  7. Fichaux, N.; Frandsen, S.; Eecen, P.; Malamatenios, C.; Gomez, J.A.; Hemmelmann, J.; van Kuik, G.; Bulder, B.; Rasmussen, F.; Janssen, B.; et al. Design Limits and Solutions for very Large Wind Turbines: A 20 MW Turbine is Feasible. UpWind Report 2011. Available online: http://www.ewea.org/fileadmin/files/library/publications/reports/UpWind_Report.pdf (accessed on 3 September 2021).
  8. Ohya, Y.; Krasudani, T.; Nagai, T.; Watanabe, K. Wind lens technology and its application to wind and water turbine and beyond. Renew. Energy Environ. Sustain. 2017, 2, 2. [Google Scholar] [CrossRef] [Green Version]
  9. Karimirad, M. Floating Offshore Wind Turbines. In Offshore Energy Structures for Wind Power, Wave Energy and Hybrid Marine Platforms; Springer: Cham, Switzerland, 2014; Chapter 4. [Google Scholar]
  10. Karimirad, M. Wave Energy Converters. In Offshore Energy Structures for Wind Power, Wave Energy and Hybrid Marine Platforms; Springer: Cham, Switzerland, 2014; Chapter 5. [Google Scholar]
  11. Sirigu, S.A.; Bonfanti, M.; Dafnakis, P.; Bracco, G.; Mattiazzo, G.; Brizzolara, S. Pitch Resonance Tuning Tanks: A novel technology for more efficient wave energy harvesting. In Proceedings of the OCEANS 2018 MTS/IEEE Charleston, Charleston, SC, USA, 22–25 October 2018; pp. 1–8. [Google Scholar]
  12. Perez, C.; Iglesias, G. Integration of Wave Energy Converters and Offshore Windmills. 2012. Available online: http://www.icoe-conference.com (accessed on 4 September 2012).
  13. Yde, A.; Pedersen, M.M.; Bellew, S.B.; Køhler, A.; Clausen, R.S.; Wedel Nielsen, A. Experimental and Theoretical Analysis of a Combined Floating Wave and Wind Energy Conversion Platform; DTU Wind Energy: Kgs. Lyngby, Denmark, 2014. [Google Scholar]
  14. W2Power Description. Available online: http://www.pelagicpower.no (accessed on 12 September 2021).
  15. Kim, H.C.; Kim, K.H.; Kim, M.H.; Hong, K. Global performance of a KRISO semisubmersible multiunit floating offshore wind turbine: Numerical simulation vs. model test. Int. J. Offshore Polar Eng. 2017, 27, 70–81. [Google Scholar] [CrossRef]
  16. Sea For Life, Ocean-Oriented R&D Company, Developing WEGA Wave Energy Device, Press Release. 2010. Available online: https://www.pr.com/press-release/274358 (accessed on 20 September 2021).
  17. Weinstein, A. WindWaveFloat; Technical Report; Principle Power Inc.: Berkeley, CA, USA, 2011. [Google Scholar]
  18. DualSub Marine Power System. Available online: http://www.pelagicpower.no (accessed on 12 June 2021).
  19. Lewthwaite, M.T.; Amaechi, C.V. Numerical Investigation of Winglet Aerodynamics and Dimple Effect of NACA 0017 Airfoil for a Freight Aircraft. Inventions 2022, 7, 31. [Google Scholar] [CrossRef]
  20. Shires, A.; Kourkoulis, V. Application of circulation controlled blades for vertical axis wind turbines. Energies 2013, 6, 3744–3763. [Google Scholar] [CrossRef]
  21. Attene, F.; Balduzzi, F.; Bianchini, A.; Campobasso, M.S. Using Experimentally Validated Navier-Stokes CFD to Minimize Tidal Stream Turbine Power Losses Due to Wake/Turbine Interactions. Sustainability 2020, 12, 8768. [Google Scholar] [CrossRef]
  22. Faraggiana, E.; Chapman, J.; Williams, A.; Masters, I. Genetic based optimisation of the design parameters for an array-on-device orbital motion wave energy converter. Ocean. Eng. 2020, 218, 108251. [Google Scholar] [CrossRef]
  23. Soares, C.G. Advances in Renewable Energies Offshore, Proceedings of the 3rd International Conference on Renewable Energies Offshore (RENEW 2018), 8–10 October 2018, Lisbon, Portugal; CRC Press: Boca Raton, FL, USA, 2018. [Google Scholar]
  24. Faraggiana, E.; Whitlam, C.; Chapman, J.; Hillis, A.; Roesner, J.; Hann, M.; Greaves, D.; Yu, Y.H.; Ruehl, K.; Masters, I.; et al. Computational modelling and experimental tank testing of the multi float WaveSub under regular wave forcing. Renew. Energy 2020, 152, 892–909. [Google Scholar] [CrossRef]
  25. Peiffer, A.; Roddier, D. Design of an oscillating wave surge converter on the windfloat structure. In Proceedings of the 2012 4th International Conference on Ocean Energy (ICOE), Dublin, Ireland, 17–19 October 2012; pp. 17–19. [Google Scholar]
  26. Michailides, C.; Luan, C.; Gao, Z.; Moan, T. Effect of flap type wave energy converters on the response of a semi-submersible wind turbine in operational conditions. In Proceedings of the International Conference on Offshore Mechanics and Arctic Engineering. American Society of Mechanical Engineers, San Francisco, CA, USA, 8–13 June 2014; Volume 45547, p. V09BT09A014. [Google Scholar]
  27. Michailides, C.; Gao, Z.; Moan, T. Experimental and numerical study of the response of the offshore combined wind/wave energy concept SFC in extreme environmental conditions. Mar. Struct. 2016, 50, 35–54. [Google Scholar] [CrossRef]
  28. Michailides, C.; Gao, Z.; Moan, T. Experimental study of the functionality of a semisubmersible wind turbine combined with flap-type Wave Energy Converters. Renew. Energy 2016, 93, 675–690. [Google Scholar] [CrossRef]
  29. Muliawan, M.J.; Karimirad, M.; Gao, Z.; Moan, T. Extreme responses of a combined spar-type floating wind turbine and floating wave energy converter (STC) system with survival modes. Ocean. Eng. 2013, 65, 71–82. [Google Scholar] [CrossRef]
  30. Moan, T.; Muliawan, M.; Karimirad, M.; Gao, Z. Floating Wind Turbine with Wave Energy Converter. Patent Cooperation Treaty WO2013137744A1, 19 September 2013. [Google Scholar]
  31. Lee, H.; Poguluri, S.K.; Bae, Y.H. Performance analysis of multiple wave energy converters placed on a floating platform in the frequency domain. Energies 2018, 11, 406. [Google Scholar] [CrossRef] [Green Version]
  32. Karimirad, M.; Michailides, C. Effects of misaligned wave and wind action on the response of the combined concept windwec. In Proceedings of the International Conference on Offshore Mechanics and Arctic Engineering, Madrid, Spain, 17–22 June 2018; Volume 51319, p. V010T09A013. [Google Scholar]
  33. Karimirad, M.; Koushan, K. WindWEC: Combining wind and wave energy inspired by hywind and wavestar. In Proceedings of the 2016 IEEE International Conference on Renewable Energy Research and Applications (ICRERA), Birmingham, UK, 20–23 November 2016; pp. 96–101. [Google Scholar]
  34. Hu, J.; Zhou, B.; Vogel, C.; Liu, P.; Willden, R.; Sun, K.; Zang, J.; Geng, J.; Jin, P.; Cui, L.; et al. Optimal design and performance analysis of a hybrid system combing a floating wind platform and wave energy converters. Appl. Energy 2020, 269, 114998. [Google Scholar] [CrossRef]
  35. Bak, C.; Zahle, F.; Bitsche, R.; Kim, T.; Yde, A.; Henriksen, L.C.; Hansen, M.H.; Blasques, J.P.A.A.; Gaunaa, M.; Natarajan, A. Description of the DTU 10MW Reference Wind Turbine; DTU Wind Energy: Kgs. Lyngby, Denmark, 2013. [Google Scholar]
  36. Neary, V.S.; Lawson, M.; Previsic, M.; Copping, A.; Hallett, K.C.; Labonte, A.; Rieks, J.; Murray, D. Methodology for Design and Economic Analysis of Marine Energy Conversion (MEC) Technologies. In Proceedings of the 2nd Marine Energy Technology Symposium, Seattle, WA, USA, 15–18 April 2014; pp. 157–163, 164–178. [Google Scholar]
  37. Nautilus FOWT Home Page. 2021. Available online: https://www.nautilusfs.com/en/ (accessed on 2 September 2021).
  38. Galvan, J.; Sánchez-Lara, M.; Mendikoa, I.; Pérez-Morán, G.; Nava, V.; Rodríguez-Arias, R. NAUTILUS-DTU10 MW Floating Offshore Wind Turbine at Gulf of Maine: Public numerical models of an actively ballasted semisubmersible. J. Phys. Conf. Ser. 2018, 1102, 012015. [Google Scholar] [CrossRef]
  39. Danish Fishermen’s Occupational Health Service. Stability Guide for Small Vessels; Danish Fishermen’s Occupational Health Service: Esbjerg, Denmark, 2014; Chapter 2. [Google Scholar]
  40. ANSYS Inc. Ansys® Academic Research Mechanical, Release 20.1, Help System, Coupled Field Analysis Guide. 2020. Available online: https://www.ansys.com/ (accessed on 1 July 2021).
  41. MATLAB, R2022; The MathWorks Inc.: Natick, MA, USA, 2022. Available online: https://it.mathworks.com/products/matlab.html (accessed on 6 April 2022).
  42. Cottura, L.; Caradonna, R.; Ghigo, A.; Novo, R.; Bracco, G.; Mattiazzo, G. Dynamic modeling of an offshore floating wind turbine for application in the Mediterranean Sea. Energies 2021, 14, 248. [Google Scholar] [CrossRef]
  43. Moriarty, P.J.; Hansen, A.C. AeroDyn Theory Manual. 2005. Available online: https://www.osti.gov/servlets/purl/15014831 (accessed on 2 August 2021).
  44. Driscoll, F.; Jonkman, J.; Robertson, A.; Sirnivas, S.; Skaare, B.; Nielsen, F.G. Validation of a FAST model of the statoil-hywind demo floating wind turbine. Energy Procedia 2016, 94, 3–19. [Google Scholar] [CrossRef] [Green Version]
  45. Prendergast, J.; Li, M.; Sheng, W. A study on the effects of wave spectra on wave energy conversions. IEEE J. Ocean. Eng. 2018, 45, 271–283. [Google Scholar] [CrossRef]
  46. Hasselmann, K.; Barnett, T.P.; Bouws, E.; Carlson, H.; Cartwright, D.E.; Enke, K.; Ewing, J.; Gienapp, A.; Hasselmann, D.; Kruseman, P.; et al. Measurements of Wind-Wave Growth and Swell Decay during the Joint North Sea Wave Project (JONSWAP). 1973. Available online: https://www.researchgate.net/publication/256197895_Measurements_of_wind-wave_growth_and_swell_decay_during_the_Joint_North_Sea_Wave_Project_JONSWAP (accessed on 1 August 2021).
  47. Lagarias, J.; Reeds, J.; Wright, M.; Wright, P. Convergence Properties of the Nelder–Mead Simplex Method in Low Dimensions. Siam J. Optim. 1998, 9, 112–147. [Google Scholar] [CrossRef] [Green Version]
  48. Offshore Renewable Energy Development Plan. A Framework for the Sustainable Development of Ireland’s Offshore Renewable Energy Resource. 2014. Available online: https://assets.gov.ie/27215/2bc3cb73b6474beebbe810e88f49d1d4.pdf (accessed on 20 September 2021).
  49. Data from the Mean Wind Speed 125m (2013) Theme Accessed through Ireland’s Marine Atlas. 2021. Available online: http://atlas.marine.ie/ (accessed on 29 September 2021).
  50. Data from the Mean Annual Practicable Power Resource Pelamis MWhe/km Theme Accessed through Ireland’s Marine Atlas. 2021. Available online: http://atlas.marine.ie/ (accessed on 29 September 2021).
  51. Atan, R.; Goggins, J.; Nash, S. A detailed assessment of the wave energy resource at the atlantic marine energy test site. Energies 2016, 9, 967. [Google Scholar] [CrossRef] [Green Version]
  52. Call for Expression of Interest from Marine Energy Technology Developers for Deployment at the AMETS Test Site, Offshore Belmullet, Co Mayo, Ireland. 2021. Available online: https://www.oceanenergyireland.com/site-files/cms-templates/docs/amets-update-report-2021-final.pdf (accessed on 28 September 2021).
  53. International Energy Agency. Offshore Wind Outlook 2019. Available online: https://webstore.iea.org/offshore-706wind-outlook-2019-world-energyoutlook-special-report (accessed on 1 September 2021).
  54. Hersbach, H.; Bell, B.; Berrisford, P.; Hirahara, S.; Horányi, A.; Mu noz-Sabater, J.; Nicolas, J.; Peubey, C.; Radu, R.; Schepers, D.; et al. The ERA5 global reanalysis. Q. J. R. Meteorol. Soc. 2020, 146, 1999–2049. [Google Scholar] [CrossRef]
  55. Maisondieu, C. WEC survivability threshold and extractable wave power. In Proceedings of the 11th Eurpean Wave Tidal Energy Conference, Nantes, France, 6–11 September 2015. [Google Scholar]
  56. Artigao, E.; Vigueras-Rodríguez, A.; Honrubia-Escribano, A.; Martín-Martínez, S.; Gómez-Lázaro, E. Wind resource and wind power generation assessment for education in engineering. Sustainability 2021, 13, 2444. [Google Scholar] [CrossRef]
  57. DNVGL-OS-C301: Stability and Watertight Integrity. Det Norske Veritas. 2017. Available online: https://rules.dnvgl.com/docs/pdf/DNVGL/OS/2017-01/DNVGL-OS-C301.pdf (accessed on 1 August 2021).
  58. Offshore Standard DNV-OS-J101; Design of Offshore Wind Turbine Structures. DNV: Oslo, Norway, 2014; pp. 212–214.
  59. Ogden, D.; Ruehl, K.; Yu, Y.H.; Keester, A.; Forbush, D.; Leon, J.; Tom, N. Review of WEC-Sim Development and Applications. In Proceedings of the 14th European Wave and Tidal Energy Conference (EWTEC 2021), Plymouth, UK, 5–9 September 2021. [Google Scholar]
  60. Sirigu, M.; Faraggiana, E.; Ghigo, A.; Bracco, G. Development of a fast simulation model for optimisation of floating offshore wind turbines in Simscape Multibody. In Proceedings of the WindEurope Conference 2022, Bilbao, Spain, 5–7 April 2022. [Google Scholar]
  61. Ribes, A.; Caremoli, C. Salome platform component model for numerical simulation. In Proceedings of the 31st Annual International Computer Software and Applications Conference (COMPSAC 2007), Beijing, China, 24–27 July 2007; Volume 2, pp. 553–564. [Google Scholar]
  62. ANSYS Inc. Aqwa Theory Manual; ANSYS Inc.: Canonsburg, PA, USA, 2015; Chapter 4. [Google Scholar]
  63. Katsikadelis, J.T. The Boundary Element Method for Engineers and Scientists: Theory and Applications; Academic Press: Cambridge, MA, USA, 2016. [Google Scholar]
  64. Chatzigiannakou, M.A.; Potapenko, T.; Ekergård, B.; Temiz, I. Numerical analysis of an Uppsala University WEC deployment by a barge for different sea states. Ocean. Eng. 2020, 205, 107287. [Google Scholar] [CrossRef]
  65. Hall, M. MoorDyn User’s Guide. 2015. Available online: https:684//www.nrel.gov/docs/fy20osti/76555.pdf (accessed on 16 July 2021).
  66. Hall, M.; Goupee, A. Validation of a lumped-mass mooring line model with DeepCwind semisubmersible model test data. Ocean. Eng. 2015, 104, 590–603. [Google Scholar] [CrossRef] [Green Version]
  67. Product Specification Manual, InterMoor. 2021. Available online: https://intermoor.com/catalogue/chain/ (accessed on 29 September 2021).
  68. Glauert, H. Airplane propellers. In Aerodynamic Theory; Springer: Berlin/Heidelberg, Germany, 1935; pp. 169–360. [Google Scholar]
  69. Burton, T.; Jenkins, N.; Sharpe, D.; Bossanyi, E. Wind Energy Handbook; John Wiley & Sons: Hoboken, NJ, USA, 2011. [Google Scholar]
  70. Ledoux, J.; Riffo, S.; Salomon, J. Analysis of the blade element momentum theory. J. Appl. Math. 2021, 81, 2596–2621. [Google Scholar] [CrossRef]
  71. Jonkman, B.J.; Buhl, M.L., Jr. TurbSim User’s Guide; Technical Report; National Renewable Energy Lab. (NREL): Golden, CO, USA, 2006. [Google Scholar]
  72. Jonkman, J.; Butterfield, S.; Musial, W.; Scott, G. Definition of a 5-MW Reference Wind Turbine for Offshore System Development; National Renewable Energy Laboratory: Golden, CO, USA, 2009. [Google Scholar] [CrossRef] [Green Version]
  73. Ghigo, A.; Cottura, L.; Caradonna, R.; Bracco, G.; Mattiazzo, G. Platform optimization and cost analysis in a floating offshore wind farm. J. Mar. Sci. Eng. 2020, 8, 835. [Google Scholar] [CrossRef]
  74. Iron Ore Prices from June 2019 to December 2021. 2021. Available online: https://www.statista.com/statistics/300419/monthly-iron-ore-prices/ (accessed on 29 September 2021).
  75. Sandner, F.; Wie, Y.; Matha, D.; Grela, E.; Azcona, J.; Munduate, X.; Voutsinas, S.; Natarajan, A Deliverable D4. 3.3–Innovative Concepts for Floating Structures. 2014. Available online: http://www.innwind.eu/-/media/Sites/innwind/Publications/Deliverables/DeliverableD4-33_Innovative-Concepts-for-Floating-Structures_INNWIND-EU (accessed on 23 September 2021).
  76. So, R.; Casey, S.; Kanner, S.; Simmons, A.; Brekken, T.K. PTO-Sim: Development of a power take off modeling tool for ocean wave energy conversion. In Proceedings of the 2015 IEEE Power & Energy Society General Meeting, Denver, CO, USA, 26–30 July 2015; pp. 1–5. [Google Scholar]
  77. Rhinoceros 3D, version 6.0; Robert McNeel & Associates: Seattle, WA, USA, 2010.
  78. Vigara, L.C.F. D1.2 DESIGN BASIS European Project Reviewed by UL Int Gmbh Innosea. 2019. Available online: https://ec.europa.eu/research/participants/documents/downloadPublic?documentIds=080166e5cab1a5bf&appId=PPGMS (accessed on 3 September 2021).
  79. Madsen, F.J.; Pegalajar-Jurado, A.; Bredmose, H. Performance study of the QuLAF pre-design model for a 10 MW floating wind turbine. Wind. Energy Sci. 2019, 4, 527–547. [Google Scholar] [CrossRef] [Green Version]
  80. Team, U.; Cummins, V.; Devoy, F.; Dinh, N.; Hastings, R.; Murphy, J.; Marie, A.; O’Hagan, Z.O.; Team, O.C.; Smart, G.; et al. OPFLOW Final Report: Options on a Pre-Commercial Demonstrator Project for Floating Wind; Work Package 5: Synthesis Deliverable 5.1 FINAL SYNTHESIS REPORT. 2020. Available online: https://www.seai.ie/documents/research-projects/RDD-000412.pdf (accessed on 12 September 2021).
  81. Leahy, L.; Spearman, D.K.; Shanahan, R.; Martins, E.; Northridge, E.; Mostyn, G. Harnessing our Potential: Investment and Jobs in Ireland’s Offshore wind Industry. Carbon Trust 2020 Report. 2020, p. 18. Available online: https://prod-drupal-files.storage.googleapis.com/documents/resource/public/final-harnessing-our-potential-report-may-2020.pdf (accessed on 22 September 2021).
  82. Dutta, B.L.S. Global Innovation Index 2021. Available online: https://www.globalinnovationindex.org/Home (accessed on 2 June 2021).
  83. Castro-Santos, L.; Martins, E.; Soares, C.G. Economic comparison of technological alternatives to harness offshore wind and wave energies. Energy 2017, 140, 1121–1130. [Google Scholar] [CrossRef]
  84. Sheng, W.; Lewis, T. Energy Conversion: A Comparison of Fix- and Self-Referenced Wave Energy Converters. Energies 2016, 9, 1056. [Google Scholar] [CrossRef] [Green Version]
  85. Amaral, L.; Castro, R. Offshore wind farm layout optimization regarding wake effects and electrical losses. Eng. Appl. Artif. Intell. 2017, 60, 26–34. [Google Scholar] [CrossRef]
Figure 1. RM3 1:1 scale illustration [36].
Energies 15 02739 g001
Figure 2. NautiluspPlatform (a) and hybrid wind and wave platform (b).
Energies 15 02739 g002
Figure 3. Coordinates reference system.
Energies 15 02739 g003
Figure 4. General workflow.
Energies 15 02739 g004
Figure 5. (a) Mean wind speed at 125 m (2013) [49], (b) Mean Annual Practicable Power Resource Pelamis MWhe/km [50].
Energies 15 02739 g005
Figure 6. AMETS sites (BA and BB) and the new site BC identified and considered in this work [51,53].
Energies 15 02739 g006
Figure 7. Workflow of the hydrostatic design.
Energies 15 02739 g007
Figure 8. Numerical model of the hybrid wind and wave system.
Energies 15 02739 g008
Figure 9. Nautilus stl file obtained from Salome-Meca.
Energies 15 02739 g009
Figure 10. WEC’s PTO simulink block.
Energies 15 02739 g010
Figure 11. Convergence of the power output.
Energies 15 02739 g011
Figure 12. ANSYS ‘Pressure and motion’ workspace output for hybrid system.
Energies 15 02739 g012
Figure 13. Nautilus moorings layout.
Energies 15 02739 g013
Figure 14. Blades subdivision as illustration to Glauert’s method [69].
Energies 15 02739 g014
Figure 15. Figure 12 Subdivision of Loads on blade airfoil [70].
Energies 15 02739 g015
Figure 16. Nautilus intact stability curve: comparison between in-house tool and commercial software Orca-3D.
Energies 15 02739 g016
Figure 17. Intact Stability curve for Nautilus hybrid platform.
Energies 15 02739 g017
Figure 18. Decade data set triplets (Hs Tp V0) against the occurrence values.
Energies 15 02739 g018
Figure 19. Filtered data set 3D-plot.
Energies 15 02739 g019
Figure 20. Max pitch angle (a), RMS nacelle‘s acceleration (b) and Mean power output (c) for each sea-state triplet between two systems.
Energies 15 02739 g020
Figure 21. Pitch (a), Nacelle acceleration (b) and power output (c) comparison with H s = 4 m; T p = 10 s; V 0 = 14 m/s of Hybrid and only FOWT system.
Energies 15 02739 g021
Figure 22. Breakdown cost for hybrid configuration (a) Wind turbine and Platform, (b) WEC.
Energies 15 02739 g022
Figure 23. Breakdown cost of FOWT platform.
Energies 15 02739 g023
Figure 24. LCOE variation by wind turbines number.
Energies 15 02739 g024
Figure 25. LCOE variation with Cost reduction (a), LCOE variation with Cost reduction + WACC set at 4% (b).
Energies 15 02739 g025
Table 1. DTU 10 MW wind turbine main parameters.
ParametersValues
Rating10 MW
Rotor Diameter176 m
Hub Diameter5.6 m
Rotor mass228 ton
Overall mass1305 ton
Nacelle mass406 ton
Tower mass628 ton
COG (m)(0; 0; 85)
Distance from the center of the rotor to SWL (Sea Water Level)119 m
Table 2. WEC mass properties [36].
ParametersValue
Float Mass727 ton
COG(0, 0, −0.72) m
Second moment of Inertia(20,907,370; 21,306,091; 37,085,481) kg m 2
Table 3. Classification of triplets.
ClassStart ValueStep SizeEnd Value
TpClass3.5 s3 s16.5 s
V0Class0.5 m s 2.5 m s 30.5 m s
HsClass0.5 m2 m6.5 m
Table 4. Moorings layout main features.
ParameterValue
Type of lineChain
Diameter0.114 m
Mass Density126 kg/m
Stiffness583 N
Unstretched length1020 m
Seabed Depth200 m
Table 5. Hydrostatic properties of the not optimized Nautilus platform.
Not Optimized Nautilus’ Hydrostatic Properties
ParametersValue
COB−13.9 m
COG3.5 m
Mass17,778 ton
Table 6. Mass and geometry parameters of the optimal hybrid and FOWT platform configurations.
ParametersHybridOnly FOWT
External length of pontoon base [m]9090
Internal length of pontoon base [m]7070
Columns height [m]2828
Draught [m]2121
Columns Diameter [m]612
Platform materialStainless steel (7700 kg/m 3 )Stainless steel (7700 kg/m 3 )
Ballast materialMagnetite (5200 kg/m 3 )Magnetite (5200 kg/m 3 )
COG [m](0, 0, −40)(0, 0, −53)
COB [m](0, 0, −18)(0, 0, −17)
Pendulum ballast mass [ton]61267963
Total mass [ton]11,39516,332
Table 7. Reduced scatter matrix after filtering process.
H s / T e 6.59.512.5
0.514.444.640
219.9330.097.43
402.123.41
Publisher’s Note: MDPI stays neutral with regard to jurisdictional claims in published maps and institutional affiliations.

