1. Introduction
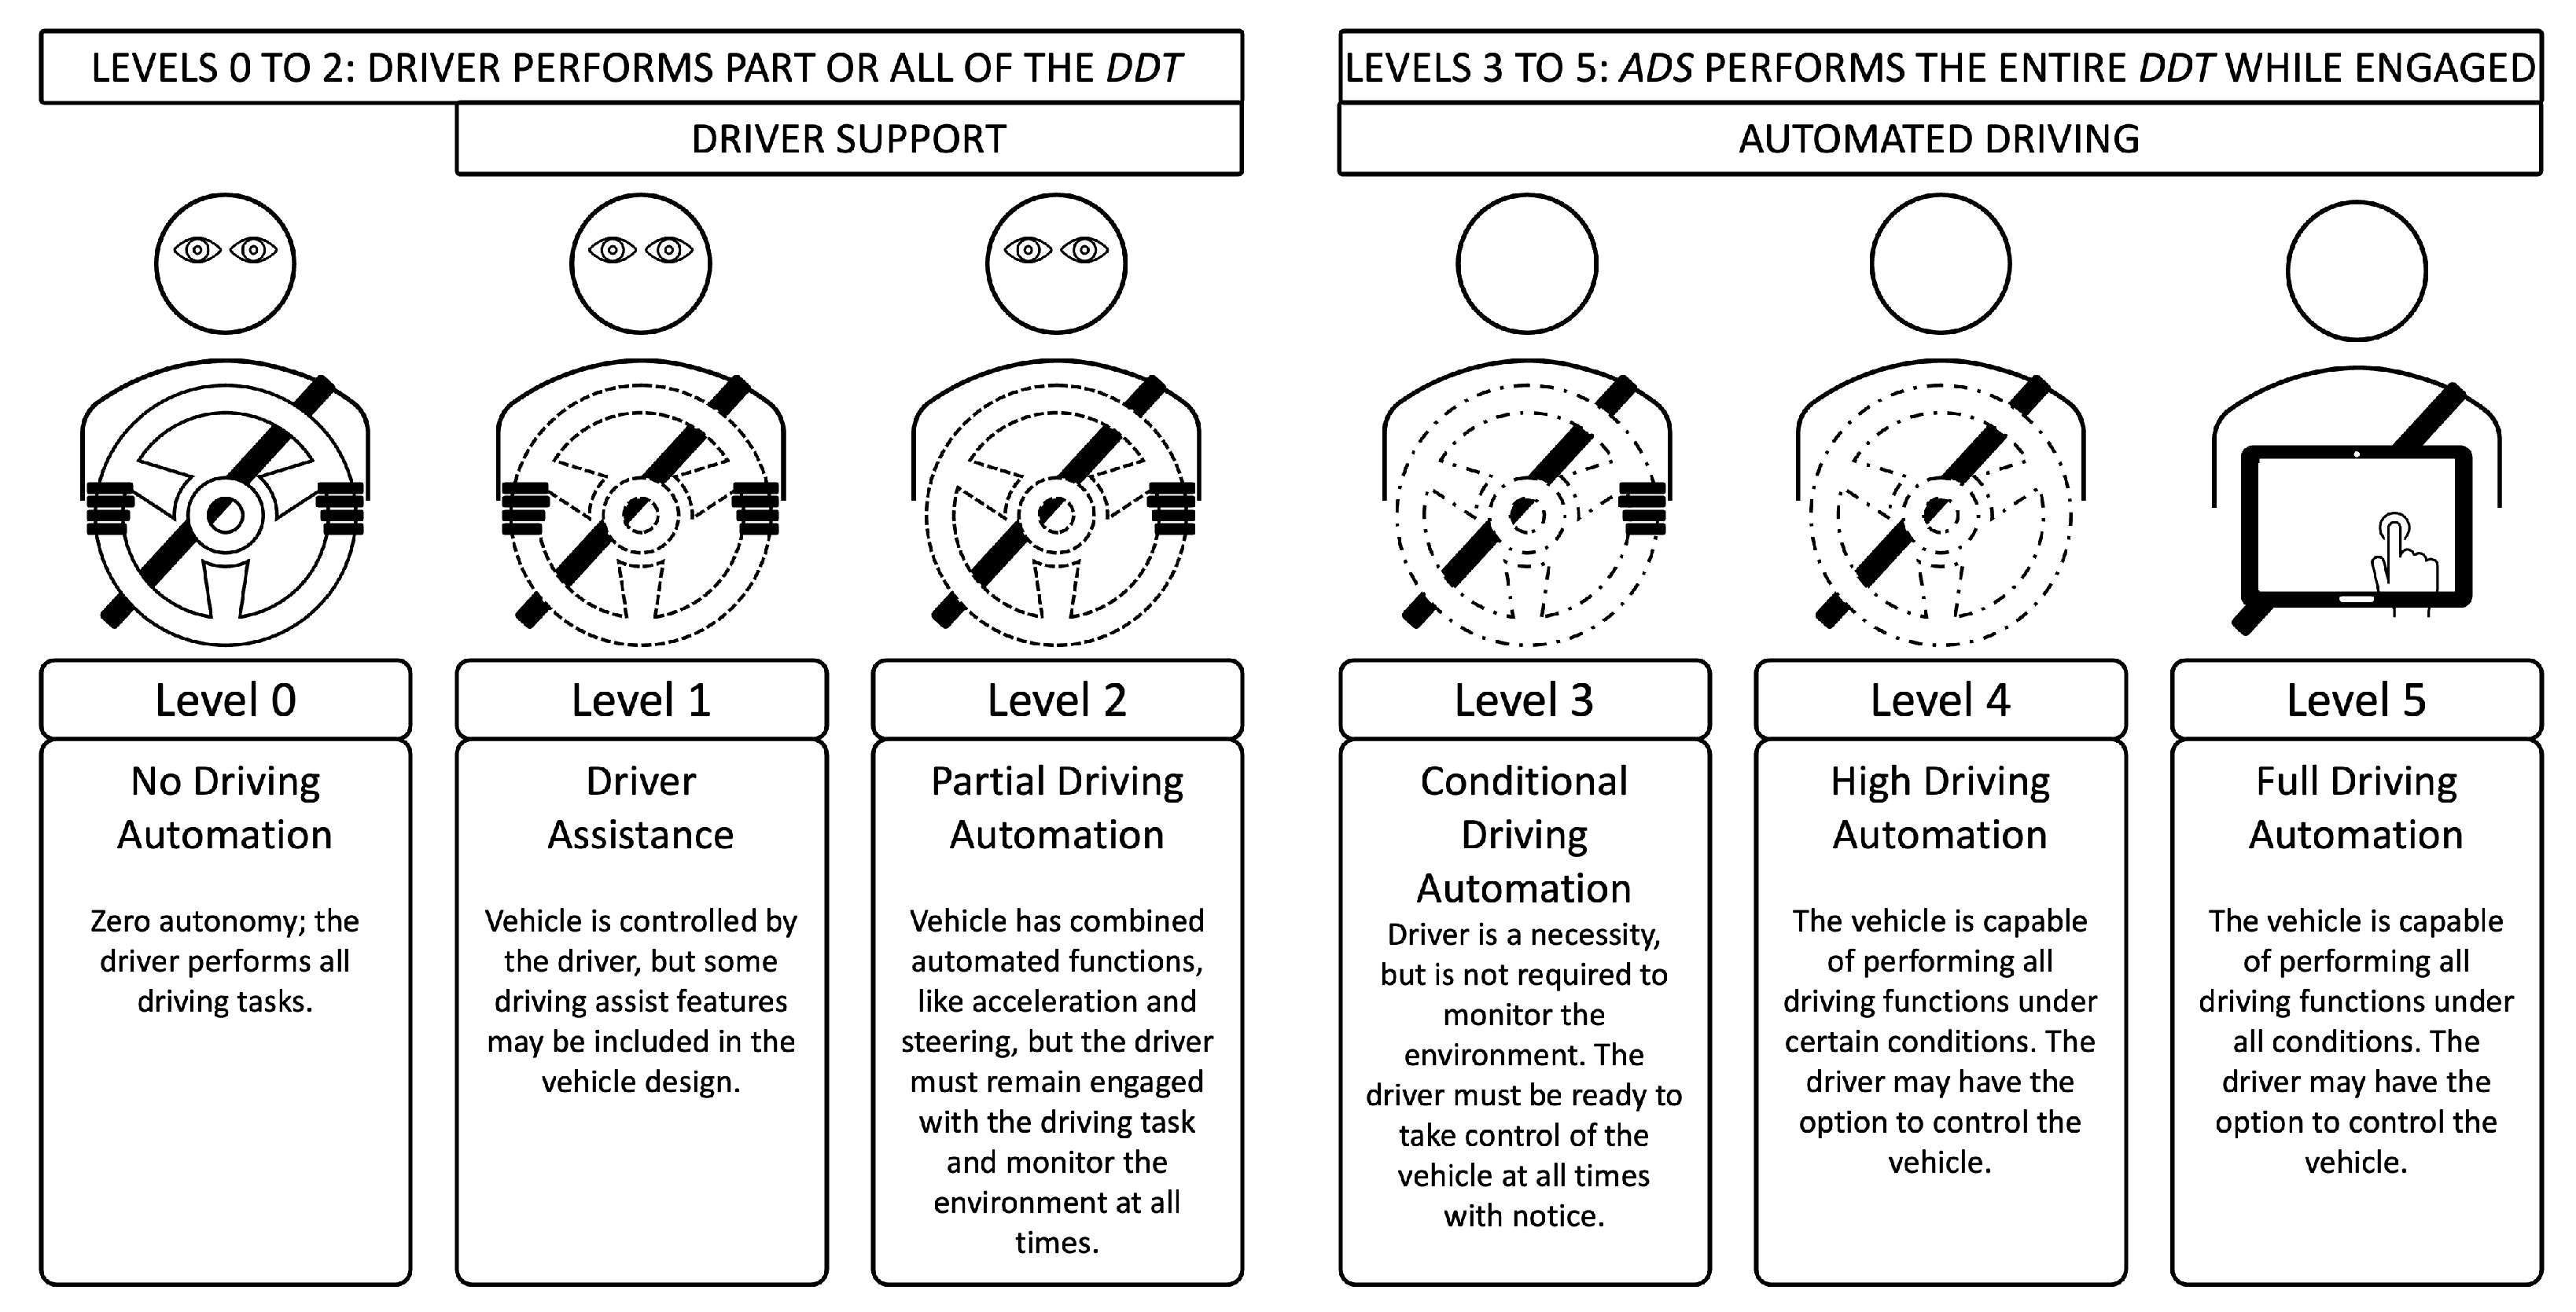
Advanced driver assistant systems (ADAS) and autonomous driving (AD) are stepwise turning into reality. According to the Society of Automotive Engineers (SAE) this process is defined in five levels. In
Figure 1 the levels are depict from conventional manual driving—no driving automation (SAE Level 0)—through conditional automated driving (SAE Level 3) with the fallback-ready user to the full driving automation (SAE Level 5), which covers all situations everywhere [
1].
In the intermediate steps, the human–machine interaction becomes an indispensable factor for the technological progress in the development [
2,
3], as it acts as a technological enabler that improves performance, safety, trustworthiness and comfort [
4]. This is reflected by many studies concerning the interaction of humans with vehicle controls [
5,
6,
7]. As there is a significant probability of harming the study participants, many studies are shifted from the real driving experience on the road into the virtual driving simulator environment, with particular attention on the selection of the appropriate simulator fidelity and validity [
8]. This also turns out to be valid for future driver training programs with a potential expected to work even in countries with an already pretty low accident rate [
9,
10]. Moreover, simulators provide the opportunity to enhance training for safety-critical systems and situations [
11,
12,
13]. The ongoing discussion of differences between real driving and the simulation has been overcome by the need for repeatability of the tests and the safety of the participants.
The future challenge on automated driving is that most of the time the task for the driver is to observe the environment and the vehicle performance without being actively involved. Then, occasionally in already near-critical situations the vehicle requests the driver to perform those critical situations immediately. These two contrary tasks challenge our society with the little knowledge about the technology and its interaction with human beings. Despite the potential benefits and influence of virtual training on the assessment of learning effects and trust in automation, there is a lack of sound research data on the effects of virtual training on those new systems. Besides study questionnaires, current research is ongoing to measure trust in automation in real-time scenarios, as in Azevedo Sá et al. [
14].
1.1. The Technology Challenges
Multiple industrial sectors, including transportation and mobility, are experiencing a significant technological transformation. Considering the safety-critical nature of the technologies that drive this transformation, the automotive safety community has considerable interest in the development. However, the established safety engineering methods are somewhat failing to support these changes entirely. Thus, extensive effort is invested in developing safety engineering methods, safety design approaches and safety development processes that support this technological transformation [
15].
AD is generally seen as one of the critical trends in the mobility sector and also one of the key components of the mentioned transformation [
16]. To fulfil the anticipated AD evolution, there is a demand for progress in supporting technologies (e.g., sensors and actuators), particularly in artificial intelligence (AI) (at the edge) based approaches [
17] and further to a combined driver evaluation out of non-obstrusive monitoring sensors and the AI technology [
2]. AI technologies are increasingly used for critical applications because these approaches exceed the current state of the art (e.g., recognising patterns and inferring relationships), creating a high demand for AI in terms of realising automated and autonomous driving functions [
18]. The outcomes are expected to be technically viable and compelling for humans, hence enticing user acceptance of AD. A lot of effort is put into completing the challenges related to trustworthy AI solutions to cater for human stakeholders [
19]. Trust and safety are of utmost importance as to gain acceptance of AD functions.
The key challenge in this context is that the established safety engineering processes and practices (e.g., described by ISO 26262 [
20] and ISO/PAS 21448 [
21] for the automotive domain) have been only successfully applied in conventional model-based system development. In many industry contexts, none of the available safety standards have defined processes that explicitly consider the specifics of AI-based approaches. These factors include the requirements on dataset collections, the definition of performance evaluation metrics, the AI architectures, and the handling of uncertainty [
18].
The ultimate goal of safety-critical systems is to maximise the evidence of a positive risk balance. Conventional safety engineering processes apply model-based system development to establish structured and human-understandable arguments of the risks inherent to the system under development. The risk-driven safety engineering processes implement a system function with the required service quality (i.e., safety integrity level). For AI-based systems, it is challenging to provide such service quality metrics. For example, AI-based concepts build upon probabilistic modelling, including random variables and probability distributions, to model situations and events. As such, an AI function model returns a probability distribution as output for specific input.
In general, AI-based approaches depend on the data used to parameterise its function and the process of parameterising (called training or learning). The quality of the used dataset and the choice of the AI architecture directly influence the quality of the function. In contrast, human-programmed model-based functions typically return a specific result and not a probability distribution to a particular input. In the context of this work, this AI-related topic also reappears in relation to the establishment of trust and acceptance of automated driving in general, and the selection of virtual experiences in particular. It contributes to the establishment of trust and acceptance of such systems, with the expectation to open the gate for implementation of new AI functionality in future.
1.2. Trust and Acceptance
Trust in automation is a key determinant for the adoption of automated systems and their appropriate use [
22] and along with other factors, has a significant impact on interest in using an automated vehicle [
23]. Studies suggest a strong connection between trust in technical solutions and user acceptance on the same level [
24,
25,
26]. The key challenges in terms of acceptance of fully or partially autonomous vehicles are balanced between the needed interaction with the technology, the associated benefits and the hidden risks. In particular, it is the level of required driver’s awareness in combination with the human trust towards automated decisions in all conditions that are associated with acceptance [
24]. For example, the need for continuous monitoring limits user acceptance as it diminishes the benefit of securing the driver with more freedom for side tasks. The additional open questions that could limit user acceptance are presented by the need for the drivers to take over vehicle control at emergency scenarios or extreme conditions or when the driving automation fails [
27], unless there is a dependable fail-operational strategy in place to take over the vehicle control [
28]. Most of the user acceptance studies analyse the effects of cognitive factors, but with a limited impact from social aspects [
25], since the decision-making process is heavily influenced by opinions that are most important to the people making these decisions [
29] and their hedonistic motivations [
30]. While that is empirically demonstrated [
31], it is also expected that acceptance of the driving automation would be closely related to social influence but with a possibly different strength across different cultures, e.g., some cultures are likely to exert stronger on social influence than other ones [
24]. Hence, there is a need for wider conclusive studies based on empirical data across demographic groups.
While acceptance is an important condition for the successful implementation of automated driving vehicles [
32], recent research considers the relation between attitudes towards automated systems and their actual use [
33]. Reduced acceptance level is also correlated to a lack of safety [
34]. Furthermore, it is important to consider that currently AD has not yet been experienced by the majority of drivers [
35]. Driving simulators are used to conquer the acceptance obstacle by determining the trust in AD functions and improvements of trust through experience while eliminating the need for complete vehicle prototypes and securing entire scenario repeatability [
36]. It is the reproducible validation and demonstration of mature automated functions, their reliability, and safety that work towards securing societal acceptance [
37]. Besides ensuring the durability of the technical solutions, increased user acceptance of the new automotive technologies crucially determines the sustainability of the consequent business implementation [
38]. Sustainability is further supported through the trustworthiness of the solutions, which acts as an enabler for the development and implementation of an appropriate value creation strategy for maximisation of benefits amongst the engaging stakeholders [
38].
In addition to focusing on the AD functions, the driving simulation potentially educates newly qualified drivers on unexpected critical situations on the road, which are generally unpredictable and not part of the driving license education. The potential of such training is evaluated by pre- and post-testing questionnaires for a broad spectrum of users, with attention to the low yearly driving experience group. There is a potential to increase acceptance and trust levels and situational experience through virtual training.
The consequent research questions are: can an advanced simulator (
Section 2.4) experience improve trust in and the acceptance of automated driving, and are there any significant differences resulting from the driving simulations for different demographic groups (i.e., gender, age, experienced vs. inexperienced drivers, ADAS/AD experience)?
To answer these research questions we employ a unique combination of a state-of-the-art dynamic simulator in its characteristic measurement setup, the relevant scenarios targeting appropriate psychological assessment and a sizable study sample.
2. Materials and Methods
Simulators have the potential to raise the AD profile amongst the general population. To examine the impact of such exposure on a safe version of AD, a study comprising ten driving scenarios was designed to gather feedback on tailored questions from a defined sample group.
The expression of trust (EOT) questionnaire is the primary measurement tool in the present study to evaluate participant’s subjective trust. The expression of trust is a modified version of the Trust into Automation questionnaire [
39]. Each participant faces the questionnaire twice within the study to enable an initial estimate of trust and explore the change of trust in an AD system throughout the designed experiment. The questionnaire is used before the test as a baseline for each participant. Upon the test procedure, the participants face the same questionnaire again. This allows to measure the impact of such a simulator experience on the trust in the AD system.
The system usability scale (SUS) [
40] is used to verify the suitability and usability of the simulator and the simulation within the testing environment, and the behaviour of the system itself. Furthermore, it indicates whether or not such a testing method is suitable for such a study.
A raw NASA TLX questionnaire [
41,
42] is used to research the workload of the participants. As the study does not request the participants to drive or react and control the vehicle on their own, the NASA TLX reflects the workload of the participants monitoring the vehicle behaviour and environment during the automated drive. This effort is expected to be low due to the eliminated need for active driving tasks from the participants.
2.1. Sample
A total of 60 out of 112 registered participants participated in the test procedure. The selection focused on obtaining a well-distributed study sample. Out of those 60 participants, 55 completed the test successfully. The results from 7 participants were removed due to incomplete datasets for the questionnaires. This yielded 48 complete datasets for the analysis of the questionnaires of expression of trust, raw NASA TLX, and the system usability scale.
The sample is grouped by the participants’ demographic factors in the defined categories, such as age, gender, yearly driving range, driver assistance experience, and educational level. The distribution is as follows:
gender: 27 male, 21 female, 0 neutral;
age group: 21 (18–29 years), 19 (30–45 years), 8 (46–65 years);
mileage km/year: 8 (<5000 km/yr), 12 (5001–10,000 km/yr), 28 (>10,001 km/yr);
ADAS experience: 22 (without pre-experience), 26 (with pre-experience);
education: 13 below Bachelor level, 35 above Bachelor level—according to ISCED [
43].
2.2. Study Materials
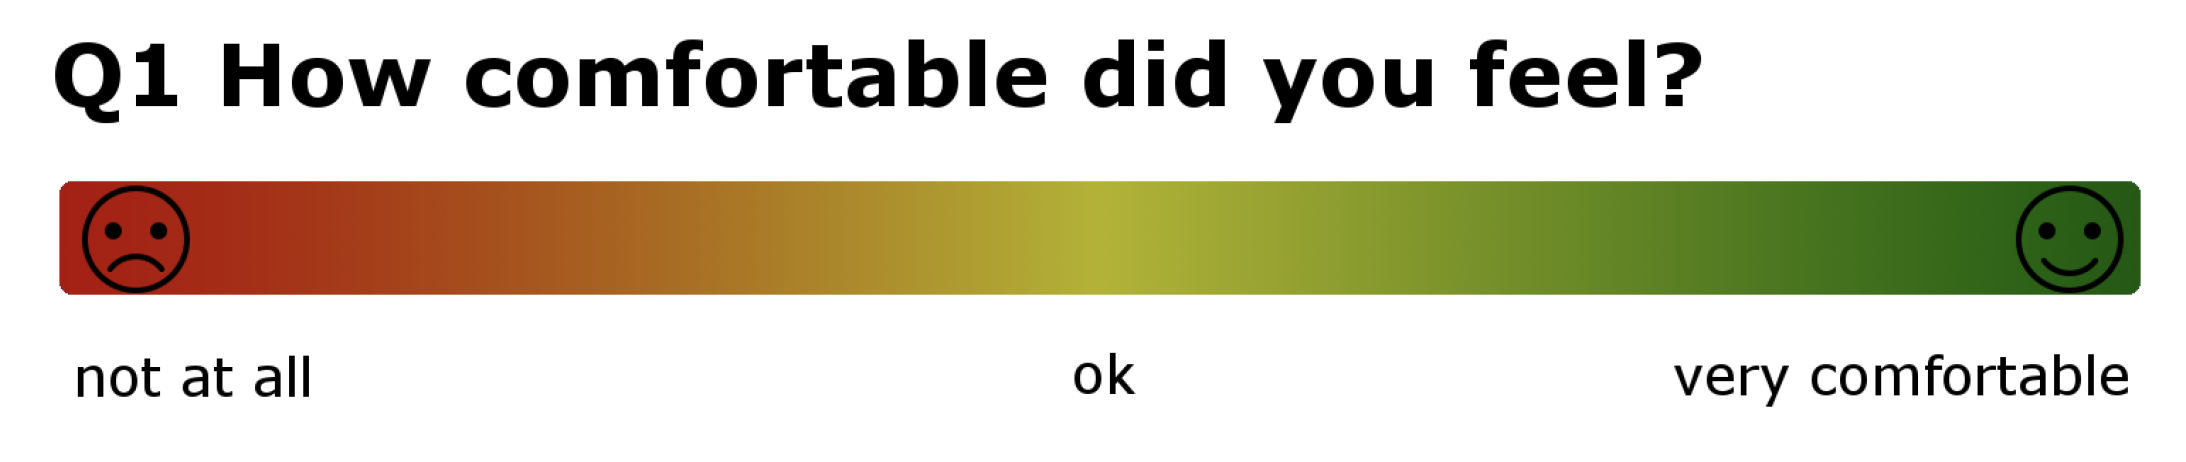
Three different questionnaires were used to evaluate trust, system usability, and workload to obtain subjective ratings of these relevant aspects. They gather the participants’ feedback on their global perception of trust in automation and the use of AD systems. The questionnaires are the EOT, the raw NASA TLX, and the SUS. The questions are presented using a tablet computer allowing the subjects to provide their rating by screen tapping. The ratings may be corrected up to the point when the participant confirms the questionnaire as complete. The answer is recorded in a decimal format. To support the participants to put in their intended answer, the graphical appearance of the answer input area is supported by a color code, smileys, and written explanation. An example of the visualization is shown in
Figure 2.
The EOT is a modified version of Helldin et al. [
45] and relies on the original questionnaire on trust in automation from Jian et al. [
39]. The questions assess user trust in AD functionality on a seven-point Likert scale, spreading from do not agree at all to agree completely. The questionnaire is presented before the participants get into the cockpit and start the test execution, and after they leave the cockpit. This double testing allows measuring changes in the participants’ trust subject to their experience in the test environment. The following questions are used in this questionnaire:
- Q1
I understand how the automated driving system works—its goals, actions, and results.
- Q2
I would use the automated driving system if they were available in my own car.
- Q3
I think the actions of the automated driving system will have a positive impact on my own driving.
- Q4
I put my faith in the system.
- Q5
I think the automated driving system will ensure safety while driving.
- Q6
I think the automated driving system is reliable.
- Q7
I can trust the automated driving system.
Each question reflects upon a specific part of the human trust in automation. In the present study, all single answers of a participant are summarised, and a mean value is built according to Equation (
1) to reflect an overall change of the response, from before to after the experiment, where
is the new built overall score per participant and
is the single response to one of the questions one to seven of one participant.
The mean value is treated as a new dependent variable and processed together with the demographic interactions in the analysis of variances and correlations.
After the test execution, the usability of the system is assessed by the SUS [
46]. The ten-question questionnaire is adapted to fit the boundaries of the study. It also adopts the advice from Grier et al. [
47]. The questions used are:
- Q1
I think I would like to use this assistance system frequently.
- Q2
I thought the assistance system was unnecessarily complex.
- Q3
I thought the assistance system was easy to use.
- Q4
I think I would need the assistance of a technical person to use this system.
- Q5
My impression was that the different functions in this assistance system were well integrated.
- Q6
I felt there was too much inconsistency in this assistance system.
- Q7
I can imagine that most people would learn to use this assistance system very quickly.
- Q8
I found that the assistance system was very cumbersome to use.
- Q9
I found the use of the assistance system to be convincing.
- Q10
I had to learn a lot of things before I could start using this assistance system.
The possible answers range from absolutely disagree to absolutely agree. The numerical values behind the answers reach from 0 to 4, with four representing the highest value the participant’s answer can be. Therefore, for questions 1, 3, 5, 7, and 9, the values range from 0 to 4 and for the negatively formulated questions 2, 4, 6, 8, and 10, the values range from 4 to 0 and their polarity is reversed prior to the statistical analysis. For the ten questions, the maximum summed up result is 40 points. The summed value is further scaled by a factor of 2.5 to obtain a scale from 0 to 100 for each participant. A mean value for the system is then generated out of all participants’ answers [
48,
49].
The third post-testing questionnaire is the NASA TLX [
50], a standardised questionnaire on participants’ perceived workload. For the actual purpose, the questions are presented as single questions without the weighting of the question pairs, also called “raw TLX”. This was chosen as an appropriate cut-off in terms of the participant’s timing. Therefore, an overall workload calculation is excluded in the data analysis procedure as the official rules can not be followed [
50].
- Q1
Mental demand. How mentally demanding was the task?
- Q2
Physical demand. How physically demanding was the task?
- Q3
Temporal demand. How hurried or rushed was the pace of the task?
- Q4
Performance. How successful were you in accomplishing what was required of you?
- Q5
Effort. How hard did you have to work to achieve your level of performance?
- Q6
Frustration. How insecure, discouraged, irritable, stressed, and angry were you?
The answer options to those questions range from very low to very high with exception of question 4, which offers an answer scale from perfect to failed on a seven-point scale.
2.3. Experimental Procedure
Each participant followed a standardised experimental procedure also described in Clement et al. [
44].
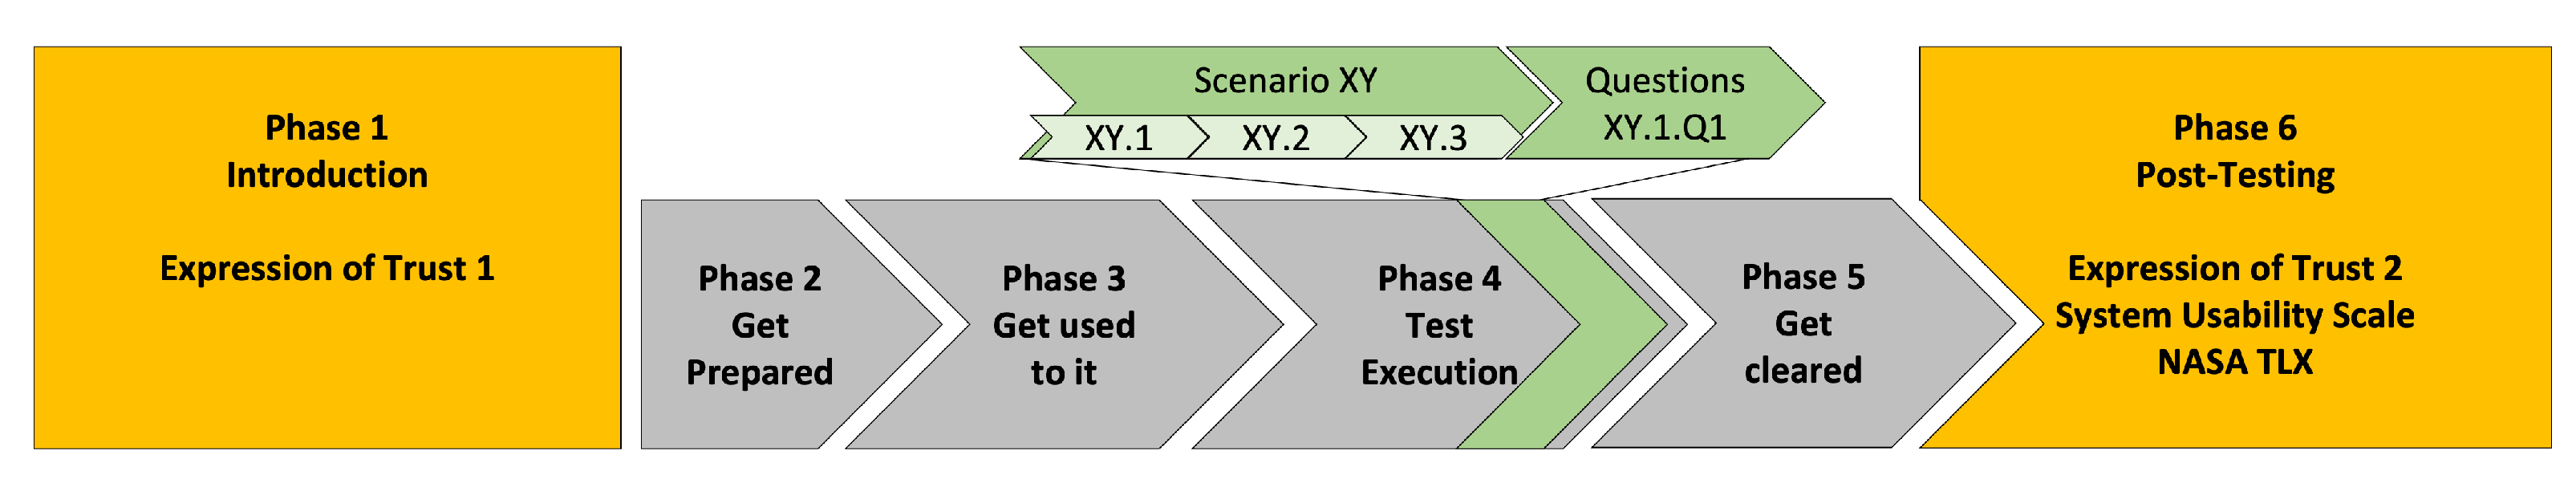
Figure 3 offers a top-level visualization of this procedure, starting with the introduction phase and continuing on to the post-testing phase. These two phases are the measurement phases for investigating the change of attitude due to the participant’s exposure to AD in a moving driving simulator.
In phase one, the “introduction phase”, the participants are introduced to the testing procedure, informed about the relevant data protection rules (according to the GDPR [
51]) and the appropriate measurements. This is done by a psychologist to ensure consent and to provide a trained professional to deal with unforeseen circumstances. Upon the initial talk, the participants’ expression of trust in AD and their prior experience is evaluated by a questionnaire. Participants have the ability to withdraw from the experiment in any phase.
In phase two, the “get prepared phase”, the participants are equipped with the necessary sensors and connected with the database for recording. They are seated in the simulator for further instructions, which is the first time they see it. The participants do not see or meet each other to avoid any influence in this regard. They get informed about the detailed testing procedure and the equipment used for it, especially the simulator vehicle cockpit they are seated in and which they need to handle. Especially the interaction with the human–machine interface (HMI) is explained, as the information about disabled functionality is displayed in the drivers dashboard and interaction with the presented Scenario Specific Questionnaire on Trust (SSQT) questions is done on the central infotainment.
In phase three, the “get used to it phase”, the participants are able to drive in the virtual environment on their own, five minutes without the moving hexa-pot platform and then five minutes with the activated movement platform. Test questionnaires of the SSQT are presented in the central infotainment dashboard to avoid uncertainties within the experiment.
In phase four, the “test execution phase”, the actual exposure to the high automated driving scenarios takes place. The participants are driving trough the scenarios with the task to observe the behaviour of the vehicle and its reactions to the environment and further answer the SSQT to provide the required feedback. All ten scenarios and their consecutive SSQTs are processed automatically one after another.
In phase five, the “get cleared phase”, the participants leave the cockpit, once all scenarios are completed successfully and all sensors are removed, so they are able to recover before they move on to phase six.
In phase six, the “post-testing phase”, the same questionnaire as in phase one is presented to assess the participants’ expression of trust in the AD after their simulator experience to evaluate the differences. Additionally, the NASA TLX [
50] questionnaire is presented to the participants for workload measurements without a pairwise weighting. Furthermore, the SUS [
40] is used to evaluate the subjective usability of the testing system.
2.4. Equipment and Techniques
For the virtual environment, an actual vehicle cockpit, resected of a real vehicle and modified with additional HMI displays and buttons, is mounted on a moving hexa-pod platform [
52]. A 180° canvas displays the simulated scenery of a real road with three video projectors (4 K 100 Hz) for prevention against motion sickness. The platform is capable of performing movements in six degrees of freedom, three lateral directions with accelerating up to 6 m/s
2 in any direction and up to 1.5 m of movement, and rotating around the three axis as a result. The virtual environment is provided by Vires VTD [
53], whereas the platform movement is calculated by a vehicle simulation model [
54] for better accuracy. All components of the environment are synchronised by the co-simulation framework Model.Connect [
55]. The simulator is capable of performing all movements of normal driving conditions up to the aforementioned 6 m/s
2 accelerations [
44].
The environment is regulated from a control (and preparation) room and is supported by a data server for data management. The automated data collection focuses on the participant’s state, responses to the questionnaires, and the biometric data. The biometric sensor setup can be modified in accordance with the study design and the expected output. This study makes use of time-of-flight cameras, a chest belt for heart-rate measurements, a wristband for assessing skin conductivity and body temperature, and an eye-tracking device. The setup is characterised by the combination of the subjective psychological data assessment and the interactive subjective questionnaires.
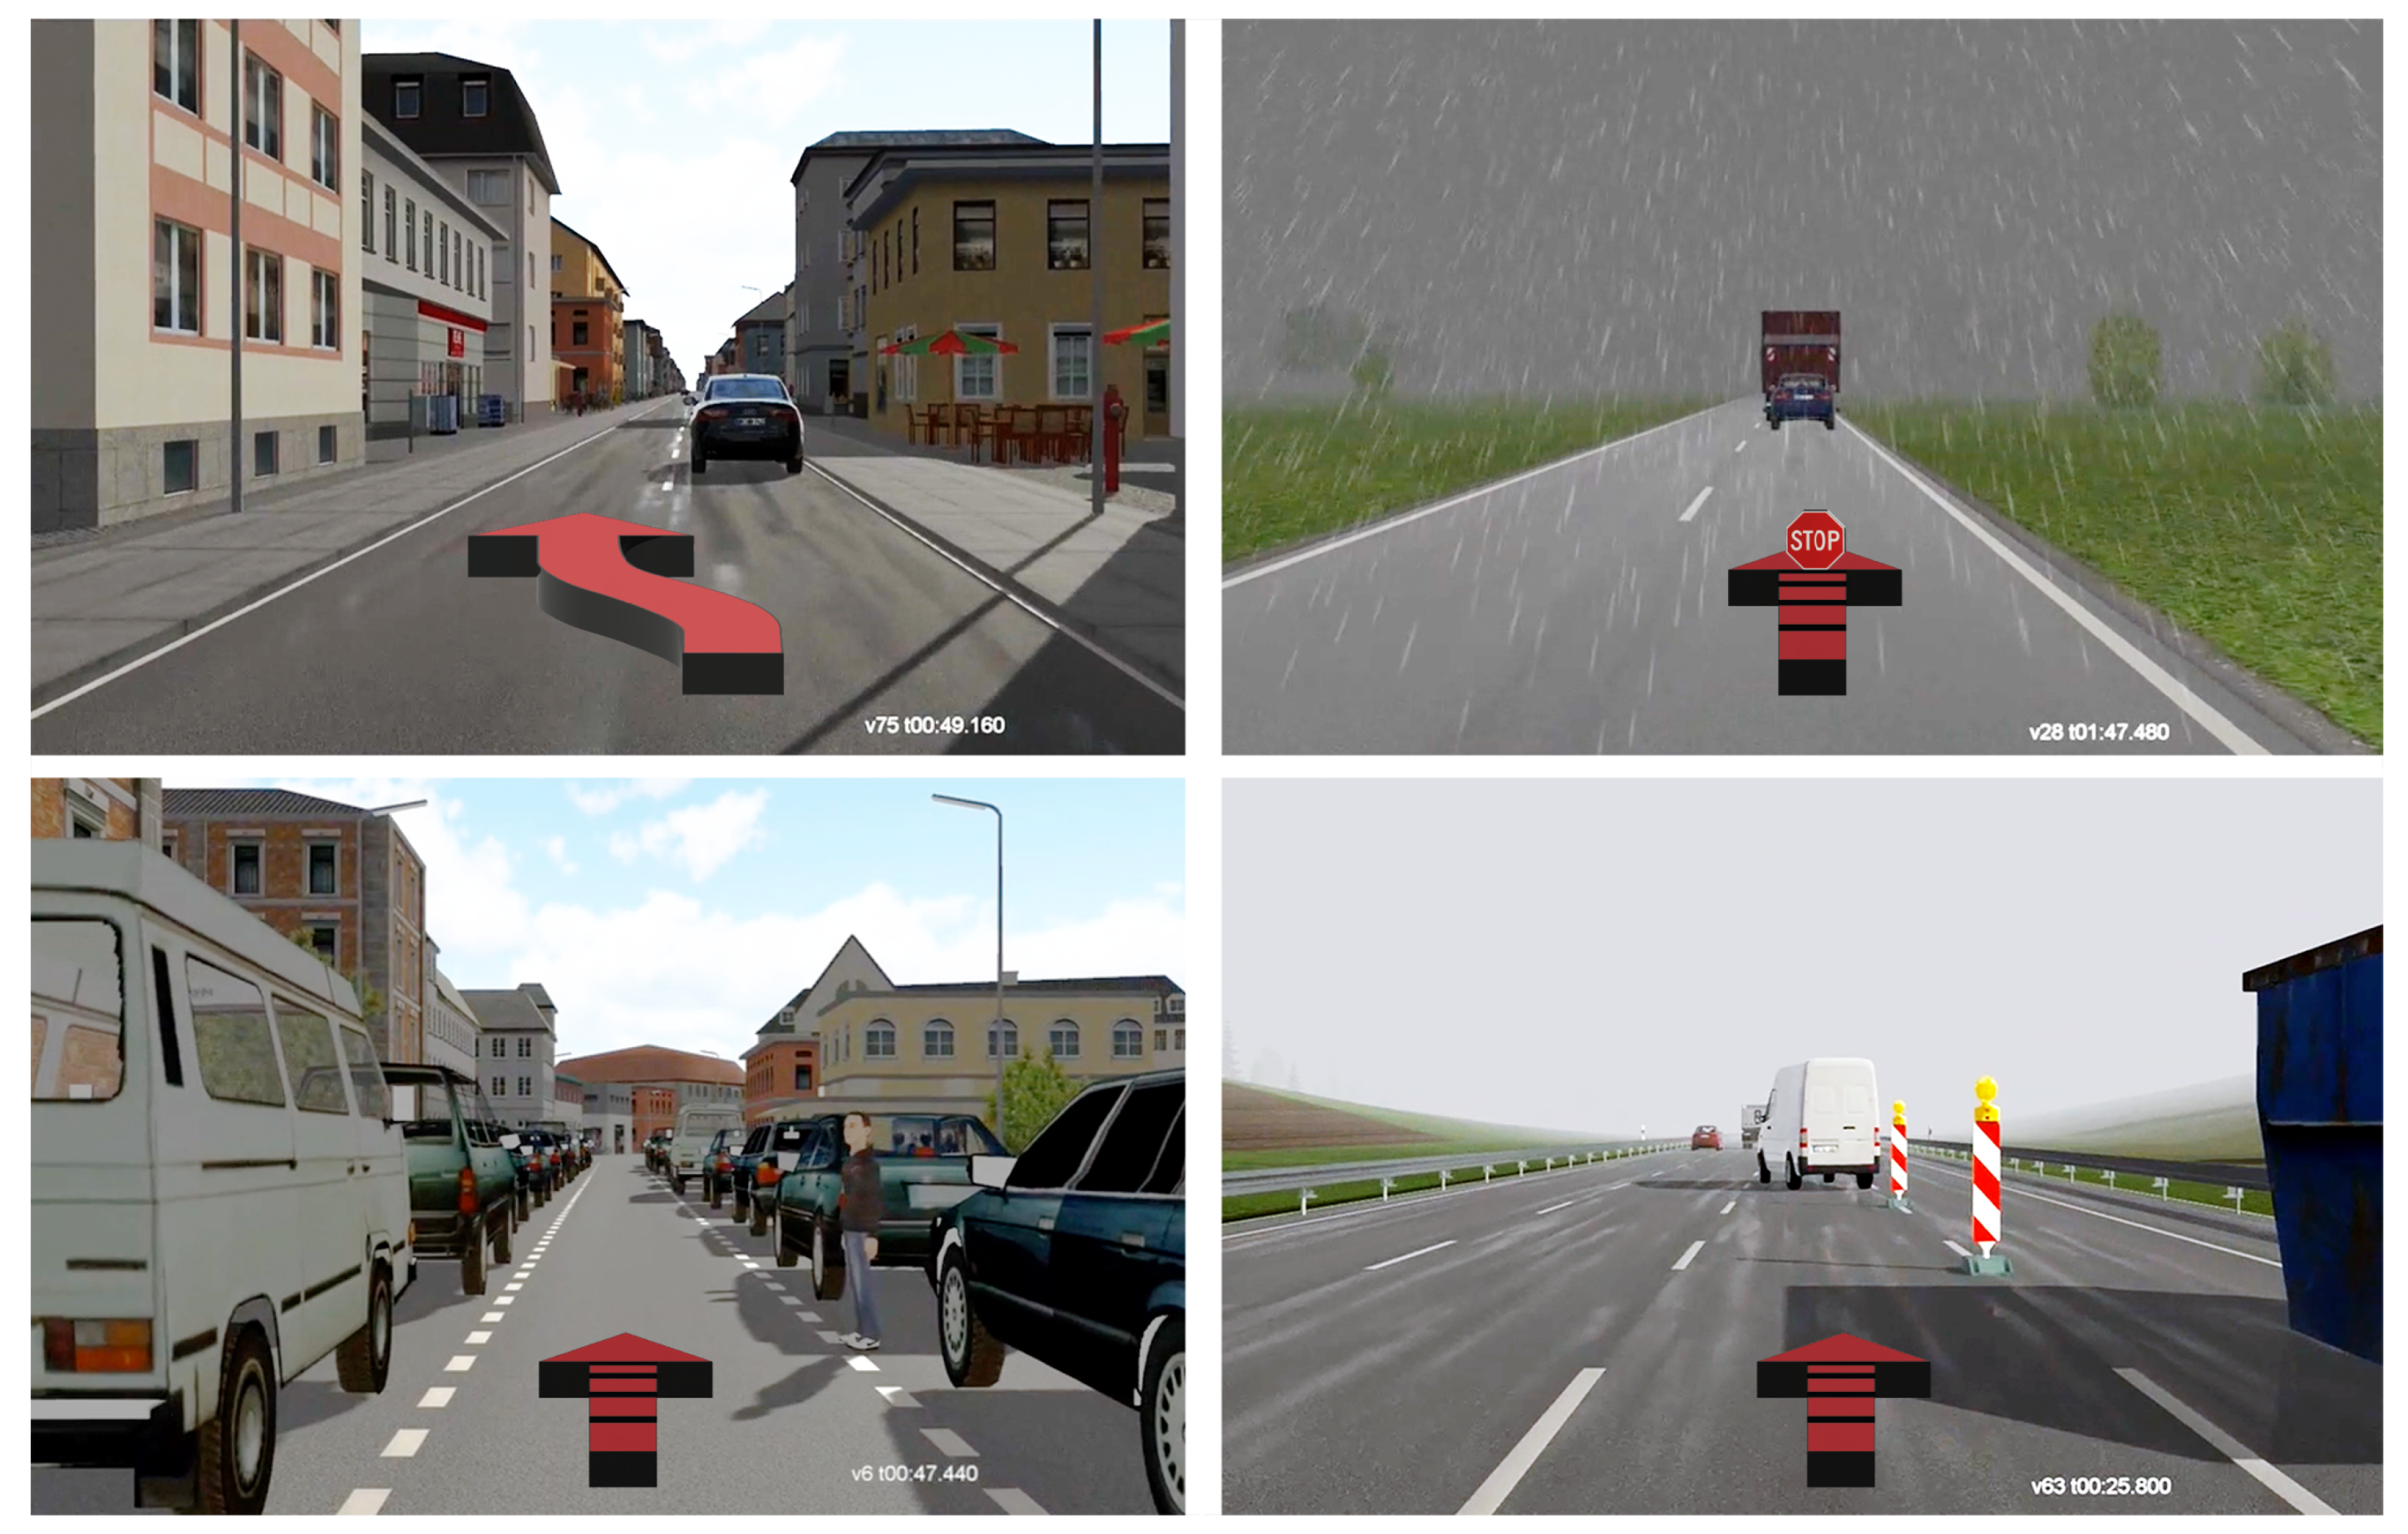
2.5. Scenarios
Phase 4 of the testing procedure, shown in
Figure 3, contains ten consecutive scenarios which are executed and standardised for each participant. The scenarios are designed to give the subject the impression of and experience with future AD. All scenarios contain potentially safety critical situations, which may influence participants’ subjective perceived safety and therefore affect trust in automated driving systems. Even though participants do not get harmed in the simulated situations, they can neither predict the system’s behaviour nor the final outcome. The simulated safety critical scenarios represent situations that may happen in real world driving with an estimated impact on trust and an influence on participants’ subjective ratings. Each scenario is followed by an SSQT, supported by a reminding video of the action to be evaluated. The scenarios are scheduled automatically from the test automation service once the SSQT is completed. The ten scenarios are divided into the following 4 clusters (scenarios with similar use case [
56]), which are also shown in
Figure 4.
Simulated safety critical situations:
- C1
Take-over manoeuvres with function decrease (2 scenarios);
- C2
Emergency brake with bad weather conditions (2 scenarios);
- C3
Narrow road with a child crossing (3 scenarios);
- C4
Highway with construction site ahead (3 scenarios).
Each scenario is conducted in high driving automation mode (SAE level 4—no need for driver intervention, but still possible) [
1], see also
Figure 1, while the participants were tasked with observing the vehicle behaviour and the environment and providing their subjective feedback. The scenario clusters are designed in the same environment [
56]. Their AD parameters differ so that two driving modes are available: sporty or comfortable. Compared to the comfortable configuration, the sporty configuration allows a shorter time to collision and higher de-/acceleration rates as well as smaller distances to follow or to stop. Beyond the description of the scenarios, they are published for all details in [
57].
Cluster one describes a constant drive with 100 km/h approaching a vehicle with 70 km/h on a straight one-way two-lane road in an urban area. The driver is informed about the high driving automation mode in the HMI. As all parameters like speed difference, other traffic and range of vision for an automated take-over are met, the vehicle controller performs an automated take-over of the other vehicle. After the take-over, the ego vehicle automatically changes back to the initial lane and continues to drive with 100 km/h. Next, it is passed by another vehicle which splashes dirt on the ego vehicle’s sensor setup. The driver gets informed about a decrease in take-over functionality. The next vehicle approached by the ego vehicle is driving with 70 km/h. As the sensor setup is not recovered yet, no automated take-over can be performed and the vehicle follows the slower vehicle in the lane in front of the ego vehicle. After a predefined time (10 s) of sensor cleaning, the take-over functionality is available again and displayed to the driver. As all mandatory conditions are met, another automated take-over is performed in the same manner as the first one. After changing back to the initial lane, the drive continues with 100 km/h and the scenario ends. This scenario is performed twice, once with each controller configuration.
Cluster two is described by the ego vehicle starting off and following another vehicle driving with 50 km/h in high driving automation mode on a straight two-way road. The speed remains constant and appropriate to the road conditions. After a defined time of 40 seconds following the vehicle ahead, the weather conditions deteriorate, as the appearing fog limits visibility. Due to the reduced visibility of the sensors, the vehicle’s speed is automatically reduced by the automated driving controller to 30 km/h and the driver is informed about the issue via the HMI. The vehicle in front drives faster and disappears in the fog. As the drive continues, the vehicle ahead suddenly appears in the fog and seems to be stopping behind a truck that has already stopped in the fog. The automated driving system handles the emergency brake situation and automatically stops behind the vehicle in a suitable distance. Due to a higher speed, the sporty controller setting creates a more critical situation and a shorter stopping distance. No accident occurs. This scenario is performed twice, once with each controller configuration.
The three scenarios of cluster three are characterised by a high driving automation low speed drive in an urban residential area with parked vehicles. The road is straight. The ego vehicle approaches a narrow lane with vehicles parked on both sides of the one-way road with 30 km/h. The ego vehicle automatically changes lanes to the free middle lane and the speed is reduced further to 15 km/h due to reduced sensor range between the parked vehicles. After some driving time between the parked vehicles, suddenly a child appears between two parked vehicles on the right and crosses the road just ahead of the ego vehicle. The automated driving controller reacts to the situation and nearly stops <5 km/h the ego vehicle in front of the child. After the situation is cleared and the child leaves the scene, the controller automatically continues driving. This scenario is performed three times and the stopping distance and the deceleration values differ between the scenarios depending on controller configurations (1 & 3 comfortable and 2 sporty).
Cluster four implements three evolving scenarios. The consecutive scenario always extends the previous one by adding lousy weather in the second repetition and a delivery van cutting into the driving line in the third repetition, while the controller for the high driving automation is always set on comfortable mode. All scenarios are driven in high driving automation mode. The basic/first scenario is defined by driving on a three-lane motorway on the first lane with 100 km/h, which is then closed due to a construction site ahead with a speed limitation of 80 km/h. The automated driving controller automatically changes from the first to the second lane as all conditions for an automated lane change are met. The speed is reduced as required by the traffic signs and the construction site is passed successfully. After the construction site the speed is increased back to 100 km/h and the scenario ends. In the second scenario, the first scenario is repeated under poor weather conditions and reduces the visibility. The rest of the scenario remains unchanged, while in the third scenario, the weather conditions from the second scenario remain the same and an additional critical situation is provoked by a delivery van leaving the construction site right in front of the ego vehicle. The automated driving controller performs an emergency brake and reduces the speed from 80 km/h to 18 km/h to avoid a collision. The distance to the delivery van is reduced down to 2 m and creates a critical situation at higher speeds. The delivery van accelerates slowly as is typical for the vehicle type. After the construction site, the delivery van changes to the first lane. The ego vehicle lane is cleared and the automated driving controller accelerates to the initial speed of 100 km/h and the scenario ends.
3. Results
The results focus on the participants’ subjective ratings on the questionnaires, measuring system usability, trust and workload. The results are divided into subchapters for each questionnaire. The subjective ratings are analysed using multifactorial analysis of variance (MANOVA) with repeated measurements with a significance level of
of the null-hypothesis. The
p-value index indicates the specific analysis. So
stands for the interaction of the relevant groups and the factor time,
for the factor time, and
for the group factors. Moreover, Pearson correlations were calculated to examine the correlations between the different factors. The method used to process the gathered results is already made available in Clement et al. [
44].
3.1. Expression of Trust
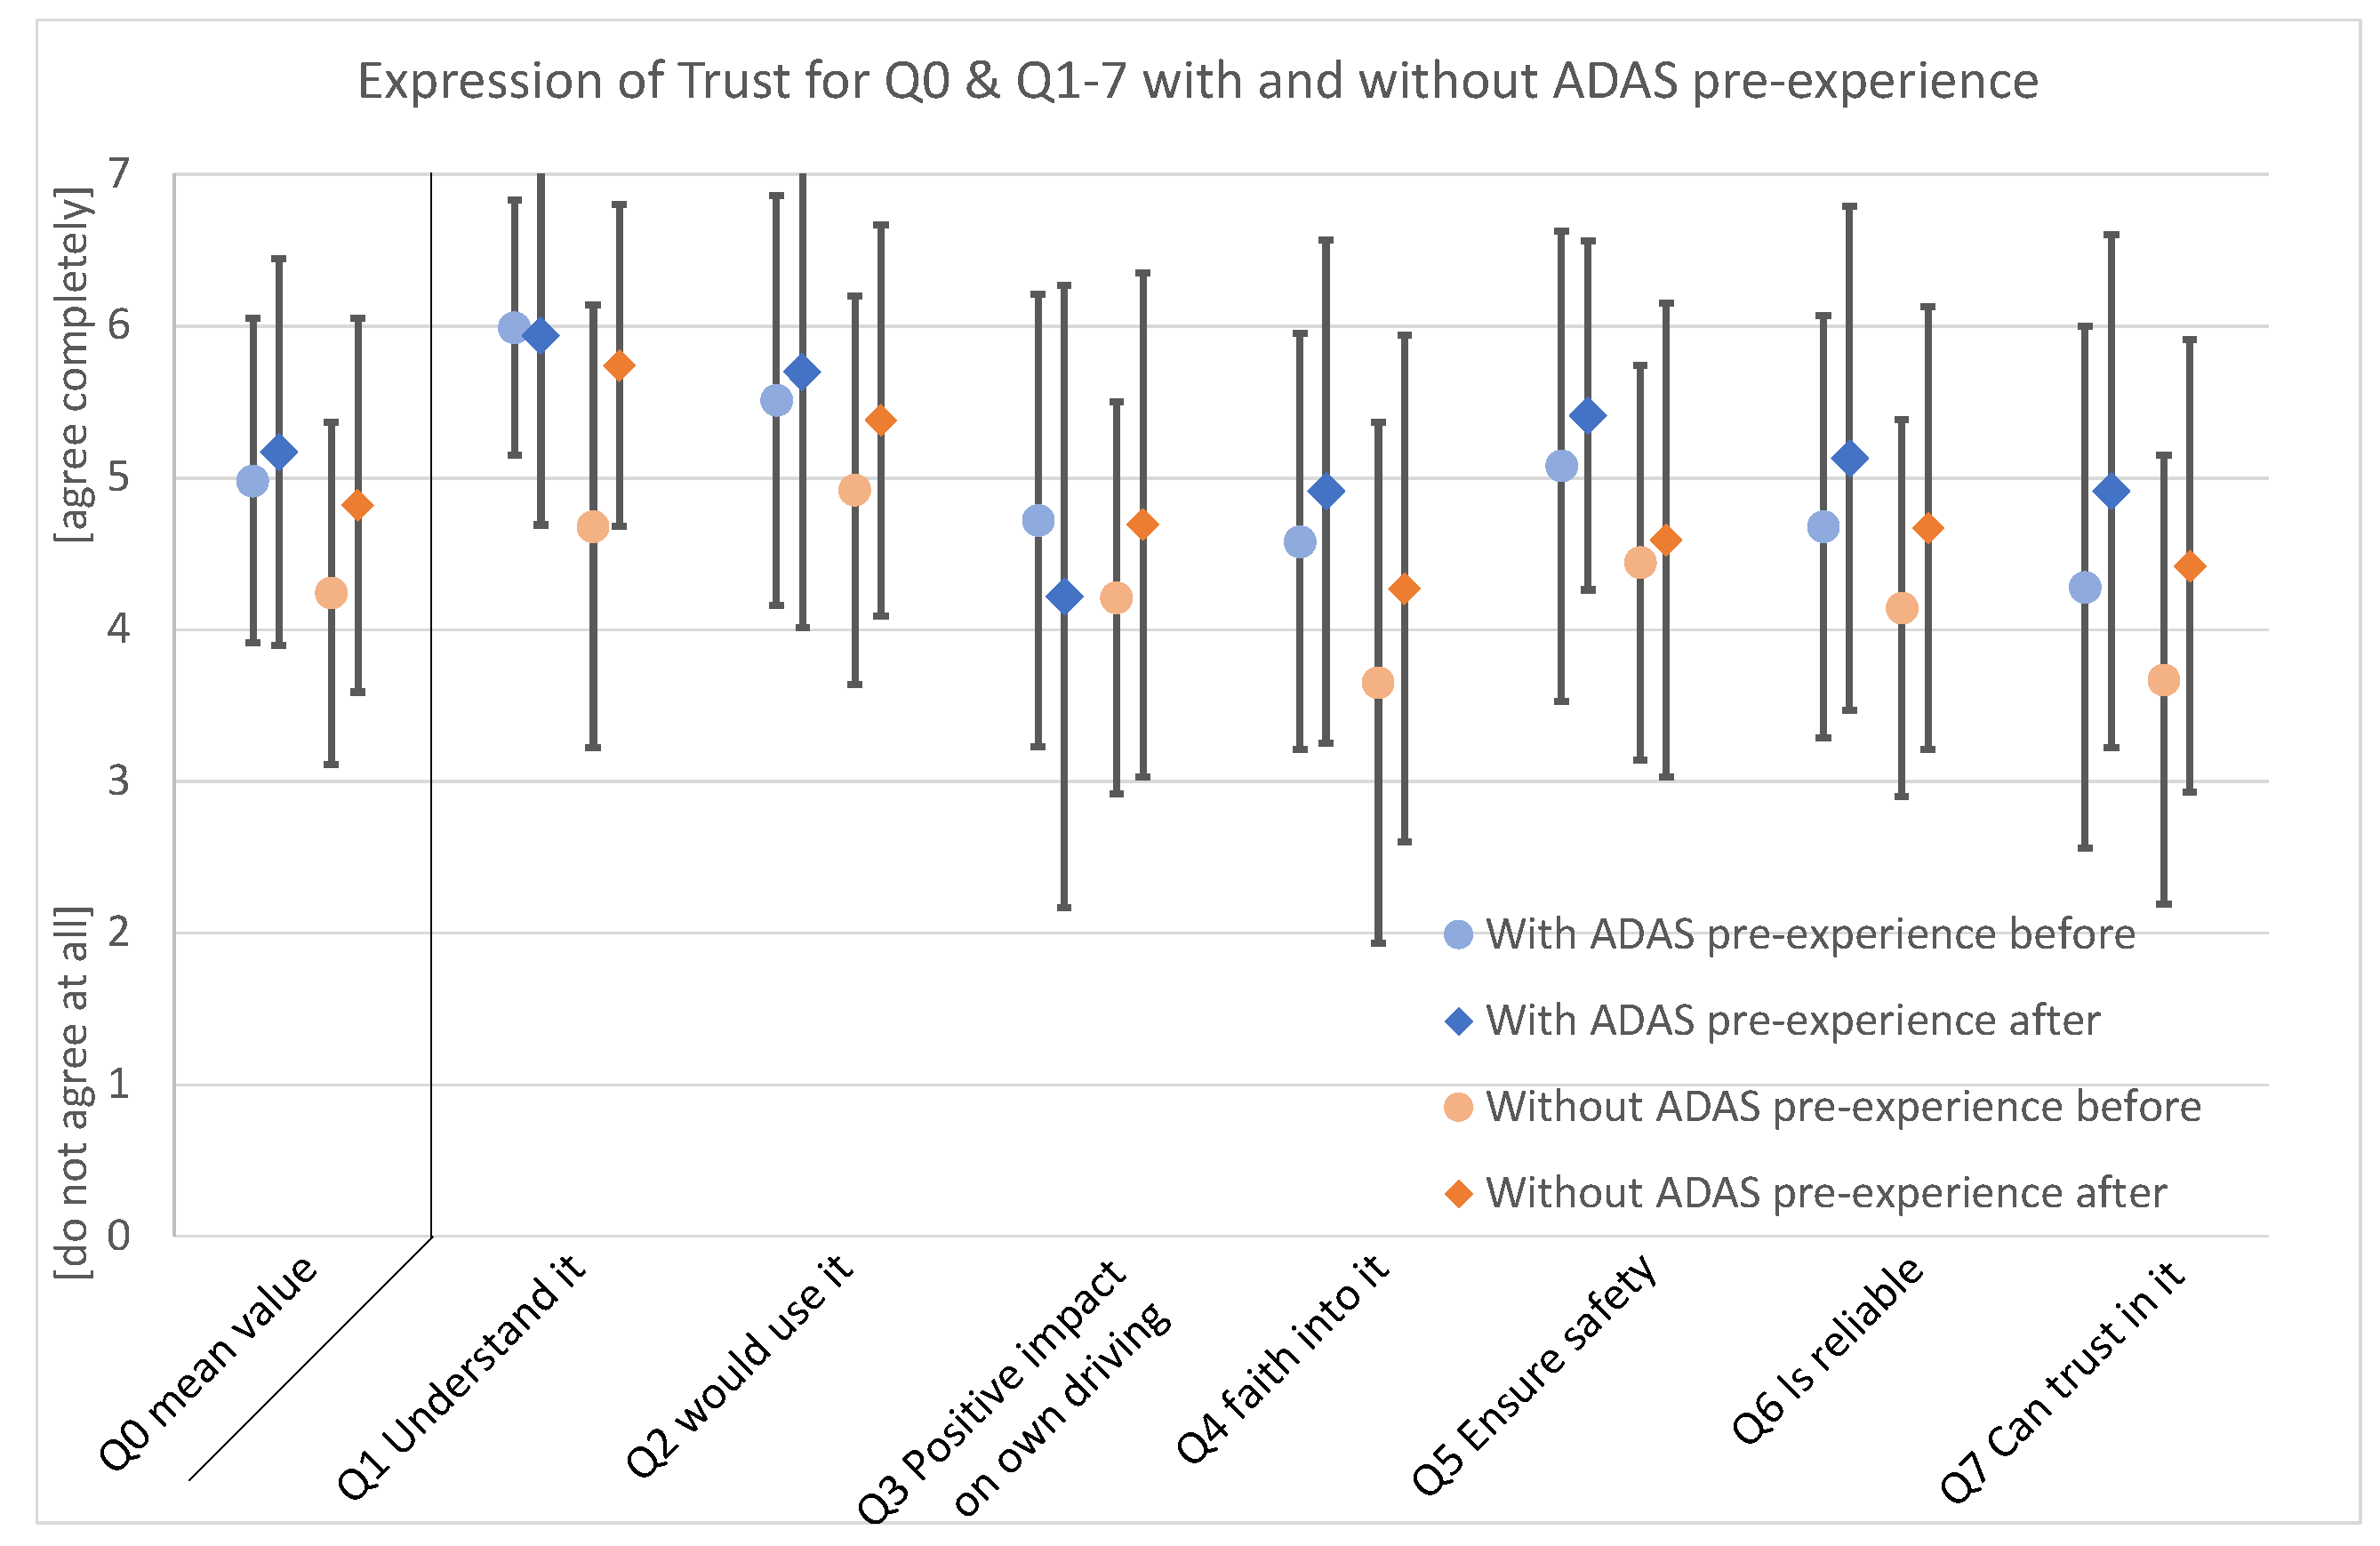
The evaluation of the expression of trust uses the mean value (Q0) to analyse the participants’ trust within the sample throughout the experiment.
A tendency towards a significant interaction can be seen in combination with ADAS pre-experience (
F = 2.308,
pint = 0.136,
2 = 0.048). The group with ADAS pre-experience shows a lower increase in the overall response than the group without ADAS pre-experience. This can be seen in
Figure 5 on the very left side at the Q0 values. The ADAS pre-experience group’s results show that the ratings before and after the experiment are at a similar level but slightly increase for the post-test results. For the factor time, the rating changes highly significant from 4.58 to 4.98 point (
F = 10.160,
pt = 0.003,
2 = 0.181). For the factor ADAS pre-experience, a tendency towards a significant difference can be seen (
F = 2.940,
pt = 0.093,
2 = 0.060).
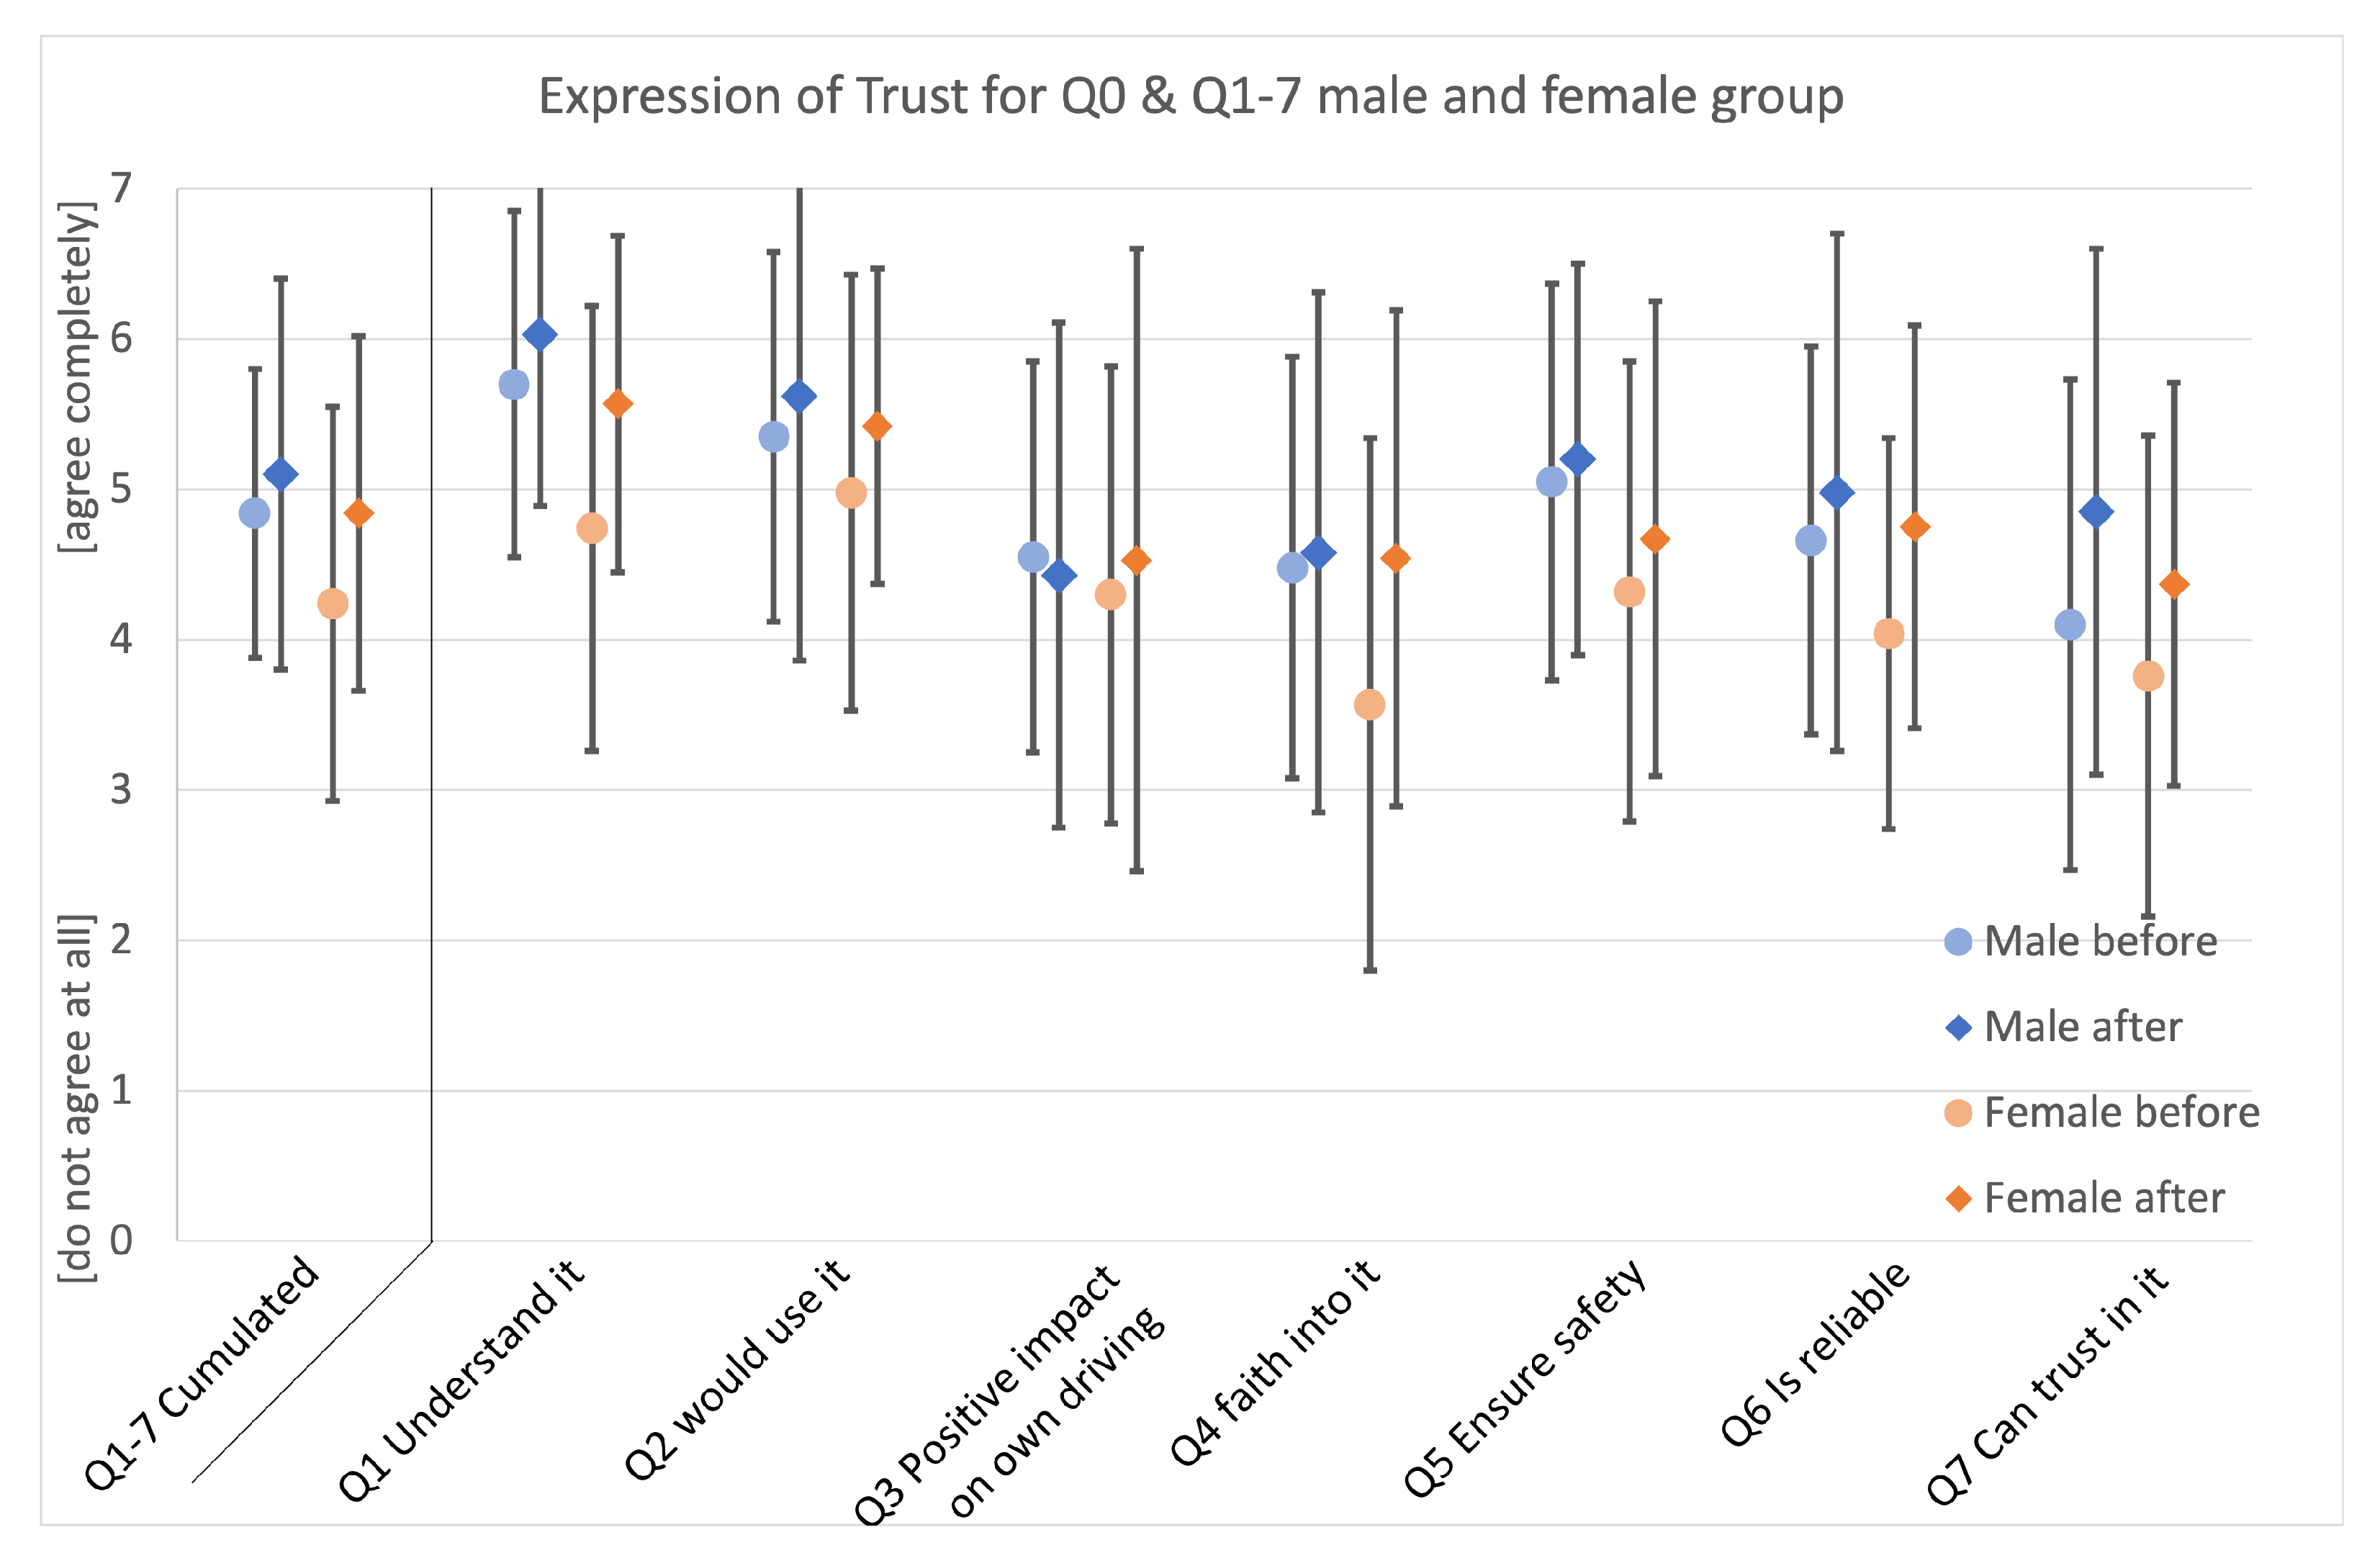
The mean values resulting from the Expression of Trust (EOT) questionnaire before and after the experiment are shown in
Figure 5, including their standard deviation. The results are split into two key groups, with and without ADAS pre-experience. The figure shows this for the mean value (Q0) and for the questions Q1 to Q7. The details are in
Table 1. The single questions show various noticeable and significant differences. In Q1 “I understand how the system works—its goals, actions and output”, the interaction (
F = 10.619,
pint = 0.002,
2 = 0.188) and the factor ADAS pre-experience itself (
F = 6.462,
pgr = 0.014,
2 = 0.123) show a significant difference. Further, in Q3, the interaction reveals a significant difference between the two groups of the factor (
F = 6.384,
pint = 0.015,
2 = 0.122), as indicated in the empirical analysis above. In Q5, the factor pre-experience itself reveals two nearly significant different levels of the answers (
F = 3.962,
pgr = 0.052,
2 = 0.079), also indicated by the different empirical levels of the group answers. Ratings of participants without ADAS pre-experience are higher for all answers in the post-test questionnaire compared to the pre-test questionnaire. The ratings provided by the participants with ADAS pre-experience are less consistent with a higher variance before and after the experiment.
The factor gender is illustrated in
Figure 6 regarding the mean value (Q0) and the single questions Q1 to Q7. Results show a tendency towards the same significant difference for time of measurement (before/after) for both groups, male and female. However, although they reflect the overall change of trust through the simulator session, they do not show a significant interaction regarding differences in Q0 (
F = 1.733,
pint = 0.195,
2 = 0.036). The global picture shows that the female group tended to rate the system lower than the male group before the experiment. After the experiment, the increase of the female group’s rating was higher than the one of the male group but still did not surpass the level of the male group.
In
Table 2, results for the analysis of variance for the expression of trust are given for the interaction between the factor time and the factor gender as well as the main effect for the factor gender. The main effect regarding the factor time is the same as mentioned in the analysis of ADAS pre-experience and not outlined separately. Significant differences can be seen for the interaction in Q4 (
F = 5.230,
pint = 0.026,
2 = 0.102) and for the factor gender in Q1 (
F = 5.510,
pgr = 0.023,
2 = 0.107).
Analysis for the remaining demographic subgroups on the mean value (Q0) show no significant differences for the factor age (F = 0.020, pgr = 0.980, 2 = 0.001) and for the interaction with the factor time (F = 0.183, pint = 0.834, 2 = 0.008). For the factor driving experience, the values show no significant differences (F = 1.075, pgr = 0.350, 2 = 0.046), same as for the interaction with the factor time (F = 1.045, pint = 0.360, 2 = 0.044).
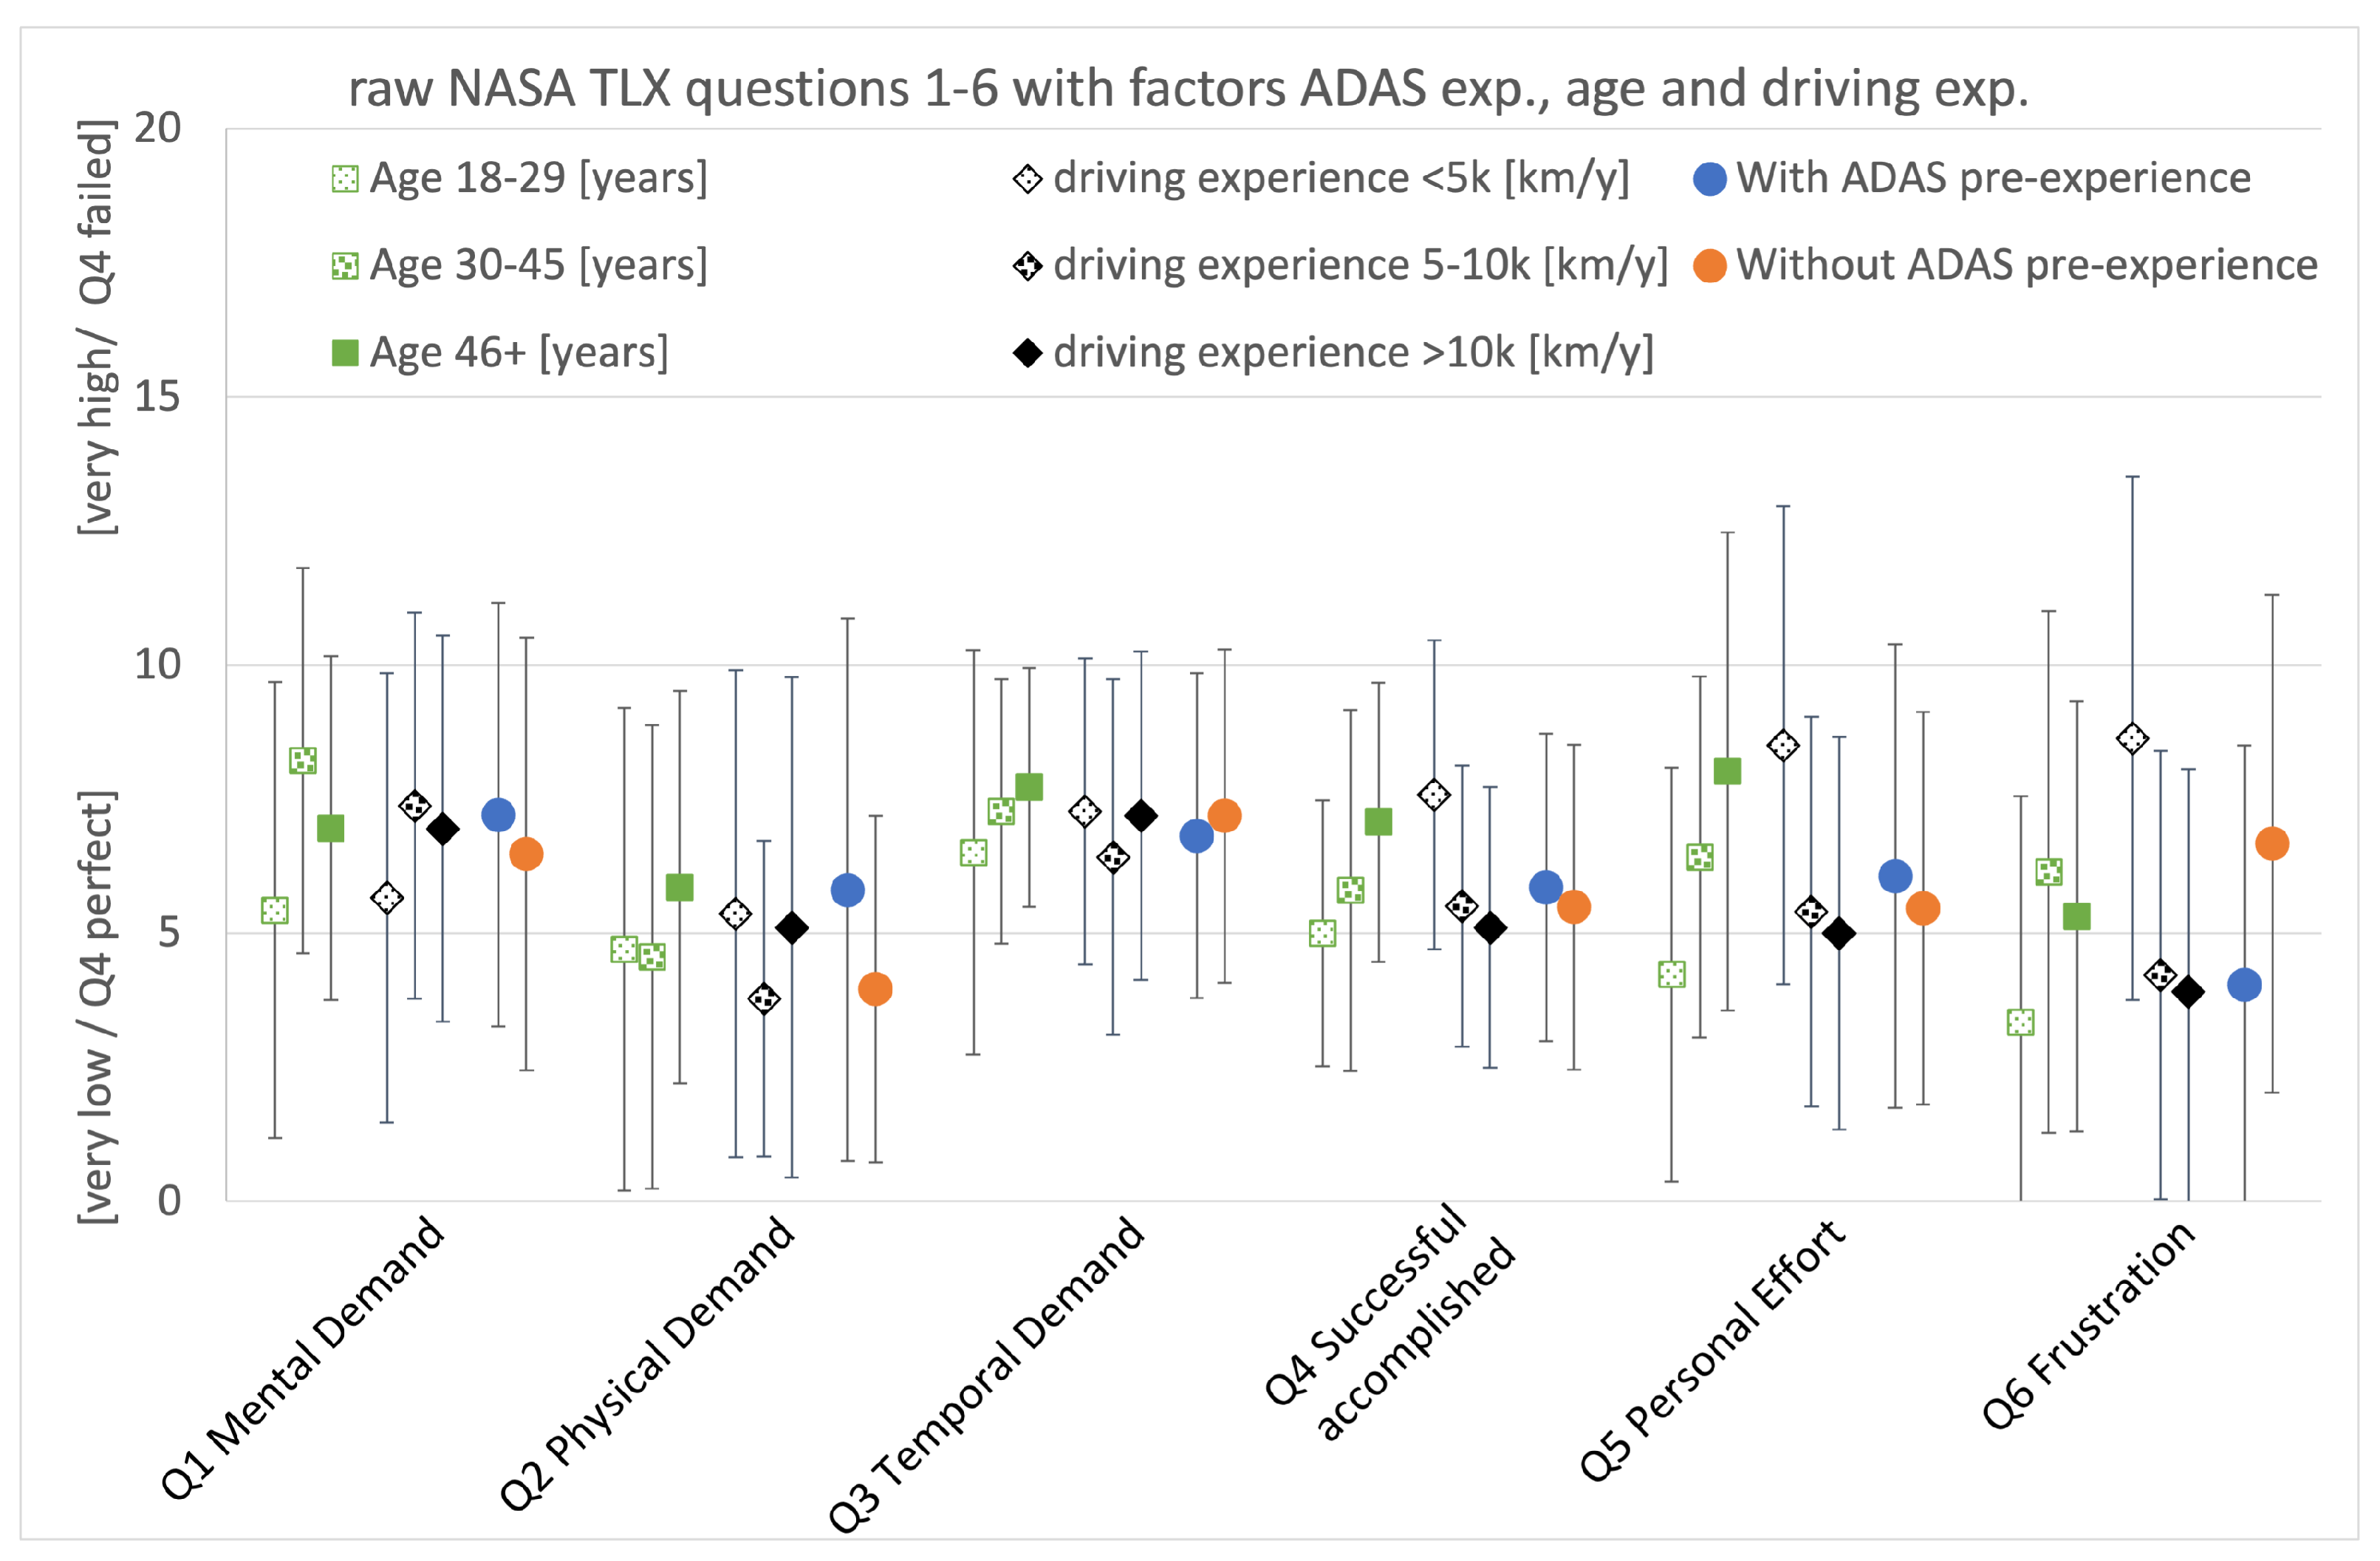
3.2. NASA TLX
The NASA TLX was performed as a raw test without the weighting of the questions in pairs. The evaluation of the questionnaire reveals that the factor age group (
F = 3.481,
pgr = 0.039) had a significant influence on participants’ ratings of Q5. The group of elderly participants and those with fewer kilometers per year report more effort to accomplish their performance. Moreover, the factor driving experience (
F = 4.278,
pgr = 0.019) had a significant influence on participants’ ratings of Q6. These factors as well as the factor ADAS are depicted in
Figure 7. There were no significant interactions reported in the two-way analysis of variance as shown in
Table 3. The differences are noteworthy for Q5. For the group with less than 5000 km/year, a descriptive analysis shows lower success for the questions Q4, Q5, and Q6.
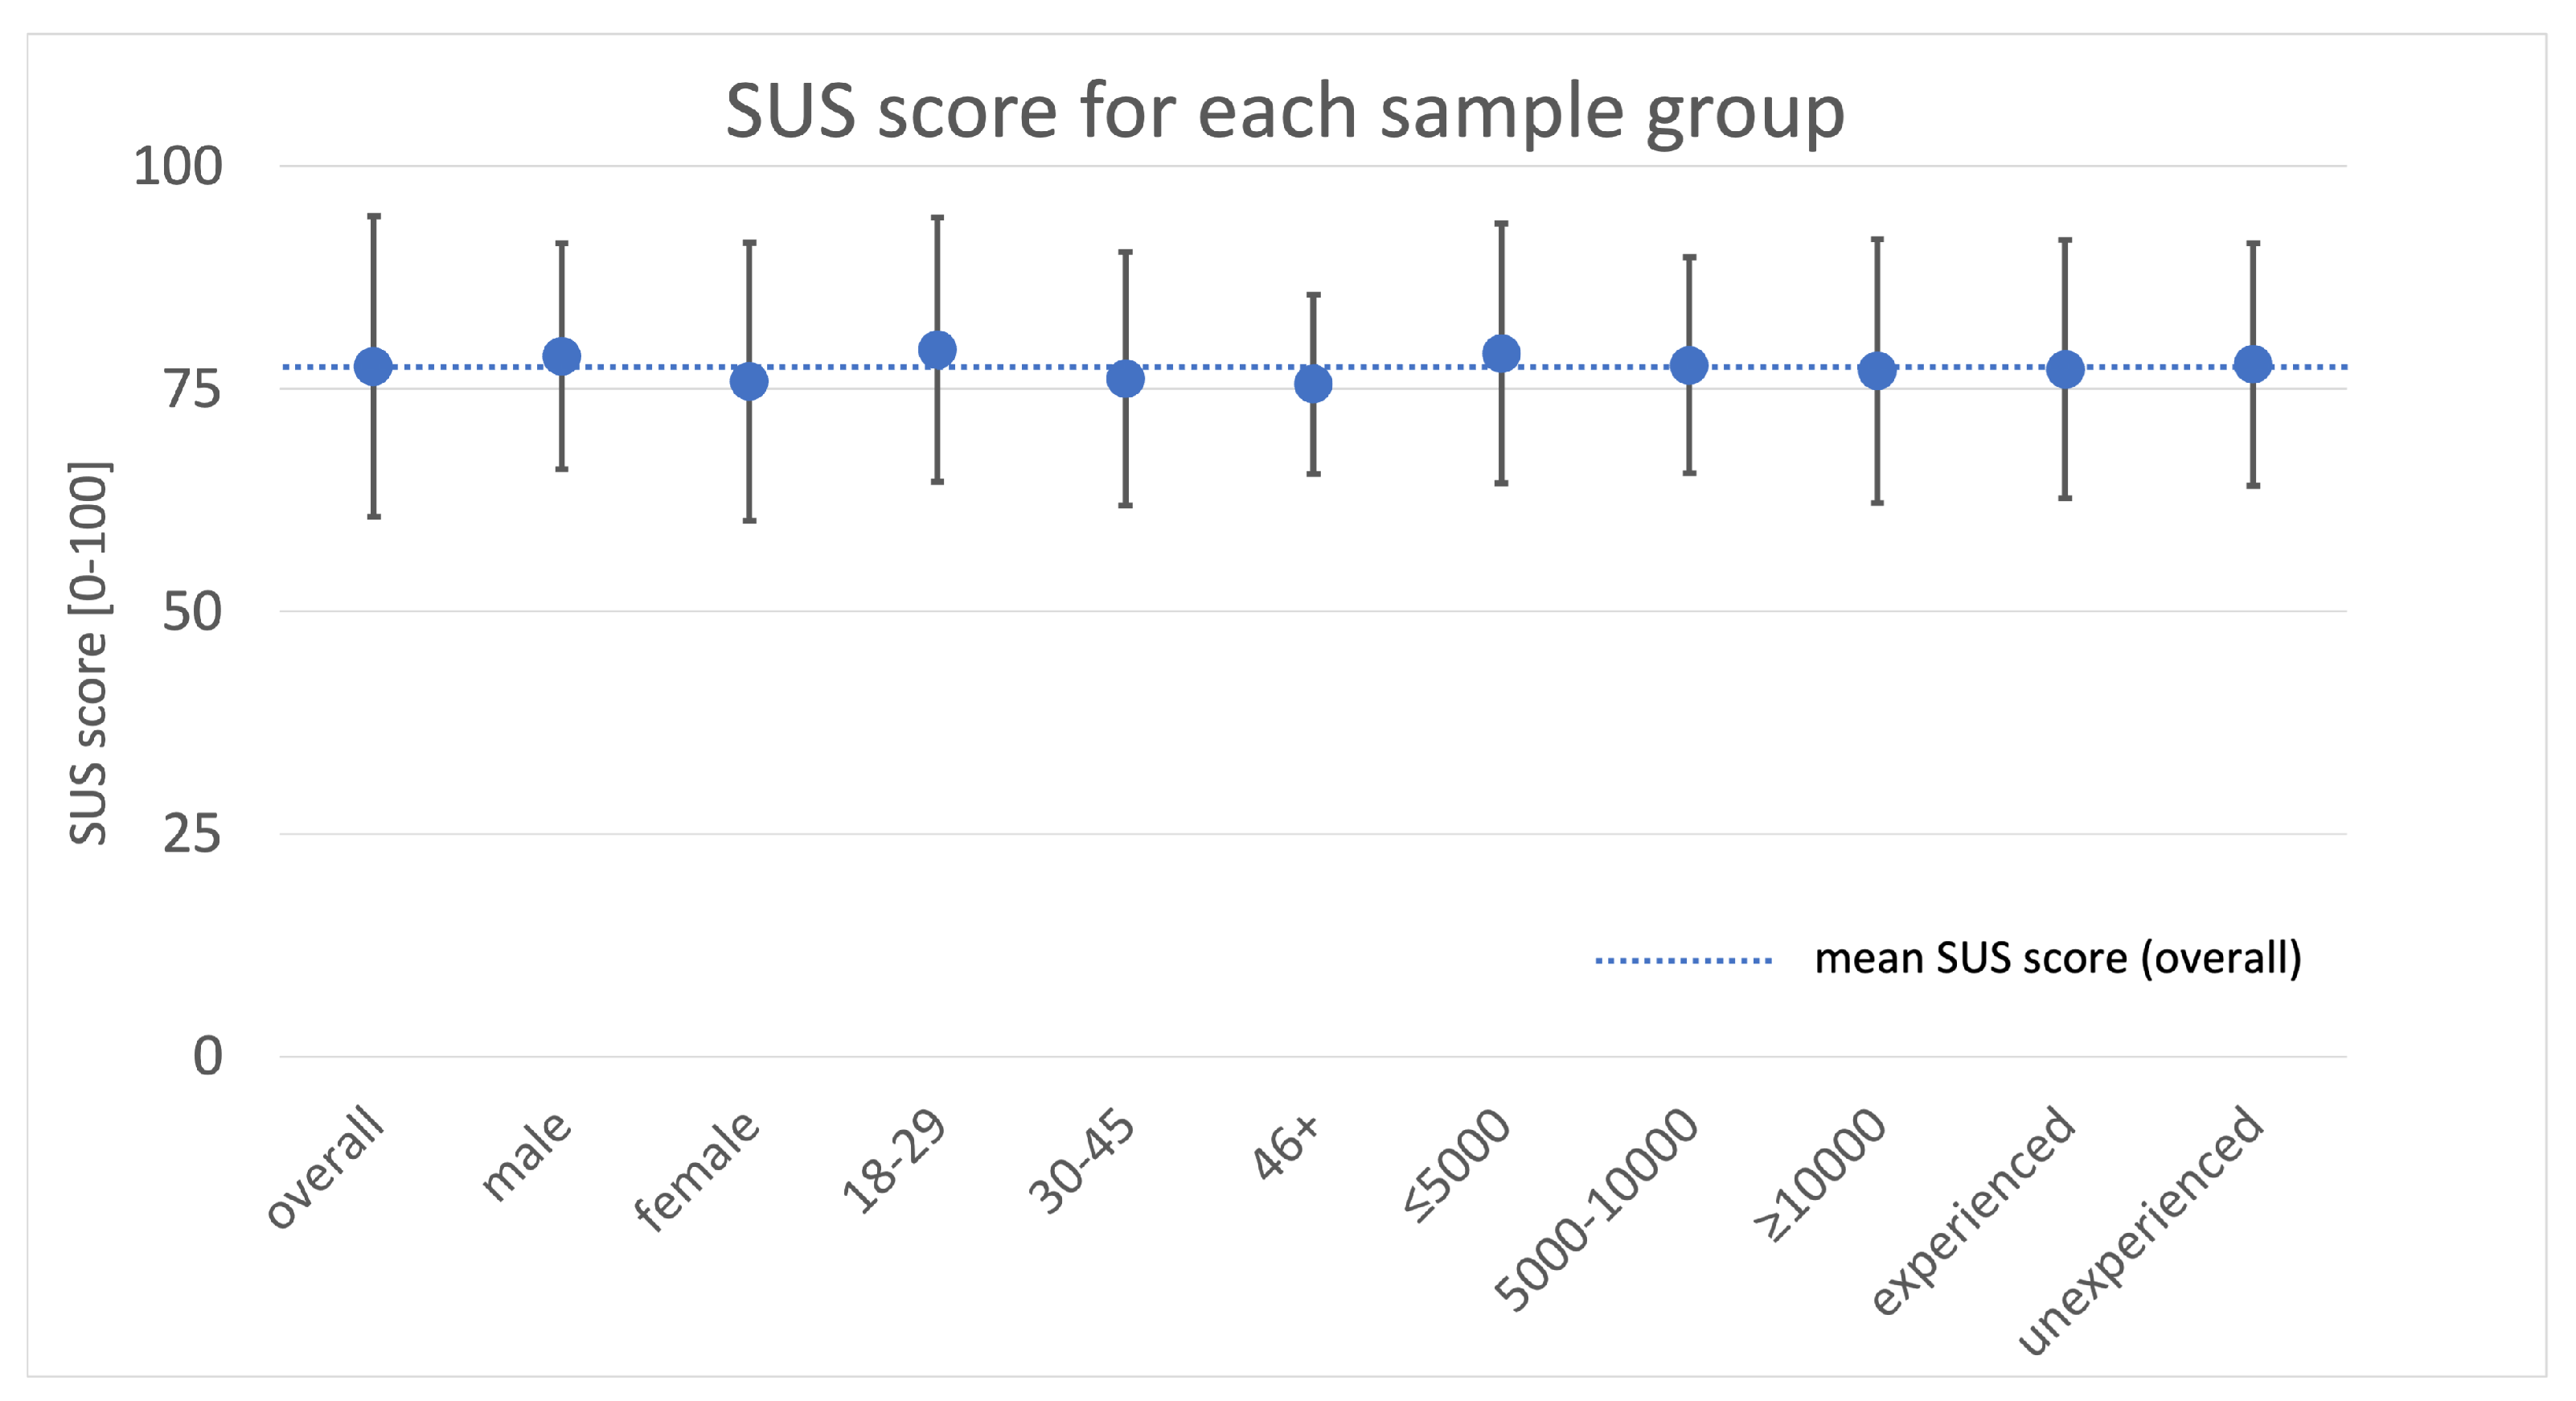
3.3. System Usability Scale
The system usability evaluated for each demographic sample group shows results around the overall value of 77.49 out of 100. The value is generated from the sum of all single questions for each subject multiplied by 2.5 to correspond to the target maximum scale of 100 according to Rauer [
49].
Figure 8 shows the results for each demographic subgroup within the participants. The groups are all in a similar range and distribution.
A two-way analysis of variance revealed only one significant interaction of the age group with the driving experience (
F = 4.347,
pgr = 0.005). This may be explained by a small number of participants in the age group of 46+ years, which results in a biased
p-value sensitive to a distribution based on small sample size, even though according to Bangor et al. [
46], the system used reflects an overall score in the 3rd quartile, which is acceptable and in terms of rating between good and excellent for the whole sample.
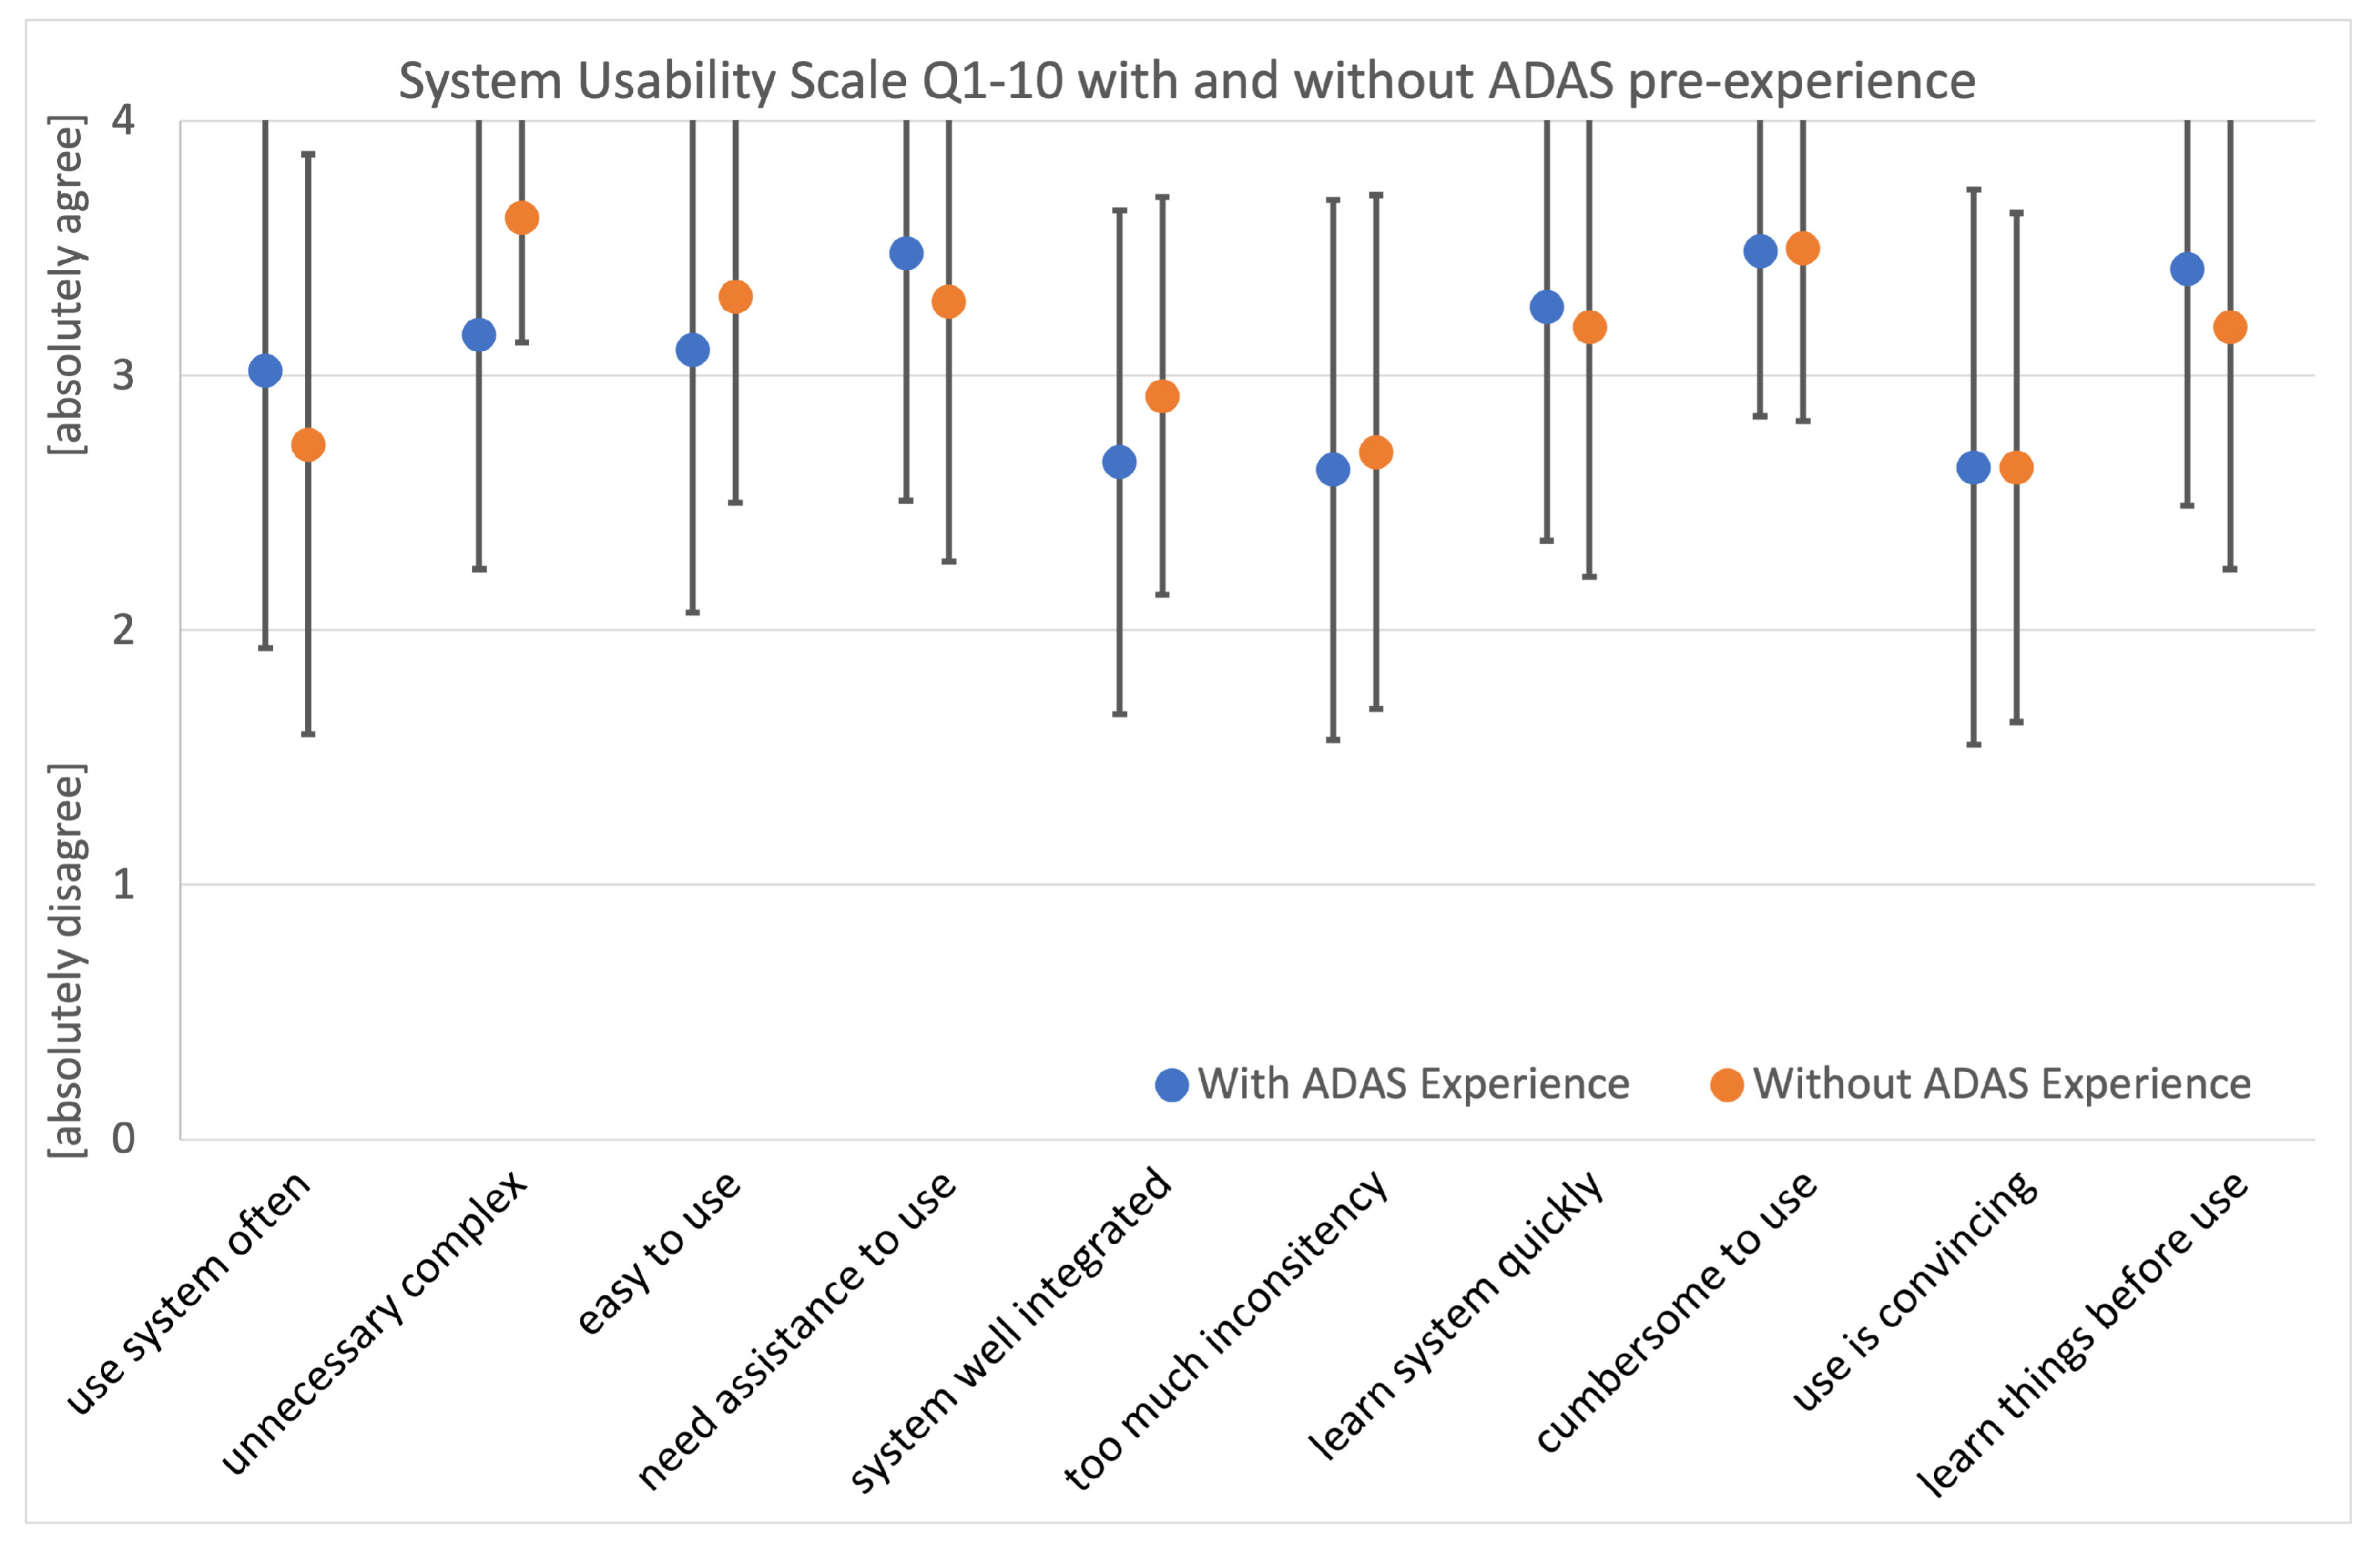
The results for single questions are shown in
Figure 9. Since the questions are positively and negatively polarised, the negative ones were inverted prior to the analysis. Results suggest an easy-to-use and quickly adjustable system with no unnecessary complexities. Its usage is not cumbersome and it demands no assistance to be used. The results also reveal that the system has some inconsistency (2.67 out of 4) and is not fully convincing (2.64 out of 4) to the overall sample, but still far better than the 50% quantile.
3.4. Correlations between Workload, Trust and Usability
To identify the correlation between the participants’ ratings, Pearson correlations between all questionnaires and single items were calculated. In
Table 4, an overview of the major calculations is given using the mean values (Q0) for the SUS and the EOT, as they have higher reliability due to being built on the sub-questions of the related questionnaires and therefore get more information into the variance. The values show the correlation
r and their significance.
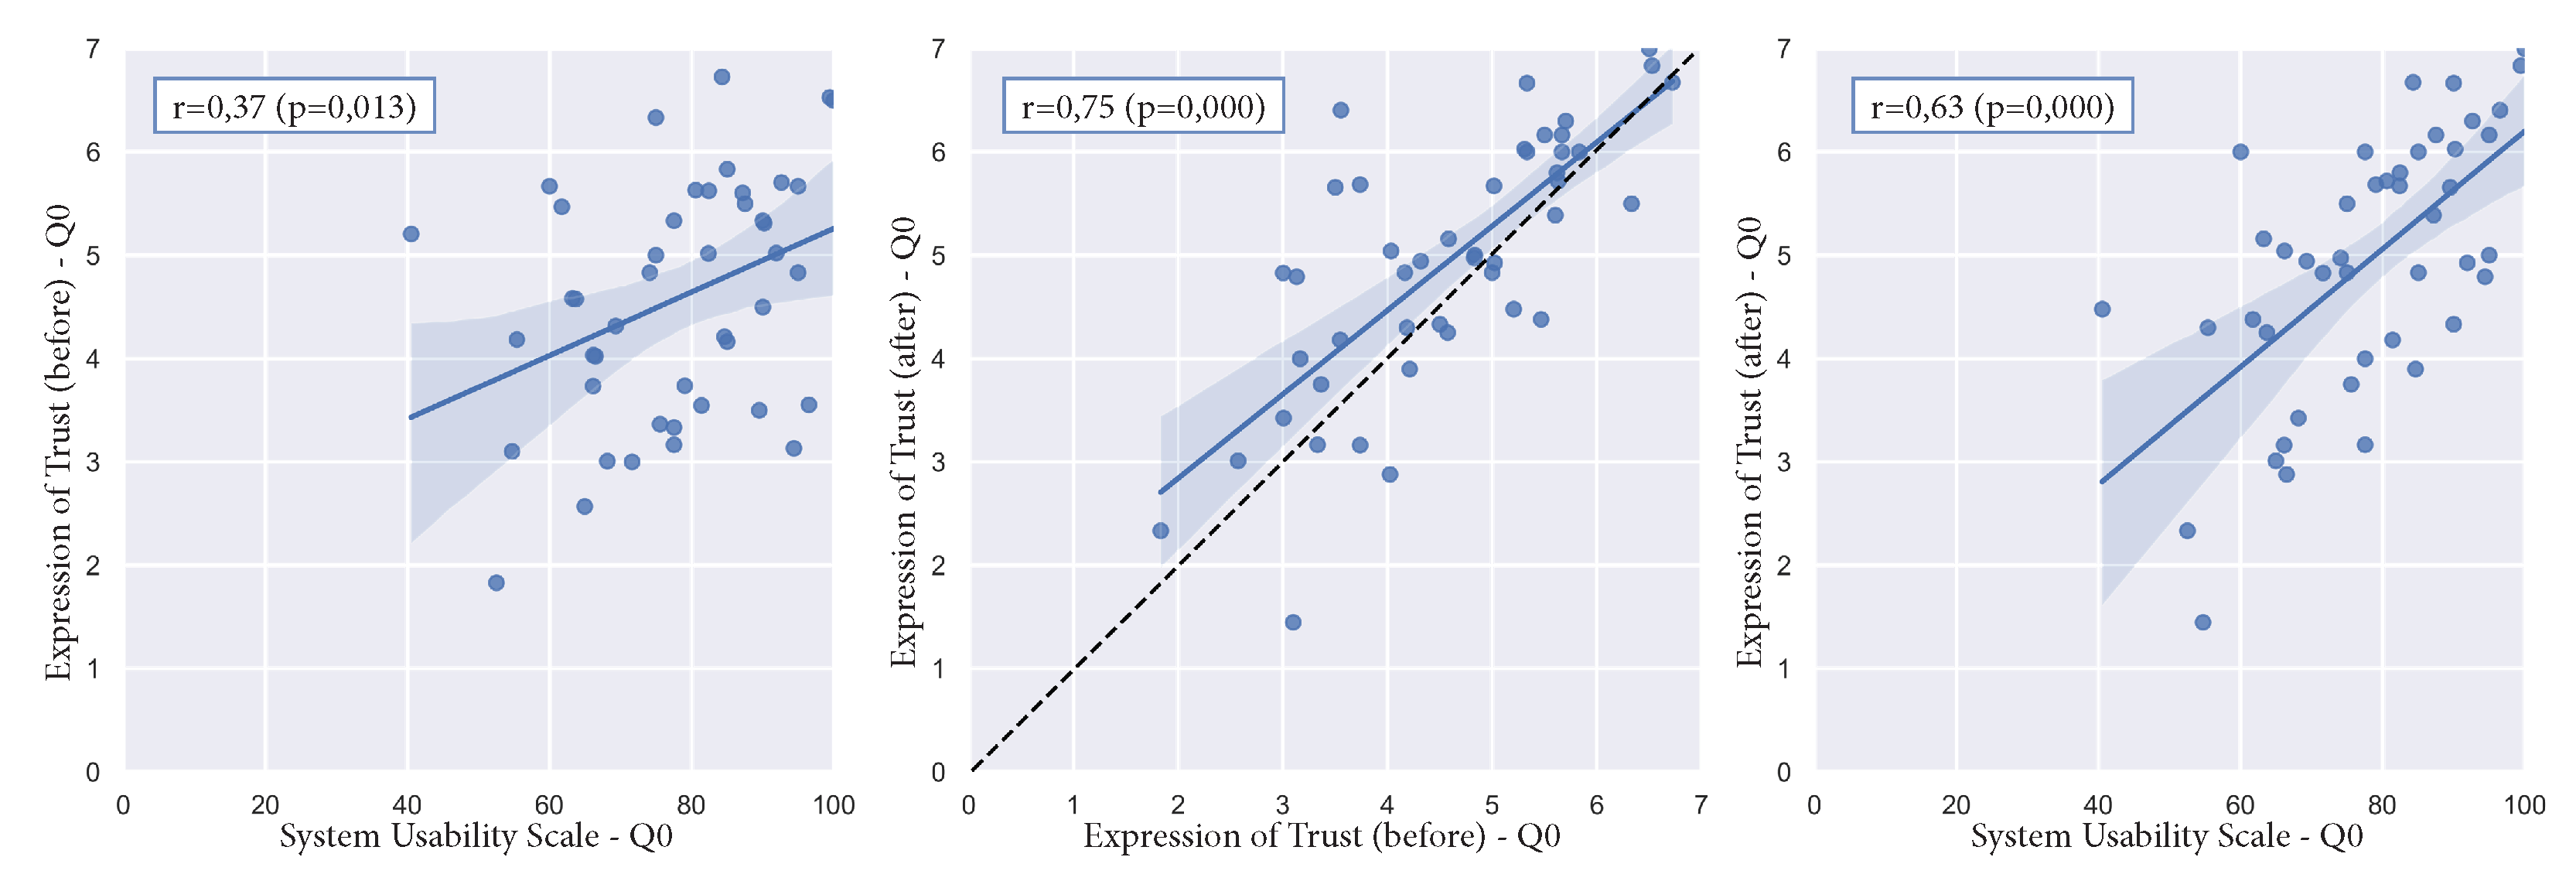
The results reveal the following significant findings. SUS (Q0) and EOT before (Q0) were found to be highly significant and moderately positively correlated (
r = 0.37,
p = 0.01). SUS (Q0) and EOT after (Q0) were found to be highly significant and highly positively correlated (
r = 0.63,
p = 0.00). EOT before (Q0) and EOT after (Q0) were found to be highly significant and highly positively correlated (
r = 0.75,
p = 0.00). Scatter plots of these correlations can be found in
Figure 10. These positive correlations imply that participants who rated the system usability low also rated the expression of trust (before and after) lower, and those who rated the system usability higher also have a higher expression of trust. The correlation between SUS and EOT after is higher than SUS and EOT before. Moreover, significant correlations between several NASA TLX single items and the SUS (Q0), the EOT (Q0) before, and the EOT (Q0) after were found as illustrated in
Table 4.
Results that reveal significant correlations between NASA TLX and SUS as well as NASA TLX and EOT after, they are consistently negatively correlated. This means the higher participants rate the workload, the lower they rate the usability and trust. These results reflect a high internal validity of the experiment. Furthermore, these correlations suggest a high validity of the applied questionnaires, as results point to a consistent and contextual evaluation within the measurement tools.
To check for spurious correlations and improve understanding of the correlations, especially regarding correlations’ linearity and data outliers, the correlations are visually analysed using a scatter plot and the correlation line. The major correlations are depicted in
Figure 10. The scatter plots do not show a tendency for a non-linearity and are well scattered around the correlation line. A visual comparison of the expression of trust (Q0) before and after the experiment reveals a general increase of trust as there are more data points above the 45° dotted line. A point on the dotted line would mean an equal rating in Q0 before and after the experiment and indicates no change throughout the experiment. A data-point below the dotted line indicates a decrease of trust, and a data-point above it means an increase of trust. This approach supports the findings of the analysis of variance reported in
Section 3.1. Apart from the inter-questionnaire correlations, the highest correlation and significance levels relate to the system usability scale with questions SUS Q1 (would use the system frequently) and SUS Q9 (found the system to be convincing) in correlation to the post-testing measurement of the expression of trust with questions Q2, Q4, Q6, and Q7.
4. Discussion
We quantified the increase of trust in the “AD system under test” by exposing participants to a driving simulator and evaluating their subjective perception before and after that experiment session. As expressed by the mean value (Q0) of the Expression of Trust questionnaire, the increase of trust was significant for all groups between the two points of measurement. This study shows an appropriate way to increase and evaluate trust in a simulator study.
Participants with ADAS pre-experience entered the study with higher confidence in such systems compared to the group without ADAS pre-experience, as depicted in
Figure 5. Despite the high starting confidence level, the simulator session increases their trust in the AD system, indicating a high level of validity between the driving simulation and the real-world experience. There is a significant increase in trust for both groups. The group without ADAS pre-experience shows a much higher growth than the already pre-experienced. Besides the single questions Q1 and Q3 of the EOT, no significant difference can be seen between the groups. Q1 hints that the pre-experienced group could not gain further understanding, whereas the inexperienced group could significantly increase their knowledge of such a system. We found that pre-experienced participants might see a negative impact on their driving style the more they learn about the possibilities of automated driving systems and their driving behaviour in safety-critical situations, as a decrease in the Q3 was found. In contrast, the group without ADAS pre-experience sees a positive impact on their driving style, as they express a willingness to use the system in the future.
The analysis of demographic differences and similarities between genders shows the same tendency towards gaining trust (Q0) in the system through the simulator experience. The subgroups express a similar behaviour, besides Q1, with only one significant difference in the interaction of the groups and the time of measurement, which reflects the faith in the system shown in
Figure 6. Female participants are more sceptical about their faith in the system before the simulator session compared to the male group. The simulator session affected their attitude towards the applied automated driving systems, i.e., their trust increased, reaching a similar level as the male participants. This effect can also be observed as a tendency in all other questions, even though there is no significant difference. This trend can also be seen within a descriptive analysis. It may reflect that the female group was more sceptical before the experiment but reached a level similar to one of the male participants after the experiment.
The NASA TLX analysis reveals an overall expected low workload of the participants. As the questionnaire is provided after the complete test sequence, it reflects the workload of the entire simulator session and does not differentiate between the single scenarios. There are significant negative correlations between the NASA TLX and both the system usability scale and the expression of trust. Since both questionnaires measure similar aspects with different purposes, the effect can be assumed as valid. The negative correlations between the trust in the system and the workload throughout the simulator session are significant, meaning that a higher workload correlates with less trust within the participants. The participants’ ratings were below the 50% line for the overall workload evaluation, which suggests a low workload within the simulator session. This was expected, as full AD minimised the physical and mental demands. Nevertheless, some subgroups showed more strain within the experiment. As shown in
Figure 7, the groups of higher ages and lower yearly mileage had a lower success rate, a higher personal effort and a higher frustration after the simulator session. Hence, there are only tendentially significant differences between the groups.
The participants’ ratings within the System Usability Scale (SUS) show a usability that can be seen as good to excellent. As already discussed in Bangor et al. [
46] and Brooke [
48], this method is suitable for evaluating the overall system usability. We hypothesise that the participant knowledge of the early developmental state of the system may have influenced their evaluations. With a mean of around 77.5 points out of 100, the response indicates a very good system although it also implies that following a normal distribution, around 50% of the participants rated the system lower than that and therefore only good instead of very good. The assessment of the mean and standard deviation of all demographic subgroups reveals that they are all on a similar level regarding their usability evaluation. This points to a neutral, not too complicated and realistic experimental design, which may be seen as an essential prerequisite for reliable results.
Regarding the Pearson correlation with the combination of both the pre- and post-questionnaires for the expression of trust, one can derive that smaller trust in the initial level results in a higher increase of trust after the simulator session. This is expressed in the middle of
Figure 10 by the fitted line being above the 45° line on the left side while touching the 45° line at the top end, which may also reflect a ceiling effect as the scale is limited to 0–7 and may not be extended in the post-session questionnaire. An increase from a higher level may not be measured that accurately. A comparison of the pre- and post-correlations with the system usability shows a more homogeneous rating in the post-evaluation. The correlation with the pre-questionnaire is smaller (
r = 0.37,
p = 0.013) reflecting that the system’s behaviour is unknown prior to the simulator session. Nevertheless, the lower part of the system usability scale shows a slight decrease in the expression of trust. In contrast, the upper part did increase noticeable in a clockwise turn of the fitted line in the left and right part of
Figure 10.
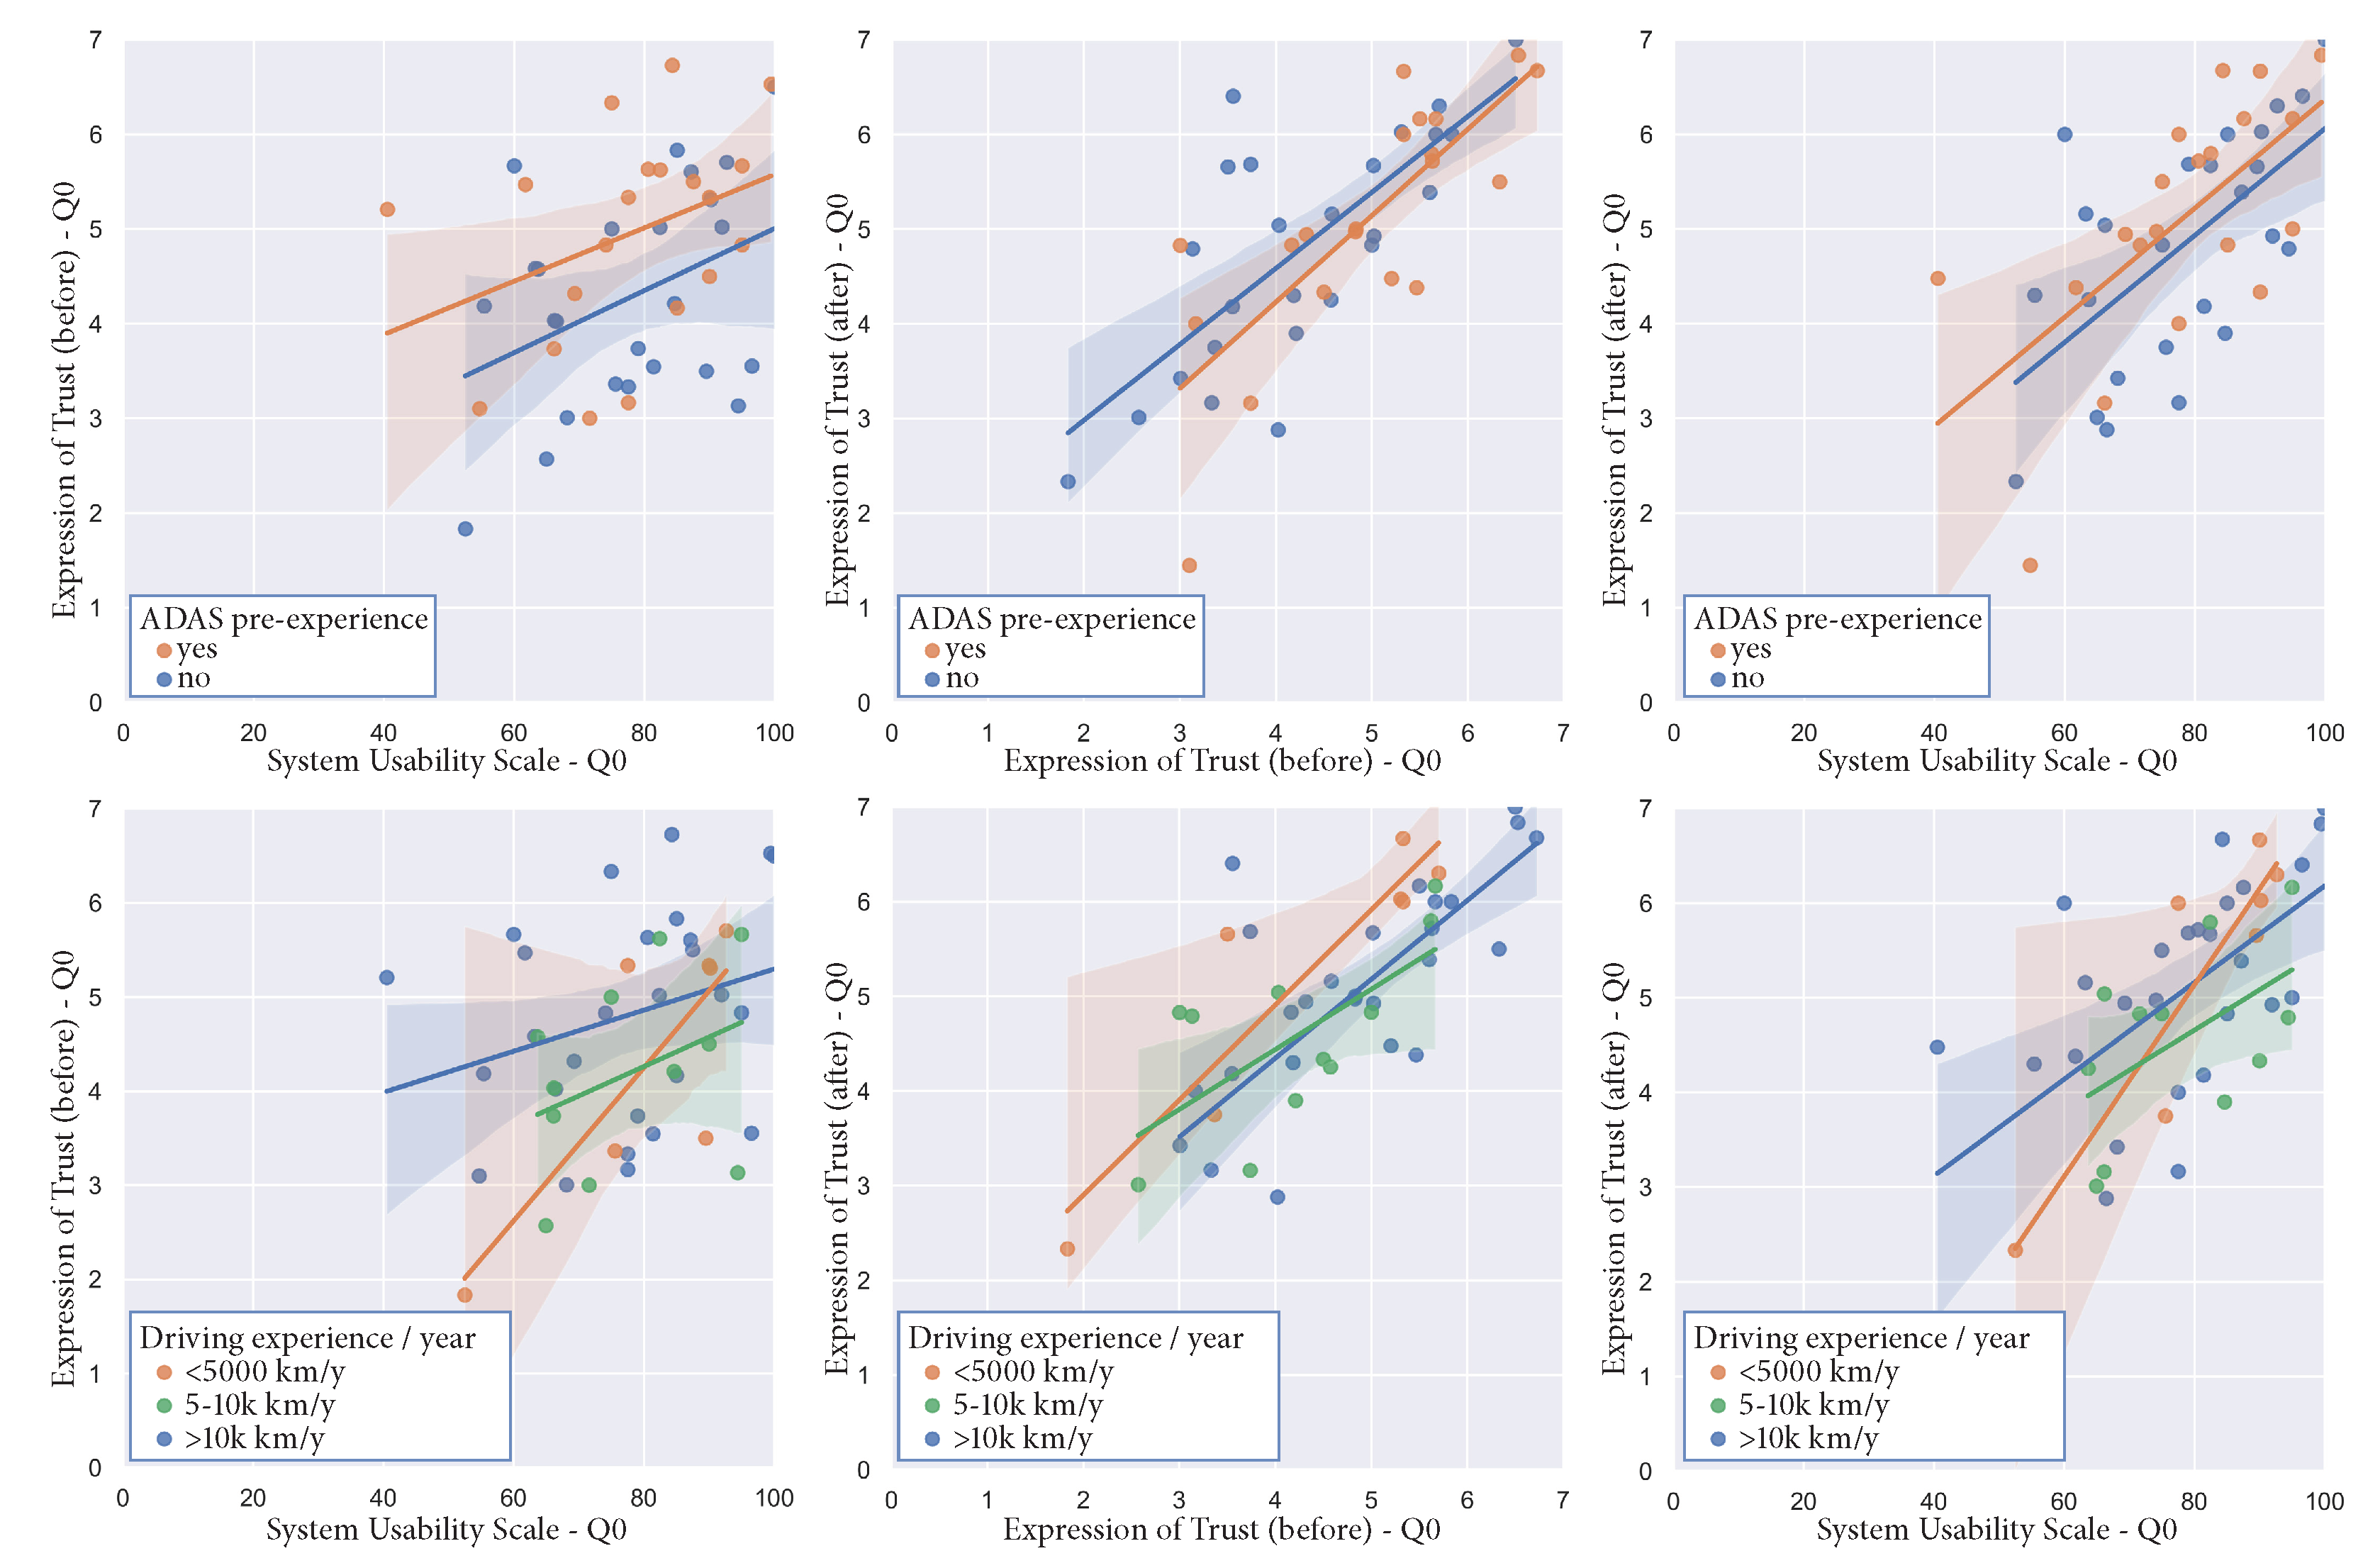
Both correlations suggest different clusters, one below and one above the fitted line of
Figure 10. An analysis of the correlations with a separation into the different demographic groups reveals noticeable findings which can be seen in
Figure 11. It shows that the group without ADAS pre-experience seems to be located closer to the cluster below the fitted line than the group with ADAS pre-experience. It also reveals that the trust of the group with a low annual driving experience increases its mean ratings in trust throughout the simulator session and has the highest intern group delta according to their system usability rating.
The findings of the study respond to the demands of standardisation in a human-centric approach to manage handover and takeover between the vehicle and the human for SAE level 3 automation [
1]. Besides the required compliance with the existing standards, the monitoring of the human state during the interaction with the AD functions also provides precious feedback on the machine’s performance which can be used for improving the intelligent machine itself [
19] and provides the foundations for further human-centred development with the flair of a humanistic AI control. Considering that ensuring dependability of such systems relies on AI approaches, it is still an open issue that lacks standard industrialisation solutions [
15]. Ensuring dependability, despite the complexity and changing nature of the systems due to adaptation and learning, is a precondition for public trust and acceptance [
58]. The findings of the study help to quantify human behaviour and define measurable parameters that are also working towards standardisation of the concept of safety-critical autonomous or AI-enhanced applications.
In addition, the presented work can support the establishment of trust and acceptance measures of AD in general and AI-based approaches in particular. Such measures may provide the foundation of necessary acceptance and standardisation related to human perception and trust in AD systems.
Limitations
A limiting factor in this study may be seen in its virtual reality nature within a simulator setting. This may provide an impression and sensation of safety which would not be experienced in reality and result in a more comfortable and less critical driver state in the simulator. We suggest that the direction of the effect is the same though the effect size may be smaller.
We would expect the NASA TLX questionnaire to lead to a higher level of workload when facing the same situation in a vehicle in a real-world scenario like on the road or a test track. This influence is expected to be lower for the Expression of Trust questionnaire due to the research focus on the difference between pre- and post-evaluation. In both cases, the participants are aware of the virtual character in the simulator. Therefore, the participants’ rating focuses on the complete simulator session rather than on a single scenario.
Moreover, we wish to point out that the number of participants was not completely balanced between all groups analysed in the calculations. This results in a small number of participants within some specific groups and may lead to a limited generalisation for specific results while not harming the big picture of the findings.
Measuring the effects of AD on human perception was concluded on a highly advanced system, which may lead to a limited generalisation regarding the behaviour of the system within a high situational variance in the real world.
5. Conclusions
While the driving simulator offers a chance to immerse in AD functionality, it comes with the limitation posed by the virtual environment. The missing risk of harm can support the participant to gain sufficient impressions of the AD behaviour and therefore significantly increase the participant’s trust in the system. When comparing the analysis of participants’ impressions before and after the simulator session, the conducted experiment shows that this increase of trust holds for all demographic subgroups on a similar level. For example, the mean increase in trust resulting from the described experience in the driving simulator is measured 3.8% for study participants with and 13.7% without previous ADAS experience. Concerning the gender diversion an increase of trust of 5.4% for the male and 14.5% for the female participants was measured. Group analyses do not reveal significant differences. Hence, we suggest a reduced need for precise and equally balanced demographic groups. Single significant differences within the subgroups are only recognised when using single inquiry lines (specific aspects within the questionnaires).
According to the participants’ subjective perception, relying on the system usability scale, the system was able to provide sufficient performance (77.49%) for the conducted evaluation in a reliable virtual environment, substantiated by a homogeneous distribution of the demographic group mean ratings on the questionnaire on a high level.
For SAE level 4 AD in a simulator, participants’ subjective workload appears to be low on all singular aspects of the NASA TLX. This reflects the definition of the automated driving mode with no objective task for the driver in the operational design domain. The factors age and driving experience have a significant influence on the participant’s workload. Further, the measurement provided evidence that there is a significant relationship between the trust in the system and the participant’s workload. In essence, the collected experimental data consistently indicates that the desired increase of trust (as a proxy to improve user acceptance) could be supported by reducing the need for user workload in vehicles.
At present, the integration of the highly automated and autonomous operation of safety-critical systems is still in an early stage. Therefore, an industry-agreed state of the art for measuring trust in autonomous or AI-based systems does not yet exist. Standards addressing the specific aspects of autonomous and/or AI-based technology for safety-critical systems are under development, providing essential further steps in such directions. Although this paper is not directly focusing on standardisation, the presented measurements addressing the establishment of trust and definition of measurable parameters create a foundation for further support for designers and engineers in the conception of safety-critical autonomous or AI-enhanced applications.
Future investigations into the complex combination of human drivers in an AD personal transportation system are required, using statistical analysis in combination with AI to understand and improve the future user trust in the AD technology.


 ,
, 


