1. Introduction
Electricity consumption is increasing continuously as a result of technological progress. Thermoelectric is one of the interesting alternative energy technologies, which can convert heat to electricity and vice versa. This technology provides many benefits, such as environmentally friendly energy sources, scalability, and silent operation. Unfortunately, the generic thermoelectric bulk modules perform with an efficiency of about 3–5% [
1], which is lower than other alternative energy sources such as solar cells with an efficiency of up to 30% [
2]. In order to develop a better thermoelectric performance, thermoelectric materials, the heart of the technology, need to be better developed. The key performance of thermoelectric materials is determined from the dimensionless Figure-of-Merit (
ZT), defined as
ZT =
[
3] where
T,
σ S, and
k are the absolute temperature, electrical conductivity, Seebeck coefficient, and thermal conductivity, respectively. Various methods have been investigated to enhance
ZT, and thus, the performance of the material.
Traditional approaches to investigate thermoelectric materials are by experiments and computational methods based on density functional theory (DFT). In general, experimenting requires expertise, instrument, and advanced technology, which consume considerable resources. Furthermore, it is difficult to control overall variables and may require a long acquisition period. Alternatively, the computational simulation needs less time and is profitable in complete control over the essential variables. Nonetheless, there are also many challenges for the DFT simulation related to microstructures of material. It needs high-performance computing apparatus, usually in large computing clusters, which is difficult to be accessed by individuals. Additionally, the simulation was merely employed to some specific systems and required approximations to minimize runtime on complex systems. To accelerate the development and discovery of novel thermoelectric materials, machine learning (ML) becomes an attractive approach. ML is a data-driven method that utilizes statistical mathematics to analyze the data. It can predict micro and macro properties and the correlation between the parameters of the materials [
4].
To accelerate the material research, advances and applications of ML have been developed continuously [
4,
5,
6,
7]. The ML was currently supported by several online databases, algorithms, and frameworks [
8,
9]. The ML model for predicting materials properties was usually implemented via a classical algorithm, such as regression, determined by
,
i = 1, 2, …
n, where
is the target or predicting value,
ai is the regression coefficient automatically calculated by an ML algorithm, and
xi is the feature or descriptor for representing the character of materials. Even though there are many ways to generate the features, Magpie is the software that originates features for material science by using physical properties. They are operated with mathematics requiring only chemical formula [
10]. Furthermore, the features have the potential to build an ML model with advantages in a comfortable and quick method for searching new candidate materials [
11,
12]. With many advantages, ML has the potential to be a new approach to accelerate the discovery of thermoelectric material with high performance.
Related Work
Recently, ML applications in thermoelectric materials have been increasingly investigated due to high accuracy and less time-consuming. For example, Iwasaki et al. reported the ML model that accelerated the discovery of new candidate materials by generating features from the chemical formula confirmed with the experiment [
12]. In their investigation for the spin-driven thermoelectric effect (STE) device, the descriptors for training the ML model were generated automatically from the composition with a composition-based feature vector (CBFV) [
13]. The results showed that some features, such as atomic weight, spin, and orbital angular momenta, play an important role in thermopower. In addition, Wang et al. studied the Cu
xBi
2Te
2.85+ySe
0.15 system with ML [
14]. The correlation between microstructure and thermoelectric properties was investigated with the principal component analysis (PCA) and the regression algorithm. Furthermore, apart from predicting the properties of new materials, ML could design the experimental conditions to obtain a high
ZT value. Hou et al. presented an effective way to find the optimal chemical composition of the Al
2Fe
3Si
3 thermoelectric compound [
15]. With the Bayesian Optimization (BO) algorithm, ML can be applied to the experiment effectively. The power factor can be improved by about 40% compared to the sample with the initial Al/Si ratio of 0.9. Moreover, the author claimed that the framework of this study could be extended to the extrinsic doping of Al
2Fe
3Si
3. These related works can be summarized in
Table 1.
The previous related research generally exploited the data from the first principle calculation or from one laboratory. Our present work made a contribution over the previous related research by exploring the experimental datasets available in literature to construct the ML model. We then used the model to predict the thermoelectric properties of BiCuSeO. BiCuSeO is a class of thermoelectric oxides considered a new candidate for high-performance p-type thermoelectric materials [
16]. Even though the material was only discovered in 2010, thermoelectric researchers have paid much attention to this compound, and continuous publications have been reported since then [
17,
18,
19,
20,
21,
22,
23,
24]. This compound has a complex ZrSiCuAs layered structure, as shown in
Figure 1. It consists of the conducting (Cu
2Se
2)
2− layers alternatively stacked by the insulating (Bi
2O
3)
2+ layers. Due to distinct functionalities and the weak bonding between these two layers, BiCuSeO showed outstanding thermoelectric properties and outperformed most thermoelectric oxides [
25]. Therefore, intense research interest is focusing on BiCuSeO to lift the thermoelectric performance and
ZT even higher. The most common approach to enhance
ZT is by extrinsic doping some elements into the BiCuSeO structure to lower thermal conductivity, increase carrier concentration, and optimize electrical transport properties [
25,
26,
27]. Nevertheless, since there are numerous available dopants, tedious experiments are required. Therefore, ML could be a wise choice to address the issue by providing guidance for appropriate effective doping of BiCuSeO.
In this work, the ML model was constructed to provide the guidelines for effective doping of the BiCuSeO system. The ML model was built and tested by collecting data from available published articles (2010–present). Step-by-step, we improved the accuracy of our model so that the predicted ZT value from the model closely matched with the experiment. We then extracted the features/descriptors representing the characteristics of materials and discussed their correlation to the physical parameters of the materials. Finally, we used the ML model to predict the suitable dopants in the BiCuSeO system, which can improve thermoelectric properties and lift the ZT of the doped compound with respect to the pristine BiCuSeO. We truly believe that our work and technique would be very useful for experimental researchers working to improve the thermoelectric properties of the BiCuSeO compounds.
2. Materials and Methods
Thermoelectric databases for the BiCuSeO compounds were collected from published articles from 2010 to the present (available in the
supplementary information, Table S1). They were then tabulated in Excel for the convenience to import into the Jupyter Notebook software. The descriptors or features for building classical ML models were generated from the collected chemical formula via Magpie. The physical and chemical properties of the element were manipulated by mathematical operators, such as average, summation, min, mode, max, and median, and a total of 154 features were obtained. Then, the total datasets were split into a training set (85%) and a test set (15%). The training set was used to teach ML to find the pattern of the data, whereas the test set was used to test the accuracy of the model. Due to the small size of datasets compared to other ML research in materials science [
11], the models were built by using different regression algorithms [
28], namely, forest regression (RF), Gradient Boosting Regressor (GBR), kneighbor regressor (KN), extraboost tree (ET) and xgboost (XGB). These regression algorithms were determined from a simple linear relationship according to:
where
is the target or predicting value,
ai is the regression coefficient automatically calculated by an ML algorithm, and
xi is the features or descriptors for representing the character of materials. The algorithm which showed the best performance was selected.
Two metrics were used to evaluate the model’s accuracy, i.e., (1) the coefficient of determination (
R2) and (2) the root mean squared error (
RMSE). The
R2 was determined by:
where
and
and the
RMSE was determined by:
where
,
are defined as experimental, predicted, and average target value or
ZT.
The features or descriptors that are important to the model were exposed automatically via the function method from the regression model. Additionally, before bringing the model to use, a final step was to validate the model by Leave One Out Cross Validation (LOOCV). Finally, we used our ML model to predict the ZT value of the BiCuSeO compounds doped at the Bi site (Bi1-xAxCuSeO, where A is the dopant and x was set to 0.02). To discover a candidate to maximize the ZT value, the dopant (element A) was not in the original datasets and could possibly be done by experiments. Converting the materials into the numerical feature vectors benefits thermoelectric material researchers to build the ML model and discover new candidate material with the only chemical formula.
In the next section, we presented the results for improving the ML model step-by-step until obtaining the desirable ML model. The processes along with the thermoelectric principle of BiCuSeO material were discussed.
3. Results and Discussions
Firstly, the data of BiCuSeO research reporting
ZT values were extracted from literature (a total of 264 datasets). Then, the ML model was constructed using CBFV to generate 154 features from the chemical formula. Due to relatively small datasets compared to other ML research in materials science [
11], several regression algorithms were employed. The algorithm which showed the best performance was selected.
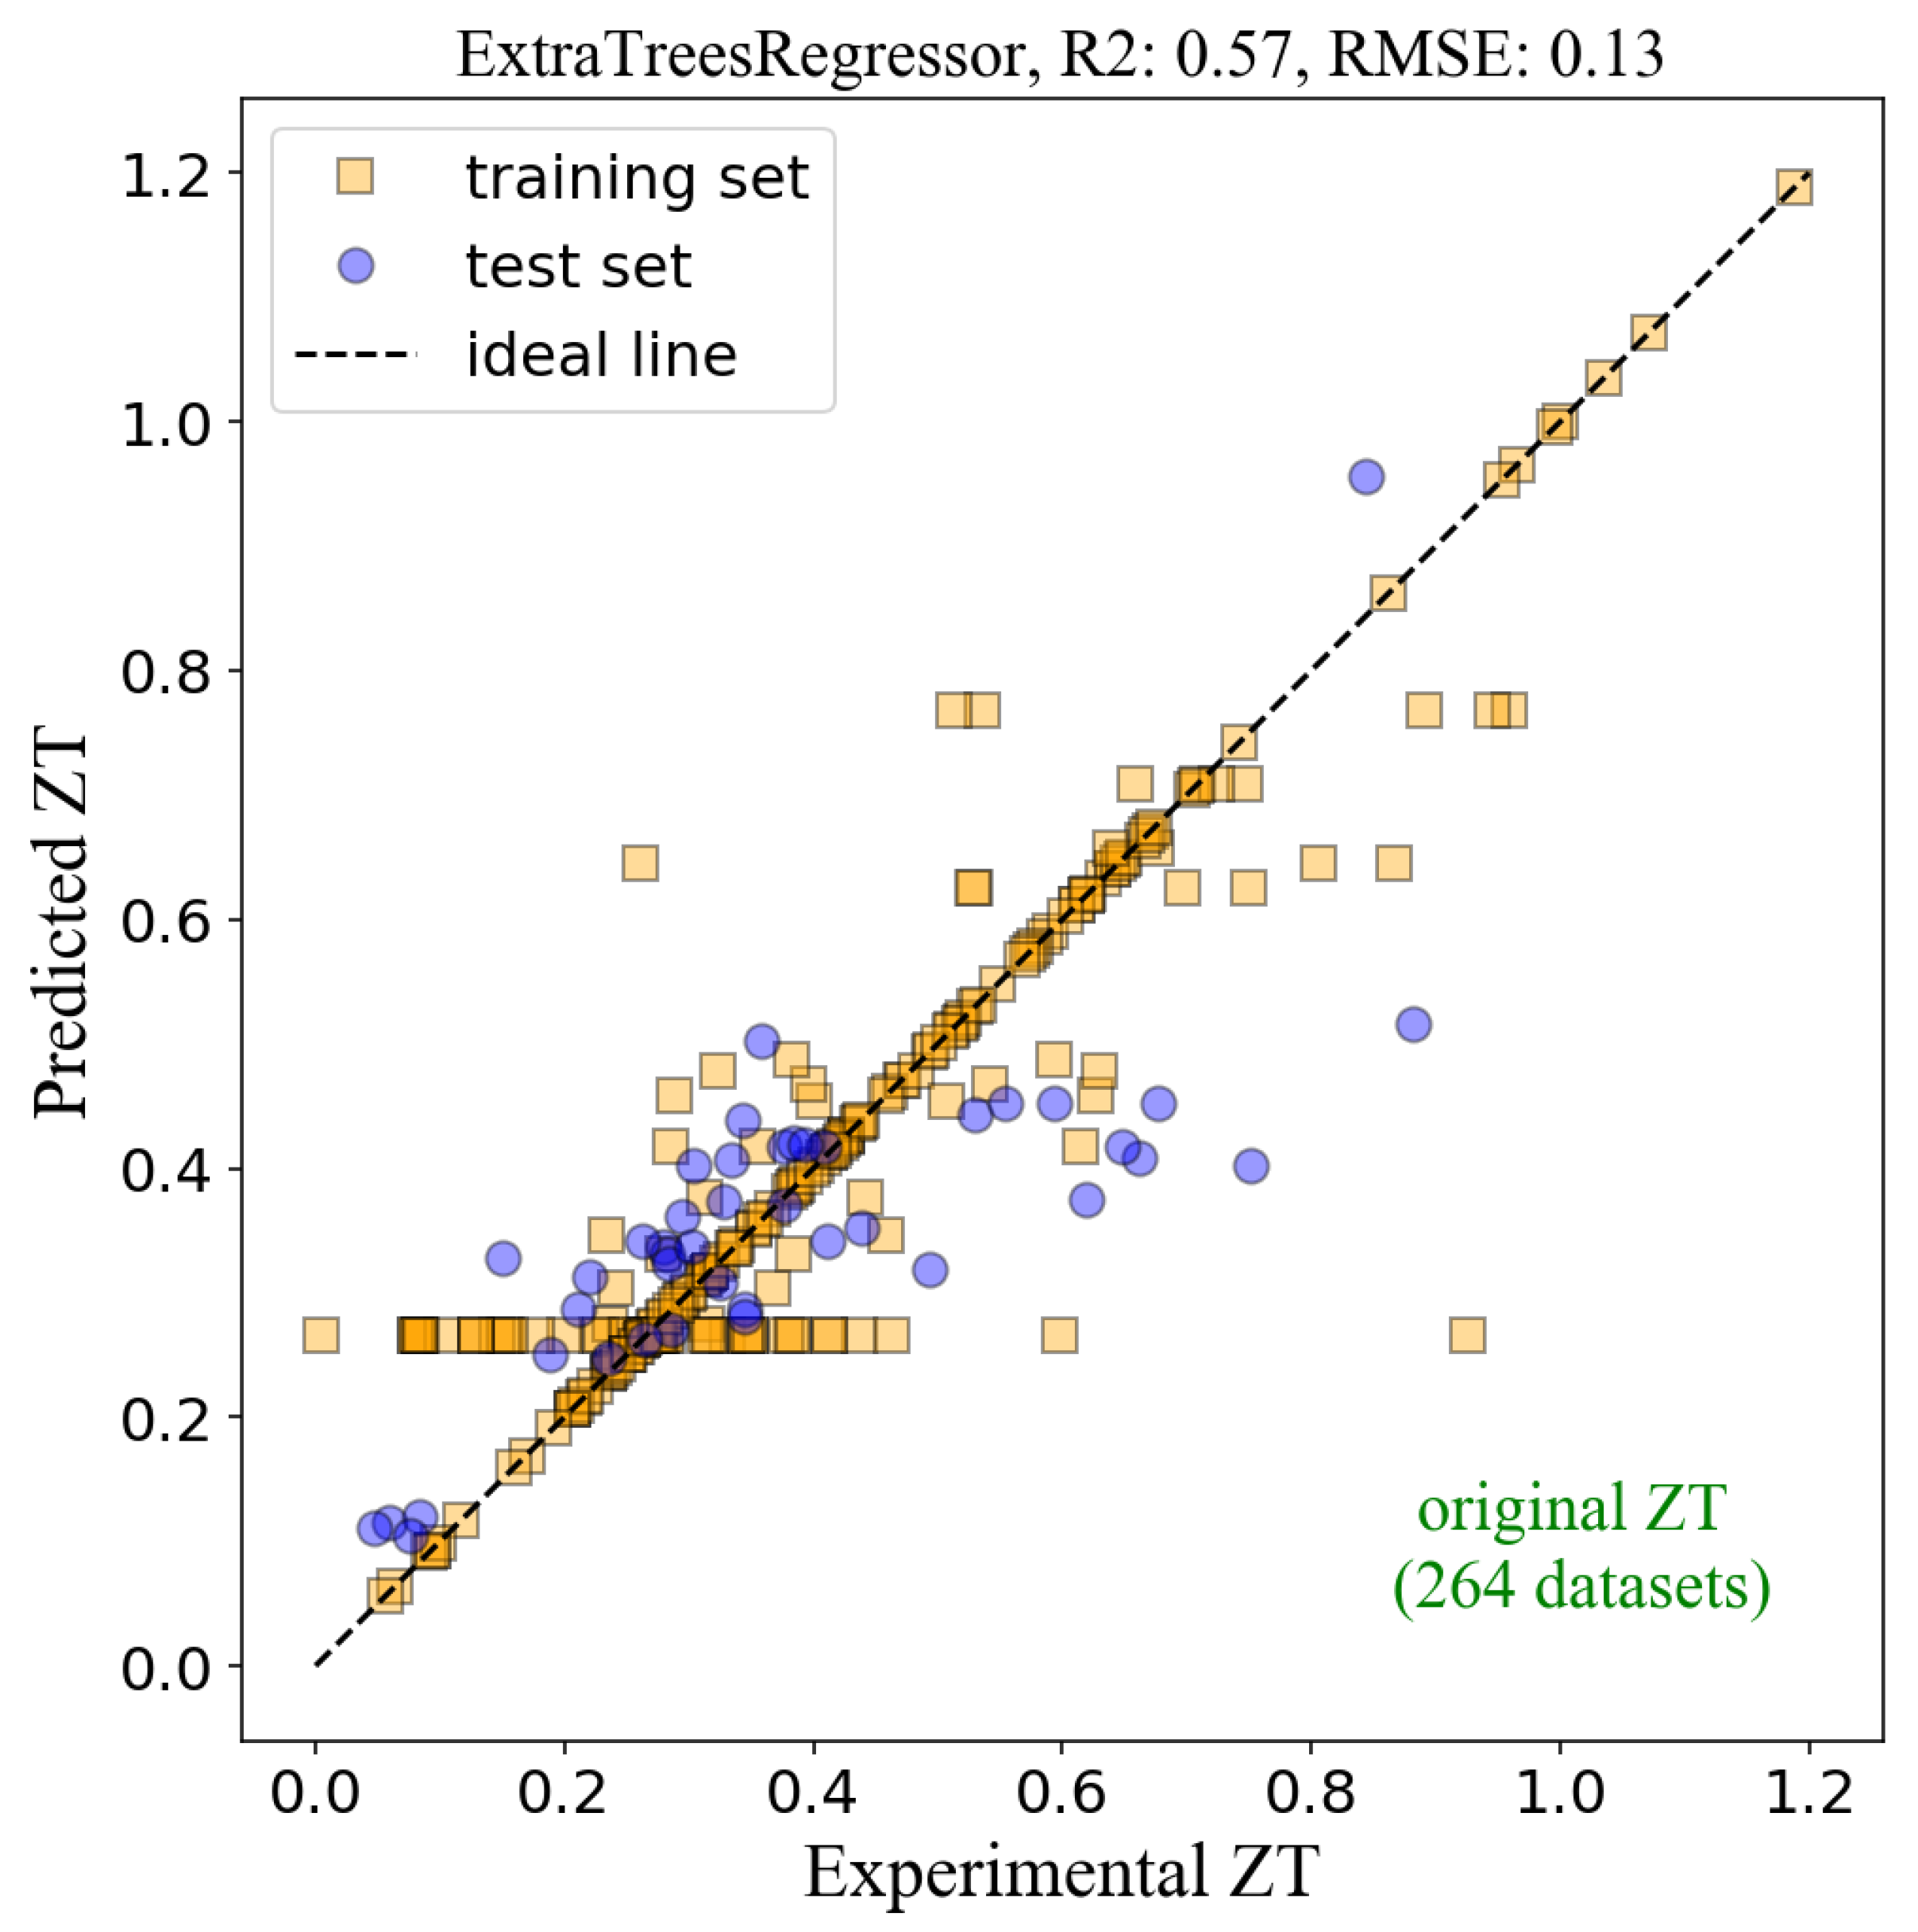
The results from the ML model are plotted in
Figure 2. The
x-axis is the experimental
ZT, referring to the reported
ZT values extracted from the literature. The
y-axis is called the ‘predicted
ZT’, the
ZT values predicted from the ML model based on the exact chemical formula of BiCuSeO compounds. All related features (a total of 154 features) were included in the model. The orange circles represent data from the training set, whereas the blue squares refer to data from the test set. The dotted line plotted as a guide-to-eyes is an ideal line when the predicted value perfectly matches the experiment. We evaluated the accuracy of the model using two metrics: (1) the coefficient of determination (
R2), and (2) the root mean squared error (
RMSE).
R2 accounts for how well the model can capture the correlation between the features and the
ZT value, whereas
RMSE is used to evaluate the model accuracy regarding the error from prediction. The perfect fit would result in the
R2 of 1 and
RMSE of 0.
Figure 2 shows the
R2 of 0.57 and the
RMSE of 0.13 from the test set. The
R2 value is relatively low, implying that the model is not very accurate. The model inaccuracy lies in the original data from the experiment database. The reported
ZT values of the pristine BiCuSeO from several research groups varied significantly. For example, Farooq et al. reported the
ZT of 0.25 [
29], but Yang et al. reported the
ZT of 0.42 [
30] for the same compound (BiCuSeO). These points are explicitly shown in
Figure 2, where the orange squares line up horizontally at the ‘predicted
ZT’ around 0.3. The discrepancy was due to the experimental details, such as processing parameters, microstructures, etc., which strongly affect the ML performance because the ML models were trained with the features that were extracted from chemical formulas only. The variations from experimental parameters were not included in the ML model, resulting in the model’s inaccuracy.
To improve the model’s accuracy, we had to eliminate the experimental dependent variables. To do that, we normalized the experimental
ZT by the
ZT of the pristine BiCuSeO from each publication. For instance, Farooq et a. reported the
ZT of BiCuSeO and Bi
0.99Cd
0.01CuSeO of 0.25 and 0.43 [
29], while Yang reported the
ZT of BiCuSeO and Bi
0.98Pb
0.02CuSeO of 0.42 and 0.66 [
30]. By normalizing, the ‘experimental
ZTnormalized’ of Farooq’s BiCuSeO and Bi
0.8Cd
0.2CuSeO became 1.0 and 1.72, whereas ‘experimental
ZTnormalized’ of Yang’s BiCuSeO and BiCu
0.8Zn
0.2SeO were 1.0 and 1.57. The normalization can be determined as
. In other words, by using this process, the ‘experimental
ZTnormalized’ of the pristine BiCuSeO from any publication was turned into unity. The ‘experimental
ZTnormalized’ of the doped BiCuSeO thus indicated the ratio of improvement between the doped BiCuSeO and the pristine BiCuSeO. The ML model was then reconstructed such that the
ZT was only related to the chemical formulas, and other experimental dependent variables were eliminated.
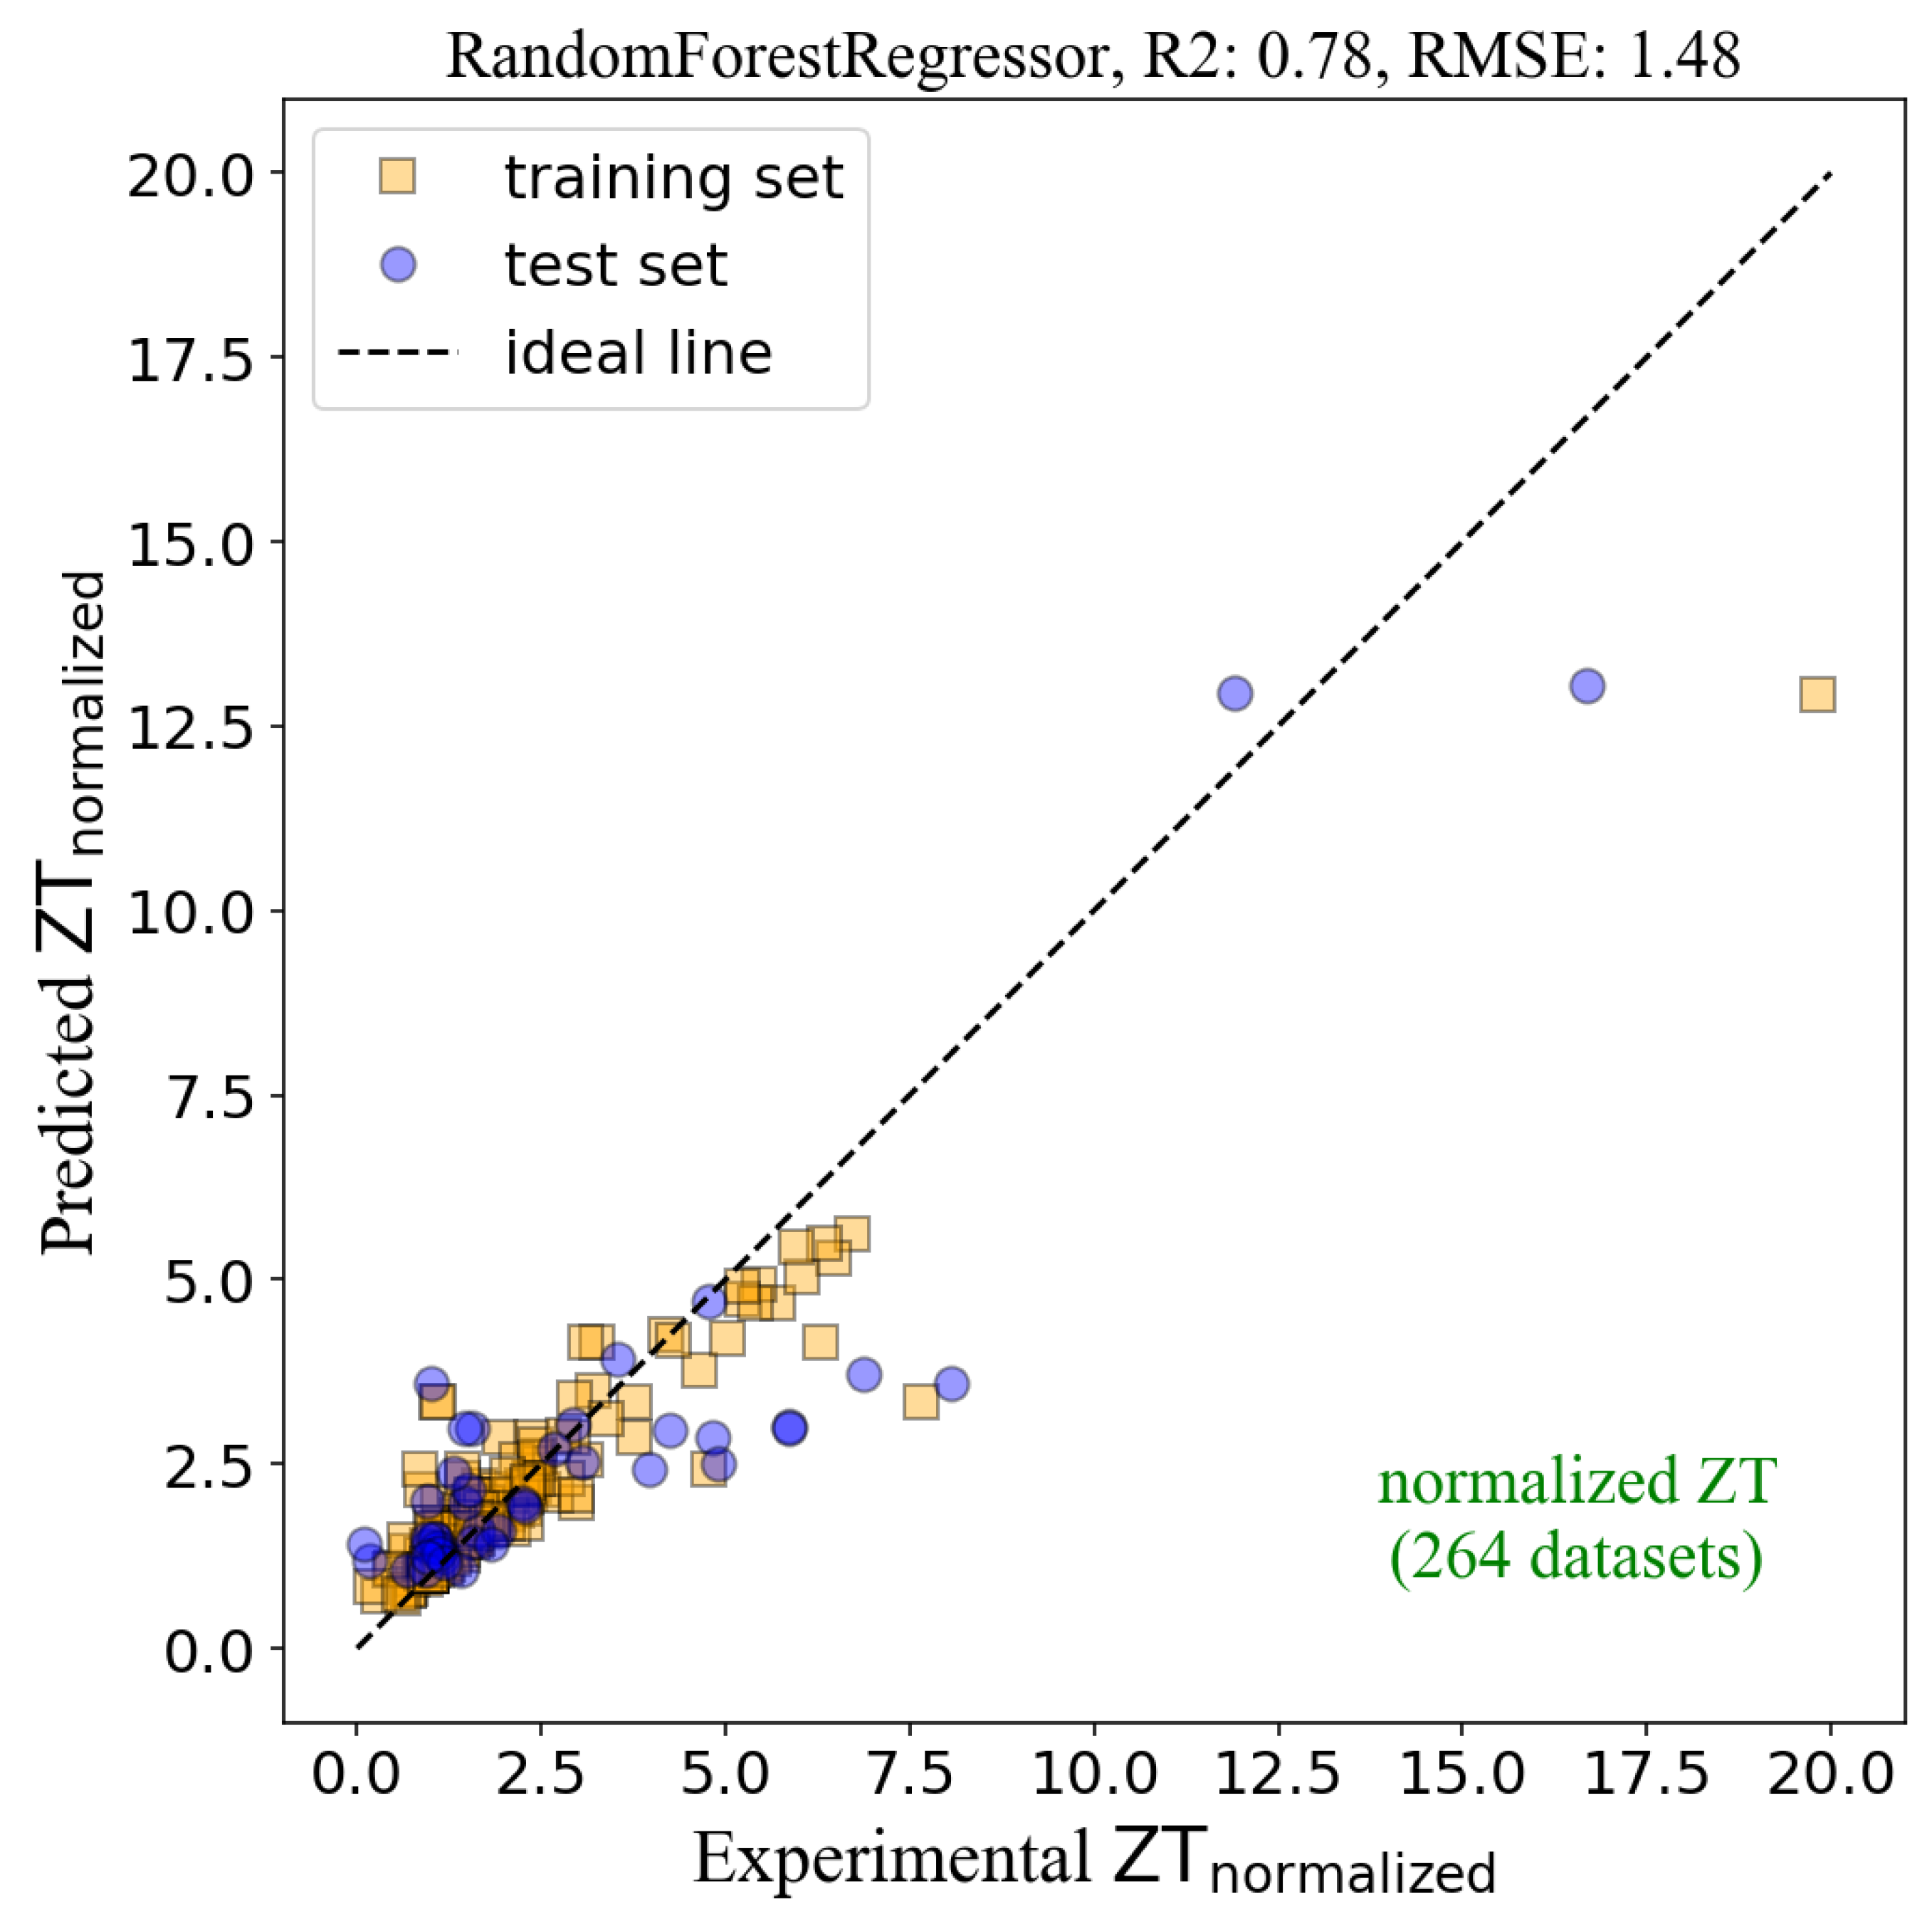
The results from the ML model after normalizing all 264 datasets are presented in
Figure 3, with the
R2 of 0.78 and
RMSE of 1.48 for the test set. The
R2 of 0.78 in
Figure 3 is larger than the
R2 of 0.57 in
Figure 2, indicating the improvement of the model’s accuracy. However, the higher
RMSE (1.48) in
Figure 3 compared to
Figure 2 (
RMSE = 0.13) does not mean that its prediction’s error is worse. In fact, it is incorrect to compare the
RMSE between the two figures because the data ranges are not the same. The scales in both axes in
Figure 2 range between 0 and 1.2, whereas
Figure 3 ranges from 0 to 20.0. Hence, it is expected that the
RMSE in
Figure 3 tends to be higher.
Although the
R2 for the ML model in
Figure 3 is relatively high, there are still outliers that deviated from the ideal line, for instance, the orange square and the blue circle on the right of the figure, leading to the reduction of
R2. This situation occurred even when the selected features in the model were already optimized. Therefore, we tried improving our ML model further by analyzing the original datasets. We found that the outliers and inaccuracy of the model could be from the different doping sites in the BiCuSeO compound. In general, doping elements in BiCuSeO is done by substituting atoms at different sites, written in a chemical formula Bi
1-xA
xCu
1-yB
ySe
1-zC
zO
1-wD
w, where A, B, C, and D are dopants. Sometimes, dual dopings were done at one or more sites. The purpose of doping in each site is different, such as lowering thermal conductivity, bandgap engineering, and tuning electrical transport properties [
17]. We assumed that our ML model could not capture the pattern from the data including all variations. Therefore, we analyzed the data and grouped the datasets into a few sub-groups. The major sub-group (145datasets) was the BiCuSeO compound doped at the Bi site (
Figure 1), for instance, Bi
0.98K
0.02CuSeO [
31]. This group is vital from the thermoelectric perspective. The BiCuSeO structure consists of two layers: the conducting (Cu
2Se
2)
2− layers and the insulating (Bi
2O
3)
2+ layers. The electrical transport pathway is mainly limited to the Cu
2Se
2 layers, whereas the Bi
2O
2 layers behave as a charge reservoir [
32]. Thus, doping at the Bi site provides extra charge carriers for thermoelectric power factor tuning without interrupting the carrier transport. Therefore, the ML was reconstructed based on these datasets.
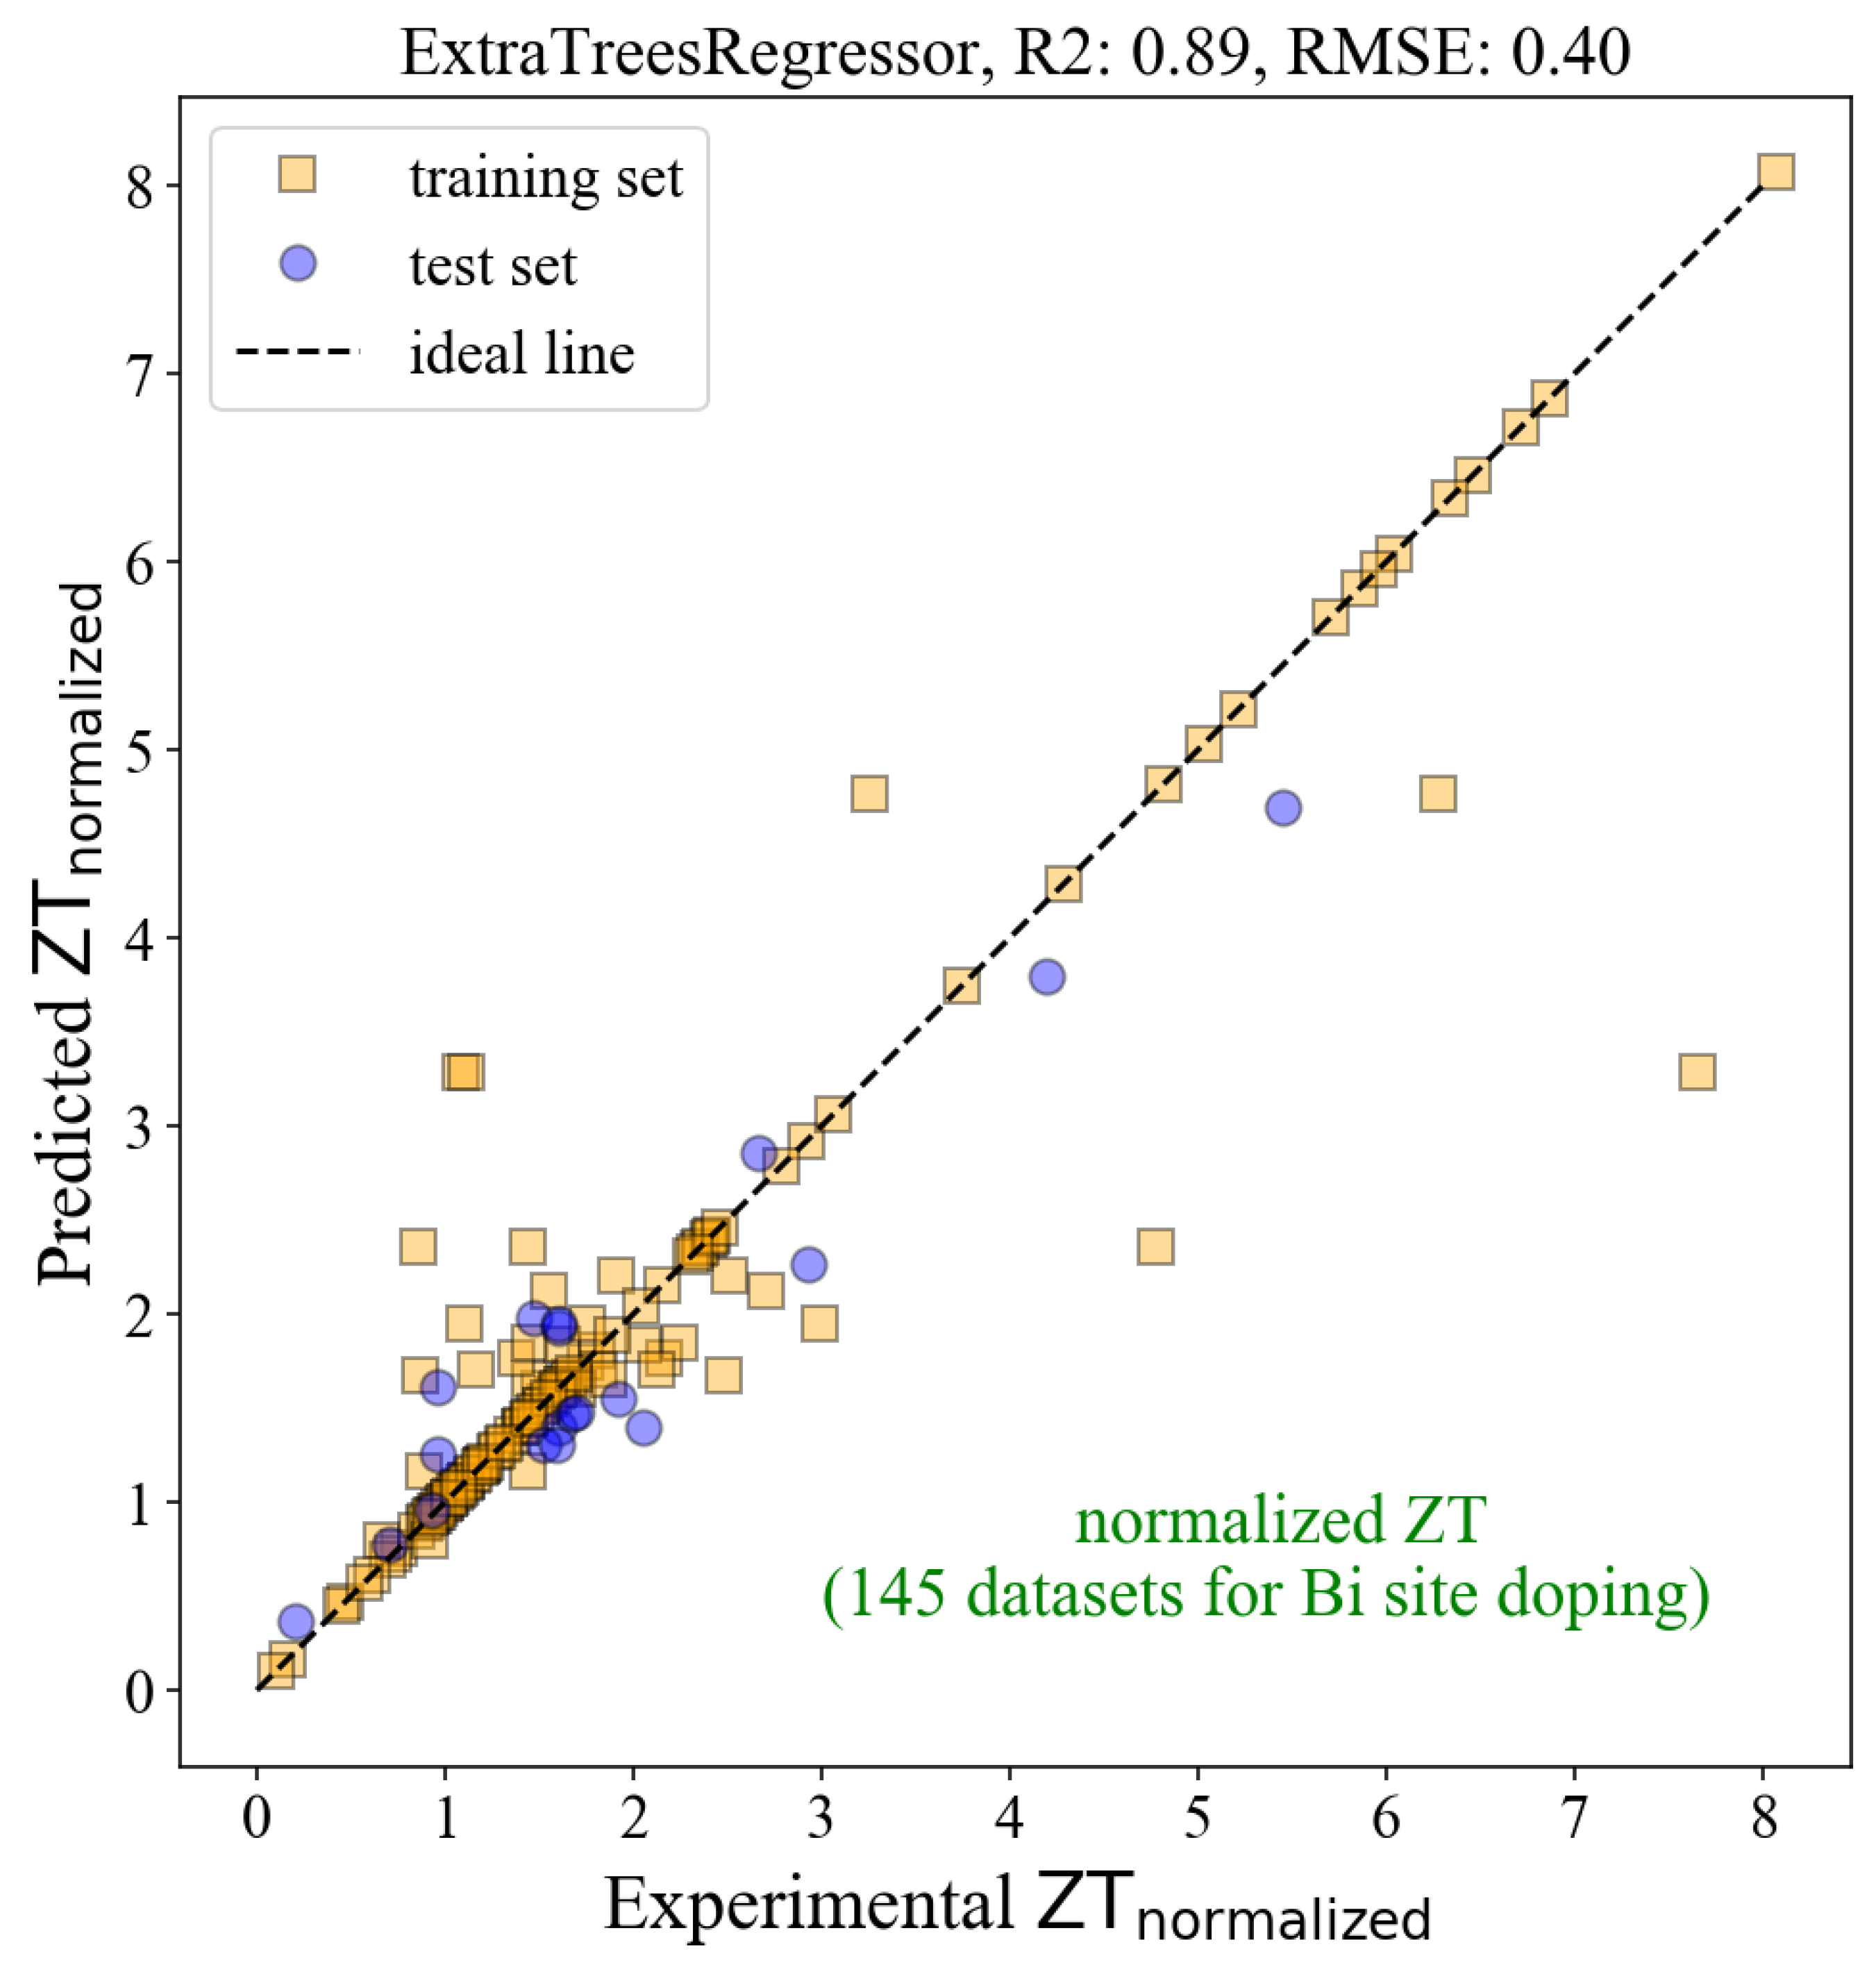
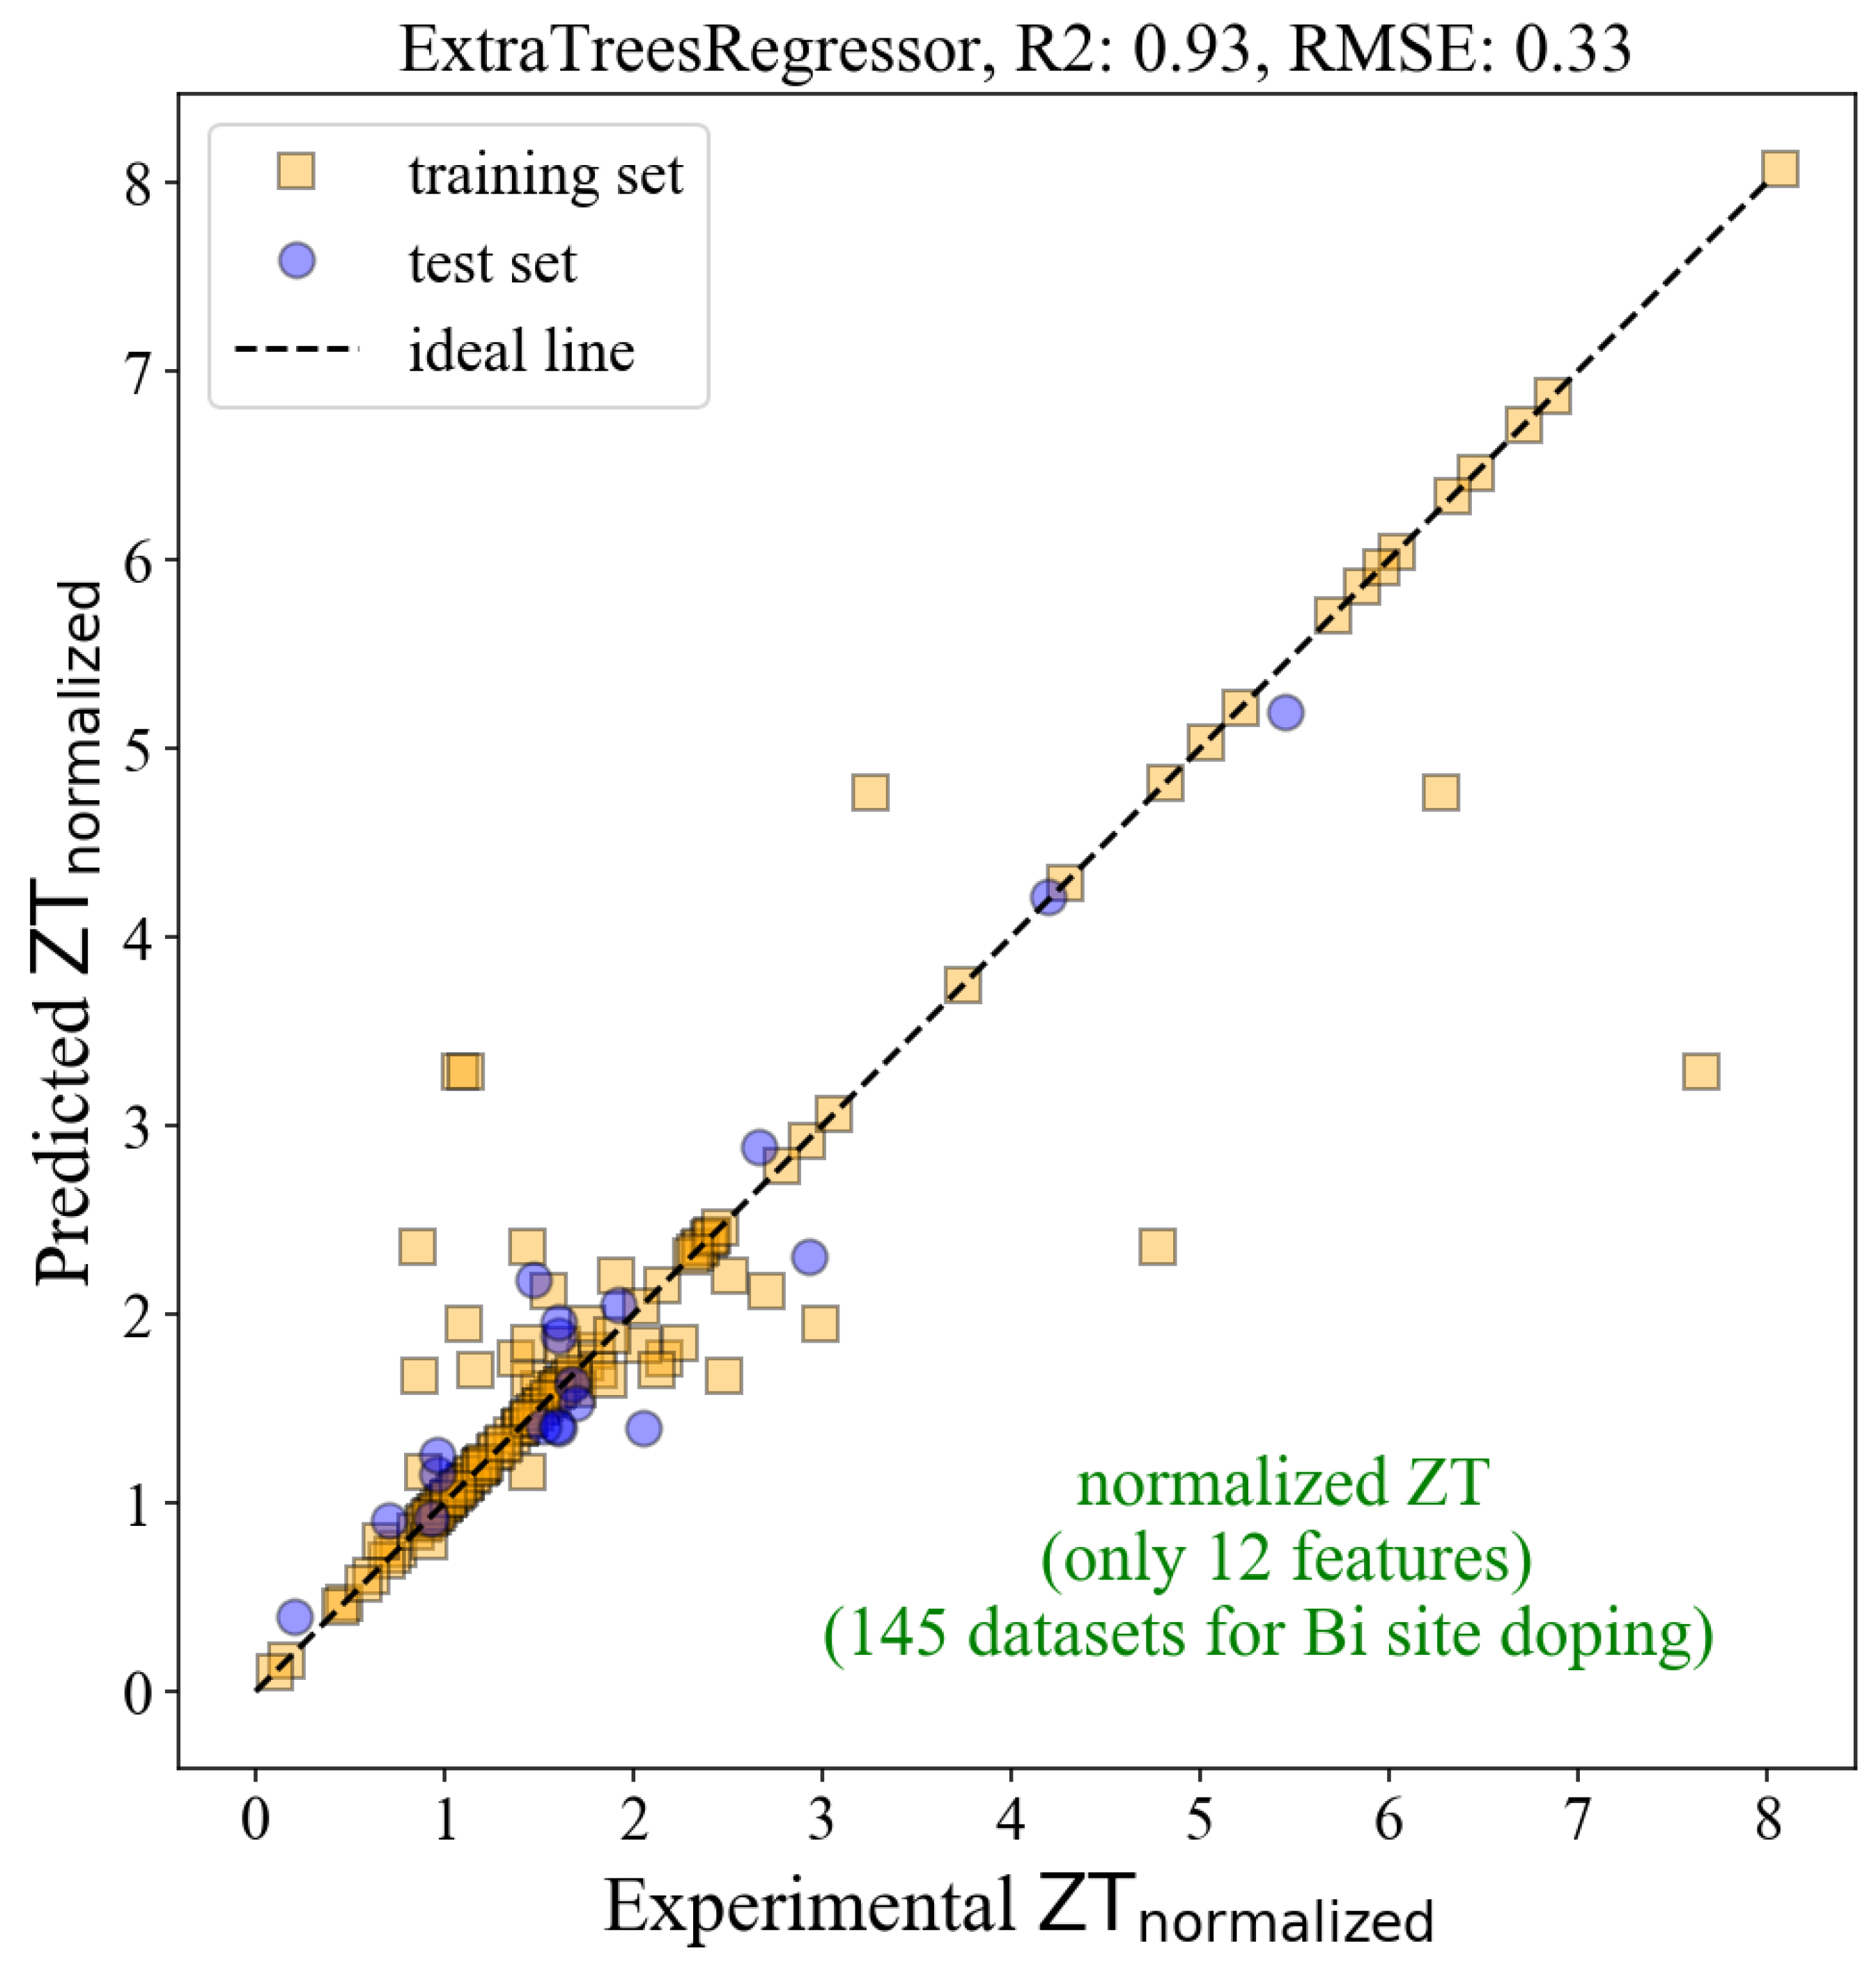
Figure 4 shows the results from the ML model based on 144 datasets for the Bi-doped BiCuSeO. The
R2 was considerably increased to 0.89, with the
RMSE of 0.40, indicating the improvement of the model’s accuracy. However, decreasing the amount of data and using many features (154 features) could lead to overfitting, which means the model shows high performance on the training dataset but low performance on the test set [
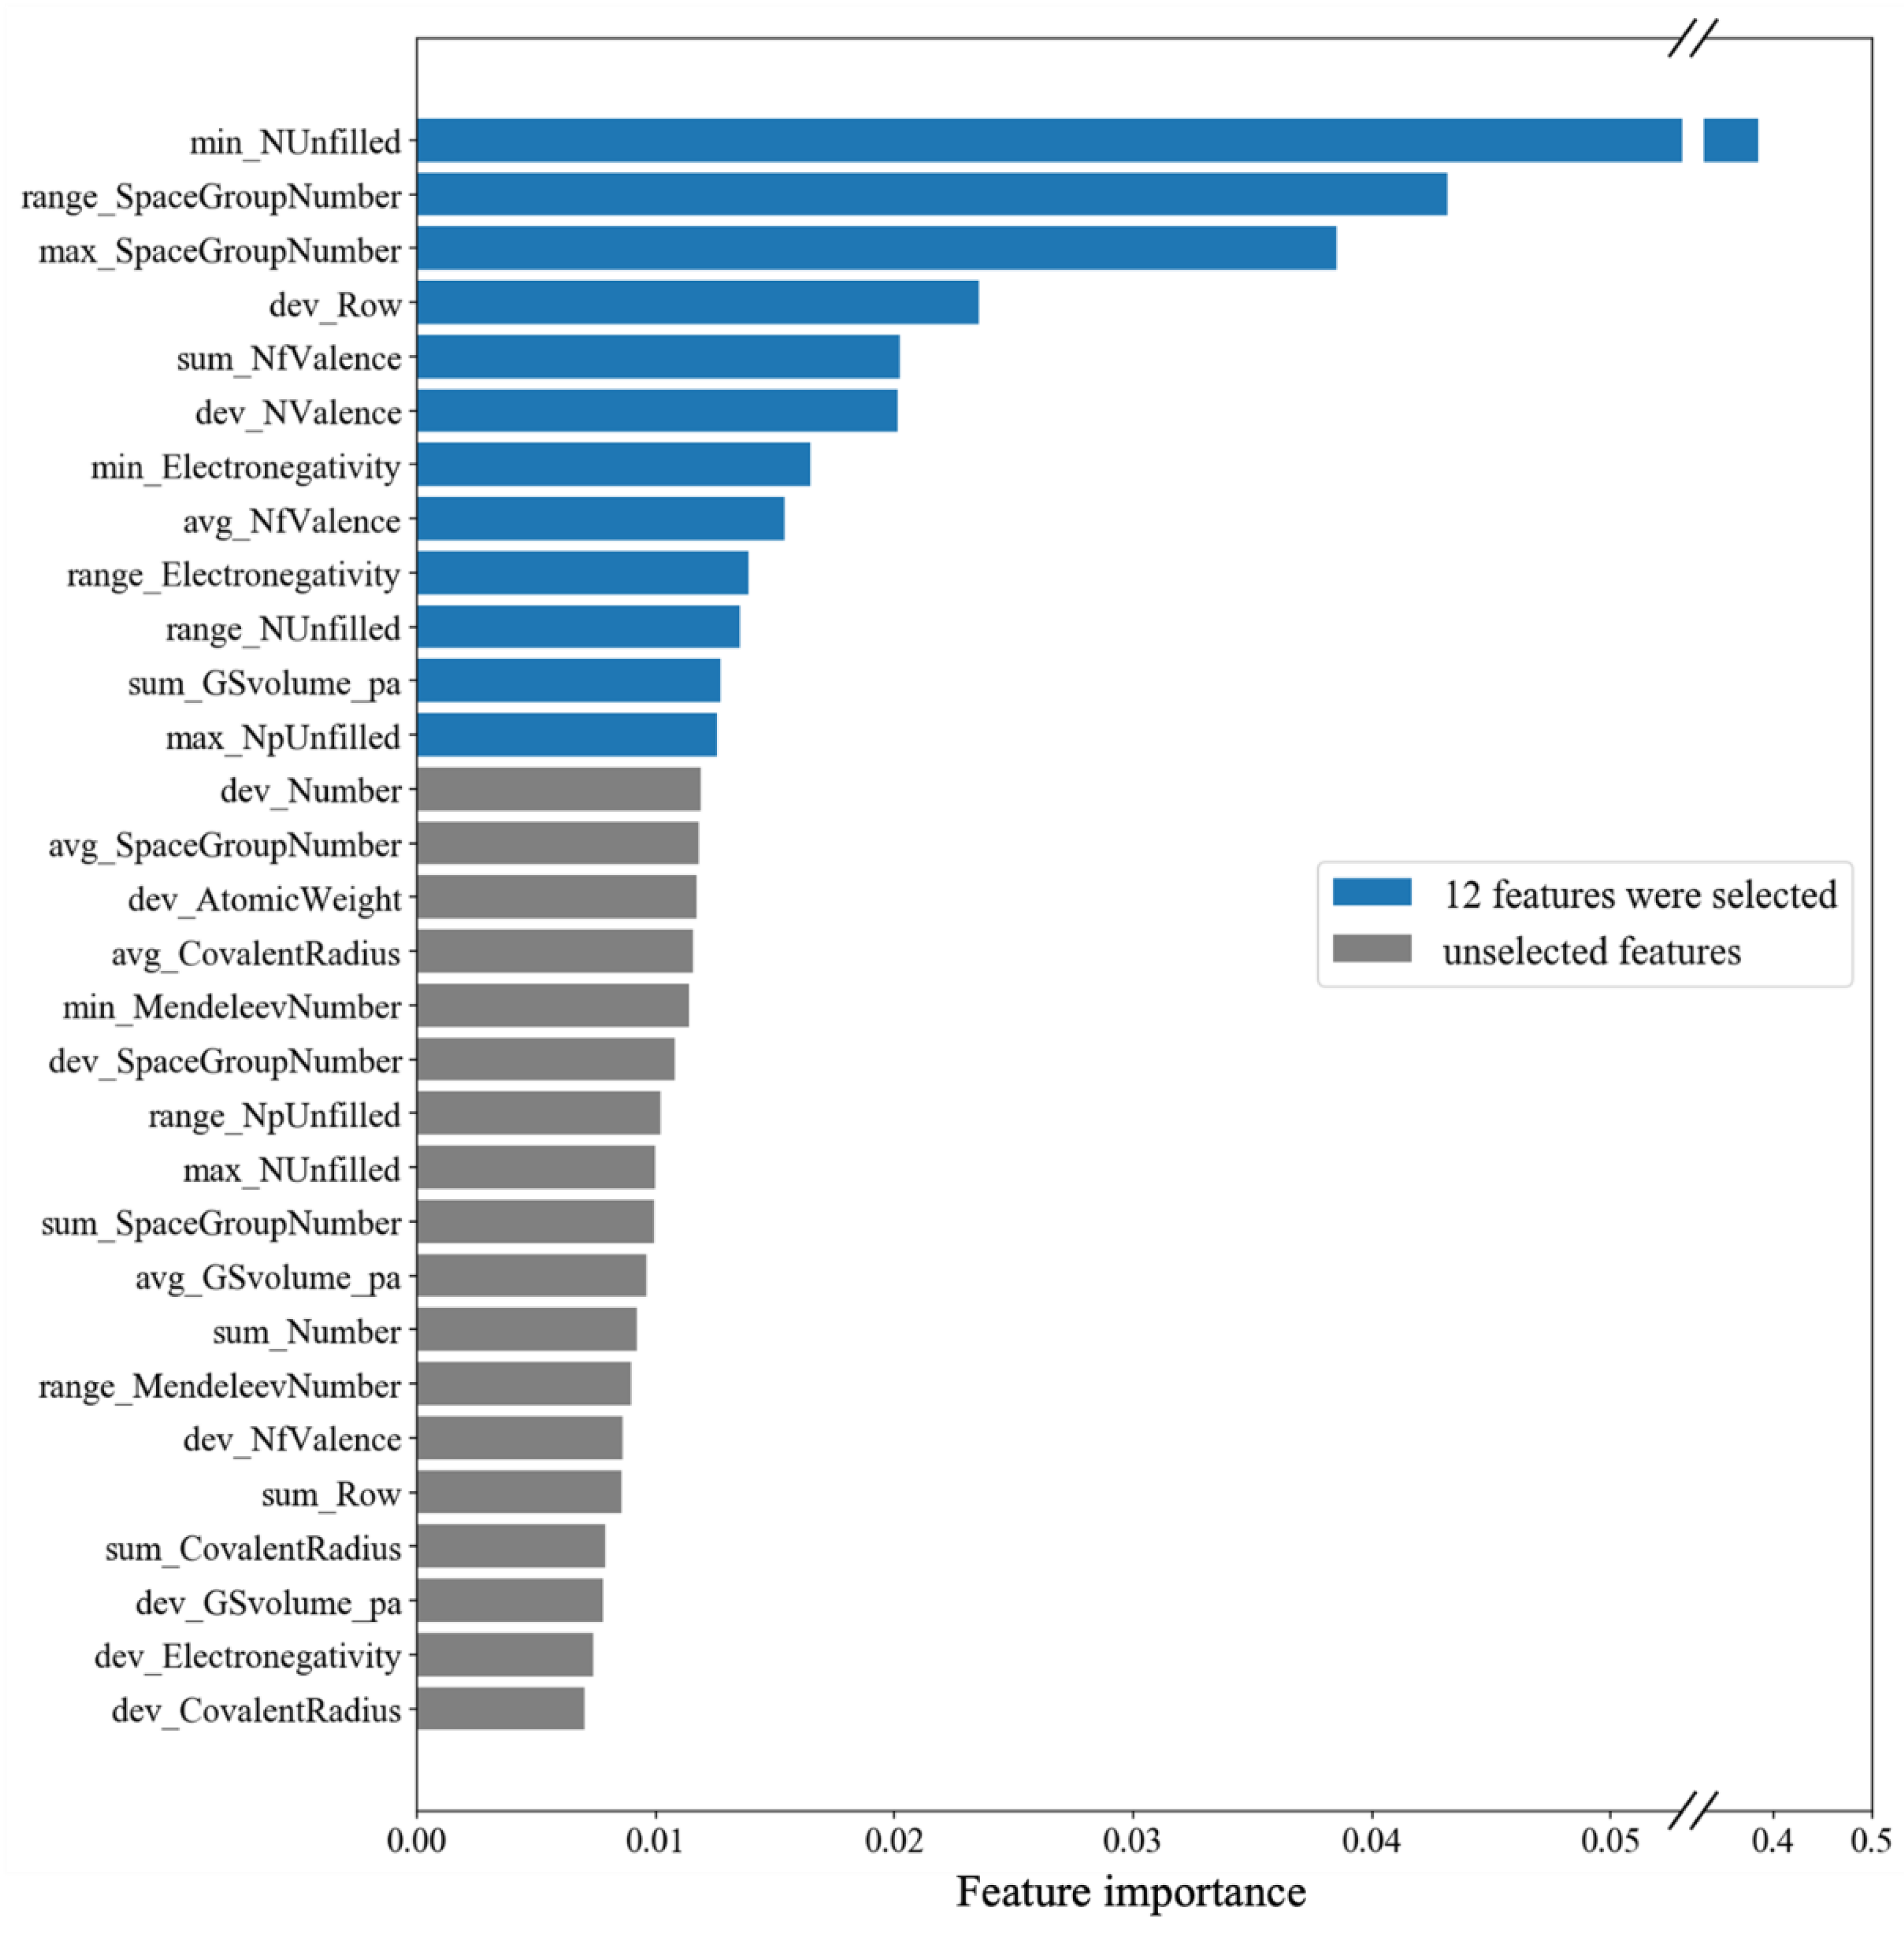
33]. To address the issue, we exported the features or descriptors representing the material characteristics from our ML model and ranked them according to their importance to the model. There were a total of 154 generated features, but the first 30 important features are shown in
Figure 5. We then optimized the ML model by including only the important features. We have tried including the first 3, the first 6, the first 9… and so on important features in the model. The best-performance model was obtained when the first 12 important features (as highlighted in
Figure 5) were used.
Figure 6 shows the results from such a model, with the
R2 of 0.93 and the
RMSE of 0.33 for the test set, an improvement in accuracy from the model in
Figure 4. If one compared the model in
Figure 6 to the primitive model in
Figure 2, the accuracy performance increased >63%. However, before bringing the model to use, the generalization of the model was carried out via Leave One Out Cross Validation (LOOCV). This method is appropriate, particularly for small-size datasets [
5]. The validation resulted in the
RMSE of 0.71 for the training dataset, which means that the predicted
ZTnormalized values from the model have an error of ±0.71.
The physical meaning of the important features in
Figure 5 is worth discussing. The most important feature is the min_NUnfilled. The prefix min refers to the minimum number of the element’s properties obtained from Magpie software, whereas the NUnfilled accounts for the total number of unfilled electrons in electronic shells (s, p, d, f). For example, the NUnfilled of He is 0 from its electronic configuration (1s
2), whereas the electronic configuration of Na is 1s
2 2s
2 2p
6 3s
1 resulting in the NUnfilled of 1. In the case of the BiCuSeO compound, the NUnfilled of Bi, Cu, Se, and O is 3, 1, 2, and 2, respectively, and hence, the min_NUnfilled of BiCuSeO is 1, according to the minimum NUnfilled of Cu. For the doped compound, such as Bi
0.94Mg
0.03Pb
0.03CuSeO, the min_NUnfilled of this compound is 0 because the NUnfilled of Mg equals 0. By using Pearson correlation analysis, it was found that the lower the min_NUnfilled, the higher the
ZTnormalized. The lowest min_NUnfilled (0) was found in the BiCuSeO doped with, for example, Mg, Ca, Sr, Ba. These elements are divalent ions (Mg
2+, Ca
2+, Sr
2+, Ba
2+). When they were substituted for Bi
3+, an extra +1 charge was generated for charge neutralization. This extra charge increased the carrier concentration of the BiCuSeO system, leading to optimization of power factors [
17,
34,
35]. Therefore, it is reasonable for min_NUnfilled to be the most important feature for our ML model.
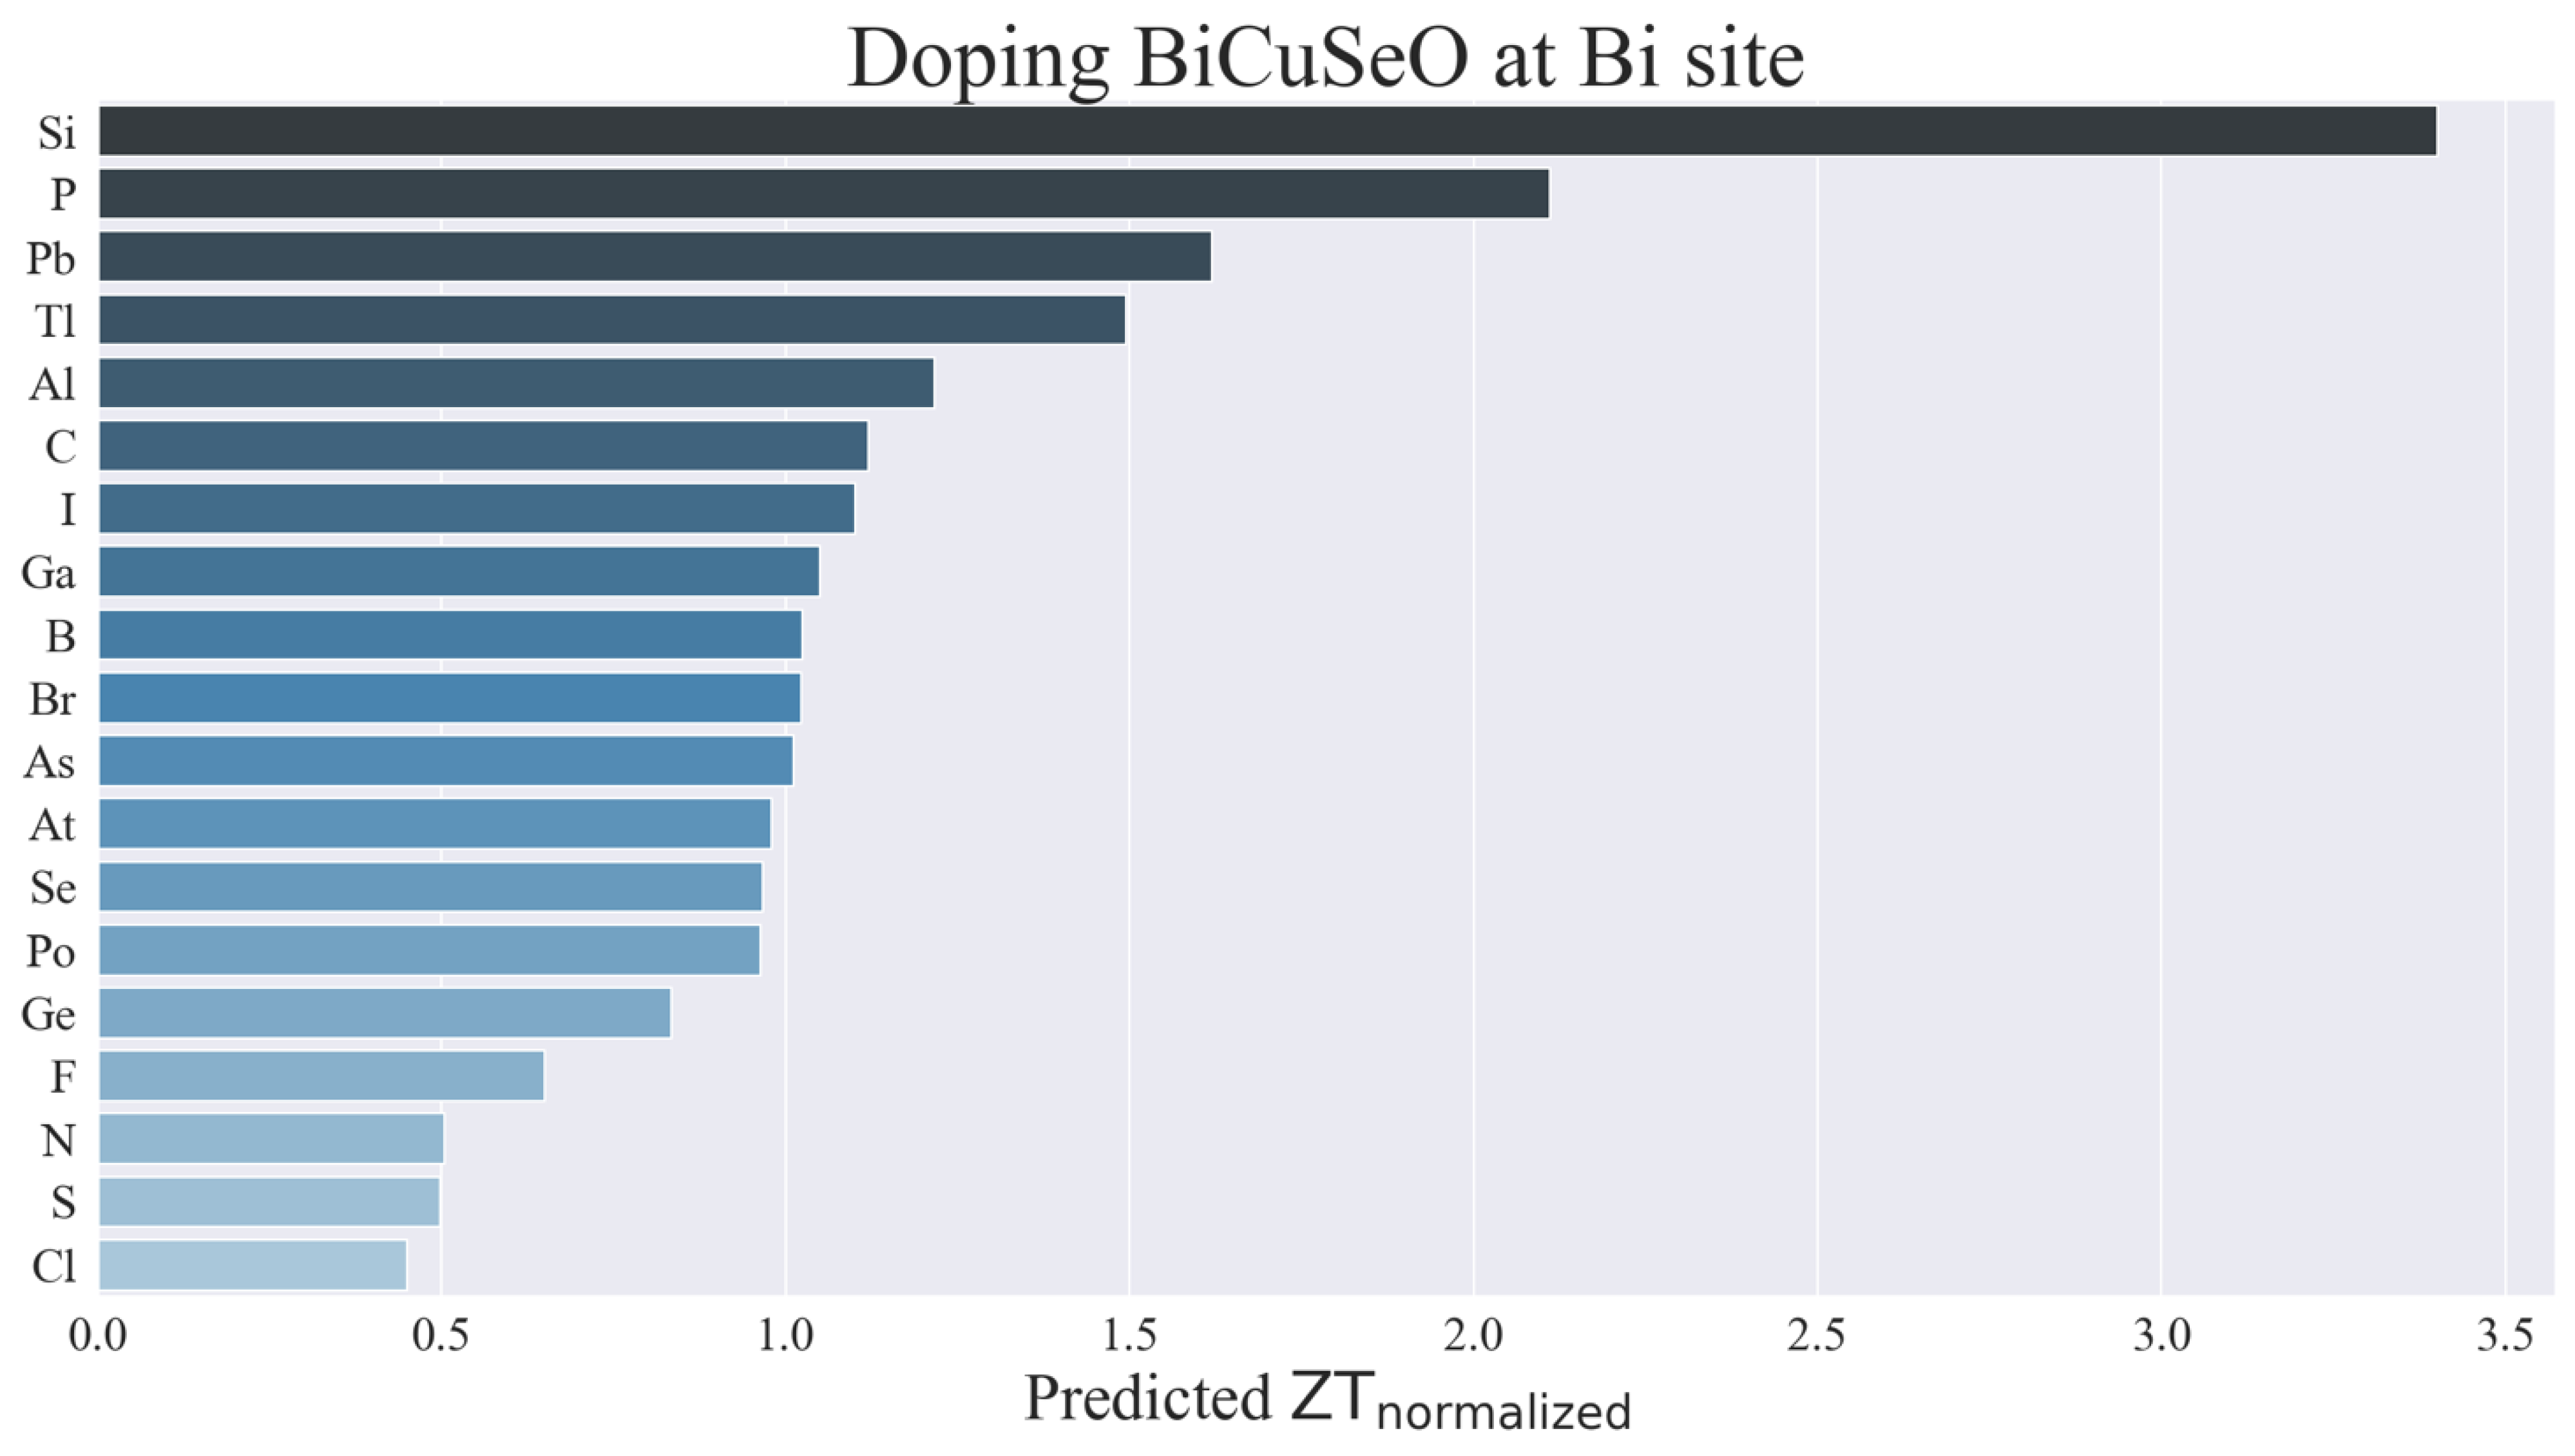
Finally, we used the optimized ML model to predict
ZTnormalized of the doped BiCuSeO at Bi-site (Bi
1-xA
xCuSeO, where A is the dopant and x = 0.02). We selected some elements that were not already in the model datasets, and such elements could be synthesized experimentally.
Figure 7 shows the predicted
ZTnormalized value for some candidate materials. The highest
ZTnormalized belongs to the Si-doped compound, which is reasonably justified. It was reported that doping light elements at the Bi-site in BiCuSeO could promote carrier mobility from the decreased carrier scattering [
36]. Since Si can be considered as a light element, doping Si for Bi is likely to promote carrier mobility and increase
ZT. Moreover, the DFT simulation of the Si doping at Bi-site showed the increased electrical conductivity, with a slight decrease in the Seebeck coefficient, from the modified electronic band near the Femi level, resulting in a large power factor. On the other hand, the Cl-doped compound exhibited the lowest
ZTnormalized value from the model. This result is understandable. The previous experiment reported that doping Cl at Se-site negatively affected the
ZT value, by increasing both electrical resistivity and thermal conductivity [
37]. Thus, Cl is unlikely to be a good candidate for doping in BiCuSeO.
The step-by-step development of the ML model with improving performance was presented. It was used to guide a new candidate material for enhancing ZT value. However, the limited data from experiments was an obstacle to constructing the accurate ML model. Apart from that, it was also found that training the ML model requires both good and bad results. Generally, most published articles reported only good results (large ZT), but in fact, various data (positive or negative results) are necessary to improve the ML model.

