Abstract
The main goal of this article is to build a decision model for an investment involving the addition of a CCS (Carbon dioxide Capture and Storage) installation in an existing conventional power plant. The application of CCS systems in coal and gas power plants involves large capital expenditures and an increase in operating costs. The lack of upgrade modernisation and environmentally friendly investments in this type of power plant generates the additional costs of the purchase of emission allowances. An analysis of the impact of the addition of a CCS installation to an existing coal power plant on the costs of electricity generation is presented. Based on the accessible technical and economic data, a concept has been framed and an original decision-making model has been developed for an investment consisting in constructing a CCS installation in an existing power plant. A novelty of the paper is the presented proprietary decision-making model in conditions of uncertainty using the real options approach. Stochastic state variables are included in the model: the price of the CO2 emission allowance, the unit costs of capturing, transporting, storing and stockpiling CO2 and the unit costs of electricity generation. It is assumed that the time curves of the state variables are described by equations of geometric Brownian motions. The values of standard deviations in the equations are measures of uncertainty. The value of the retrofit option is defined as the maximum value from the expected net present value. From the dynamic optimisation equation, resulting from Bellman’s principle of optimality, it results that the retrofit option must satisfy the differential equation. The calculations were made for a specific, commercially applicable case of CCS technology in order to present the model’s capabilities. The analyses’ results and conclusions are presented.
1. Introduction
The investment process in the electric power industry, especially in the case of constructing a power plant, is encumbered with considerable uncertainty relating to the formation of both capital expenditures and the costs of electricity generation. Additionally, it is a multistage process. Decision calculus under uncertainty is a situation in which the distribution of probability of the financial consequences of a decision is unknown. Solving a decision-making problem under uncertainty usually comes down to the determination of the subjective probability of an event taking place which consists in the occurrence of a concrete financial consequence. A decision to make an investment or to withhold and delay it should be considered a continuous process. Detailed market research on investment provides the basis for making a decision or else identifies risks which discredit an investment opportunity. When planning investments, capital expenditures can be estimated fairly accurately, but if an investment is related to a new technology, it is not so obvious. In contrast, prices, costs and the discount rate, that is, factors affecting the value of future cash flows, are encumbered with uncertainty. The presented decision-making model, using the so-called real options approach [1,2,3] methodology takes into account uncertainty relating to the formulation of future cash flows.
The increase in prices of carbon dioxide emission allowances under the Emissions Trading Scheme (ETS) in the last few months of 2021 to the level of approx. EUR 90/t CO2 increases the costs of electricity generation in conventional power plants. The Directive 2009/31/EC called CCS Directive required suitable space on the installation site for the equipment necessary to capture and compress CO2 in newly built combustion plants with a rated electrical output of 300 megawatts or more. This approach assumes the possible retrofit for post-combustion CCS installations. An investment project for constructing a CCS installation in an existing power plant encumbered with the costs of purchase of carbon dioxide emission allowances is analyzed.
The article presents a decision model concerning the use of only the CCS technologies in fossil fuel power plants, because economic data of commercially realized projects are available for CCS technologies. On the other hand, CCU technologies are at the stage of advanced trials of commercial applications, so in the future it will also be possible to introduce CCU technologies into model analysis.
2. Reducing Carbon Dioxide Emissions
2.1. General Description of Ways to Reduce Carbon Dioxide Emissions
Carbon dioxide is the most significant greenhouse gas, responsible for the greenhouse effect. The combustion of organic fuels is the most significant source of anthropogenic CO2 emissions. The increase in the carbon dioxide concentration in the atmosphere makes it necessary to halt the increase in CO2 emissions, and then to consistently reduce them. It is difficult to reach a global consensus in the concretisation of actions, their schedule and financing methods. There are many discrepancies in this respect.
Reducing CO2 emissions can be carried out in many ways, the most important of which are the following: saving energy, particularly electricity, increasing the efficiency of electricity and heat generation, replacing low-hydrogen fuels with more noble, high-hydrogen fuels (e.g., natural gas, crude oil) or using nuclear energy or energy from renewable sources, and capturing CO2 from flue gases and storing it. Carbon capture and storage (CCS) and carbon capture and utilization (CCU) are two concepts for reducing emissions. There are some similarities between CCS and CCU because they both need technology to capture CO2 and either store it permanently (CCS) or utilizing it by converting it into fuels and chemicals (CCU). CCS technologies are already well recognized and commercially used, while CCU technologies are in the phase of advanced demonstration projects and will become dominant in the near term. Currently, eighteen CO2 capture installations are in operation in the world, capturing about 40 Mt CO2 per year.
Now, many methods have been technically mastered for capturing CO2 from flue gases, the so-called CCS-CO2 Capture and Storage technologies [4,5,6,7]. The high costs of CCS installations limit their wider use on an industrial scale. In commercial applications, one of the most promising is the chemical absorption method with monoethanolamine (MEA) used as an absorber. The cost of a CO2 reduction in flue gases by 90% is estimated to be approximately USD20/(MW·h) [4].
Due to the high costs of methods for capturing CO2 from flue gases and the difficulty of storing and stockpiling CO2, there is growing interest in other methods for reducing CO2 emissions, namely in oxygen coal gasification processes. A significant advantage of this process is the quantity of synthesis gas produced, which is almost three times less than that of flue gases in the event of combustion of coal. The application in the gas generator of pressure in the order of 20–60 bars further reduces the volume of compressed gas in relation to flue gases in the conventional coal combustion process. The conversion of carbon monoxide with water vapour occurs in accordance with the reaction CO + H2O → H2 + CO2. This is a significant advantage of coal gasification, as carbon monoxide accounts for approx. 65% of synthetic gas. The products of carbon monoxide conversion are mainly hydrogen, which is a hydrogen fuel, and carbon dioxide. The coal gasification reaction is a strongly endothermic reaction and requires as much as 131.0 kJ/mol of energy. The additional energy can be obtained only from burning an appropriate amount of coal in the deposit. The use of coal gasification in integrated gasification combined cycle (IGCC) installations results in a reduction of CO2 emissions [4].
In recent years, the ZECA (Zero Emission Coal Alliance) technology has been developed in the USA. It is a hydro gasification process consisting in oxygen-free high-temperature gasification of coal with hydrogen. The hydro gasification reaction occurs in accordance with the equation C + 2H2 → CH4. The reaction’s output product is methane. A stream of methane is introduced together with water vapour into a carbonating column filled with calcium oxide. In the carbonating column the chemical reactions described with the equations CH4 + 2H2O → CO2 + 4H2 and CaO + CO2 → CaCO3 occur. This produces pure hydrogen, part of which can be used in fuel cells. The ZECA technology may be regarded as a technology of the future with great potential for use on an industrial scale.
The basic directions for the development of so-called zero-emission technologies in conventional power plants are methods of separating carbon dioxide from flue gases and oxy-combustion. Among CO2 separation technologies, absorption, adsorption, membrane separation and cryogenic separation processes are well-known. Methods that are well-recognised and successfully applied in the chemical industry are chemical absorption processes. High hopes are also pinned on membrane separation technologies. Each of the methods for reducing CO2 emissions increases the power plant’s investment and operating costs. For design calculations, the IPCC provides prices in terms of capital expenditures, as presented in Table 1 [4].

Table 1.
Investment costs of selected technologies with different carbon dioxide removal techniques in EUR/kW. Source [4].
The CCS (Carbon Capture and Storage) technologies are now refined enough in terms of carbon dioxide capture that they can be applied commercially. Practically, however, when analysing the addition of an installation in an existing power plant, it appears that primarily the amine absorption technology is commercially available and suitable for power plants fired with solid fuels. However, long-term underground storage of carbon dioxide on a large scale arouses concern, and the basic problem is the location of a suitable site for stockpiling CO2. An effectively operating CCS installation in a modern conventional power plant can reduce CO2 emissions by approx. 90%. This entails an increase in an amount of energy for capturing and compressing CO2, which in turn causes an increase in fuel consumption by approx. 11 ÷ 40%. In [4] it is estimated that a CCS installation causes an increase in the cost of electricity generation by approx. 21 to 91% depending on the technology and the distance of a power plant from the CO2 storage site. A CO2 storage and stockpiling site can be e.g., shut mines, including depleted natural gas deposits and depleted oil fields, or other underground reservoirs (e.g., injection of CO2 into a brine deposit). The IPCC in [4] estimates the global CCS technology potential in the horizon up to the year 2100, indicating the possibilities of reducing total CO2 emissions by approx. 10 to 55%.
Capturing and compressing carbon dioxide requires considerable amounts of energy, resulting in a significant increase in the operating costs of a power plant fitted with a CCS system. Constructing a CCS installation causes an increase in a power plant’s investment costs and financial encumbrances. The use of oxy-combustion or coal gasification has a similar effect. The estimated costs of electricity generation in basic types of power plants with and without CCS technologies, based on the IPCC’s report, are shown in Table 2.
Table 2.
Estimated electricity costs with and without the CCS technology (2002 USD/(kWh)). Source: [4].
The above cost estimates (Table 2) are for modern major commercial power plants assuming the price of natural gas of 2.80 to 4.40 USD/GJ and the price of coal of 1.00 to 1.50 USD/GJ (currently these prices are much higher). Stockpiling CO2 by applying the EOR (Enhanced Oil Recovery) technology makes it possible to extract an additional amount of crude oil from the deposit, which in consequence generates additional revenues in which the electricity generator can participate. The improved efficiency of the EOR technology is influenced by higher prices of natural gas and crude oil today compared to 2002.
The type of a power plant and the electricity generation technology determine the amount of energy required to capture CO2. In a conventional power plant with a supercritical pulverized-fuel boiler (FSB PC), the energy consumption is higher by approx. 24 to 40%, in a natural gas power plant with a combined cycle (CCGT), it is an increase in the range of 11 to 22% and in a gas and steam power plant with coal gasification (IGCC) in the range of 14 to 25%.
A similar analysis of carbon capture costs was performed by the IEA in 2006 [8], and updated in 2020 presenting the results in a US Energy Information Administration report [9]. A comparison of the different technologies is presented in Table 3. The cost includes the cost of compressing CO2 to 110 bars, but does not include the cost of transporting and stockpiling CO2.
Table 3.
Comparison of cost for different capture technologies for coal-fired power plants (Source: [9]).
The continuation of the US EIA research [9] includes an analysis of several specific investments in electricity sources with the parameters presented in Table 4. Unit capital expenditures have increased compared to the previously presented cost estimates.
Table 4.
Comparison for USC coal-fired power plants without and with carbon capture (Source: 9).
Hydrate-based gas separation has great potential among the methods of capturing CO2 from flue gas. In the studies presented in [10,11], hydrate-based gas separation (HBGS) (19.96 mol% CO2 and 80.04 mol% N2) was used to capture CO2 from flue gases. A gas separation mechanism reinforced with mixed additives could soon be an effective technology.
CCU technologies are processes related to the capture of CO2 for further use, such as conversion into polymers. Other technologies investigated are mineralization to sequester CO2 in a permanent, stable form. Building materials are produced in the mineralization processes. Technology E-fuels convert CO2 into gaseous or liquid fuels to provide and use renewable energy in traditional proven technology.
The methanation reaction converts carbon monoxide and/or carbon dioxide into methane [12]. In present times, methanation is revamped in many syngas and carbon dioxide projects.
2.2. CCS Technologies
CCS technologies can be divided into three basic categories: CO2 capture after combustion, before combustion, and oxy-combustion of fuel [6,7,13].
CO2 capture from flue gases in a power plant is the post-combustion technology, one of the best recognised technologies, usually after pilot trials. The most popular technology is the separation of CO2 from flue gases by absorption by applying an aqueous amine solution such as monoethanolamine MEA. There are considerable expectations regarding the application of membrane processes to CO2 capture from flue gases. Cryogenic methods and adsorption processes are of lesser significance in power plant applications.
A technology of reducing CO2 emissions before the combustion process can be applied commercially in power plants. In a power plant, both the coal gasification technology and the oxy-combustion technology can be used. As a result of the partial oxidation of fuel, synthetic gas is produced (CO and H2) which is converted to carbon dioxide CO2 and hydrogen H2. As a result, CO2 is easy to separate in a stream of synthetic gas. In this way carbon, or rather CO2, was captured before combustion, whereas the product is hydrogen, which can be used as a fuel.
In the oxy-combustion process, the fuel is burned in oxygen rather than in atmospheric air. In the process, the cooled flue gases recirculate into the furnace chamber, reducing the combustion temperature to a level typical at conventional combustion. The composition of the flue gases is mainly carbon dioxide and water vapour. The water vapour is condensed in the cooling process. As a result, an almost pure stream of carbon dioxide is obtained which, once compressed, can then be transported to a storage and stockpiling site. Power plants employing the oxy-combustion are called zero-emission ones because in this technology carbon dioxide is a stream of flue gases, rather than a fraction captured and separated before or after the combustion process. In the vapour condensation process, a small proportion of carbon dioxide is fixed with water. The main limitation, and often a barrier, to the application of oxy-combustion is the considerable amount of energy to obtain oxygen.
For carbon dioxide capture, CCS technologies can now be used commercially. The application of CCS in a modern conventional power plant will enable a reduction of CO2 emissions by approx. 80 ÷ 90% [4]. The problem is CO2 storage on a large scale. Currently, underground reservoirs (e.g., shut mines, depleted or exploited natural gas deposits and oil fields) and brine deposits are used as storage sites. Storage using the EOR (Enhanced Oil Recovery) or ECBM (Enhanced Coal Bed Methane) technologies is beneficial.
A CCS technique that will be able to be applied at combustion in a fluid bed is the CLC (chemical looping combustion) technique, which is in the phase of technological trials [14]. The method uses metal oxides which, after being introduced into a fluid bed, react chemically with the fuel, forming solid metal particles and a mixture of carbon dioxide and water vapour as a result. Water vapour is condensed and carbon dioxide can be sequestered. The metal particles are oxidised in another fluid bed whose main purpose is to produce heat and regenerate metal oxides. The metal oxides are reintroduced into the CLC process.
Capturing and compressing carbon dioxide requires considerable amounts of energy, resulting in a considerable increase in the operating costs of a CCS-fitted power plant. Furthermore, CCS installations increase the investment and financing costs of a power plant. Owing to very little operational tests, it is difficult to have accurate technical and economic data on the CCS technology. The construction of pilot, large power plants with CCS systems or the modernisation of existing power plants should verify the data published. The issues relating to constructing CCS installations and to carbon storage are regulated by Directive 2009/31/EC [15]. For the technical and economic analyses in the remainder of the article, the data from both the IPCC report [4] and the US EIA study [9] have been used. The wide ranges of values of the quantities presented in [4,9] are indicative of their uncertainty.
The costs of CO2 capture depend on the electricity generation technology. An analysis of the costs of CO2 capture in conventional power plants indicates that one of their main components is the cost of compressing CO2 to a pressure of approx. 14 MPa, which is suitable for transport via gas pipelines or for rail transport by tankers. The capture costs are estimated in [4] by giving fairly wide ranges, e.g., 18–34 USD/(MW·h) for a conventional power plant with pulverised-fuel boilers FSB PC, 9–22 USD/(MW·h) for a gas and steam power plant with coal gasification IGCC, 12–24 USD/(MW·h) for a natural gas power plant with a combined cycle CCGT. The costs of transport and storage are estimated similarly at approx. 0.5–6 USD/(MW·h) for coal power plants and approx. 0.5–3 USD/(MW·h) for gas power plants. It is difficult to estimate the costs of underground stockpiling of CO2 in brine formations or depleted gas and oil fields, which are in the range of 0.5–8.0 USD/t CO2.
Table 5 shows the key figures relating to the costs and reduction of CO2 emissions for the basic electricity generation technologies.
Table 5.
Costs of electricity generation with and without CCS technologies and CO2 emission reduction factors for coal power plants and gas power plants. Source: [4].
3. Price of Electricity and Price of CO2 Emission Allowances
When analyzing the market situation of power plants in Poland, both the price of electricity on the wholesale energy market (HRE) and the price of CO2 emission allowances should be taken into account. In recent years, an increase can be observed in both the price of electricity on the HRE, a price obtained by hard coal and lignite power plants, and the cost of its production (Figure 1). A significant factor in the increase in the cost of electricity generation, and consequently in the price of electricity on the HRE, is an increase in the price of CO2 emission allowances (Figure 2). In the last month of 2021, the price of allowances was recorded at 90 EUR/t CO2.
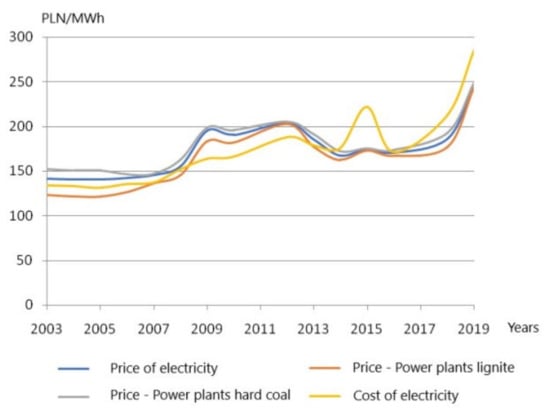
Figure 1.
Price of electricity on HRE and cost of electricity in PLN/MWh (Source: own work based on data from [16]).
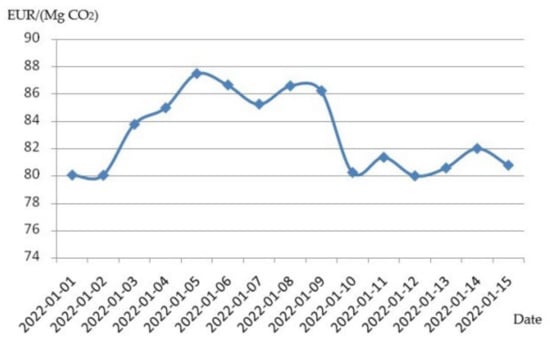
Figure 2.
Settlement price of CO2 emission allowances (Source: own work based on data from [17]).
The volume-weighted average price on the DAM Day-Ahead Market in May 2021 was at the level of PLN 300.62/(MW·h) (approx. EUR 65/(MW·h)), and this is an increase by PLN 24.42/(MW·h) compared to the previous month and the first case in the history of the Polish Power Exchange (TGE) when the monthly price of the DAM exceeds PLN 300/(MW·h). But the average price weighted by the trading volume on the DAM was formed in November 2021 at the level of PLN 552.40/(MW·h) (approx. EUR 120/(MW·h). The pattern of the electricity price and sales volume for the selected day is presented in Figure 3.
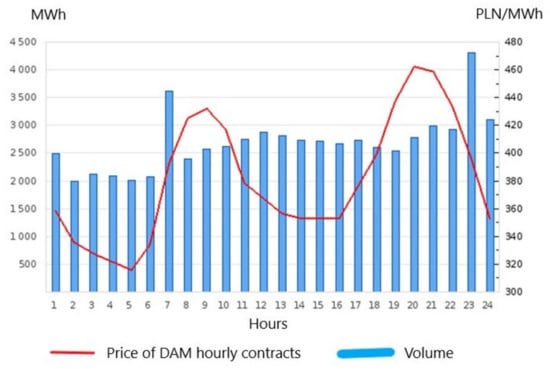
Figure 3.
Prices and volumes of energy on the TGE as on the delivery day on 16 June 2021. FIXING I-DAM hourly contracts (Source: own work based on data from [18]).
The pattern of the electricity price on the DAM reflects the daily variability of the load in the Polish power system. The lower prices correspond to periods of load valleys and the highest prices occur during the period of the peak load (the morning and evening peak).
4. Dynamic Optimization-Markov Process with Continuous Time in a Decision-Making Model for Investment under Uncertainty
Decisions under uncertainty are involved when at least one parameter in the task is a random variable with an unknown distribution. Decisions under uncertainty are reduced to tasks under risk by assuming or approximately estimating the form of distribution of such random variables on the basis of historical date.
The result of an investment decision under risk is the occurrence of an event with a certain probability assigned to it [19,20,21]. A stochastic Markov process can be used to describe the decision-making process under risk [1]. This is a process in which the conditional distribution of a random variable for a given state depends only on the previous state. Markov processes are defined both on a discrete space of states (then they are called a Markov chain) and on a space of states with continuous time. An example of a Markov process with continuous time is the Wiener process. This is a special case of the Brownian motion model, the so-called diffusion equation. The set of values of random variables in the Wiener process is assumed to have a normal distribution.
Making a decision to invest under risk entails various financial consequences (profit or loss) which depend on the realization in the future of one of the possible states, understood as the realization of the process within the assumed time horizon. In the model it has been assumed that the distribution of probability of the occurrence of certain states is known and that it is a normal distribution in the Wiener process. The defined states have been equated with options in the real options approach method under uncertainty, and the NPV indicator has been taken as the objective function. The decision-making variable is the time of commencement of operation of the investment that is the subject of the decision-making process. The solution to the decision-making problem posed in this way is to choose a sequence of decisions which maximizes the objective function’s expected value. In this article, we are dealing with just such a presentation of a decision-making problem for an investment in the electric power industry consisting in constructing a CCS installation in a conventional coal power plant. In dynamic optimization, the maximum value from the expected value of the NPV (net present value) indicator of the investment is sought.
A detailed description of the theoretical basis of the real options approach method can be found in [1,2,5,22,23,24] and the basis of the investment decision-making model in [25,26,27,28,29,30,31,32].
5. Theory of Real Options Approach
The problem of uncertainty and investment risk management in the electric power industry is described in detail in numerous publications, e.g., [33,34]. Uncertainty relating to the state of environment of an investment project can lead to incorrect decisions. Structured programming is used to solve this problem.
An interesting method of a probabilistic approach to the valuation of investments in manufacturing is proposed in [21], using Monte-Carlo simulations. The method uses total discounted costs, the so-called levelized cost of electricity (LCOE). The traditional approach using determinism does not describe the qualities of a liberalized electricity market very well. Probabilistic methods using investment risk assessment methods are a better approach.
The real options theory (real options approach) is a modern theory relating to making investment decisions when the future is uncertain. The real options theory presents parallels between the evaluation of available financial options and the real economy. This theory has become a popular research topic in most institutions of higher education economics departments around the world, as well as in companies, including energy companies.
In the business world, a ‘real option’ is a choice available to a company in relation to an investment opportunity. The term ‘real’ means that it refers to a fixed asset, and not to a financial instrument.
An example of real options is determining whether to construct a new factory, change the machinery and technology on the production line, etc. The real options approach method in principle does not cover derivative financial instruments, such as shares or bonds.
The investment opportunities we have in the case of tangible assets are similar to those which exist in the case of financial instruments. In theory, tangible (real) assets can be valued using the same methodology.
The real options theory is a major new framework in the theory of making investment decisions. It modifies the NPV (Net Present Value) theory of investment decisions. The NPV theory states that the future cash flows from an investment project are estimated, and if there is doubt about those cash flows, their expected value is determined.
The expected cash flows are discounted at the cost of capital for the company and the results added up. If the NPV amounts to zero, it does not matter to the company whether the project is approved or rejected. If it is greater than zero, the NPV theory tells us to continue with the project.
The real options approach assumes that companies have a certain choice of when to invest [22,30]. In the project, an opportunity (option) exists which, however, is not an obligation. Investors should not always invest as soon as their project has an NPV value of zero or slightly above zero, as it would usually be better to wait until the circumstances are even more favorable [19,24].
A commonly used method of decision-making calculus that takes uncertainty into account is the so-called real options approach [1,2,3,20,22,24,25,26,27,28,29,30]. Making the decision is based on the conclusions resulting from patterns of randomly varying revenues. The method assumes an irreversible nature of the investment, and the most important quality of the decision-making process is that the investor can postpone making the decision to invest and, during the waiting period, obtain information which reduces investment uncertainty. Decision-making processes in the electric power industry are characterised by the above qualities, especially for costly investments in electricity generation. The investor’s decision-making behaviours are in the nature of a continuous process over time, as the investor makes the decision to invest, starts to invest, and sometimes withdraws from an investment at any point in time.
In the investment planning process, the investor takes into account uncertainty about prices, costs and the discount rate [33]. In further consideration, uncertainty about the formation of future investment revenues and costs is taken into account in the decision-making models presented. In [3], an investment consisting in constructing a power plant has been analysed, taking into account different electricity generation technologies. The models take into account, for example, abrupt changes of revenues.
The classic investment criterion using the cash flow discount calculation can be reduced to an examination of whether the NPV net present value indicator is greater than zero, that is, whether the inequality NPV > 0 exists. Given the definition of the indicator NPV = V − I, it can be examined whether the project’s present value V exceeds the value of the capital expenditure I, that is whether the inequality V > I exists. The definition of the project’s threshold (critical) value V*, above which it is profitable to make the investment, results from the above inequality. In classic financial calculus, the threshold value amounts to V* = I. Taking uncertainty about an investment project into account in decision-making models is supposed to lead to the minimization of investment risk [1,2,3].
This paper uses the methodology presented in [1,2], with the designations and formulae being identical to those in [1]. The real options approach methodology has been extended by building the author’s models in [3]: the competition-sensitive model, the so-called multiple abrupt change model, and the SRP/MA and MRP/MA reversion models. The methodology to analyze investments in the electric power industry has been used, and the model applications have been described in our own works [25,26,27,31,32].
6. Decision-Making Model for Investment in CCS Installation under Uncertainty
Emissions and release trading regulations will force power plants to change and comply with the requirements, using technical means to reduce emissions. European Union requirements stipulate the necessity of reserving space for future fitting of CCS installations in newly built facilities and the successive upgrading of power plants [15]. The model assumes that power plants can take two strategies: passive or active. In the passive strategy, a power plant makes no investment in a CCS installation, continues to emit CO2 at unchanged levels and will accept environmental charges and the purchase of CO2 emission allowances. Undoubtedly, this strategy is justified in the case of power plants that have been in operation for many years, largely with depreciated machinery.
The alternative is to avoid the cost of purchasing allowances by reducing emissions. This can be achieved by modernizing power plants and constructing carbon dioxide capture and sequestration installations. In the model, power plants are charged not only with the operating costs of capture, but also with the costs of transporting, storing and stockpiling CO2. Both of these strategies, the passive and the active one, require bearing certain costs that are difficult to predict during the period of the future operation of the plant.
The power plant, operating under uncertainty, should choose the optimal solution. The purpose of the model is to decide on the optimum strategy to be adopted by an electricity generator seeking to minimise the financial encumbrances on ground of carbon dioxide emissions into the atmosphere, operating within the regulatory framework to this end. The model uses the PV (Present Value) present value optimisation criterion, determined on the basis of the expected costs for strategies possible to be applied by a power plant.
Stochastic state variables are included in the model: the price of the CO2 emission allowance (denoted cu), the unit costs of capturing, transporting, storing and stockpiling CO2 (denoted kw) and the unit costs of electricity generation (denoted ke). It has been assumed that the time history diagrams of the above variables can be described by a special case of the Wiener process, which is the equation of geometric Brownian motions [1], the so-called diffusion equation with the following form:
where:
α—trend coefficient for the price or unit cost,
σ—standard deviation,
dz—increment of Wiener process, ,
—random variable with a normal distribution, an expected value equal to 0 and a standard deviation equal to 1.
In the formulae (1), the values of standard deviations are a measure of uncertainty and, at the same time, of the risk of formation of future values of prices and costs σ.
The correlation has been assumed between the random variables z:
where:
ε—expected value operator,
ρ—correlation coefficient.
New variables have been determined
where:
μ—rate of return with risk estimation taken into account.
In the third phase of the EU Emission Trading System (EU ETS), from 2013 to 2020, the EU-wide cap for stationary installations decreased each year by a linear reduction factor of 1.74%. The cap for 2013 was determined on the basis of the average total number of allowances issued annually in the years 2008–2012. Since 2021, around 57% of the EU-wide CO2 emissions cap is auctioned and the rest is made available free of charge. In Phase 4 of the EU ETS (2021–2030), the emissions limit continues to decrease each year, with an increased annual linear reduction factor of 2.2%.
It was agreed that from the beginning of the third phase of the EU ETS, i.e., since 2013, allowances should no longer be allocated free of charge to power plants, which should buy all allowances at auctions (or on the secondary market). However, to help modernise the electric power sector, the 10 new member states, including Poland, were given the opportunity to obtain temporary exemptions from the “full auction” rule and continue to allocate a limited number of emission allowances to power plants for free until 2019. This option was introduced as part of the broad compromise on the so-called “climate and energy package” reached by the Council and the European Parliament.
In light of the above, a power plant implementing the passive strategy continues to emit CO2 at an unchanged level. This necessitates the purchase of emission allowances on the exchange. The expected present value of a stream of the cost of purchase of allowances during the operation life of Ne years is expressed by the following formula:
where:
—CO2 emissions factor without CCS installation,
—electricity production in year t in power plant,
The formula (4) uses the continuous discounting method presented in [1]. The value described by Equation (4) is taken as the reference option with which the option of installation of CCS will be compared.
The installation of CCS in a power plant involves an upgrade capital expenditure of Km. When analysing the feasibility of installing CCS, it has been assumed that the decision on this upgrade is made at any point in time t during the period . Then the expected value from the current value of a stream of savings after installing the CCS system during the period from t to Ne will be:
where:
η—efficiency of the CCS installation,
—additional energy of the CCS installation’s own needs.
The first component on the right-hand side of Equation (5) is a discounted positive cash flow because these are avoided costs, or more precisely they are the discounted cash flow of costs avoided on grounds of unpurchased CO2 emission allowances. The remaining components of discounted cash flows are negative because they are additional costs. The second component of cash flows is discounted additional expenditure for CO2 capture and storage. The last component of Equation (5) is discounted costs of additional energy of a CCS installation’s own needs.
The value of the upgrade option is defined as the maximum value from the expected net present value [1]. The net present value is the difference between the present value and the capital expenditure. Hence, the upgrade option is:
where:
ε—expected value operator.
From the dynamic optimisation equation [1,24,25], resulting from Bellman’s principle of optimality, it results that the upgrade option must satisfy the following differential equation:
with the boundary conditions:
where:
r—discount rate.
The asterisk * indicates a critical (threshold) value.
The numerical solution of Equation (7) is the time history diagram of the optimal investment option. In this paper, the presented model will be used in order to determine the threshold value of the price of an allowance at the instant t = 0, at which it is profitable to immediately upgrade by constructing a CCS installation.
Taking into account Equation (4), that is discounted costs of purchase of allowances for the passive strategy, and Equation (5) describing discounted flows of constructing a CCS installation for the time instant and adding the cost of upgrading a power plant, the present value will be:
By comparing the present values of the passive and active options (Equations (4) and (9)), the threshold value can be determined above which the upgrade option is viable.
Basic data for a conventional power unit with FSB PC pulverised-fuel boiler with and without a CCS system are presented in Table 4 (source [8]). Consideration was held for a conventional power unit with a pulverised-fuel boiler USC FSB PC–UltraSupercritical Fossil Steam Boiler, Pulverized Coal, the fuel is hard coal [8], with the installed net capacity = 650 MW. The calculations were carried out for two cases of modernization consisting in the construction of a CCS installation with the efficiency of 30% (case 1) and 90% (case 2) of carbon dioxide capture. The gross capacity of the power unit should be = 769 MW in the case of 30% carbon capture and = 831 MW in the case of 90% carbon capture. For a unit without CO2 capture, the emission factor is = 762 kgCO2/(MW·h) (Table 5). The degree of exploitation of the power unit has been assumed equal to = 0.7, hence the installed capacity utilisation time will be equal to = 6132 h/a, and the annual electricity production is = 5095.7(GW·h)/a. The possibility of installing a CCS system is being contemplated. The unit and the CCS system operation life has been assumed to be = 50 years. For the CCS system with 90% carbon capture (the post-combustion method, absorption by applying an aqueous solution of monoethylamine MEA) the emission factor with the CCS system is = 76.2 kgCO2/(MW·h). Due to the difficulties in finding a location for CO2 storage, the costs of capturing, transporting and storing CO2 have been assumed as = 40 USD/(MW·h). The upgrade investment cost Km has been estimated based on the difference in the capital expenditure with CO2 capture and without CO2 capture.
The calculations have assumed: (i) a CCS system can be built within one year, (ii) price and cost increment rates are αu = αe = 0.05, whereas anticipated progress in the CCS technology development reduces the capture and storage cost, hence αw = −0.01, (iii) a discount rate equal to r = 8%, and rates of return of have been adopted.
While analysing the influence of the discount rate on the results, calculations were made for variant values of the discount rate. The discount rates of 6%, 8% and 10% were assumed, and the results are presented in Table 6. The most popular method of estimating the discount rate when discounting cash flows for the investment project is the cost of equity. This cost is the sum of the risk-free rate and the industry risk premium. Without going into details, it can be assumed that a higher value of the discount rate characterizes a situation of increased investment risk on the market. This is how the results presented in Table 6 can be interpreted. Greater risk on the market forces the investor to be cautious and make a decision about investing with higher threshold values of CO2 emission allowances.
Table 6.
The threshold values of the price of a CO2 allowance.
The pattern of the value as a function of , determined in accordance with Equation (4) and the pattern of the value as a function of , determined in accordance with Equation (9) has been plotted in the demonstration Figure 4 and Figure 5. The above present values have been calculated for the discount rate r = 8%. The point of intersection of the two patterns determines the threshold value of the price of a CO2 allowance.
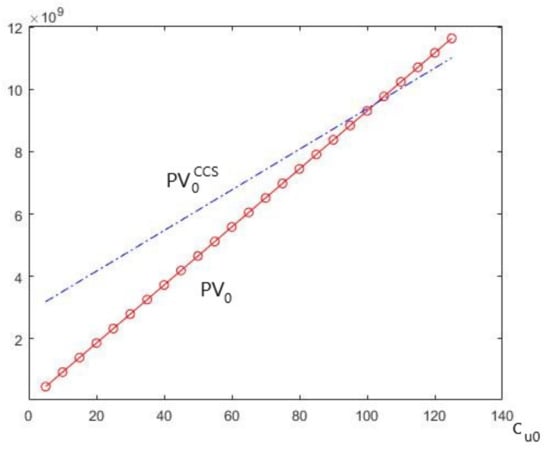
Figure 4.
Threshold value of price of CO2 emission allowance determined based on patterns of and for r = 8% for the case 1 (30% carbon capture) (Source: own work).
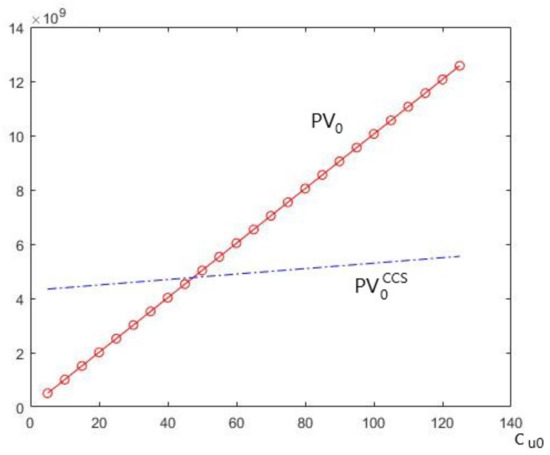
Figure 5.
Threshold value of price of CO2 emission allowance determined based on patterns of and for r = 8% for the case 2 (90% carbon capture) (Source: own work).
At present, the price of an emission allowance on European exchanges is approx. 80 EUR/tCO2, which at current exchange rates corresponds to 90.6 USD/tCO2. Figure 4 shows the threshold value 103 USD/tCO2 in case 1 (30% carbon capture), whereas Figure 5 the threshold value 48 USD/tCO2 in case 2 (90% carbon capture). In view of the increasing trend in the price of emission allowances, the designated threshold values indicate a possible potential for the use of CCS technology on a commercial scale.
The impact of the assumed values of the discount rate on the results of the model is extremely significant. To estimate the value of the discount rate in financial analyses, it is possible to use, for example, the capital asset pricing model (CAPM), the Sharpe ratio or arbitrage pricing theory (APT).
Taking into account the difficulties in locating CO2 storage sites, the model in future studies will be adapted to the analysis of the carbon capture and utilisation (CCU) technology. The CCU technology converts CO2, for example, into polymers. The power plants with CCU technology can eliminate almost all of the carbon dioxide they produce. It is possible to achieve zero-carbon emission processes.
7. Discussion and Conclusions
The transformation of the Polish energy industry, but also of many countries in Europe and in the world, within the decarbonisation framework is necessary, but political decisions have been made at a slow pace. The Fit for 55 package imposes a significant reduction of CO2 emissions by the EU member states. This challenge causes the construction of conventional power plants with CCS installations or the upgrade of existing power plants and the addition of CCS installations can be contemplated as one strategy to reduce CO2 emissions. CCS technologies have already been sufficiently developed that there will be no problem with their commercial use. However, the issue of stockpiling carbon dioxide and locating CO2 storage sites remains a fundamental problem. Even after finding a geologically suitable CO2 storage site, it is difficult to overcome the reluctance of local communities.
The European Emissions Trading Scheme (ETS) is an economic tool for stimulating environmentally friendly actions, and one of the elements stimulating the decarbonisation of the European electric power industry. The very sharp increase in the price of carbon dioxide emission allowances on the European market has inspired research to develop a decision-making model for an investment aimed at reducing CO2 emissions in a power plant. The investment consists in an upgrade in which constructing a CCS installation is assumed. Threshold values of the value of the price of a CO2 emission allowance have been set, above which it may be beneficial and economically viable to implement a power plant upgrade. The obtained threshold values of the price of an emission allowance for a conventional power plant are no higher than the current price on world exchanges, which is indicative of the cost-effectiveness of constructing a CCS system using the technology of CO2 capture from flue gases in a scrubber with a MEA solution.
The decision-making model assumes the operation of a power plant in an environment encumbered with uncertainty. Changes in the system of ETS emissions trading functioning are difficult to predict. The process of formation of prices of energy carriers and electricity, which have a direct impact on the revenues and costs of power plants, is characterised by a similarly high degree of uncertainty.
The threshold value of the price of an allowance is primarily influenced by the estimated cost of capturing, transporting and stockpiling CO2. Progress in the development of CCS technology in the coming years and a reduction in its costs may further beneficially influence the decision to construct a CCS installation. The results of the calculations may be similarly influenced by possible changes in the system of emissions trading functioning.
The model is sensitive to technical and economic data estimates. The impact of the discount rate on the estimates of the threshold values of the price of a CO2 allowance for two cases of technical estimates is presented in Table 6. Apart from the technical data, the estimates are also influenced by the assumed operating period of the power plant with the CCS installation. Therefore, the presented results are only exemplary calculations, and each real investment requires in-depth analysis of the estimates of the adopted model input data.
This article uses and extends the methodology of investment analysis under conditions of uncertainty. In most applications, the option approach was mainly used in financial analysis for the valuation of derivatives, in models for the term structure of interest rates. The methodology was adapted to the analysis and modelling of investments in the power industry, and in this article it was developed with the proprietary model and used to analyse the modernization of CCS installations in a power plant.
Funding
This research received no external funding.
Institutional Review Board Statement
Not applicable.
Informed Consent Statement
Not applicable.
Data Availability Statement
Not applicable.
Conflicts of Interest
The authors declare that they have no conflict of interest.
References
- Dixit, A.K.; Pindyck, R.S. Investment under Uncertainty; Princeton University Press: Princeton, NJ, USA, 1994; pp. 135–199. [Google Scholar]
- McDonald, R.; Siegel, D. The Value of Waiting to Invest. Q. J. Econ. 1986, 101, 707–728. [Google Scholar] [CrossRef]
- Sowiński, J. Investing in the Production of Electric Energy in the Market Conditions (In Polish), Inwestowanie w Źródła Wytwarzania Energii Elektrycznej w Warunkach Rynkowych; Wydawnictwo Politechniki Częstochowskiej: Częstochowa, Poland, 2008. [Google Scholar]
- Metz, B.; Davidson, O.; de Coninck, H.C.; Loos, M.; Meyer, L.A. (Eds.) IPCC Special Report on Carbon Dioxide Capture and Storage; Cambridge University Press: Cambridge, UK; New York, NY, USA, 2005. [Google Scholar]
- Sowiński, J. Perspectives of carbon capture and storage technologies in power plants (In Polish), Perspektywy wykorzystania technologii CCS w elektrowniach. RynekEnergii 2009, Nr II (IV), 122–127. [Google Scholar]
- Finney, K.N.; Akram, M.; Diego, M.E.; Yang, X.; Pourkashanian, M. Chapter 2—Carbon capture technologies. In Bioenergy with Carbon Capture and Storage; Magalhães Pires, J.C., Da Cunha Gonçalves, A.L., Eds.; Academic Press: Cambridge, MA, USA, 2019; pp. 15–45. ISBN 9780128162293. [Google Scholar] [CrossRef]
- Einloft, S.; Longaray Bernard, F. Chapter 6—Encapsulated liquid sorbents for CO2 capture. In Advances in Carbon Capture; Reza Rahimpour, M., Farsi, M., Amin Makarem, M., Eds.; Woodhead Publishing: Sawston, UK, 2020; pp. 125–150. ISBN 9780128196571. [Google Scholar] [CrossRef]
- International Energy Agency Report. CO2 Capture as a Factor in Power Station Investment Decisions; Report No. 2006/8; IEA: Cheltenham, UK, 2006. [Google Scholar]
- U.S. Energy Information Administration. Capital Costs and Performance Characteristics for Utility Scale Power Generating Technologies; U.S. Department of Energy: Washington, DC, USA, 2020.
- Cheng, Z.; Li, S.; Liu, Y.; Zhang, Y.; Ling, Z.; Yang, M.; Jiang, L.; Song, Y. Post-combustion CO2 capture and separation in flue gas based on hydrate technology: A review. Renew. Sustain. Energy Rev. 2022, 154, 111806. [Google Scholar] [CrossRef]
- Gambelli, A.M.; Presciutti, A.; Rosi, F. Review on the characteristics and advantages related to the use of flue-gas as CO2/N2 mixture for gas hydrate production. Fluid Phase Equilib. 2021, 541, 113077. [Google Scholar] [CrossRef]
- Tripodi, A.; Conte, F.; Rossetti, I. Carbon Dioxide Methanation: Design of a Fully Integrated Plant. Energy Fuels 2020, 34, 7242–7256. [Google Scholar] [CrossRef]
- Bandilla, K.W. 31—Carbon capture and storage. In Future Energy, 3rd ed.; Letcher, T.M., Ed.; Elsevier: Amsterdam, The Netherlands, 2020; pp. 669–692. ISBN 9780081028865. [Google Scholar] [CrossRef] [Green Version]
- Fennell, P. 1—Calcium and chemical looping technology: An introduction. In Calcium and Chemical Looping Technology for Power Generation and Carbon Dioxide (CO2) Capture; Woodhead Publishing Series in Energy; Fennell, P., Anthony, B., Eds.; Woodhead Publishing: Sawston, UK, 2015; pp. 3–14. ISBN 9780857092434. [Google Scholar] [CrossRef]
- Directive 2009/31/EC of the European Parliament and of the Council of 23 April 2009 on the geological storage of carbon dioxide and amending Council Directive 85/337/EEC, European Parliament and Council Directives 2000/60/EC, 2001/80/EC, 2004/35/EC, 2006/12/EC, 2008/1/EC and Regulation (EC) No 1013/2006 (Text with EEA relevance). Off. J. Eur. Union 2009, 2009, 114–135.
- ARE, S.A. Statystyka Elektroenergetyki Polskiej (Statistics of the Polish Power Industry); ARE S.A.: Warszawa, Poland, 2019. [Google Scholar]
- PSE. Settlement Price of CO2 Emission Allowances. Available online: https://www.pse.pl/web/pse-eng/data/balancing-market-operation/basic-price-and-cost-indicators/settlement-price-of-co2-emission-allowances (accessed on 10 December 2021).
- TGE. Electricity, Day-Ahead Market. Available online: https://tge.pl/electricity-dam (accessed on 17 June 2021).
- Botterud, A.; Ilic, M.D.; Wagensteen, I. Optimal Investments in Power Generation Under Centralized and Decentralized Decision Making. IEEE Trans. Power Syst. 2005, 20, 254–263. [Google Scholar] [CrossRef]
- Dixit, A.K. Investment and Hysteresis. J. Econ. Perspect. 1992, 6, 107–132. [Google Scholar] [CrossRef] [Green Version]
- Roques, F.A.; Nuttall, W.J.; Newbery, D.M. Using Probabilistic Analysis to Value Power Generation Investments under Uncertainty; Electricity Policy Research Group, University of Cambridge: Cambridge, UK, 2006. [Google Scholar]
- Rothwell, G.S. Electric Utility Power Plant Choice under Investment Regulation. Ph.D. Dissertation, Department of Economics, University of California, Berkeley, CA, USA, 1985. [Google Scholar]
- Sawhill, J.W. Evaluating Utility Investment Decisions: An Options Approach. Masters’s Thesis, Sloan School of Business, Massachusetts Institute of Technology, Cambridge, MA, USA, 1989. [Google Scholar]
- Herbelot, O. Option Valuation of Flexible Investments: The Case of Environmental Investments in the Electric Power Industry. Ph.D. Dissertation, Massachusetts Institute of Technology, Cambridge, MA, USA, May 1992. [Google Scholar]
- Sowiński, J. Critical price of sulphur dioxide emission allowances. Control Cybern. 2001, 30, 191–201. [Google Scholar]
- Sowiński, J. Economic efficiency of power generation investments under uncertainty and risk—A review of models of options approach. Przegląd Elektrotechniczny 2008, 2008, 74–79. [Google Scholar]
- Sowiński, J. Management of proecological investment projects in power plants in the stage of decision making process (in Polish), Zarządzanie na etapie podejmowania decyzji projektami inwestycji proekologicznych w elektrowniach. RynekEnergii 2011, 2011, 10–14. [Google Scholar]
- Hedman, K.W.; Gao, F.; Sheble, G.B. Overview of transmission expansion planning using real options analysis. In Proceedings of the 37th Annual North American Power Symposium, Ames, IA, USA, 23–25 October 2005; pp. 497–502. [Google Scholar]
- Martzoukos, S.H.; Teplitz-Sembitzky, W. Optimal Timing of Transmission Line Investments in the Face of Uncertain Demand: An Option Valuation Approach. Energy Econ. 1992, 14, 3–9. [Google Scholar] [CrossRef]
- Salazar, H.; Liu, C.; Chu, R.F. Decision Analysis of Merchant Transmission Investment by Perpetual Options Theory. IEEE Trans. Power Syst. 2007, 22, 1194–1201. [Google Scholar] [CrossRef]
- Sowiński, J. Assessment of the competitiveness of investments in the field of electricity generation under uncertainty (in Polish), Ocena konkurencyjności inwestycji w sferze wytwarzania energii elektrycznej w warunkach niepewności. Przegląd Elektrotechniczny 2006, 82, 89–91. [Google Scholar]
- Sowiński, J. Prices of carbon dioxide emission allowances and cost of the CCS systems in power plants (in Polish), Ceny uprawnień do emisji ditlenku węgla a koszty systemów CCS w elektrowniach. Polityka Energetyczna 2009, 12, 543–554. [Google Scholar]
- Jabr, R.A. Robust Self-Scheduling Under Price Uncertainty Using Conditional Value-at-Risk. IEEE Trans. Power Syst. 2005, 20, 1852–1858. [Google Scholar] [CrossRef]
- Shahidehpour, M.; Yamin, H.; Li, Z. Market Operations in Electric Power Systems: Forecasting, Scheduling, and Risk Assessment; Wiley: New York, NY, USA, 2002. [Google Scholar]
Publisher’s Note: MDPI stays neutral with regard to jurisdictional claims in published maps and institutional affiliations. |
© 2022 by the author. Licensee MDPI, Basel, Switzerland. This article is an open access article distributed under the terms and conditions of the Creative Commons Attribution (CC BY) license (https://creativecommons.org/licenses/by/4.0/).