1. Introduction
Since the reform and opening up, the process of accelerated urbanization and industrialization in China, characterized by the consumption of a large amount of resources and intensive exploitation, has made a gap between the limited energy resources, the carrying capacity of the ecological environment, and the sustainability of economic growth. This contradiction is becoming increasingly acute. China is now the world’s largest energy consumer. The serious energy constraints have become a bottleneck for China’s sustainable economic development in the future.
The externalities of energy resource exploitation and utilization are mainly reflected in resource depletion and environmental pollution [
1]. China’s energy resources, while considerable in the total amount, are relatively low per capita. By the end of 2019, China’s per capita possession of coal resources was 72% of the world average, while oil and natural gas resources were only 8% and 23%. Calculated based on the annual production in 2019, the remaining recoverable life of China’s oil, natural gas, and coal is only 18.7, 47.3 and 37 years, respectively. Due to the non-renewability and scarcity of fossil energy, the depletion of energy resources will eventually hinder economic growth. Another equally important issue is pollution reduction and environmental protection issues directly related to energy consumption. As the world’s largest carbon dioxide emitter, China is under increasing pressure from the international community to reduce emissions. China will strive to achieve a carbon peak by 2030 and achieve carbon neutrality by 2060, as announced by President Xi Jinping in the general debate of the 75th United Nations General Assembly held on 22 September 2020. The commitment to the “dual carbon” goal is closely related to the overall control of fossil energy consumption, which further reflects the importance of energy conservation and emission reduction.
In recent years, China has achieved remarkable results in energy conservation. Energy consumption per unit of GDP has fallen by 96.8% over the 40 years of reform and opening up. Nevertheless, the status quo of China’s extensive economic development and open energy consumption has not been fundamentally changed. During the “13th Five-Year Plan” period, China’s total fossil energy consumption increased by approximately 2.86 billion tons of standard coal, as compared with the “12th Five-Year Plan” period. Energy intensity constraints have reduced energy consumption per unit of GDP, but rapid GDP growth has increased energy demand. Local Chinese governments tend to stimulate economic growth by developing heavy industries. however, they often overlook the energy amount needed for development, whether its sufficient energy sources or its impact on China’s energy security and environmental quality. The demand for energy in China’s industrialization will greatly weaken the effect of energy intensity constraints on energy conservation and emission reduction. It is therefore necessary to shift from the previous energy intensity control to the “dual control” of total energy consumption and intensity. Since 2013, a series of energy policy documents issued by China’s State Council have intensively put forward requirements and targets for implementing total energy consumption control. During the “12th Five-Year Plan” period, China proposed to rationally control the total energy consumption. In the “13th Five-Year Plan” outline, this indicator was refined, meaning that the total national energy consumption in 2020 will be controlled within 5 billion tons of standard coal. In order to further contribute to the realization of the “dual carbon” goal, the “14th Five-Year Plan” adopted by the National People’s Congress in March 2021 once again emphasized “improving the dual control system of total energy consumption and intensity and focusing on controlling fossil energy consumption”.
In this context, total energy consumption control may produce two reversing mechanisms: reversing the energy transition and reversing the economic development transition. Under the mechanism of energy transition, the manufacturers will reduce the consumption of fossil energy, accelerate the innovation of green technology, and promote the low-carbon energy transition. Under the mechanism of economic development transformation, the adjustment of the behavior of manufacturers may cause the economic development mode to change from extensive to intensive, which further optimizes the industrial structure. However, some problems have been exposed in the implementation of total energy consumption control. For example, in September 2021, in some areas, measures are adopted such as power cuts and production restrictions, leading to suspicion from many parties for a while. Many media blame it entirely on the total energy consumption and intensity control by local government, which has caused the public’s misunderstanding of national policies. Therefore, it is particularly important to assess the impact of total energy consumption control on the macro-economy. There is currently no literature in which this question can be quantitatively answered. The unique contribution of this work is that in the context of the intensification of the global energy crisis and the international wave of carbon neutrality, based on historical data, this paper accurately measures the quantitative relationship between controlling total fossil energy consumption and the macro- economy, which is an innovation in theory. In addition, it can help us choose optimization measures to control the total energy consumption based on China’s current economic development, and accurately monitor and grasp the effective implementation of the energy “dual control” policy from a macro-perspective, which is of reference value. The global energy crisis has been triggered by a surge in energy prices as a result of shortages in some forms of energy, including crude oil, coal and natural gas, due to COVID-19, excessive liquidity and climate change. In this new situation, power shortages occur frequently around the world. In the second half of 2021, after insufficient coal storage in coal-fired power plants led to power shortages and power outages in many places, the Chinese government quickly took action to “guarantee supply and stabilize prices”, resulting in a rapid increase in coal consumption. Conversely, China’s energy consumption structure is dominated by coal. In order to achieve the goal of “carbon neutrality”, the focus of controlling fossil energy consumption is actually controlling coal consumption. This then means maintaining a balance between controlling total energy consumption and maintaining the energy needed for economic growth. Therefore, it is urgent to solve problems such as how much influence the total energy consumption control has on China’s macro-economy, how to choose optimal measures to control the total energy consumption, and how to grasp the effective implementation of the “double control” energy policy. All these are analyzed systematically and deeply in this paper.
The rest of this paper is arranged as follows. The second part summarizes the theoretical and empirical research on energy resource constraints. The third part presents the characteristics and problems of China’s energy consumption. The fourth part introduces the construction of social accounting matrix and model structure. The fifth part gives the results and discussions. The research conclusions and policy recommendations are given in the final part.
2. Theoretical and Empirical Research on Energy Resource Constraints
Before studying the impact of total energy consumption control, it is necessary to clarify the impact of energy consumption on economic growth. Extensive studies have been carried out on the relationship between energy and economy, but the conclusions are divided on the empirical analysis of the relationship. As an important production input factor, energy consumption can unilaterally promote economic growth [
2,
3,
4,
5,
6,
7,
8], but there is heterogeneity between regions [
4,
9]. Overall, renewable energy consumption can better promote economic growth than non-renewable energy [
10,
11,
12,
13,
14]. However, some scholars believe that economic growth will lead to an increase in energy consumption, and energy consumption will increase carbon emissions and cause environmental degradation, which will eventually hinder economic growth [
15,
16,
17,
18,
19].
For the theoretical study of energy constraints, Hotelling [
20] first proposed Hotelling’s law, which introduced exhaustible energy into the economic growth model. However, before the 1960s, the impact of resource constraints on economic growth had not been concerned by the academic circles. The economic growth theory focused on input factors such as land, labor, capital, and human capital. When it came to economic growth, it was generally assumed that all inputs of production factors would not be exhausted, or that there would be other alternatives even if they are. This assumption was no longer valid when non-renewable natural resources were used as important inputs of production factors. The outbreak of the world oil crisis in the 1970s brought the resource constraints of economic growth into the research scope of economists. For example, Stigliz [
21] and Solow [
22] studied the resource constraints of economic growth and held that economic output can maintain a long-term growth with a given natural resource stock and population expansion. Regarding the relationship between energy and economic growth, Rasche and Tatom [
23] first introduced energy factors into the Cobb–-Douglas function. They believed that on the path of balanced growth, the exhaustion of non-renewable energy would lead to unsustainable economic growth. Moon and Sonn [
24] also introduced energy factors into the Cobb–-Douglas function, constructed a cross-period growth model, and investigated the impact of energy prices and energy input on economic growth. They concluded that as energy consumption increases, the speed of economic growth will increase first and then decrease.
With the continuous evolution of theoretical models, in-depth research has been conducted on economic growth under energy constraints, which can be summarized into three aspects. First, some scholars have construct endogenous economic growth models under energy constraints to study the impact of energy constraints on economic growth, and to explore relevant measures to overcome energy constraints without affecting economic growth, including carbon tax policies [
25], research and development of renewable energy [
26], technological progress [
27,
28], etc. Second, some others have introduced energy factors into the production function to explore the “drag effect” of energy on economic growth. Based on Romer’s [
29] economic growth “drag effect” hypothesis, many have measured the “growth drag” of energy constraints on the economy [
30,
31,
32,
33,
34], and the size of the “tail effect” varies from different regions [
35]. Third, some have studied the economic impact of policies related to energy consumption control. For example, Hartono and Resosudarmo [
36] compared the economic impact of energy efficiency, energy subsidies, and restrictive energy policies by constructing a social accounting matrix in Indonesia. The results showed that the policy combination of energy efficiency and energy subsidies produces the best economic benefits. Wang and Liu [
37] simulated the impact of energy intensity target constraint policies on the China’s economy based on a general equilibrium model and found that corporate income tax constraints would result in a decline in the input and output of the fossil fuel production sector. Farhidi [
38] simulated, based on United States calibrated data, the effect of utilizing clean energy vs. fossil fuel energy on long-run economic growth and its impact on the total welfare of the society and found that imposing carbon-tax element on the energy producers’ profit would accelerate the adaptation of the clean energy and sustain fossil fuel resources for a more extended period and would increase the individuals’ long-term total consumption. Nong [
39] used the CGE model to evaluate the economic impact of the increase in energy taxes in Vietnam. The results showed that the increase in coal tax has a smaller negative impact on the economy than the oil tax but with better effects in emission reduction. Barkhordar [
40] evaluated the overall economic effect of the energy-saving lighting program in the Iranian household sector based on a mixed dynamic CGE model. He found that the program is profitable even if there is a high rebound effect. Taliotis et al. [
41] combined energy forecasting models and cost optimization models with input–output models to evaluate the economic effects of the energy transition in Cyprus. Their research results showed that the reduction in fuel consumption will negatively affect the output of the energy sector, but its overall impact on the economic sector is positive.
In summary, the existing literature focuses on evaluating the economic impact of a certain energy policy, while the comprehensive evaluation on a variety of policy measures is less involved, especially the research on the impact of the total energy consumption control policy on China’s macroeconomics. In view of this, the author uses the latest input–output table released by the National Bureau of Statistics of China to compile China’s macro-social accounting matrix in 2017 and refines the relevant accounts in the matrix to systematically calculate the impact of measures such as restricting the exploitation of energy resources, improving energy utilization efficiency, and raising energy prices on the macro-economy. This will provide a valuable reference for how to scientifically achieve the goal of total energy consumption control in practice, which is also the innovation of this paper.
3. Characteristics and Problems of Energy Consumption in China
3.1. Energy Demand Continuing to Grow, but per Capita Energy Consumption Remaining at a Low Level
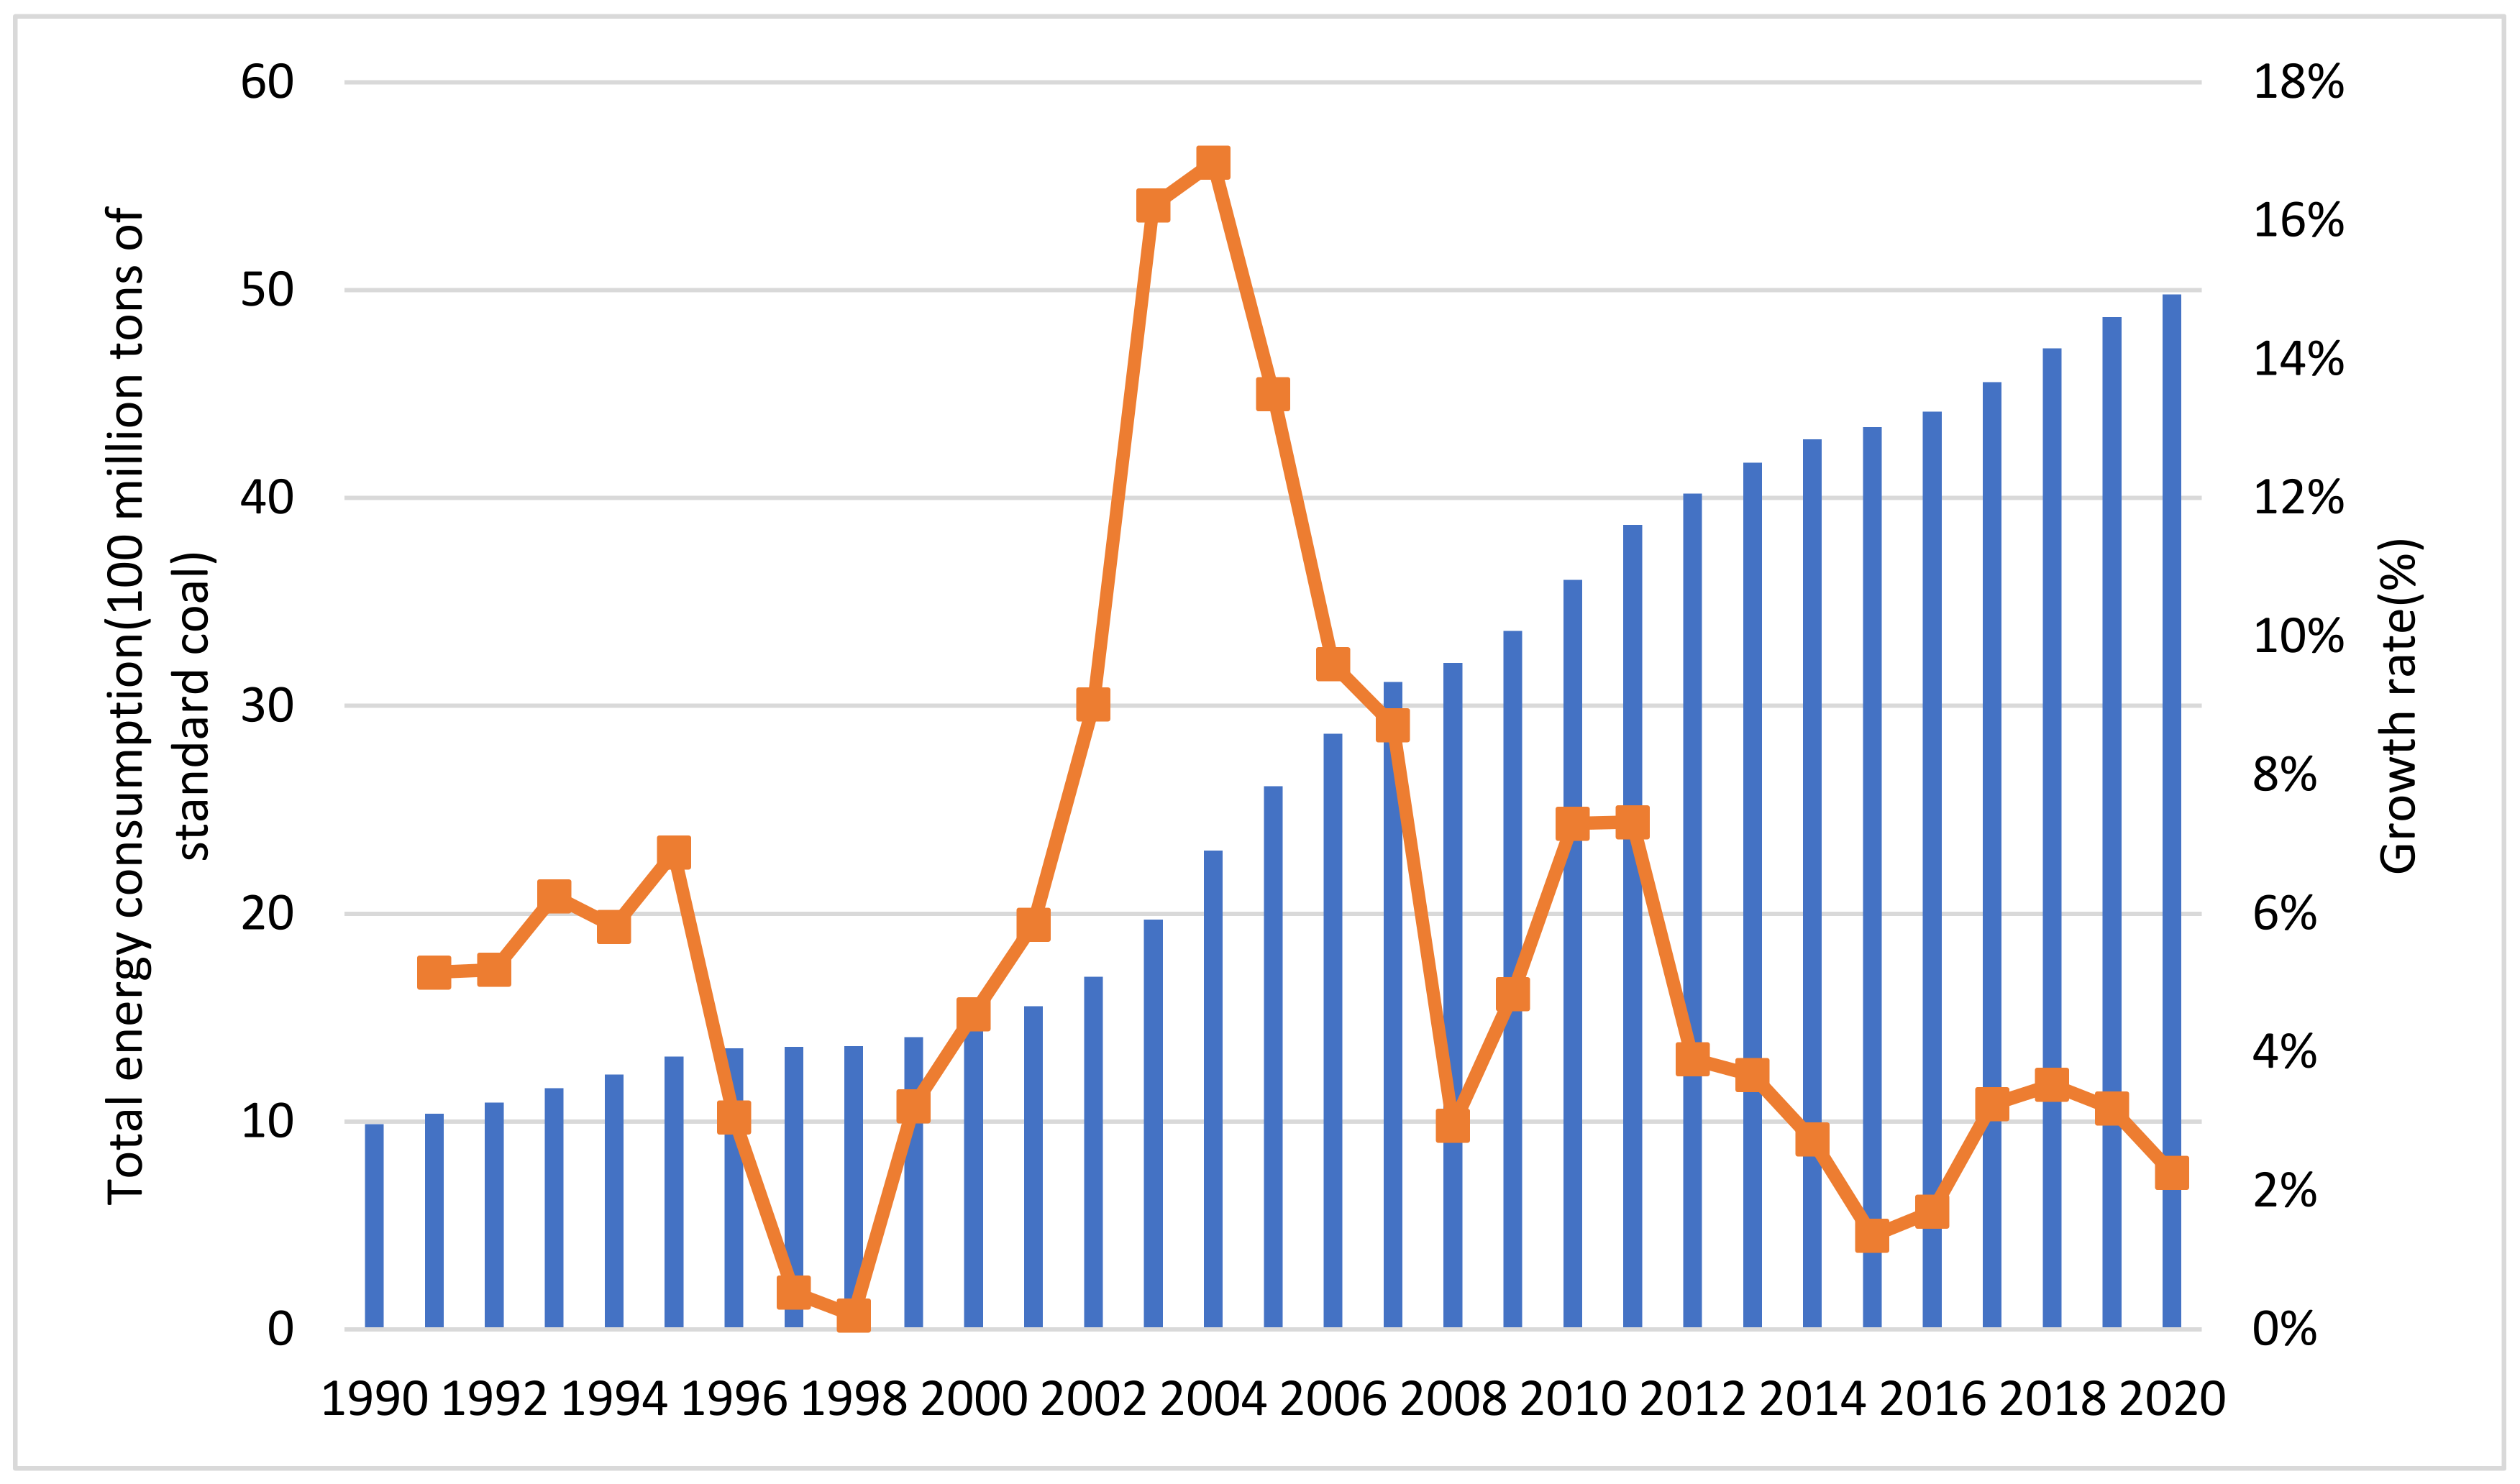
Since the 1990s, China’s economy has been on a rapid growth. The three major factors of economic growth, urbanization and industrialization have been the fundamental driving forces for China’s energy demand growth. As shown in
Figure 1, China’s total energy consumption has continued to grow, from 987 million tons of standard coal in 1990 to 4.98 billion tons of standard coal in 2020, an increase of 4.05 times over 30 years, at an average annual growth rate of 5.54%. Specifically, 1990–2011 witnessed a volatile rise, at an average annual growth rate of 6.72%; in 2012, China’s economy began to enter the “new normal” stage, and the economic growth turned from high-speed to medium-high-speed. The growth of energy consumption is also relatively flat, with an average annual growth rate of 2.84%.
However, China is still a developing country, and its per capita energy consumption is much lower than that of developed countries. In 2019, China’s per capita energy consumption was 98.8 EJ, which was 34.4% of the US’s per capita energy consumption level and 67.1% of Japan’s. Therefore, China’s energy demand will continue to grow in the future.
3.2. Industrial Structure Still Becoming More Industrialized after Entering the Later Stage of Industrialization
At present, China’s urbanization rate is 63.9%, far behind the 65.5% of middle-income countries and 81.5% of high-income ones. The accelerated urbanization will increase the demand for energy-intensive industries such as steel, non-ferrous metals, building materials, and chemicals, and boost heavy industries. Therefore, although China’s industrialization has entered an advanced stage, its industry sectors still contributed 32.1% to its economic growth in 2020. Among them, energy-intensive industries accounted for a high proportion of energy consumption. As shown in
Table 1, the energy consumption of the top 10 industries in total energy consumption in 2018 accounted for 92.5% of the total industrial energy consumption and 61.0% of the total energy consumption. Seven industries accounted for more than 5% of the total energy consumption, and these are the industries characterized by high energy consumption and high pollution.
3.3. Energy Consumption Structure Dominated by Coal
China is the world’s largest energy consumer. In 2019, China’s coal consumption accounted for 51.7% of the world’s total. China’s resource endowment determines that the coal-based energy structure is difficult to change in the short to medium term. The Chinese government has been committed to the diversified development of the energy structure. The proportion of coal consumption in the total primary energy consumption has been declining since 1990, but it still dominates, with 57.7% in 2020. The non-renewability of coal resources means that China’s sustainable economic growth will face serious resource scarcity. In addition, the coal-based energy structure is not conducive to its realization of carbon emission reduction targets, which will further restrict the economic growth.
On the whole, China’s current energy consumption is characterized by coal-based energy structure, low per capita energy consumption. The process of urbanization and industrialization will lead to a continued growth in energy demand in the future. These mean that over reliance on non-renewable fossil energy, especially on coal resources, will result in resource depletion and environmental pollution. Thus, China must figure out how to reasonably control the total consumption of fossil energy and implement differentiated energy policies. Restricting fossil energy consumption can help reduce the coal proportion in the energy consumption structure, and transform the energy consumption structure to a green, diversified, clean, and low-carbon energy consumption one. Conversely, improving energy efficiency and rationalizing the energy prices can promote energy conservation and emission reduction in the whole society.
5. Results and Discussions
5.1. A Restriction on the Extraction of Energy Resources
5.1.1. Restricting Coal Mining
According to the energy mining restriction model given above, this paper first sets three scenarios in which the output of coal mining and dressing industry will be reduced by 5%, 10%, and 15%, respectively, recorded as scenario A1, scenario A2, and scenario A3. These scenarios are simulated by MATLAB. The simulation results show that coal mining restrictions negatively impact the output of other industries, factor returns, and residents’ income. The decline in industry output and departmental income will lead to a decline in GDP. It is estimated that for every 5% drop in coal mining, the GDP will decline by 0.16%.
In terms of the impact of coal mining restrictions on the three industries, the output of the secondary industry has been the most affected. For every 5% reduction in the output of the coal mining and dressing industry, the output of the secondary industry will drop by about 0.22%. This shows that the secondary industry is the most dependent on the coal mining industry. The second is the primary industry: a 5% drop in coal output will reduce its output by about 0.15%. The tertiary industry is least affected by coal mining restrictions. Under the same coal mining restrictions, the output of the tertiary industry has dropped by about 0.14%. The service industry’s dependence on coal mining is relatively small and is quite similar to the primary industry.
In terms of specific industries, the production and supply of electricity and heat are most affected by coal mining restrictions: it will drop by 0.26% for every 5% reduction in output of the coal mining industry. This is in line with China’s national conditions since thermal power generation still accounts for a large proportion of China’s electricity supply. According to the China Electric Power Yearbook 2018, thermal power accounted for 71% of the total annual power generated in 2017, and coal-fired power accounted for 91% of the thermal power. Therefore, coal mining restrictions have the greatest impact on power production. The same is true for thermal power production. Although thermal power production only accounts for a small proportion of GDP compared with electricity production, it also relies heavily on coal mining and dressing. Resident services and other service industries are the second most affected: for every 5% reduction in output of the coal mining industry, the output of residential services and other service industries will fall by 0.22%. Residents’ use of coal for heating is still widespread in China, and service industries such as bathing services, hairdressing, and beauty and health services also have a high demand for heat. These have caused residents’ services and other service industries to rely heavily on coal consumption. The third most affected industry is water production and supply. Its output of the water production and supply industry will decrease by 0.21% for every 5% reduction in the output of the coal mining industry.
In addition to production activity accounts, endogenous social accounting matrix accounts such as factor departments and corporate and residential departments are also influenced by coal mining restrictions, as shown in
Table 5. Coal mining restrictions have a great impact on the labor and capital gains in the factor sector, bigger than on the primary and tertiary industries, and slightly smaller than on the secondary industries. In the scenario of a 5% reduction in coal output, labor returns will drop by about 0.22%, and capital gains will drop by about 0.20%. Residents’ income is greatly affected by coal mining restrictions as well, which is also higher as compared with the primary and tertiary industries, yet slightly lower compared with the secondary industry. As for a 5% reduction in coal production, residents’ income will drop by about 0.21%, and corporate income will fall by about 0.20%. This indicates that coal mining restrictions have a greater impact on people’s living standards. That is because the decline in labor remuneration and residents’ income under the coal mining restriction policy is higher than that in the gross national product, which must be considered when implementing the coal mining restriction policy.
5.1.2. Restricting Oil and Gas Extraction
Compared with the simulated scenarios that greatly reduce coal mining restrictions, the scope of restrictions on oil and gas mining is much smaller. Oil and natural gas, especially natural gas, is a cleaner energy source compared to coal. Conversely, it is due to policy considerations regarding the optimization of the national energy structure. At present, there is no transportation energy that can replace oil on a large scale, and natural gas accounts for a small proportion in the primary energy structure, smaller than the world average. China has a low probability of drastically reducing oil and natural gas consumption. Based on the same energy extraction restriction model, this paper designs three scenarios in which oil and natural gas extraction is reduced by 1%, 3%, and 5%, respectively denoted as scenario B1, scenario B2, and scenario B3.
It can be seen from the output results that oil and natural gas extraction restrictions have a negative impact on the output of other industries and the income of other sectors. This is consistent with the output results of the coal extraction restriction policy. It is estimated that for every 5% decrease in oil and natural gas extraction, GDP will drop by about 0.11% lower than the 0.16% under the coal mining restriction policy. This implies that China’s economic growth is more dependent on coal.
Among the three major industries, the secondary industry has been the most affected by oil and natural gas exploitation restrictions. Specifically, its output will drop by about 0.18% for every 5% decrease in the output of the oil and gas extraction industry. In addition, the output of the three major industries is less affected by the restrictions on oil and gas mining than by those on coal mining, especially for the primary and tertiary industries. Under the same 5% decline in energy output, the reduction in output of the two major industries is less than half of that under the coal mining restriction policy. This further demonstrates that China’s economy depends more on coal resources than on oil and natural gas.
From the perspective of specific industries, the production and supply of electricity and heat are most affected by the restrictions on oil and gas extraction. For every 5% reduction in the output of the oil and gas extraction industry, the production and supply of heat and electricity will drop by 0.22%. This may be because in addition to coal-fired power generation, China also uses oil and gas for power generation, and the use of natural gas for heating also holds a certain share in China. The second most affected is the coal mining and washing industry. For every 5% reduction in the output of the oil and natural gas extraction industry, the output of the coal mining and washing industry will decline by 0.17%. The output of the coal mining restriction model in the previous section shows that for every 5% drop in coal mining, the output of the oil and gas extraction industry drops about 0.19%. The results of the two scenarios show that compared with other industries, the two energy mining industries have greater dependence on each other. The third largest industry affected by coal mining restrictions is petroleum processing, coking and nuclear fuel processing. For every 5% reduction in the output of the petroleum and natural gas extraction industry, the output of petroleum will decrease by 0.21%. This is because the raw materials of the petroleum processing, coking and nuclear fuel processing industry is largely supplied by the petroleum and natural gas extraction industry.
The factor sector is more affected by oil and gas exploration restrictions than the primary industry and tertiary industry, but less than the secondary industry, as shown in
Table 6. The results also show that restrictions on oil and gas extraction affect residents’ incomes. Under the same 5% restriction of energy output, the decline in factor returns and residents’ income are both lower than that under the coal mining restriction policy. This indicates that factor returns and residents’ income are more influenced by coal mining restrictions than by oil and gas mining restrictions.
5.2. An Improvement in Energy Efficiency
According to the previous model setting, this paper sets the coal mining and washing industry, oil and gas extraction industry, petroleum processing, coking and nuclear fuel processing industry, electric power, heat production and supply industry, and gas production and supply industry as constrained endogenous account. Under the circumstance that other inputs remain unchanged, this section reduces the energy sector’s (i.e., endogenous constrained account) inputs to other industries, and uses the new average consumption expenditure matrix to calculate the income changes of each industry (sector). The policy simulation for improving energy efficiency sets up 1%, 3%, and 5% reductions in energy input, which are recorded as scenario C1, scenario C2, and scenario C3.
With higher energy efficiency, other sectors will need less energy input under the same output. The results show that the output of energy industry falls significantly due to improved energy efficiency, while the non-energy sector benefits from the increased energy efficiency, with output increasing in different scales.
In terms of the impact of energy efficiency improvement on the three major industries, the output of the primary industry will be the most affected. Its output will rise by 0.35% for every 5% increase in energy efficiency. The secondary industry and the tertiary industry are roughly equally impacted, but not as much as the primary industry. The possible reason is that the simulation fails to consider the substitution effect brought about by the enhanced energy efficiency. That is to say, with the improvement of energy utilization efficiency, enterprises may use more energy resources to replace other production factors, such that the actual output growth of enterprises is higher than the value predicted by the model.
For specific industries, non-metallic mining and other mining and dressing industries are most influenced by the improvement of energy efficiency, followed by the metal mining and dressing industry. For every 5% increase in energy efficiency, the former increases by 0.88% in output, and the latter increases by 0.85%. It therefore can be concluded that the mining industry is the biggest beneficiary of energy efficiency improvement. The chemical industry is the third most affected by the improvement of energy efficiency, but this positive effect on its output is small, as compared with the mining industry. For every 5% increase in energy efficiency, the chemical industry has a 0.55% increase in output, as shown in
Table 7.
The factor sector has increased revenue due to improved energy efficiency, but the growth rate is lower than those of the three major industries because of the larger energy demand from the production activity sector. Residents can benefit from improved energy efficiency and achieve income growth. Under the scenario of a 5% increase in energy efficiency, residents’ income will rise by 0.17%. This shows that the government’s increased research on the effective use of energy is conducive to improving people’s living standards.
5.3. An Enhancement of Energy Prices
5.3.1. Raising Coal Prices
Table 8 shows the changes in the average cost of the three major industries affected by rising coal prices. The cost of the secondary industry is most affected by coal price control. Under the scenario of a 5% increase in coal prices, it will increase by an average of 0.43%, significantly higher as compared with the primary and tertiary industries. This shows that the secondary industry is more dependent on coal resources for production; thus, the rise in coal prices has the greatest impact on this industry.
In terms of specific industries, the production and supply of electricity and heat are most affected by the rise in coal prices. If the price of coal rises by 5%, the cost of electricity and heat production and supply will increase by 1.43%. This result is in line with expectations because China’s heat and electricity production and supply are heavily dependent on coal resources. The second most affected by coal price is the non-metallic mineral products industry. The cost increase of this industry ranks second only to the electricity and heat production and supply industries among the 43 industrial sectors. However, it lags far behind first place. Furthermore, its cost only increases by 0.75% for every 5% increase in coal prices. The third most affected is the metal smelting and rolling processing industry. For every 5% increase in coal prices, its costs rise by 0.58%.
The rise in coal prices increases the cost of factors, especially labor costs. For every 5% increase in coal prices, labor costs increase by approximately 0.15%. By contrast, the increase in coal prices has little effect on the cost of capital. Every 5% increase in coal prices only raises the cost of capital by 0.04%. Companies will try to use other factors to replace coal resources due to its increased prices. The increase in demand drives the costs of other factors; thus, labor and capital costs rise. Resident consumption costs also rise due to the rise in coal prices, but its increase is small as compared with the three major industries. For every 5% increase in coal prices, the consumption costs of residents will rise by about 0.15%, indicating that residents are concerned about coal resources. The dependence is lower than the production activity sector.
5.3.2. Raising Oil and Gas Prices
The cost of the secondary industry is most affected by the prices of oil and natural gas. The secondary industry will witness a 0.57% increase in cost on average for a 5% increase in oil and natural gas prices, followed by the primary and tertiary industries, as shown in
Table 9. It can be concluded that in addition to resources, the secondary industry also has a great dependence on oil and gas.
From a specific industry, for every 5% increase in oil and natural gas prices, the cost of oil processing, coking and nuclear fuel processing industries will increase by 2.86%, which is in line with expectations. The cost increase of gas production and supply industry is also large because oil and natural gas is also the main raw material for gas production and supply industry, and the rising cost of raw materials has increased the cost of gas production and supply industry. A 5% rise in oil and natural gas prices will mean a 2.55% increase in the cost of gas production and supply. The transportation industry, falling into the tertiary industry, is the third most affected by the increase in oil and natural gas prices. This is because petroleum derivatives such as gasoline and diesel are the main fuels of the transportation industry. The increased oil and natural gas prices cause the prices of gasoline, diesel and other fuels to increase as well. As a result, it will indirectly raise the cost of the transportation industry. However, compared with industries such as oil processing and gas production, the cost increase of the transportation industry under the same scenario is much lower.
The rise in oil and gas prices also leads to an increase in factor costs, which will not be discussed here. Resident consumption costs rise due to the increased oil and natural gas prices as well, but the increase in consumption costs is lower than that of the three major industries. Every 5% increase in oil and natural gas prices will cause household consumption costs to increase by approximately 0.19%, which is higher than the increase under the coal price control policy.
5.3.3. Raising Electricity Prices
The cost of the secondary industry is still the most affected by increased electricity prices. A 5% increase in electricity prices cases the cost of the secondary industry to rise by 0.65% on average. In the same scenario, the cost of the tertiary industry rises by an average of 0.41%, followed by the primary industry at 0.37%, as shown in
Table 10. The comparison shows that the cost increase of the three major industries under the power price control policy is higher than under the coal price control policy and the oil and gas price control policy. This indicates that the electricity price has the greatest impact on the cost of production activities.
Raising electricity prices has caused costs in other sub-industries to rise to varying degrees. Among them, the three most affected industries are water production and supply, metal mining and dressing, non-metal mining and other mining, and dressing. A 5% increase in electricity prices has caused the costs of these three industries to rise by 1.55%, 1.03% and 0.84%, respectively.
In addition, the rise in electricity prices induces the cost of factors to rise. Specifically labor factors are more influenced than capital factors. Resident consumption costs also rises because of the rise in electricity prices, but the increase in consumer consumption costs is smaller than that of the three major industries. For every 5% increase in electricity prices, consumer consumption costs increase by about 0.29%. Increasing the electricity price has a larger impact on household consumption costs than increasing the prices of coal and oil and natural gas. This demonstrates that residents rely more on electricity than on coal, oil and natural gas. At the same time, raising electricity prices has the greatest impact on residents’ living standards. In view of this, the government should be prudent about changing electricity prices.
6. Conclusions and Policy Recommendations
6.1. Conclusions
This paper, through a Chinese SAM, has elaborated the calculation methods for restrictions in fossil energy use, improvement in energy efficiency and enhancement in energy prices, and investigated their impacts on the economy in China. The general equilibrium of the SAM in this model is static, while in reality, the system structure changes over time. This means that the parameters of the matrix will change; hence, they are less reliable for forecasting long-run trends. In addition, the starting point of this study is the impact of energy conservation on China’s macro-economy. Of course, for the substitution effect of clean energy, we will discuss in detail in future research due to the need to consider issues such as technology and cost and their changing trends. Some of the important conclusions drawn from this study are as follows.
First, judging from the results of policy simulations, policies to improve energy efficiency are optimal. By improving energy efficiency, the contribution of capital and labor factors to output increases. In which case, the production sector can produce more output with less energy input, and residents benefit from the increase in energy efficiency and achieve income growth. By contrast, the policies of restricting coal mining and raising energy prices can also restrict the consumption of fossil energy, but they both lead to a decrease in the output of the production sector as well as in residents’ income.
Second, the impact of policies restricting coal mining and raising energy prices on the production sector is closely related to the sector’s dependence on energy. The more energy-dependent the sectors, the greater the decline in their output. In the power sector for example, coal contributes to 66% to power generation in China. Thus, restrictions on coal mining have the greatest impact on the power and heat production and supply industries. Under the policy of increasing coal prices, the cost of electricity and heat production and supply industries rises the most significantly.
Third, the policy simulation of raising energy prices shows that production sectors and residents are more influenced by changes in electricity prices than by those in coal and oil and natural gas prices. This is mostly because both the production sector and the residential sector have a greater dependence on power supply.
6.2. Policy Recommendations
Since the “13th Five-Year Plan” period, China’s economy has entered the “new normal” stage of shifting growth and structural adjustment and optimization. Energy conservation and emission reduction are facing a completely different economic environment from the past. China urgently needs to embark on a “win–win” path of economic development and energy conservation and emission reduction. The government needs to formulate effective energy-saving policies to rationally control the total consumption of fossil energy with minimized social costs in order to promote sustainable economic growth. For example, using social norms to promote energy conservation [
44].
Among the total energy consumption control policies discussed in this paper, improving energy efficiency is conducive to increasing the output of the production sector (except the energy resource supply sector), increasing factor income and residents’ income, and reducing energy consumption in all sectors of society. At the same time, it can help save energy, reduce emissions and achieve sustainable economic growth. Therefore, the government should formulate corresponding subsidy policies to encourage enterprises to increase R&D investment in energy efficiency technologies.
The policy of restricting coal mining mainly reduces the energy input of the production sector and the energy use of the residential sector through energy supply, which however reduces the output of the production sector and the residents’ income. Therefore, the government should balance the relationship among economic growth and energy conservation and emission reduction when formulating coal mining policies. China must have sufficient, stable energy supply to meet the energy demand required for future economic growth. Nevertheless, due to the scarcity of non-renewable energy such as coal, China’s current resource development ways have partly impaired the sustainable economic growth and the welfare of future generations. For these reasons, Chinese government departments are quite concerned about how to reduce the depletion rate of resources. The collection of resource extraction taxes can reflect the cost of resource depletion and is an important economic means to solve resource depletion.
An increase in energy prices raise the energy use costs of the entire society, including the production costs of enterprises and the cost of living of residents, thereby controlling the total energy consumption. However, it will also reduce the output of the production sector and the income of residents. Coal has long occupied a high proportion of China’s primary energy structure and has maintained long-term growth momentum. The exploitation and utilization of considerable coal resources have brought serious externalities to the ecological environment and society, and these externalities are not reflected in the market price of coal. Therefore, for the green transformation of the economy, it is important to rationalize the coal price mechanism such that the coal prices can fully reflect the scarcity of resources and environmental costs. Cost is the main factor restricting the development of renewable energy. Compared with fossil energy, renewable energy is not economical. The root cause is that the current price of fossil energy cannot deal with the external costs of resource scarcity and environmental pollution, resulting in the lack of corresponding economic incentives for the development of low-carbon energy technologies. Thus, from a long-term perspective, the government should adopt energy price reforms and establish a reasonable, transparent market mechanism of energy pricing to improve energy efficiency and optimize energy structure. Of course, the market-oriented reform of energy prices is a phased and gradual process, and the government should proceed step by step through an overall plan and strategic arrangement. In addition, energy price reform needs to be combined with the collection of resource taxes, environmental taxes, and energy subsidies.
The “power outage” event in the second half of 2021 further demonstrates the special importance of coal as the country’s basic energy source in ensuring energy security. This means that coal still dominates the energy system in the short term. Therefore, in order to ensure energy security in the process of “carbon neutrality”, it should be based on the basic national conditions of coal-based, especially to promote the clean and efficient utilization of coal, in order to give full play to the role of coal in ensuring energy security and cooperating with clean development. For example, using the social norms to call for the energy regime change [
45], promoting the utilization of coal energy by grade and quality, increasing efforts to tackle key technologies and transform achievements in the clean and efficient development and utilization of coal, and achieving the low-carbon utilization of high-carbon energy, thereby promoting the balance between the effective promotion of the “carbon neutrality” process and the guarantee of energy security.


