Article

The Application of a Multi-Criteria Decision-Making for Indication of Directions of the Development of Renewable Energy Sources in the Context of Energy Policy

Department of Electrical Power Engineering, Faculty of Electrical and Control Engineering, Gdańsk University of Technology, 80-233 Gdańsk, Poland
*
Author to whom correspondence should be addressed.
Energies 2022, 15(24), 9629; https://doi.org/10.3390/en15249629
Submission received: 20 October 2022 / Revised: 8 December 2022 / Accepted: 15 December 2022 / Published: 19 December 2022
(This article belongs to the Special Issue Sustainable Development, Energy Economics and Economic Analysis)

Abstract

:
This paper presents the application of multi-criteria decision-making (MCDM) for evaluating what technologies using renewable energy sources (RES) for electricity production have the chance to develop in Poland under the current socio-economic conditions. First, the Analytical Hierarchy Process (AHP) method was used to determine the weights of the optimization criteria. Five main criteria and 30 sub-criteria were identified. Next, the authors modified numerical taxonomy (NT) to rank eight RES technologies (such as onshore and offshore wind farms, photovoltaics, or biogas plants). The results show that offshore wind farms are the RES technology with the greatest development opportunities in Poland. The following three technologies: distributed photovoltaic energy, biogas plants, and biomass power plants, respectively, received a similar rating in the ranking. Hydropower and geothermal were the lowest-ranked technologies. The ranking, which is the result of multi-criteria analysis, in several respects, is significantly different from the directions of activities indicated in the state energy policy.

Graphical Abstract

1. Introduction

About 80% of electricity in the Polish power system was generated using coal (hard coal or lignite) as an input fuel in 2021 [1]. Such large dependence on coal causes very high levels of pollutants and greenhouse gas emissions into the atmosphere [2]. It results from a historical tendency to use domestic energy resources of coal being deployed in large amounts in several locations within the country’s territory. Such high reliance on coal distinguishes Poland from other countries of the European Union (EU) [3]. The current energy policy of the EU indicates a quick and significant reduction in CO2 emissions as a goal to achieve climate neutrality in Europe in the near future [4]. The functioning of the legal order of the EU forces Poland to undertake a profound economic transformation associated with emission reductions, primarily in the energy sector [5]. Although Poland is the only EU country that has not yet officially declared to achieve these goals within the deadlines indicated by the EU, the need for a quick modernization of the Polish power system and changes in the energy mix are indisputable. In addition, due to the global energy crisis and economic uncertainty resulting from the COVID-19 pandemic [6,7] and Russia’s invasion of Ukraine [8], investments in the development of renewable energy sources in all EU Member States are more important than ever.
The structure of Polish electricity production (2021) depends on conventional energy sources such as hard coal (53.6%), lignite (26.1%), and natural gas (7.7%). The share of hydro and other renewable energy sources (RES) is only 11.6% [1]. Under the current political, technological, and socio-economic conditions, the change in the structure of electricity generation into one that is more environmentally compatible requires, in the first place, the use of domestic renewable energy sources. Despite little success achieved in Poland in recent years in the development of renewable energy sources, the fulfillment of the EU goals to which Poland had committed was delayed, while support was often placed in technologies with a questionable environmental effect, such as biomass co-firing with coal in thermal power plants [9,10]. Poland’s unfavorable energy policy promoting renewable sources constitutes a significant problem [11]. It is not only budgetary constraints that make it difficult to implement strong and effective support mechanisms but also the limited possibilities of simply transferring the costs of transforming the energy sector to end-users because of the relatively low affluence. Due to these conditions, the mechanisms supporting the development of renewable sources after Polish accession to the European Union underwent numerous and frequent changes, resulting in an inconsistent and unstable energy policy. The authorities’ low determination in formulating the goals of the energy transformation in recent years resulted in an accumulation of challenges. The frequently changing policy regarding the promotion of various RES technologies is only one of them.
According to Energy policy of Poland until 2040 (PEP2040), the energy transformation will be based on three pillars, including a zero-emission energy system; this is the long-term direction in which the energy transformation is heading (Figure 1). Reducing the emission of the energy sector will be possible by:
  • implementation of nuclear energy and offshore wind energy;
  • increasing the role of distributed energy;
  • involvement of industrial energy;
  • ensuring energy security through the temporary use of energy technologies based, inter alia, on gaseous fuels.
Key elements of PEP2040:
-
increase in the share of RES in all sectors resulting in the installation of approximately 10–16 GW new capacity additions by 2040. In 2030, the share of RES in gross final energy consumption will be at least 23%—not less than 32% in the electricity sector (mainly wind and PV);
-
offshore wind energy—installed capacity will reach approx. 5.9 GW in 2030 to approx. 7–11 GW in 2040;
-
there will be a significant increase in the installed capacity in photovoltaics, approx. 5–7 GW in 2030 and approx. 10–16 GW in 2040 [12].
Taking into account expected technological developments, offshore wind farms play a special role in the implementation of RES [13]. Their construction is a strategic decision on developing key competencies in this field in Poland, allowing for economic growth. It should be noted that currently, there are no offshore wind farms in Poland, although construction projects are in the preparation phase.
Further development of photovoltaics is also expected, the operation of which is correlated with the summer peaks in electricity demand, as well as onshore wind farms that generate electricity at similar time intervals as offshore wind energy. It is also expected to increase the importance of biomass, biogas, geothermal energy in district heating and heat pumps in individual heating, and transport. It is necessary to increase the use of advanced biofuels and electricity. There is also an expected development in distributed energy based on renewable energy production, sales, storage, or participation in Demand Side Response (DSR) programs by individual entities (e.g., active consumers, prosumers, and others) and energy communities (e.g., energy clusters, energy cooperatives) [14]. By 2030, approx. a fivefold increase in the number of prosumers and energy-sustainable areas at the local level to 300 is expected [12].
PEP2040 does not specify what sources of renewable energy the state’s energy policy will be based on; therefore, the problem analyzed in this article is an attempt to answer the following questions: what technologies using RES to produce electricity have a chance for development in Poland under the current conditions? Which renewable energy technology is the best for installation in Poland in the context of the current legal regulations and the future long-term energy development strategy in the European Union, and what are the available energy resources and production costs?
The objective of this research was to create a ranking of RES technologies indicating their development opportunities. The results will also allow for an assessment of the current energy policy formulated in the country’s development goals relating to renewable energy sources. The problem has not been solved so far. The analysis can be considered an attempt to verify the integrity of the declared objectives with existing resources and the actual policy supporting renewable technologies. Due to the necessity to take into account technical, legal, social, and environmental conditions, the authors have chosen the method of multi-criteria analysis to solve the problem.
The research objective was achieved by using the multi-criteria method, which is proposed by the authors to solve the problems of comparative evaluation of RES technology. The algorithm of the proposed method was based on the following methods: Analytic Hierarchy Process (AHP) and Numerical Taxonomy (NT). It allows us to use the advantages of both methods and objectify the process of creating a ranking of renewable technologies.
This paper is composed as follows: Section 2 presents the literature review about using MCDM methods for solving problems in the energy sector and selection methodology; the authors present a hybrid method combining AHP and NT methods for the evaluation of RES technology using five main criteria and 30 sub-criteria; Section 3 provides results of the ranking of RES technologies from the greatest to the lowest development opportunities in Poland; Section 4 contains sensitivity analysis of the method applied to both changes in input data values and weights; Section 5 discusses the obtained ranking of RES technologies in the context of energy policy in Poland; finally, the conclusion and recommendations for the state’s energy policy were given in Section 6.

2. Ranking of RES Technologies

Multi-criteria analysis methods are commonly used tools in energy market analyses and sustainable energy development issues worldwide [15,16,17,18].
In [19], the portfolio theory was used to determine the optimal energy mix in China by 2030. The criteria of cost, risk, required technological development, and various goals of energy policy were used. It has been shown that technologies based on fossil and gaseous fuels are not profitable from the technological point of view, and the supply of raw materials and their share in the energy mix will decrease (still 50% share). RES technologies such as hydropower and solar power plants will significantly increase their share, while nuclear, wind, and biomass power plants will remain at the same level.
In [20], an analysis of four energy mix scenarios for the UK until 2035 was performed. Three scenarios assume the replacement of nuclear power plants with PV installations. The criteria adopted are the LCA analysis, short-term energy impacts, net energy analysis metrics, long-term climate impacts, and life cycle assessment greenhouse gas metric.
In [21], the authors presented an energy mix model for Malaysia, developed in The Integrated MARKAL-EFOM System (TIMES). It was assumed that by 2050 the total production of electricity would come from renewable sources, including large hydropower plants. It has been shown that solar installations installed on roofs, in combination with large-scale pumped heat energy storage, can replace a two-gigawatt nuclear power plant with lower investment outlays. For the selection of the appropriate method, electrochemical energy storage (EES) was also identified as a multi-criteria problem and a new hybrid multi-criteria decision-making (MCDM) method integrating the Bayesian best–worst method (BBWM), the entropy weighting approach, and the gray cumulative prospect was used for optimization the EES planning program selection [22].
In [23], the multi-stage stochastic optimization (MSO) method was used to develop the energy mix, assuming the uncertainty of energy demand, fuel costs, and capital costs of RES investments for the Indonesian power system until 2035. In addition, in [24], using the AHP method, it was demonstrated that sustainable energy development leads to a large diversification of technologies. The AHP method combined with TOPSIS was used in [25] to select the optimal site for installing the PV system in Saudi Arabia, where the criteria of climatic, orography, location, economic and environmental are specified. The combination of the AHP method with the COPRAS method can be found in [26], where it was used to select the most appropriate renewable energy option.
The linear ordering method, due to its simplicity and ease of use, is often used in analyses of sustainable energy development, as presented in [27], where the example was used to assess the energy sustainability development of Polish regions, taking into account in the social, economic, and environmental criteria.
For decision-making processes that involve uncertain decision-making environments, methods such as TOPSIS, sum-product assessment (WASPAS), and fuzzy-analytic hierarchical process (FAHP) are often employed, for example, in evaluating potential wave energy stations [28] or for selection of hydroelectric plant location [29].
Multi-criteria analysis methods are widely used to determine the location of RES, for example, MCDM to determine the most feasible location for wind farm [30,31], distributed generation planning [32,33,34], power generation technology [35], and locations of biomass power plant [36].
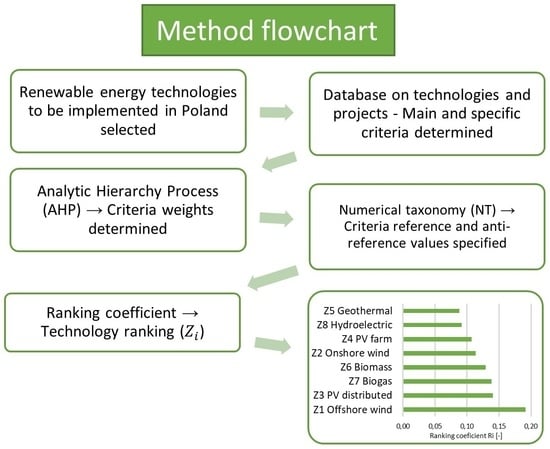
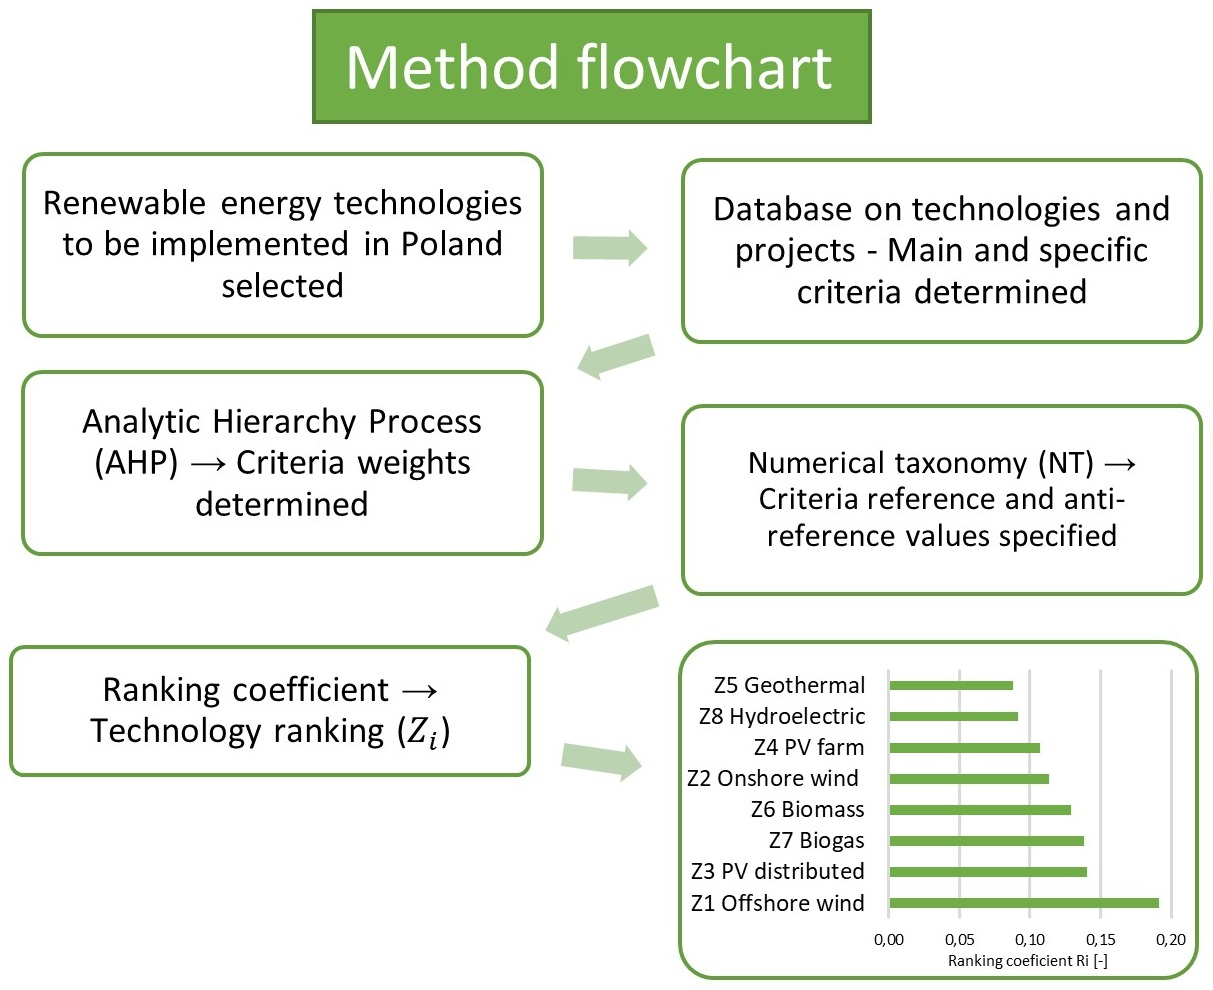
The article answers the question of which RES-based technology is the best for installation in Poland. For this purpose, a ranking of electricity generation technologies based on the use of renewable energy sources in Poland was developed. Using a combination of AHP methods and numerical taxonomy to obtain such a ranking has never been a subject of prior published research, to the author’s best knowledge.

2.1. MCDM Methodology

This section explains the use of the author’s hybrid multi-criteria method, a detailed description of which is provided in [37], and its application to the analyzed case is presented in the diagram (Figure 2) and can be summarized as the following steps:
  • Identifying the criteria that influence the decision of RES technology that is the best for installation in Poland;
  • Applying the AHP technique for determining the criteria weights, based on the pairwise comparisons;
  • Specifying the reference and anti-reference values for specific criteria and normalize them using the Numerical taxonomy method;
  • Determination of metric distances of individual RES technologies from the reference and anti-reference values, taking into account the weight of criteria;
  • Organization of the RES technologies due to the increasing values of the ranking coefficient.

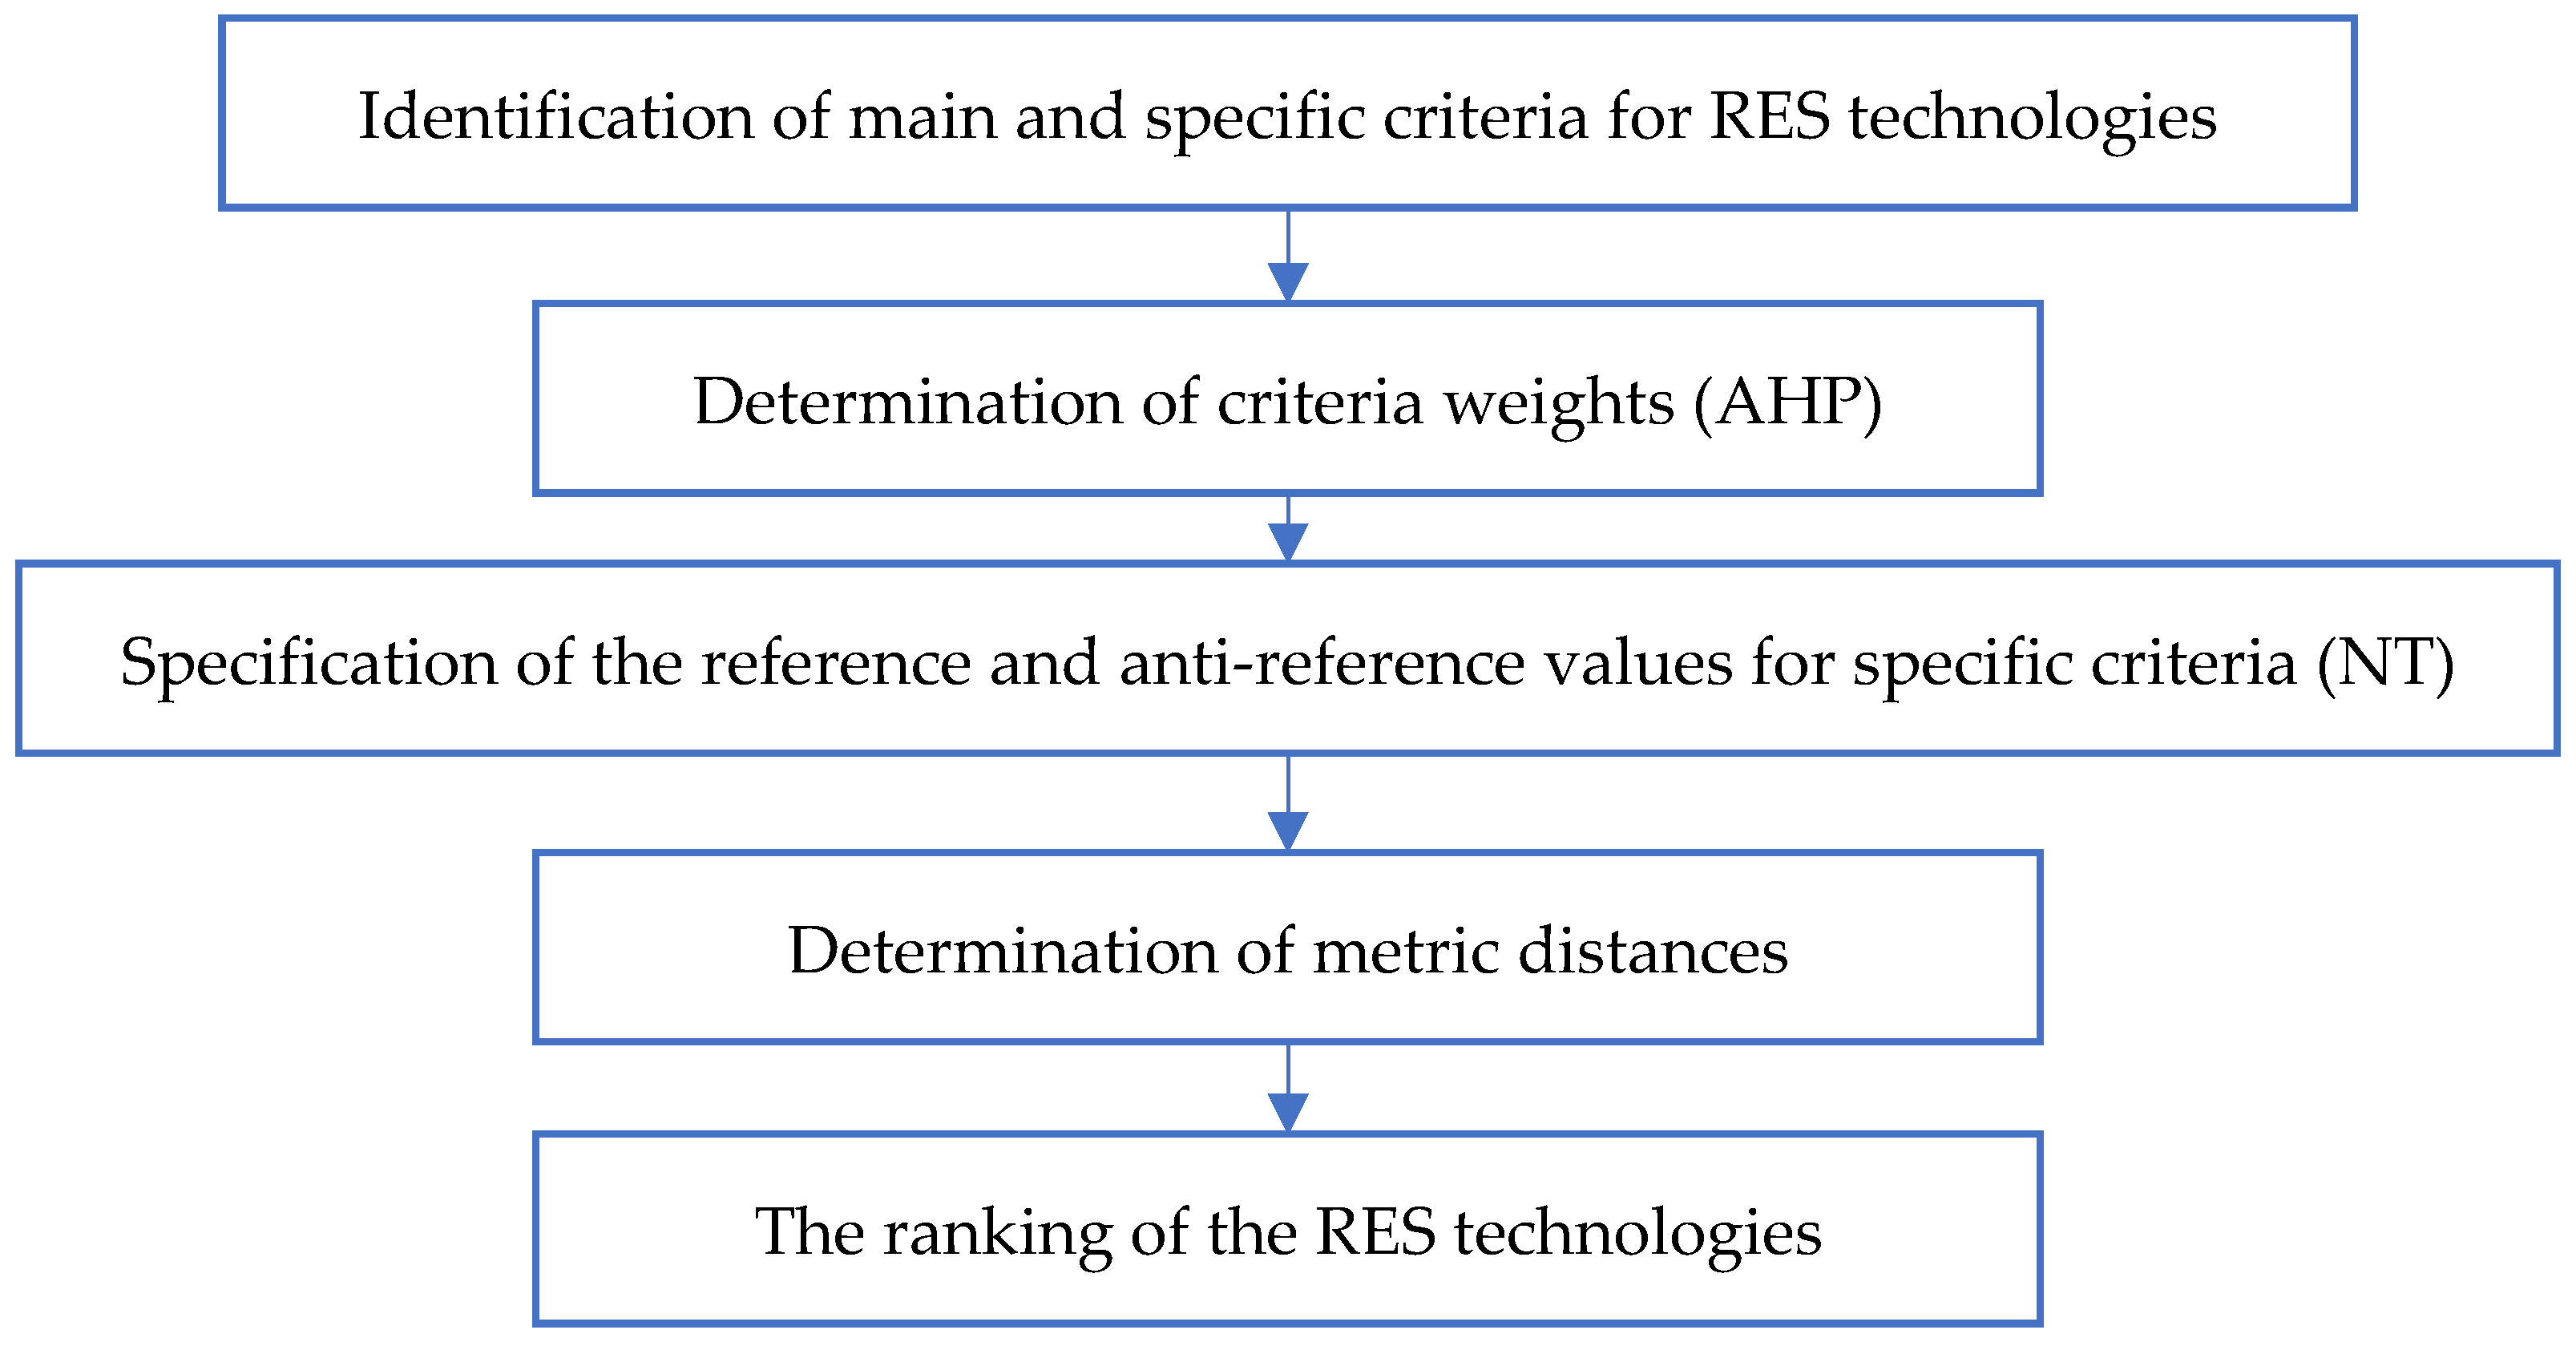
2.2. Identification of Main and Specific Criteria

Selection criteria optimization and their quantities are crucial for the correctness of this analysis. The number of criteria depends on the amount of data [38]. The most common criteria for evaluating RES technologies include environmental, technical, economic, and social issues [39,40,41,42].
There are five groups of main criteria ( X i ) : technical ( X 1 ) , economic ( X 2 ) , social ( X 3 ) , environmental ( X 4 ) , political and legal ( X 5 ) . Within each main criterion, detailed criteria ( X i , s ) were developed, which are presented in Table 1.
Scales for assessing individual detailed criteria have been introduced, depending on their nature and type of RES technology. Standardization of criteria rating scales has been applied, which may be expressed as numbers, percentages, or any other manner convenient for the user. The scales used for assessing specific criteria are presented below.
Technical criteria X 1
In the group of technical criteria, nine detailed criteria were used. The set of specific criteria is the most numerous of all the main criteria. In the literature, the technical criteria are included in the studies [43,44,45]. For the purposes of this analysis, sub-criteria have also been specified.
The first sub-criterion in this group X 1 , 1 —availability of primary raw materials—was assessed based on an analysis of technically useful primary energy resources in Poland that can be used in electricity production. The scale values of this criterion are treated as stimulants.
The sub-criterion X 1 , 2 —time of installed capacity utilization—is expressed in [h/year]. The criterion expresses the capacity of a given technology to produce energy, typical in Polish conditions, resulting from the variability of the availability of primary energy resources. The values were adopted based on the average productivity of the already existing facilities, and for new technologies, based on the analysis of the average long-term meteorological measurements and the features of a given technology. The criterion is a stimulant. The significance of this criterion is important not only because it allows us to estimate the future energy production from each unit of installed capacity, but also indirectly expresses the need to balance the source’s production and the need to maintain reserve capacity in the power system.
The sub-criterion X 1 , 3 reflects the typical power ranges of individual sources of a given technology. There are four classes used in this criterion: micro, small, medium, and large energy sources. The criterion indirectly describes the role of the sources in the system. It acts as a stimulant in the technology assessment method.
The sub-criterion X 1 , 4 is a criterion describing the distance of the location of energy resources in relation to the existing power grids. Average distances of resources from the grid were estimated based on maps showing the location of resources and the topography of power grids. The distances are expressed in kilometers. This sub-criterion is regarded as a destimulant.
The sub-criteria X 1 , 5 i X 1 , 6 characterize the typical voltage level of the network to which the sources are connected and the potential impact of a given energy technology on slow and dynamic voltage fluctuations in the network. For the voltage level criterion, four classes were used, resulting from the role of grids with different voltage levels in the Polish power system.
The sub-criterion X 1 , 7 acts as a stimulant. It is characterized by typical for each technology’s short- and medium-term predictability of production. In the conditions of the energy market, the significance of this criterion is important not only for technical reasons caused in the power system by high variability and low predictability of the level of energy production by the source but also because of the economic consequences of this type of work. In the case of the X 1 , 8 sub-criterion, classes were adopted that characterize the need to expand or adapt the existing power grid to the needs of a given technology. This sub-criterion influences the evaluation of the technology as a destimulant.
The sub-criterion for the efficiency of the RES technology ( X 1 , 9 ) is a stimulus and favors technologies that make better use of local renewable energy resources.
Economic criteria X 2
Five sub-criteria were prepared to allow the assessment of the national conditions for the development of the analyzed technologies. For each generation source, a financial analysis was carried out, which took into account the financial flows related to construction and operation. It includes financial support for individual technologies, such as guaranteed prices of energy under the RES auction, reference prices of energy from RES [46], and available subsidies. Financial calculations were the basis for determining the payback period (SPBT) [47] and the economic IRR indicator.
The first two sub-criteria X 2 , 1 and X 2 , 2 are expressed in [EUR/kW] and characterize the average unit investment outlays, respectively, for generation systems and their connection to the power grids. The investment outlays were assessed for every energy technology based on available literature data [48,49,50,51] and information on investment processes implemented in Poland [7,52]. Both sub-criteria are regarded as destimulants.
The sub-criterion X 2 , 3 —payback period (SPBT)—is expressed in years. The sub-criterion X 2 , 3 is defined as a simple payback period for incurred inputs. It is, in the authors’ opinion, the easiest indicator of the profitability of the investment, allowing the comparison of technology and based on generally accepted and universal methods of its calculation. The analyses carried out for this article were based on current (2019 and 2020) Polish data.
The sub-criterion X 2 , 4 is the average IRR for typical projects in the analyzed technologies, expressed in percentages. IRR was introduced into the analysis as a commonly used dynamic indicator of investment profitability of projects, acting as a stimulant.
The sub-criterion X 2 , 5 is expressed in [Euro/MWh] and describes the technology demand for capacity maintenance and servicing activities. The sub-criterion is a destimulant in the performed analysis.
Social criteria X 3
In the group of social criteria, three sub-criteria were proposed, all of which are stimulants in the analysis performed. Due to the difficulties with fully objective assessment, it was assumed that the detailed sub-criteria X 3 , 1 —public support for investment—and X 3 , 2 —favor of local authorities for investment—are assessed with a numerical scale in the range 1–5, which has no linguistic equivalent. The appropriate value in the scope was selected using an expert method based on examples of the implementation of investment projects related to renewable energy sources in Poland [53,54], implemented and planned in the recent period. For sub-criterion X 3 , 3 —investment compliance with local policies—a numerical scale was used, corresponding to the linguistic assessment of the criterion (Table 2). The assessment was made with an expert method based on existing spatial planning documents functioning in Polish practice. Plans for a few typical areas with significant renewable energy resources were analyzed.
Environmental criteria X 4
Seven environmental sub-criteria have been defined. The sub-criterion X 4 , 1 is the factor of avoided CO2 emissions expressed in [Mg CO2/year] [55]. It is treated as a stimulant.
The sub-criteria X 4 , 2 and X 4 , 3 are accepted as destimulants; therefore, the desired values are the minimum values. The sub-criterion X 4 , 2 is characterized by the average level of noise emitted by a given energy source and is expressed in decibels [13,56,57]. For sub-criterion X 4 , 3 —impact on animal population—the percentage rating scale is shown in Table 3.
The sub-criterion X 4 , 4 denoting the impact of the investment on the landscape was determined with a percentage scale ranging from 0 to 100%. The assessment was made using the expert method while realizing that the assessment of this criterion was highly subjective. In this case, no formalized evaluation scale was used, due to the difficulties in creating universal methods of assessing very diverse technologies located in different areas of very different environmental and aesthetic value.
The sub-criteria X 4 , 5 and X 4 , 7 are expressed in kilometers, and both are destimulants. They express the average distance of typical locations in Poland from protected areas and human settlements, respectively.
The X 4 , 6 sub-criterion, describing the average occupied area by systems of assessed technologies in [km2/MW], is also a destimulant in the analysis.
Political and legal criteria X 5
The group of political and legal criteria includes six sub-criteria X 5 , 1 X 5 , 6 , for which it is proposed to adopt a rating scale in the form of classes (quantified) expressing the availability of given system support for a given technology and possibly the strength of this support and its diversity. All sub-criteria in this group are stimulants. Analyzing the national legal acts [58], an expert assessment of the intensity of support for individual technologies and the existing restrictions hampering their location and use was made. For the sub-criteria X 5 , 2 X 5 , 5 a binary score (0 or 1) was adopted, expressing only the availability of a specific support system for the analyzed technology.

2.3. RES Identification in Relation to Optimization Criteria

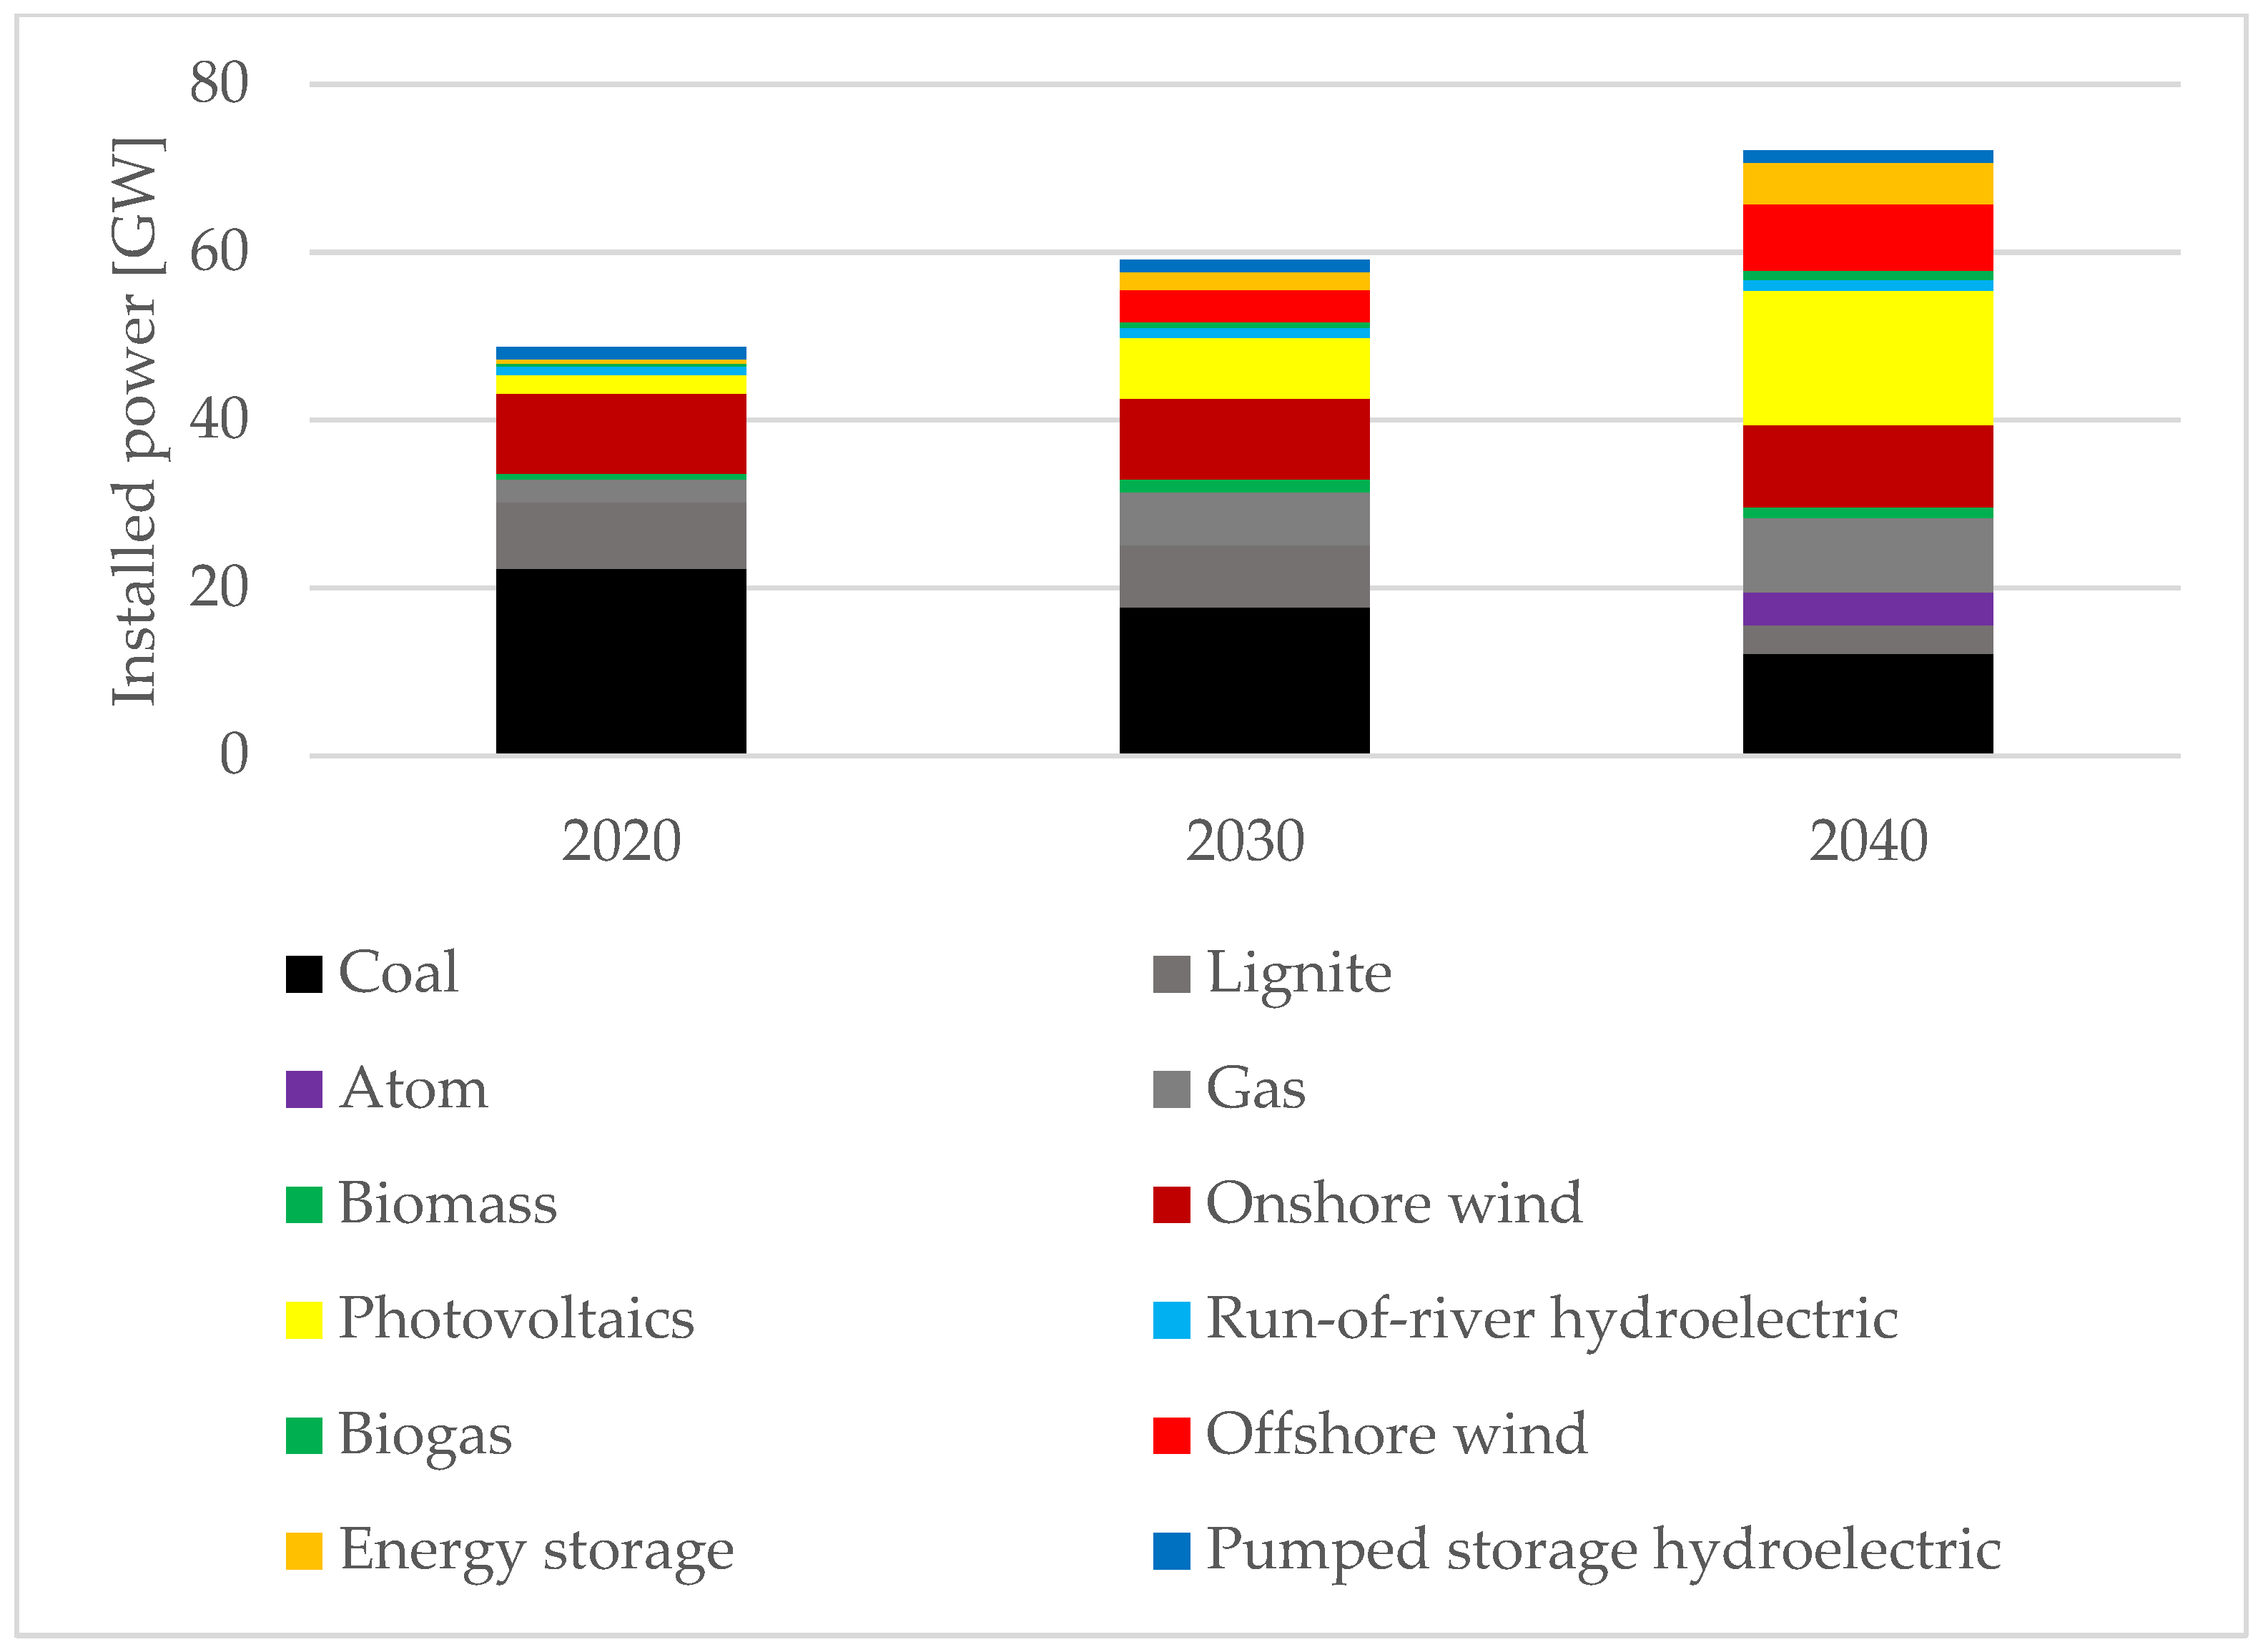
After determining the set of optimization criteria, the alternatives should be identified. This article describes technologies that can be developed in Poland in the context of energy policy until 2040 [
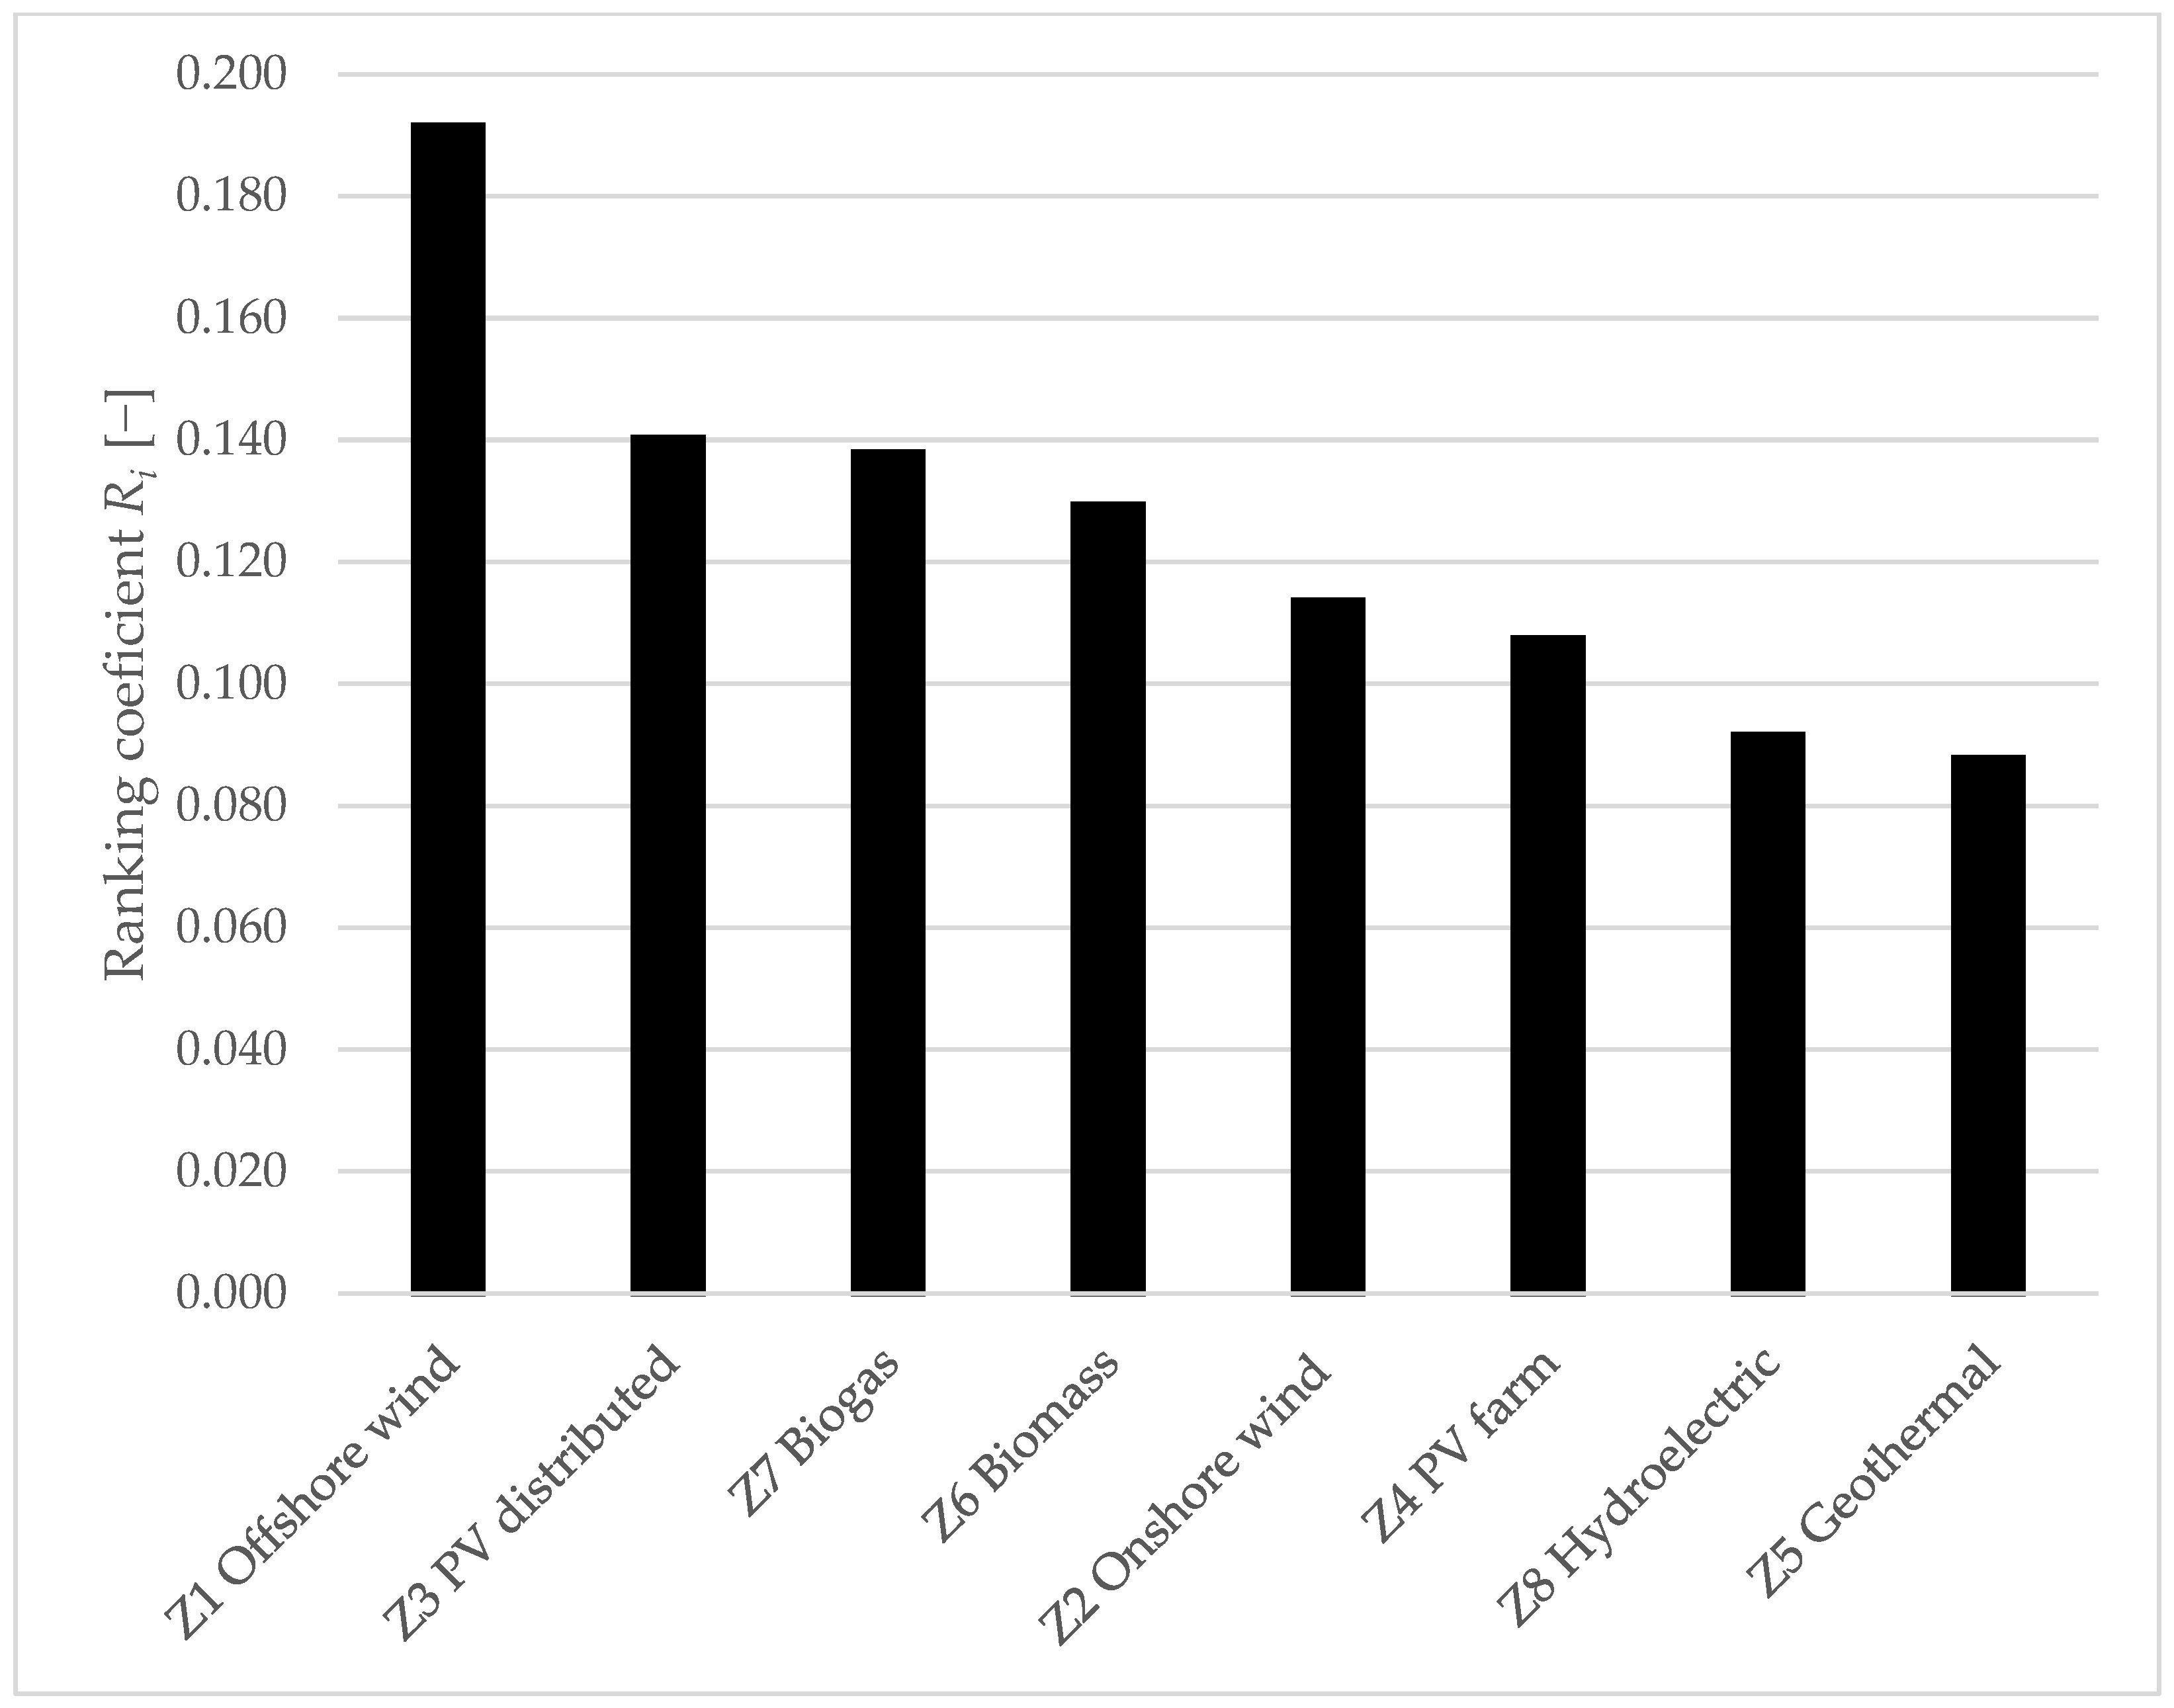
12]; the following technologies have been distinguished:
  • Z1—Offshore wind farms;
  • Z2—Onshore wind farms;
  • Z3—Distributed photovoltaic power plants;
  • Z4—Solar farms;
  • Z5—Geothermal power plants;
  • Z6—Biomass-fired power plants;
  • Z7—Biogas plants;
  • Z8—Hydroelectric power stations.
Each technology is described based on a set of optimization criteria described in Section 2.2. as shown in Table 4. The data sources of this study are based on authors’ calculations and an analysis of the literature [7,13,43,44,45,46,47,48,49,50,51,52,53,54,55,56,57,58].
In order to compare technologies, data representative for each analyzed case was selected. For the technical criteria, the data have been averaged and approximated, with the exception of the X19 criterion, i.e., the efficiency of the technology. For the X1.2 criterion, the number of hours was determined on the basis of the installed capacity utilization factor appropriate for each technology [59]. The values of the economic criteria were determined by economic analysis for each technology using the Free Cash Flow to Firm (FCFF) method for the analyzed period of 25 years of an installation operation. For the Z1 technology, investment outlays were averaged and determined based on the data included in [60]. Data adopted for the analysis for other sources: Z2—the unit outlays were based on [61]; Z3—capital expenditures for distributed photovoltaic power plants with a capacity of 5 kW amount to approx. PLN 31,000 (1305 EUR/kW) [62]; Z4—investment outlays are in the range of PLN 2.5–3.6 million/MW (530–760 EUR/kW) [59,63]. According to data from IRENA Renewable Cost Database [59], the cost of geothermal installations (Z5) is in the range of 2000–6000 EUR/kW. Due to the lack of technology in Poland, it was decided to assume a value higher than the average for the calculations. Capital expenditures on biomass-related technologies (Z6) were determined based on the data presented in [64]. A biogas power plant (Z7) in Poland requires investment outlays of PLN 12 million/MW (2500 EUR/kW) [59,65]. The range of investment outlays for hydropower plants (Z8) is 600–4500 EUR/kW and depends on the size of the installation. In Polish conditions, a value below the average was assumed, which is justified from the point of view of accessibility and the typical drop height of watercourses.
This paper separates the financial outlay for the construction of an electricity generation source and the construction of a connection from the source to the power system. Constructing a connection for generation sources located on land requires laying a power line and building a power supply point. Expenditures for the construction of power line connections from offshore wind farms range from 600–1200 EUR/kW [66]. Due to the poorly developed power system in the north of Poland, a value above the average was assumed for the analysis. Values in the range of 300–400 EUR/kW were assumed for RES sources located on land [67]. The exception is the Z3 technology due to its location, where access to the power system is ensured due to living conditions. For the economic criterion X25, which means the operating costs for the installation, Z1 and Z2 sources were determined on the basis of the data presented in [60,61], and for the remaining installations on the basis of the data contained in [62,64,66,67].

2.4. Determining the Weighting of the Criteria—AHP Method

The Analytical Hierarchy Process (AHP) method, which was developed by Saaty T. L. [68] in 1980, is one of the most frequently used methods of multi-criteria analysis. The method is used to solve problems in many areas, e.g., political science, sociology, and management for the evaluation of various types of projects, as well as in complex technical and economic issues. Despite its mathematical advancement and time-consuming, it is one of the fastest-growing and best-known methods in the world because it combines concepts from the fields of mathematics and psychology.

2.4.1. Matrix of Pairwise Comparisons (X)

Pairwise comparison of criteria allows the simultaneous ordering of them in terms of quality (concerning the order of superiority of one over the other criteria) and quantity (indicates by how much one criterion is more important than the other). To make a pairwise comparison of individual criteria, they were placed in a square matrix of pairwise comparisons X, of the type (n × n). The comparison is made by indicating the influence of the elements in the i-th row on the criterion from the j-th column, obtaining the result of the comparison x i , j , as it is shown below:
X = X 1 X 2 X n X 1 X 2 X n [ 1 x 1 , 2 x 1 , n 1 x 1 , 2 1 x 2 , n 1 x 1 , n 1 x 2 , n 1 ]
The pairwise comparison matrix was applied to the main and sub-criteria based on the judgments and preferences of the authors. In Table 5 the pairwise comparison for the main criteria is presented.

2.4.2. Normalization of the Pairwise Comparison Matrix X ¯

For the matrix X , the normalized inverse matrix X ¯ is determined according to Formula (2), and the normalization result is presented in Table 6.
x ¯ i , j = x i , j j = 1 n x i , j

2.4.3. Computing the Overall Weight Vector

The elements of the priority vector of individual main criteria due to the implementation of the main goal of the analysis w i are determined by dividing the sums of individual rows of the normalized inverse matrix X ¯ by the number of criteria n.
w i = i = 1 n x ¯ i , j n
The values of the priority vector elements w i indicate the position of the i-th main criterion in the ranking of criteria (Table 7).

2.4.4. Verification of the Pairwise Comparison Matrix Consistency

Since the specific value of the pairwise comparison x i , j is not explicitly quantified, the expert judgment may contain errors, for example, inconsistent judgments or logical errors.
It has been proved that when the largest eigenvalue of the matrix λ max is equal to or close to the number of compared criteria n, then the expert’s comparisons are compatible and consistent [68,69]. The largest eigenvalue of the matrix λ max is determined from the formula:
λ max = 1 w i j = 1 n x i , j w i
A slight inconsistency in the pairwise comparison causes slight changes in the highest eigenvalue of the matrix λ max and symbolizes the deviation from the consistency of the pairwise comparison expressed by the Consistency Index (CI), which is determined from the formula:
CI = λ max n n 1
The determined inconsistency ratio CI compared with the Random Index (RI) allows for the determination of the Consistency Ratio (CR), which defines the degree to which comparisons of the importance of criteria are inconsistent with each other. The RI values, estimated by T. L. Saaty, are presented in the study [70]. The CR coefficient is determined from the formula:
CR = CI RI
For pairwise comparison of main criteria, the determined coefficients are presented in Table 8.

2.5. Specification of the Reference and Anti-Reference Values for Specific Criteria

The next step is to determine the reference W i and anti-reference A i values for each sub-criterion. Determining the reference and anti-reference defining the sub-criteria starts the use of the Numerical taxonomy method in the presented analysis and ends the use of the AHP method. The article [37] presents a detailed method of determining the distance of the proposed variants from the reference values c i using the formula:
c i = d ( l i , W ) = | l i ,   W i | 2 + | A i ,   W i | 2 | l i ,   A i | 2 2 | A i ,   W i |
The reference and anti-reference can be determined in two ways:
  • determination of the reference value as the maximum function and the value as the minimum function of the criterion values for the compared RES technologies;
  • determination of the value of the reference and anti-reference using the expert method.

2.6. The RES Technology Ranking R i

For the set of RES technologies Z = { Z 1 , Z 2 , , Z k } , the technology value matrix should be determined for individual sub-criteria A:
A = X 1 , 1 X 1 , 2 X n , s [ a 1 , 1 , 1 a 1 , 1 , 2 a 1 , n , s a 2 , 1 , 1 a 2 , 1 , 2 a 2 , n , s a k , 1 , 1 a k , 1 , 2 a k , n , s ] Z 1 Z 2 Z k
Due to different values describing individual criteria (e.g., the value of the cost criterion is given in monetary units, and the social one is defined by a five-point scale), it is not possible to compare them without prior normalization.

2.6.1. A Conversion Sub-Criterion to Stimulants

The object ranking method, based on the NT method, requires all criteria to be stimulants. If the value of a given i-th sub-criterion X i , s , defined for each RES source as a k , n , s , is a destimulant, it should be converted into a simulant S i , s by transforming a k , n , s s k , n , s according to the formula:
s k , n , s = 2 a k , n , s ¯ a k , n , s
Thanks to such conversion, the criterion value retains the standard deviation and the arithmetic mean.

2.6.2. Determining the Measure of the Distance from the Reference Value

The ranking of RES technologies consists of ordering them according to the values of the distance measurement values m i , which are normalized values of the distance of their orthogonal projections c i from the reference value for a given RES technology W i . The values of the distance measure m i are in the range <0,1> and it is determined from the formula:
m i = 1 c i o
where: o = d ( W i , A i ) —Euclidean distance of the reference and anti-reference value.
The authors of this article propose to determine the sum of values of the distance measure for RES technologies from the reference and anti-reference values m i (additionally multiplied by the weight of criteria w i , s g ) and to reduce the value to relative units, which allows determining the ranking RES technologies according to the formula:
r j = i = 1 k m i · w i , s g
The sum of measures determined in this way, increased by the weights of detailed criteria (Formula (11)), determines the sum of all measures for individual RES technologies r k .
r k = j = 1 l r j

2.6.3. Ranking of RES Technologies

The ranking of the RES technology is determined by the values of the ranking coefficient R i , contained in the range [0, 1], the sum of which is 1, as shown in Table 9, by using the following formula:
R i = j = 1 l r j r k

3. Results

The best RES technology will be the one with the highest-ranking coefficient R i , and similarly, the worst technology with the lowest chances of realizing the investment will have the lowest value of the ranking coefficient.
The obtained ranking of prospective RES technologies clearly shows that the preferred technology with the greatest development opportunities in Poland is offshore wind farms, as shown in the chart in Figure 3.
The first place in the ranking is determined both by the significant existing potential of unused resources for offshore wind farms and the relatively favorable positioning of the technology in terms of other technical criteria. Relatively favorable legal conditions for this technology have been created in Poland, and in terms of legal criteria, the technology is highly ranked.
The following three technologies received a similar rating in the ranking. The highest among them is distributed photovoltaic energy, which was assessed favorably in terms of the existing potential, technical conditions of development, and a relatively high position in economic criteria. Next in this group is the technology of biogas plants, followed by the technology of direct use of biomass. As for the resources of raw materials for biogas production and the availability of biomass, the area of Poland is perceived as favorable. However, biomass finds many uses for heat production, and cogeneration is the preferred technology for electricity production.
The next group in the ranking consists of onshore wind and solar farms. In the land area, Poland has significant wind energy resources that have not been used yet, but the development of such sources is hampered by legal regulations, which are unfavorable for this technology. The assessment of legal conditions determined a relatively low position in the ranking of onshore wind farms. It is worth noting that a few years ago, under different legal conditions, this technology was developed very dynamically in Poland. In the case of large solar farms, with a relatively low position in the ranking, the technology was poorly assessed in some technical criteria (e.g., a relatively low rate of utilization of installed capacity).
The ranking closes with the lowest-rated technologies, and these are hydropower and geothermal energy, respectively. The last position of geothermal energy was determined by very small geothermal energy resources with favorable parameters for direct electricity production (low and medium-temperature resources dominate) and a relatively low evaluation of the technology in economic criteria. The penultimate technology in the ranking is hydroelectric. Their low rating is related to the relatively poor resources of unused hydrotechnical energy in Poland, difficult legal conditions for their development, and the significant impact of the facilities on the environment.
To validate the results obtained ranking of RES technologies was compared with planned directions of RES development included in the PEP2040 document [12] and other studies analyzing the ranking of RES technologies in the energy mix. For example, [71] quantified the main potential economic effects of offshore wind on the Spanish economy, showing the capital intensity of this sector and the need to establish long-term policies to foster the sector. In [72], it was confirmed that Poland’s power/energy mix in the next two decades would change and that for the next 20 years, the government is planning to build a second alternative non-emissive system with power comparable to the conventional power installed today, by building new RES sources, especially offshore wind farms.
Moreover, in the European Union, offshore wind farms will play an essential role in the decarbonization energy sector by 2050 [73]. That is why the Commission published a dedicated EU strategy on offshore renewable energy, which proposes concrete ways forward to support the long-term sustainable development of this sector [74]. The targets included in the strategy assume the achievement of the installed capacity of at least 60 GW of offshore wind by 2030, and Poland can participate in it due to meeting the conditions such as access to sea space in the Baltic Sea and willingness to international cooperation.

4. Sensitivity Analysis

It is worth noting that the validation of multi-criteria optimization methods usually involves the use of sensitivity analyses or the comparison of the results obtained from alternative single-criteria optimization methods with an extensive criterion function and many constraints. The second of the described approaches most often leads to the indication of significant differences in the optimization result resulting from the use of many criteria. Such a validation analysis was presented in the previous chapter, trying to indicate significant differences between the ranking obtained by the authors and the ranking indicated by PEP2040 [12].
The nature of the decision environment in a real-life situation is dynamic, which is why the sensitivity analysis is applied to verify the practicality and efficacy of the result of the proposed approach. In addition to comparing the obtained results with the planned directions of RES development in Poland and other studies available in the literature, the sensitivity analysis was further conducted.
The method proposed in the article was validated in [37] and used to rank the proposed set of four wind farm locations in terms of chances for investment implementation in the shortest possible time. The application of the method discussed in this article differs significantly from the one presented in [37] by means of the set of partial criteria extension and adaptation to the problem. Therefore, it was decided to perform a sensitivity analysis of the result to changes in the input database.
In the relevant literature, different approaches for sensitivity analysis of the AHP method can be found. In [75,76], authors applied equal weights for all criteria; in [77], one or more criteria equal to zero were set, and in [78], the criteria weights were altered by a defined interval. These approaches aimed to demonstrate that the results obtained are sensitive to changes in the weights of the criteria, and such results were obtained. As the application of all variants of sensitivity analysis of AHP would be beyond the scope of this paper, in this study, the sensitivity analysis performed takes into account the impact of changes in input data values on the obtained ranking of RES technologies by testing different databases in the long term. To this end, the following cases were examined: Cases 1–3 are characterized by varying input data, whereas Cases 4–6 involve the sensitivity analysis of criteria weights. For Cases 1–3, the following alterations of input data were proposed:
  • Case 1—due to the dynamic development of distributed energy sources, the expansion of the power grid is required, which results in a change of the sub-criterion X 1 , 8 by + 2 classes;
  • Case 2—due to the current geopolitical situation and constantly increasing prices of construction materials, including steel, the economic criterion X 2 , 1 is increased by 15%;
  • Case 3—due to the potential political changes, sub-criterion X 5 , 1 , reflecting the support for technology, changes by +/− 2 classes, and Case 3A means 2 classes higher, while Case 3B—2 classes lower.
For Cases 4–6, the following assumptions regarding weights values were adopted:
  • Case 4—all criteria weights are equal;
  • Case 5—social criterion weight is equal to zero;
  • Case 6—economic criterion weight is equal to zero.
In all cases the relative pair-wise comparisons of the criteria remain the same, while the values of dependent sub-criteria are correspondingly recalculated. The results of the sensitivity analysis for Cases 1–3 and Cases 4–6 are illustrated, respectively, in Figure 4 and Figure 5.
The sensitivity analysis carried out shows that the applied method responds significantly to both changes in the weights of the main criteria and changes in the database concerning the detailed criteria. The changes concern the assessment measures of the compared technologies and the technology ranking itself. The obtained results are in line with the authors’ expectations. It is worth paying attention to Case 6, in which the exclusion of economic criteria significantly changes the assessment of technologies and their ranking.

5. Discussion

In the first half of 2021, the long-awaited government document was adopted in Poland—“Energy policy of Poland until 2040” (PEP2040). Compared to the previous versions of Poland’s energy policy, the new document indicates the need for significant changes in the energy mix in the country and, in particular, provides for significant development of renewable energy sources. The preferred renewable technologies were also indicated, which by 2040 will partially replace the production of electricity from non-renewable sources. The ranking indicated in the energy policy can be compared with the ranking obtained by the authors of this article. The current share of renewable sources in the production of electricity is approx. 13% (also including the co-firing of biomass in conventional power plants). The target set to be achieved in 2030 is very ambitious, and the share of renewable energy sources in electricity production should be at least 32%, and in 2040 about 40%.
Offshore wind energy is indicated as a preferential renewable technology in PEP2040 (which is consistent with the result obtained by the authors). The development of wind energy is indicated as a “strategic project”, and the installed capacity of these sources should increase significantly by 2040.
Another technology indicated in PEP2040 is photovoltaics with significant development potential, without distinguishing between distributed photovoltaic technologies and large farm-type sources. In the ranking presented in this article, both technologies have been separated and indicate significantly different positions. While distributed photovoltaic energy came in second place and has significant development opportunities, the conditions for large photovoltaic sources are not so favorable, and in the presented ranking, they were in fourth place. To achieve the goal indicated in PEP2040, it may be necessary to introduce new preferences for this technology because while the strength of support for distributed photovoltaic sources already causes their dynamic development, solar farms are developing poorly.
Onshore wind energy is listed next in the ranking indicated in PEP2040, but it has been clearly shown that the development of this technology will not be dynamic, and the introduced legal regulations limit it. Despite listing this technology as the third one, its perspectives outlined in PEP2040 are limited, and its development potential is perceived as weak. In the ranking prepared by the authors of this publication, onshore wind farms ranked third. In PEP2040, this technology is underestimated, and after minor changes in the applicable legal regulations, its potential is significant. The authors’ assessment of onshore wind energy in terms of development opportunities in Poland differs significantly from the assessment presented in PEP2040.
Similarly to the research presented in this paper, PEP2040 indicates the use of biomass and biogas in cogeneration systems as another prospective technology for electricity production. In PEP2040, technologies are considered together. In the prepared ranking, the use of biogas has better development prospects. However, both technologies were close in ranking.
In PEP2040, hydropower and its development opportunities are presented quite favorably, both in large flow facilities—power plants on the Lower Vistula River and in small hydrotechnical facilities. In the ranking prepared by the authors, the prospects for the development of this technology are not viewed favorably (they are in the penultimate position in the ranking). This significant difference is mainly because the authors of PEP2040, who assess the potential impact of these projects on the natural environment considerably more positively, do not see development barriers and do not analyze the low economic profitability of the projects.
Geothermal energy was not included in PEP2040 among the potential methods of electricity production. This is in line with the opinion of the article’s authors—geothermal energy came last in the ranking.

6. Conclusions

In this paper, the ranking of eight RES technologies (offshore and onshore wind farms, distributed photovoltaic power plants, solar farms, geothermal power plants, biomass-fired power plants, biogas plants, and hydroelectric power stations) has been designated throughout the application by MCDM techniques. The analysis was performed with the identification of five main criteria, such as technical, environmental, legal, social, and economical, and with 30 sub-criteria. Criteria weights were determined using the Analytical Hierarchy Process method, and the renewable energy sources technology ranking was made using the modified Numerical taxonomy method. Offshore wind farms were selected to be the highest-ranked. The following three technologies— distributed photovoltaic energy, biogas plants, and biomass power plants—received a similar rating in the ranking. The ranking ends with the following lowest-rated technologies: hydropower and geothermal energy.
The authors’ ranking, resulting from a multi-criteria analysis, is significantly different in several aspects from that indicated in PEP2040. The authors of this article assess the development prospects of onshore wind energy much better and are much more skeptical about the development of hydropower. Achieving the goals set out in PEP2040 will be difficult and, according to the authors of the article, to achieve them, it may be necessary to enable the development of onshore wind energy (currently inhibited by restrictive legal provisions), to make the development of hydropower plants more realistic (especially taking into account their impact on the environment) and to develop support mechanisms for large photovoltaic projects.

Author Contributions

Conceptualization, M.J., A.L. and P.B.; methodology, A.L. and M.J.; software, A.L.; validation, M.J. and P.B.; formal analysis, A.L. and M.J.; investigation, A.L. and P.B.; resources, P.B. and M.J.; data curation, A.L. and M.J.; writing—original draft preparation, M.J., A.L. and P.B.; visualization, M.J. and A.L. All authors have read and agreed to the published version of the manuscript.

Funding

This research received no external funding.

Institutional Review Board Statement

Not applicable.

Informed Consent Statement

Not applicable.

Data Availability Statement

Not applicable.

Conflicts of Interest

The authors declare no conflict of interest.

References

  1. Annual Reports on the Operation of the National Power System in Poland for 2021. Available online: www.pse.pl (accessed on 20 October 2022).
  2. Burnham, A.; Han, J.; Clark, C.E.; Wang, M.; Dunn, J.B.; Palou-Rivera, I. Life-cycle greenhouse gas emissions of shale gas, natural gas, coal, and petroleum. Environ. Sci. Technol. 2012, 46, 619–627. [Google Scholar] [CrossRef] [PubMed]
  3. Mills, S.J. Prospects for Coal, CCTs and CCS in the European Union; IEA Clean Coal Centre, IEA: London, UK, 2010. [Google Scholar]
  4. 2030 Climate & Energy Framework. Available online: https://ec.europa.eu/clima/policies/strategies/2030_en (accessed on 30 June 2021).
  5. Śleszyński, P.; Nowak, M.; Brelik, A.; Mickiewicz, B.; Oleszczyk, N. Planning and Settlement Conditions for the Development of Renewable Energy Sources in Poland: Conclusions for Local and Regional Policy. Energies 2021, 14, 1935. [Google Scholar] [CrossRef]
  6. Wołowiec, T.; Myroshnychenko, I.; Vakulenko, I.; Bogacki, S.; Wiśniewska, A.M.; Kolosok, S.; Yunger, V. International Impact of COVID-19 on Energy Economics and Environmental Pollution: A Scoping Review. Energies 2022, 15, 8407. [Google Scholar] [CrossRef]
  7. Ministerstwo Rozwoju i Technologii Small Hydropower Plants in the Spatial Planning System in Poland. Inż. Ekolog. 2013, 33, 7–12. (In Polish) [CrossRef] [Green Version]
  8. Al-breiki, M.; Bicer, Y. Potential Solutions for the Short to Medium-Term Natural Gas Shortage Issues of Europe: What Can Qatar Do? Energies 2022, 15, 8306. [Google Scholar] [CrossRef]
  9. Dzikuć, M.; Piwowar, A. Ecological and economic aspects of electric energy production using the biomass co-firing method: The case of Poland. Renew. Sustain. Energy Rev. 2016, 55, 856–862. [Google Scholar] [CrossRef]
  10. Cutz, L.; Berndes, G.; Johnsson, F. A techno-economic assessment of biomass co-firing in Czech Republic, France, Germany and Poland. Biofuels Bioprod. Biorefining 2019, 13, 1289–1305. [Google Scholar] [CrossRef]
  11. Serowaniec, M. Sustainable Development Policy and Renewable Energy in Poland. Energies 2021, 14, 2244. [Google Scholar] [CrossRef]
  12. The Ministry of Cimate and Environment. Energy Policy of Poland until 2040—(PEP2040). 2021, pp. 1–102. Available online: https://www.iea.org/policies/12882-energy-policy-of-poland-until-2040-pep2040 (accessed on 15 October 2022).
  13. Bailey, H.; Brookes, K.L.; Thompson, P.M. Assessing environmental impacts of offshore wind farms: Lessons learned and recommendations for the future. Aquat. Biosyst. 2014, 10, 8. [Google Scholar] [CrossRef] [PubMed] [Green Version]
  14. Cardoso, C.A.; Torriti, J.; Lorincz, M. Making demand side response happen: A review of barriers in commercial and public organisations. Energy Res. Soc. Sci. 2020, 64, 101443. [Google Scholar] [CrossRef]
  15. Shafiee, M. Wind Energy Development Site Selection Using an Integrated Fuzzy ANP-TOPSIS Decision Model. Energies 2022, 15, 4289. [Google Scholar] [CrossRef]
  16. Siksnelyte-Butkiene, I.; Zavadskas, E.K.; Dalia, S.; Streimikiene, D. the Assessment of Renewable Energy Technologies in a Household: A Review. Energies 2020, 13, 1164. [Google Scholar] [CrossRef] [Green Version]
  17. Shao, M.; Zhang, S.; Sun, J.; Han, Z.; Shao, Z.; Yi, C. GIS-MCDM-Based Approach to Site Selection of Wave Power Plants for Islands in China. Energies 2022, 15, 4118. [Google Scholar] [CrossRef]
  18. Siksnelyte, I.; Zavadskas, E.K.; Streimikiene, D.; Sharma, D. An overview of multi-criteria decision-making methods in dealing with sustainable energy development issues. Energies 2018, 11, 2754. [Google Scholar] [CrossRef] [Green Version]
  19. Zhang, S.; Zhao, T.; Xie, B.C. What is the optimal power generation mix of China? An empirical analysis using portfolio theory. Appl. Energy 2018, 229, 522–536. [Google Scholar] [CrossRef]
  20. Raugei, M.; Leccisi, E.; Azzopardi, B.; Jones, C.; Gilbert, P.; Zhang, L.; Zhou, Y.; Mander, S.; Mancarella, P. A multi-disciplinary analysis of UK grid mix scenarios with large-scale PV deployment. Energy Policy 2018, 114, 51–62. [Google Scholar] [CrossRef]
  21. Haiges, R.; Wang, Y.D.; Ghoshray, A.; Roskilly, A.P. Optimization of Malaysia’s power generation mix to meet the electricity demand by 2050. Energy Procedia 2017, 142, 2844–2851. [Google Scholar] [CrossRef]
  22. Li, N.; Zhang, H.; Zhang, X.; Ma, X.; Guo, S. How to select the optimal electrochemical energy storage planning program? A hybrid MCDM method. Energies 2020, 13, 931. [Google Scholar] [CrossRef] [Green Version]
  23. Ioannou, A.; Fuzuli, G.; Brennan, F.; Yudha, S.W.; Angus, A. Multi-stage stochastic optimization framework for power generation system planning integrating hybrid uncertainty modelling. Energy Econ. 2019, 80, 760–776. [Google Scholar] [CrossRef]
  24. Atabaki, M.S.; Aryanpur, V. Multi-objective optimization for sustainable development of the power sector: An economic, environmental, and social analysis of Iran. Energy 2018, 161, 493–507. [Google Scholar] [CrossRef]
  25. Al-Shammari, S.; Ko, W.; Al Ammar, E.A.; Alotaibi, M.A.; Choi, H.-J. Optimal Decision-Making in Photovoltaic System Selection in Saudi Arabia. Energies 2021, 14, 357. [Google Scholar] [CrossRef]
  26. Yazdani-Chamzini, A.; Fouladgar, M.M.; Zavadskas, E.K.; Moini, S.H.H. Selecting the optimal renewable energy using multi criteria decision making. J. Bus. Econ. Manag. 2013, 14, 957–978. [Google Scholar] [CrossRef]
  27. Trojanowska, M.; Nęcka, K. Selection of the Multiple-Criiater Decision-Making Method for Evaluation of Sustainable Energy Development: A Case Study of Poland. Energies 2020, 13, 6321. [Google Scholar] [CrossRef]
  28. Wang, C.-N.; Chen, Y.-T.; Tung, C.-C. Evaluation of Wave Energy Location by Using an Integrated MCDM Approach. Energies 2021, 14, 1840. [Google Scholar] [CrossRef]
  29. Chien, F.; Wang, C.N.; Nguyen, V.T.; Nguyen, V.T.; Chau, K.Y. An evaluation model of quantitative and qualitative fuzzy multi-criteria decision-making approach for hydroelectric plant location selection. Energies 2020, 13, 2783. [Google Scholar] [CrossRef]
  30. Szurek, M.; Blachowski, J.; Nowacka, A. GIS-Based method for wind farm location multi-criteria analysis. Min. Sci. 2014, 21, 65–81. [Google Scholar] [CrossRef]
  31. Moradi, S.; Yousefi, H.; Noorollahi, Y.; Rosso, D. Multi-criteria decision support system for wind farm site selection and sensitivity analysis: Case study of Alborz Province, Iran. Energy Strateg. Rev. 2020, 29, 100478. [Google Scholar] [CrossRef]
  32. Bohra, S.S.; Anvari-Moghaddam, A.; Mohammadi-Ivatloo, B. AHP-Assisted Multi-Criteria Decision-Making Model for Planning of Microgrids. IECON Proc. Ind. Electron. Conf. 2019, 2019, 4557–4562. [Google Scholar] [CrossRef]
  33. Beccali, M.; Cellura, M.; Mistretta, M. Decision-making in energy planning. Application of the Electre method at regional level for the diffusion of renewable energy technology. Renew. Energy 2003, 28, 2063–2087. [Google Scholar] [CrossRef]
  34. Li, Y.; Zhao, D.; Llu, Y. Optimal Design and Sensitive Analysis of Distributed Generation System with Renewable Energy Sources. In Proceedings of the 2014 China International Conference on Electricity Distribution (CICED), Shenzhen, China, 23–26 September 2014; pp. 23–26. [Google Scholar]
  35. Pilavachi, P.A.; Stephanidis, S.D.; Pappas, V.A.; Afgan, N.H. Multi-criteria evaluation of hydrogen and natural gas fuelled power plant technologies. Appl. Therm. Eng. 2009, 29, 2228–2234. [Google Scholar] [CrossRef]
  36. Viana, H.; Cohen, W.B.; Lopes, D.; Aranha, J. Assessment of forest biomass for use as energy. GIS-based analysis of geographical availability and locations of wood-fired power plants in Portugal. Appl. Energy 2010, 87, 2551–2560. [Google Scholar] [CrossRef]
  37. Stoltmann, A. Hybrid multi-criteria method of analyzing the location of distributed renewable energy sources. Energies 2020, 13, 4109. [Google Scholar] [CrossRef]
  38. Stoltmann, A. Application of AHP method for comparing the criteria used in locating wind farms. Acta Energetica 2016, 3, 144–149. [Google Scholar] [CrossRef]
  39. Spyridonidou, S.; Sismani, G.; Loukogeorgaki, E.; Vagiona, D.G.; Ulanovsky, H.; Madar, D. Sustainable spatial energy planning of large-scale wind and pv farms in israel: A collaborative and participatory planning approach. Energies 2021, 14, 551. [Google Scholar] [CrossRef]
  40. Ali, S.; Jang, C.M. Selection of best-suited wind turbines for new wind farm sites using techno-economic and GIS analysis in South Korea. Energies 2019, 12, 3140. [Google Scholar] [CrossRef] [Green Version]
  41. Udo de Haes, H.A.; Heijungs, R. Life-cycle assessment for energy analysis and management. Appl. Energy 2007, 84, 817–827. [Google Scholar] [CrossRef]
  42. Terrados, J.; Almonacid, G.; Pérez-Higueras, P. Proposal for a combined methodology for renewable energy planning. Application to a Spanish region. Renew. Sustain. Energy Rev. 2009, 13, 2022–2030. [Google Scholar] [CrossRef]
  43. Saleem, L.; Ulfat, I. A Multi Criteria Approach to Rank Renewable Energy Technologies for Domestic Sector Electricity Demand of Pakistan. Mehran Univ. Res. J. Eng. Technol. 2019, 38, 443–452. [Google Scholar] [CrossRef] [Green Version]
  44. Väisänen, S.; Mikkilä, M.; Havukainen, J.; Sokka, L.; Luoranen, M.; Horttanainen, M. Using a multi-method approach for decision-making about a sustainable local distributed energy system: A case study from Finland. J. Clean. Prod. 2016, 137, 1330–1338. [Google Scholar] [CrossRef]
  45. Diemuodeke, E.O.; Addo, A.; Oko, Y.; Mulugetta, Y.; Ojapah, M.M. Optimal mapping of hybrid renewable energy systems for locations using multi-criteria decision-making algorithm. Renew. Energy 2019, 134, 461–477. [Google Scholar] [CrossRef]
  46. Mielczarski, W. Renewable energy sources as an element of the new green deal. Energ. Odnawialna 2021, 84–87. (In Polish) [Google Scholar] [CrossRef]
  47. Kosewska, K.; Kamiński, J.R. Analiza ekonomiczna budowy i eksploatacji biogazowni rolniczych w Polsce. Inżynieria Rol. 2008, 1, 189–194. [Google Scholar]
  48. Rubio-Domingo, G.; Linares, P. The future investment costs of offshore wind: An estimation based on auction results. Renew. Sustain. Energy Rev. 2021, 148, 111324. [Google Scholar] [CrossRef]
  49. Dicorato, M.; Forte, G.; Pisani, M.; Trovato, M. Guidelines for assessment of investment cost for offshore wind generation. Renew. Energy 2011, 36, 2043–2051. [Google Scholar] [CrossRef]
  50. Jastrzębski, P. Financial and environmental comparison of a wind farm and photovoltaic systems for supplying an industrial zone. Zesz. Nauk. Wyższej Szk. Ekon. Inform. Krakowie 2021, 17, 94–105. (In Polish) [Google Scholar]
  51. Shamoushaki, M.; Fiaschi, D.; Manfrida, G.; Talluri, L. Energy, exergy, economic and environmental (4E) analyses of a geothermal power plant with NCGs reinjection. Energy 2022, 244, 122678. [Google Scholar] [CrossRef]
  52. Capital Expenditures on Biogas Plants (CAPEX). Available online: Akademiabiogazu.pl/product/naklady-inwestycyjne-capexbiogazownia-rolniczachp-1-mwwersja-business/ (accessed on 30 June 2022). (In Polish).
  53. Czekała, W.; Tarkowski, F.; Pochwatka, P. Social aspects of energy production from renewable sources. Probl. Ekorozw. 2021, 16, 61–66. [Google Scholar] [CrossRef]
  54. Strazzera, E.; Mura, M.; Contu, D. Combining choice experiments with psychometric scales to assess the social acceptability of wind energy projects: A latent class approach. Energy Policy 2012, 48, 334–347. [Google Scholar] [CrossRef]
  55. Capros, P.; Mantzos, L.; Vouyoukas, L.; Petrellis, D. European Energy and CO2 Emissions Trends to 2020: PRIMES model v. 2. Bull. Sci. Technol. Soc. 1999, 19, 474–492. [Google Scholar] [CrossRef]
  56. Sayed, E.T.; Wilberforce, T.; Elsaid, K. A critical review on environmental impacts of renewable energy systems and mitigation strategies: Wind, hydro, biomass and geothermal. Sci. Total Environ. 2021, 766, 144505. [Google Scholar] [CrossRef]
  57. Aydin, N.Y.; Kentel, E.; Duzgun, S. GIS-based environmental assessment of wind energy systems for spatial planning: A case study from Western Turkey. Renew. Sustain. Energy Rev. 2010, 14, 364–373. [Google Scholar] [CrossRef]
  58. Sejm Rzeczypospolitej Polskiej, Ustawa z dnia 10 kwietnia 1997 roku Prawo Energetyczne (The Act of 10 April 1997 The Energy Law) na podstawie: Dziennik Ustaw z 2022 r. poz. 1385, 1723, 2127, 2243, 2370. Available online: https://isap.sejm.gov.pl/isap.nsf/download.xsp/WDU19970540348/U/D19970348Lj.pdf (accessed on 12 October 2022). (In Polish)
  59. IRENA Renewable Power Generation Costs in 2021. 2022. Available online: https://www.irena.org/publications/2022/Jul/Renewable-Power-Generation-Costs-in-2021#:~:text=The%20global%20weighted%20average%20levelised,%25%20to%20USD%200.075%2FkWh (accessed on 20 October 2022).
  60. Kost, C.; Shammugam, S.; Fluri, V.; Peper, D.; Memar, A.D.; Schlegl, T. Stromgestehungskosten Erneuerbare Energien; Fraunhofer ISE: Freiburg, Germany, 2021. [Google Scholar]
  61. Pesta, R. Budowa farmy wiatrowej w aktualnych realiach. Czysta Energ. 2009, 2, 32–33. [Google Scholar]
  62. Price List of Photovoltaic Sets with Energy Storage (Batteries). Available online: https://www.kolektory.com/instalacje-fotowoltaiczne-z-magazynem-energii-ceny.html (accessed on 20 October 2022).
  63. Ebinger, A. Rentowność i ryzyko inwestycji budowy instalacji fotowoltaicznej. Finans. Control. 2021, 7. [Google Scholar]
  64. Epsec Raport z Szacowania Potrzeb Finansowych i Luki Finansowej. 2022. Available online: https://www.ewaluacja.gov.pl/strony/badania-i-analizy/wyniki-badan-ewaluacyjnych/badania-ewaluacyjne/raport-z-szacowania-potrzeb-finansowych-oraz-luki-finansowej-w-ramach-badania-pt-opracowanie-metodologii-szacowania-potrzeb-finansowych-oraz-luki-finansowej-w-obszar/ (accessed on 19 October 2022).
  65. Biogaz Inwest Przykłady Obliczeniowe Biogaz Inwest. 2019. Available online: https://ieo.pl/dokumenty/biogazinwest/przyklady_obliczeniowe.pdf (accessed on 19 October 2022).
  66. BVG Associates a Guide to an Offshore Wind Farm Updated and Extended; The Crown Estate and the Offshore Renewable Energy Catapult: London, UK, 2019; Available online: https://www.thecrownestate.co.uk/media/2861/guide-to-offshore-wind-farm-2019.pdf (accessed on 20 October 2022).
  67. Szczerbowski, R. Generacja rozproszona oraz sieci Smart Grid—Wirtualne elektrownie. Polityka Energ. 2011, 14, 391–404. [Google Scholar]
  68. Saaty, T.L. How to make a decision: The Analytic Hierarchy Process. Eur. J. Oper. Res. 1990, 48, 9–26. [Google Scholar] [CrossRef]
  69. Plazibat, N.; Babic, Z. Ranking of enterprises based on multicriterial analysis. Int. J. Prod. Econ. 1998, 56, 29–35. [Google Scholar]
  70. Saaty, T.L.; Shang, J.S. An innovative orders-of-magnitude approach to AHP-based mutli-criteria decision making: Prioritizing divergent intangible humane acts. Eur. J. Oper. Res. 2011, 214, 703–715. [Google Scholar] [CrossRef]
  71. Varela-Vázquez, P.; del Carmen Sánchez-Carreira, M. Estimation of the potential effects of offshore wind on the Spanish economy. Renew. Energy 2017, 111, 815–824. [Google Scholar] [CrossRef]
  72. Kiciński, J.; Chaja, P. Which Energy Mix for Poland and for Other Countries of the World Based on Coal Energy? In Climate Change, Human Impact and Green Energy Transformation; GeoPlanet: Earth and Planetary Sciences; Springer: Berlin/Heidelberg, Germany, 2021. [Google Scholar]
  73. Pronińska, K.; Księżopolski, K. Baltic offshore wind energy development—poland’s public policy tools analysis and the geostrategic implications. Energies 2021, 14, 4883. [Google Scholar] [CrossRef]
  74. European Commission. Communication from the Commission to the European Parliament, the Council, the European Economic and Social Committee and the Committee of the Regions: An EU Strategy to Harness the Potential of Offshore Renewable Energy for a Climate Neutral Future; COM(2020) 741 Final; European Commission: Brussels, Belgium, 2020; Volume 27. [Google Scholar]
  75. Höfer, T.; Sunak, Y.; Siddique, H.; Madlener, R. Wind farm siting using a spatial Analytic Hierarchy Process approach: A case study of the Städteregion Aachen. Appl. Energy 2016, 163, 222–243. [Google Scholar] [CrossRef]
  76. Baban, S.M.J.; Parry, T. Developing and applying a GIS-assisted approach to locating wind farms in the UK. Renew. Energy 2001, 24, 59–71. [Google Scholar] [CrossRef]
  77. Tegou, L.-I.; Polatidis, H.; Haralambopoulos, D.A. Environmental management framework for wind farm siting: Methodology and case study. J. Environ. Manag. 2010, 91, 2134–2147. [Google Scholar] [CrossRef] [PubMed]
  78. Gorsevski, P.V.; Cathcart, S.C.; Mirzaei, G.; Jamali, M.M.; Ye, X.; Gomezdelcampo, E. A group-based spatial decision support system for wind farm site selection in Northwest Ohio. Energy Policy 2013, 55, 374–385. [Google Scholar] [CrossRef]
Figure 1. The structure of the planned installed capacity in Poland according to PEP2040 [12].
Energies 15 09629 g001
Figure 2. The flowchart of the proposed methodology.
Energies 15 09629 g002
Figure 3. The values of the ranking coefficient presented in an ordered chart.
Energies 15 09629 g003
Figure 4. The impact of the input data alterations on the ranking coefficient, Cases 1–3 versus original case.
Energies 15 09629 g004
Figure 5. The impact of the criteria weights on the ranking coefficient, Cases 4–5 versus original case.
Energies 15 09629 g005
Table 1. A set of criteria used to evaluate RES technology.
SymbolSpecification of Criteria
X 1 Technical criteria
X 1 , 1 availability of primary raw materials
X 1 , 2 time of installed capacity utilization
X 1 , 3 installed capacity range
X 1 , 4 the location of the source in relation to the power grid
X 1 , 5 power grid voltage level at the source connection point
X 1 , 6 impact on the voltage level in the power grid
X 1 , 7 predictability of energy production
X 1 , 8 the need to expand the power grid
X 1 , 9 energy efficiency
X 2 Economic criteria
X 2 , 1 unit investment expenditures
X 2 , 2 unit outlays for connection to the power grid
X 2 , 3 payback period (SPBT)
X 2 , 4 internal rate of return (IRR)
X 2 , 5 the cost of maintenance and operation
X 3 Social criteria
X 3 , 1 public support for investment
X 3 , 2 favor of local authorities for investment
X 3 , 3 investment compliance with local policies
X 4 Environmental criteria
X 4 , 1 carbon avoidance rate
X 4 , 2 noise emission
X 4 , 3 impact on animal population
X 4 , 4 the impact on the landscape
X 4 , 5 the average distance from nature protected areas
X 4 , 6 land surface indicator
X 4 , 7 the average distance from human settlements
X 5 Political and legal criteria
X 5 , 1 support of technology in the energy policy—investment facilitation
X 5 , 2 possibility of using the discount system
X 5 , 3 covering the technology with periodic tenders for the supply of energy
X 5 , 4 possibility of using the fixed energy price (FIT)
X 5 , 5 covering the technology with the system of certificates of origin
X 5 , 6 availability of investment subsidy systems
Table 2. Numerical evaluation scale of the sub-criterion X 3 , 3 —investment compliance with local policies.
NameScale
Incompatible1
Partially compatible2
No contraindications/possible to take into account 3
Mostly compatible4
Compatible5
Table 3. Percentage rating scale of the sub-criterion X 4 , 3 —impact on animal population.
NameScale
The animal population makes it impossible to build an energy source100%
Significant impact, but not preventing construction (need to be compensated)60%
During environmental monitoring30%
No effect on animal populations0%
Table 4. The assumptions for the comparative analysis of RES technologies.
Symbol of Main and SubcriteriaUnit/NameSymbol of the RES Technology
X 1 Z1Z2Z3Z4Z5Z6Z7Z8
X 1 , 1 class54441231
X 1 , 2 h/a3100190011009005500500045005800
X 1 , 3 class32221211
X 1 , 4 km150100.551020810
X 1 , 5 class32122322
X 1 , 6 class32322333
X 1 , 7 class21434543
X 1 , 8 class53324322
X 1 , 9 %0.40.40.150.180.20.70.390.85
X 2
X 2 , 1 €/kW300010001302650.5500096025201100
X 2 , 2 €/kW100030080300400350300300
X 2 , 3 Years2086330202015
X 2 , 4 %21.521.2−31.11.50.5
X 2 , 5 €/kW/a78.7039.3365.1019.5025.00355.56369.44311.22
X 3
X 3 , 1 52544235
X 3 , 2 51533442
X 3 , 3 42543343
X 4
X 4 , 1 Mg CO2/a820055764000126.280.7381204195.98797.45
X 4 , 2 dB035000354035
X 4 , 3 %3040002030050
X 4 , 4 %3080407050404040
X 4 , 5 km302150502020202
X 4 , 6 km2/MW0.30.150.0050.030.150.30.20.15
X 4 , 7 km100503310520
X 5
X 5 , 1 class62551331
X 5 , 2 class00111010
X 5 , 3 class11010111
X 5 , 4 class00000010
X 5 , 5 class01010111
X 5 , 6 class11321211
Table 5. The pairwise comparison for main criteria X i .
X1X2X3X4X5
X11.001.003.001.001.00
X21.001.002.000.330.33
X30.330.501.000.500.50
X41.003.002.001.002.00
X51.003.002.000.501.00
Table 6. The normalized pairwise comparison matrix.
X1X2X3X4X5
X10.230.120.300.300.21
X20.230.120.200.100.07
X30.080.060.100.150.10
X40.230.350.200.300.41
X50.230.350.200.150.21
Table 7. The overall weight vector w i .
Criterion Symbol Weight   Vector   w i
X10.23
X20.14
X30.10
X40.30
X50.23
Table 8. The verification coefficients of the correctness of pairwise comparison of main criteria.
Name
λ max 5.30
CI0.08
RI1.12
CR0.07
Table 9. Calculated values of distance measure and ranking coefficient values.
Presents the Values of a Measure Distance from the Reference Value Multiplied by the Global Weights ( m i · w i , s g ) r i R i Place in the Ranking
X 1 , 1 X 1 , 2 X 3 , 2 X 4 , 1 X 5 , 1
Z 1 0.0780.017 0.0620.122 0.1030.7180.1921
Z 2 0.0590.010 0.0000.083 0.0340.4260.1145
Z 3 0.0590.006 0.0620.060 0.0860.5260.1402
Z 4 0.0590.005 0.0310.002 0.0860.4030.1076
Z 5 0.0000.030 0.0310.000 0.0170.3290.0888
Z 6 0.0390.027 0.0460.018 0.0510.4850.1294
Z 7 0.0390.025 0.0460.003 0.0510.5170.1383
Z 8 0.0000.032 0.0150.012 0.0170.3440.0927
Publisher’s Note: MDPI stays neutral with regard to jurisdictional claims in published maps and institutional affiliations.

